
Optimal Cut-Off Value for Locus Coeruleus-to-Pons Intensity Ratio as Clinical Biomarker for Alzheimer’s Disease: A Pilot Study
Abstract
Background:
Studies using neuromelanin-sensitive-MRI have established the locus coeruleus (LC)-to-pons intensity ratio as a biomarker for diagnosis of Parkinson’s and Alzheimer’s diseases. More detailed analysis is needed for exploiting the highest clinical potential of this technique.
Objective:
The aim is to determine the location of the highest LC-to-pons ratio within the LC and develop an easy-to-use tool for clinical application.
Methods:
Ten patients diagnosed with various stages of Alzheimer’s disease (74.1±3.9 years, range 68–80, 7 females) and ten healthy elderly subjects (72.4±3.1 years, range 68–77, 5 females) participated in the study. Five subsequent slices with a thickness of 2.5 millimeters were analyzed using the image analysis tool FSL, starting with the first slice below inferior colliculus. The outcome variable was the intensity ratio between maximum values of LC and adjacent pontine region.
Results:
The section located 10 millimeters below the inferior colliculus has the highest potential in differentiating between healthy controls and patients, with the intensity-ratio difference between groups of 12.3% and effect size of 1.577. For the cut-off value of 1.09, the sensitivity and specificity values were 100% and 80%, respectively.
Conclusion:
We consider the method a promising clinical tool to aid AD diagnosis workup.
INTRODUCTION
The locus coeruleus (LC, lat. “blue spot”), first named by Joseph and Karl Wenzel at the beginning of the 19th century, is a small, blue/black colored nucleus located in the pontine tegmentum, along the lateral wall of the fourth ventricle; its neurons are particularly dense in the dorsal pons at the level of the trochlear nucleus. The LC contains the largest collection of norepinephrine producing neurons in the mammalian brain (about 15,000 per side) and sends widespread projections throughout the central nervous system. The neurons in the rostral two-thirds project into the neocortex, limbic system, and hypothalamus, for the purpose of modulating attention, arousal, and circadian rhythms; in contrast, the remaining caudal third, also called locus subcoeruleus, mainly projects into the cerebellum and spinal cord, and regulates respiratory, cardiovascular, and/or gastrointestinal activities [1–5].
Alzheimer’s disease (AD) leads to severe cognitive and behavioral impairments that compromise independent daily activities [6]. Atypical development or degeneration of the LC has been implicated in the etiology of a variety of disorders involving cognitive dysfunction, including AD [2, 5, 7–9]. In fact, it has been proposed that the prodromal phase of AD begins in the LC and not in the temporal cortical regions, as previously believed [8, 10]. Therefore, a biomarker of the LC structural integrity would aid in the characterization of the etiology of LC neurodegeneration in these and other disorders, and could guide targeted pharmacotherapies for individuals with LC dysfunction [3, 6].
Human LC neurons contain a melanin pigment known as neuromelanin, which is a byproduct of the monoamine synthesis that gives the LC its blue/black appearance and makes its neurons clearly distinguishable from nearby non-pigmented neurons [1, 2, 4, 11]. A major loss of LC neurons occurs in patients suffering from AD [7]. Recently, a neuromelanin-sensitive MRI imaging technique that can enhance the T1-related contrast between neuromelanin and brain tissue has been developed and histologically validated [3, 12]. This technique has also been shown to have excellent test–retest reproducibility; that is, neuromelanin-sensitive MRI can consistently delineate neuromelanin-containing neurons within the LC [13].
Several previous studies have attempted to establish sensitivity and specificity values of methods analyzing neuromelanin-sensitive MRI scans in patients suffering from AD and Parkinson’s disease [14, 15] as well as to correlate the results with different clinical manifestations [16]. The sensitivity and specificity values obtained thereby were moderate to high, but it remains unknown whether a more detailed measurement approach could have achieved a higher rate of both true-positives and true-negatives. Currently there are also no studies that attempted to determine a clinically relevant threshold value with a sensitivity of 100% (the value below which all the values of patients will be located) for patients at various stages of AD. In one previous study [12], in which in vivo mapping of LC neurons was done, it was shown that differential distributions and counts of LC neurons across multiple slices in rostral-caudal direction exist; this implies that measurements within each slice over the length of at least 10–15 millimeters in this direction would need to be performed in order to establish such a threshold. Having this in mind, our literature search indicated that none of the studies performed so far seems to have applied a sufficiently detailed slice-wise and side-wise determination of LC-to-pons intensity ratios. Thus, for the present study we asked whether using a novel detailed approach of determining the LC-to-pons intensity ratio could lead to higher sensitivity and specificity values, as well as to a cut-off value that could be clinically helpful in differentiating patients at various stages of AD from healthy elderly people. The main aim of this study was, hence, to develop a novel, clinically relevant method which provides an optimal cut-off, sensitivity and specificity values, that could aid in differentiating between AD patients and healthy elderlies, using a neuromelanin-sensitive MRI technique.
METHODS
Design and ethical approval
We performed measurements at one time-point, the study was thus organized as cross-sectional. Ethical approval was obtained from the ethics committee of the Otto von Guericke University - Medical Faculty, Magdeburg, Germany.
Participants
Patients aged between 65 and 80 years were recruited between June 2012 and December 2013 from the memory clinic at the Department of Neurology of the Otto von Guericke University Clinic, Magdeburg, Germany. The diagnosis of AD had been established by experienced neurologists of the memory clinic according to the NINCDS-ADRDA criteria [17]. Based on findings of Takahashi and colleagues [14] that no significant difference in intensity ratio could be detected between mild cognitive impairment (MCI) and AD subjects, with both groups significantly differing from healthy controls, we had decided not to differentiate between early and later stages of AD but categorized all patients together into one group instead. Their Mini-Mental State Examination (MMSE) scores ranged from 10 to 26. All participants of the healthy control group had an MMSE score of 27 or higher. In total 24 subjects were tested of which, 4 were excluded (from the control group) so the remaining control participants could be age-matched with the participants of the patient group; there was no significant difference in age between the control (n = 10, 72.4±3.1 years (range 68–77), 5 females) and patient (n = 10, 74.1±3.9 years (range 68–80), 7 females) groups (p = 0.302).
MRI sequence
MRI measurements were performed on a Siemens MAGNETOM Verio 3T scanner equipped with a 32-channel phased-array brain coil. The head was immobilized using a Tempur Original Pillow Junior (Tempur World, Inc.) to guarantee an optimal balance between tight fixation and patient comfort. To visualize the LC, high-resolution T1-weighted Turbo-Spin-Echo (TSE) images were acquired using the following parameters: 0.5×0.5 mm2 in-plane resolution, FOV 192 mm×19 2 mm, 384×384 matrix, 2.5 mm slice thickness, 0.5 mm inter slice gap, 10 ms echo time, 634 ms repetition time, turbo factor 3, 221 Hz/pixel bandwidth, 8 averages, and 10 min, 50 s scan duration. 14 axial slices were oriented perpendicular to the floor of the 4th ventricle.
Image processing
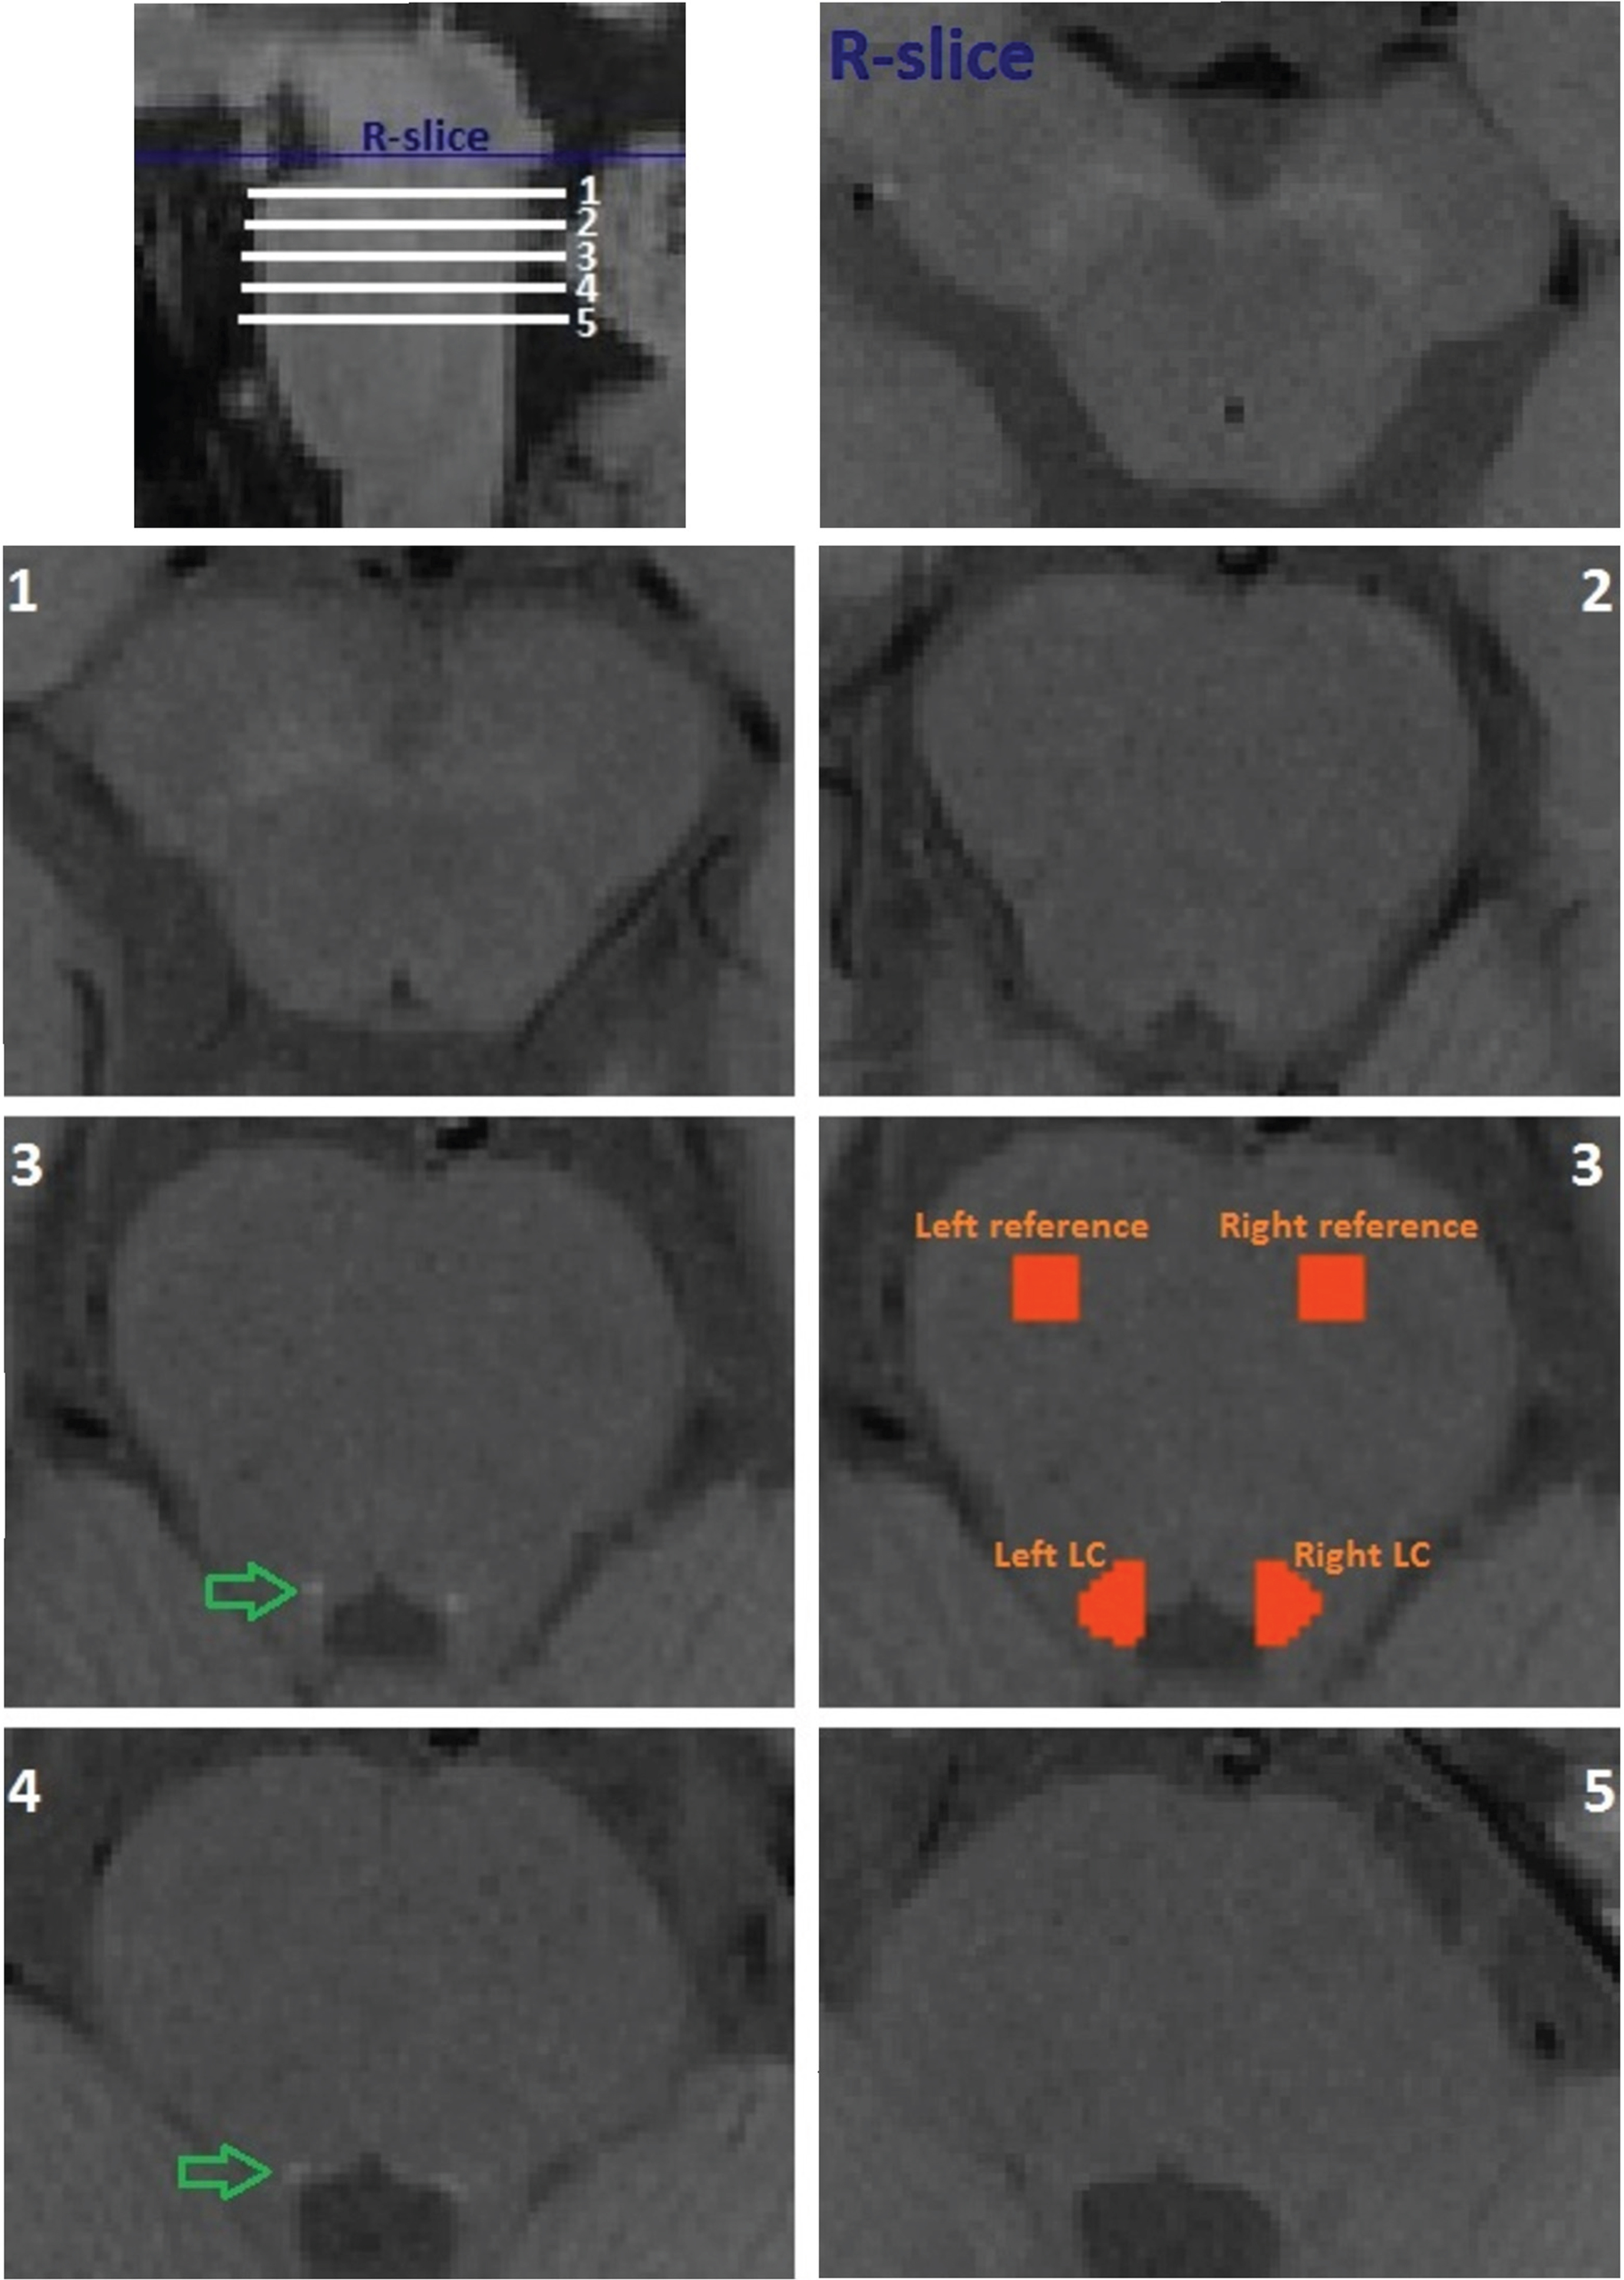
Before image analysis all scans were sinc-interpolated with a rectangular window of 11 voxels to the in-plane resolution of 0.25 mm using FSL flirt [18]. For quantitative evaluation of the high-resolution TSE T1-weighted image, signal intensities were measured using the FSL software library (https://fsl.fmrib.ox.ac.uk/fsl/fslwiki; Oxford, UK). In fslview, masks were created in five subsequent tomographic slices (each 2.5 mm thick) starting with the first slice below the reference slice (R-slice) at the level of the substantia nigra - pars compacta (SNpc) and the inferior colliculus (this level is often recognized by its characteristic “mickey mouse” appearance in transversal plane) (Fig. 1); the slices were selected based on previously done LC mapping and reconstruction [1, 12]. Within each of the slices, four masks were manually created: 1) left LC, 2) right LC, 3) left pontine reference region, and 4) right pontine reference region (Fig. 1). Using functions fslmaths and fslstats, the maximum intensity values were extracted from each of the masks created. Finally, ratios were determined within each slice by dividing the maximum value of the left LC with its respective left pontine reference region and for the right LC with the respective right pontine reference region. In this way we obtained two intensity ratios for each slice, one for each side; given that we measured five subsequent slices, we acquired a total of ten values for the intensity ratios per subject.
Fig. 1
Example of locations of measured slices in rostral-caudal direction (upper left corner) and of the reference slice (R-slice) and the five slices (1 through 5) measured in one healthy control participant. Green arrows point to areas of signal increase. Orange zones depict masked areas used to extract signal intensities from corresponding locus coerulei (LC) and reference zones.
Statistical analysis
The difference in values between groups is shown in absolute values and/or percentage. Average values are shown as mean±standard deviation. For determining the significant difference between groups, an independent t-test was performed when the data were normally distributed and a Mann-Whitney-U test when not. In addition, effect size was calculated as Cohen’s d, with 0.2–0.5 indicating small, 0.5–0.8 indicating medium and >0.8 indicating large effect size [19]. The α-level was set to 0.05.
RESULTS
All intensity ratios obtained are presented in Table 1. The largest differences in ratios between control and patient groups were observed for the slices at 7.5 and 10 millimeters below the reference slice, where the substantia nigra - pars compacta can be clearly seen (Fig. 1). Absolute values of LC intensity were on average also the highest in these two slices. Figure 1 also shows all five slices that were measured in one control participant; on slices 3 and 4 the putative LC can be best visualized (green arrows). For these reasons, only these two slices were considered for further analysis, under abbreviations C1 and P1 (first or 7.5 mm slice of control and patient groups, respectively) and C2 and P2 (second or 10 mm slice of control and patient groups, respectively). Example of masks used to measure intensities in the left and right LC and respective reference regions are demonstrated in Fig. 1 - for the third slice.
Table 1
Intensity ratios for 5 subsequent slices for each side in both patient and control groups; bolded – the highest values
| Side | Slice | Distance | Controls | Patients | Average |
| below R-slice | average | average | difference/ | ||
| (mm) | intensity ratio | intensity ratio | % difference | ||
| Left | 1 | 2.5 | 1,008 | 0,988 | 0,020 / 2.0% |
| 2 | 5 | 1,034 | 1,028 | 0,006 / 0.6% | |
| 3 | 7.5 | 1,096 | 1,035 | 0,061 / 6.1% | |
| 4 | 10 | 1,130 | 1,007 | 0,123 / 12.3% | |
| 5 | 12.5 | 1,028 | 0,999 | 0,029 / 2.9% | |
| Right | 1 | 2.5 | 1,042 | 1,046 | –0,004 / 0.4% |
| 2 | 5 | 1,071 | 1,082 | –0,011 / 1.1% | |
| 3 | 7.5 | 1,153 | 1,087 | 0,066 / 6.6% | |
| 4 | 10 | 1,162 | 1,100 | 0,062 / 6.2% | |
| 5 | 12.5 | 1,103 | 1,052 | 0,051 / 5.1% |
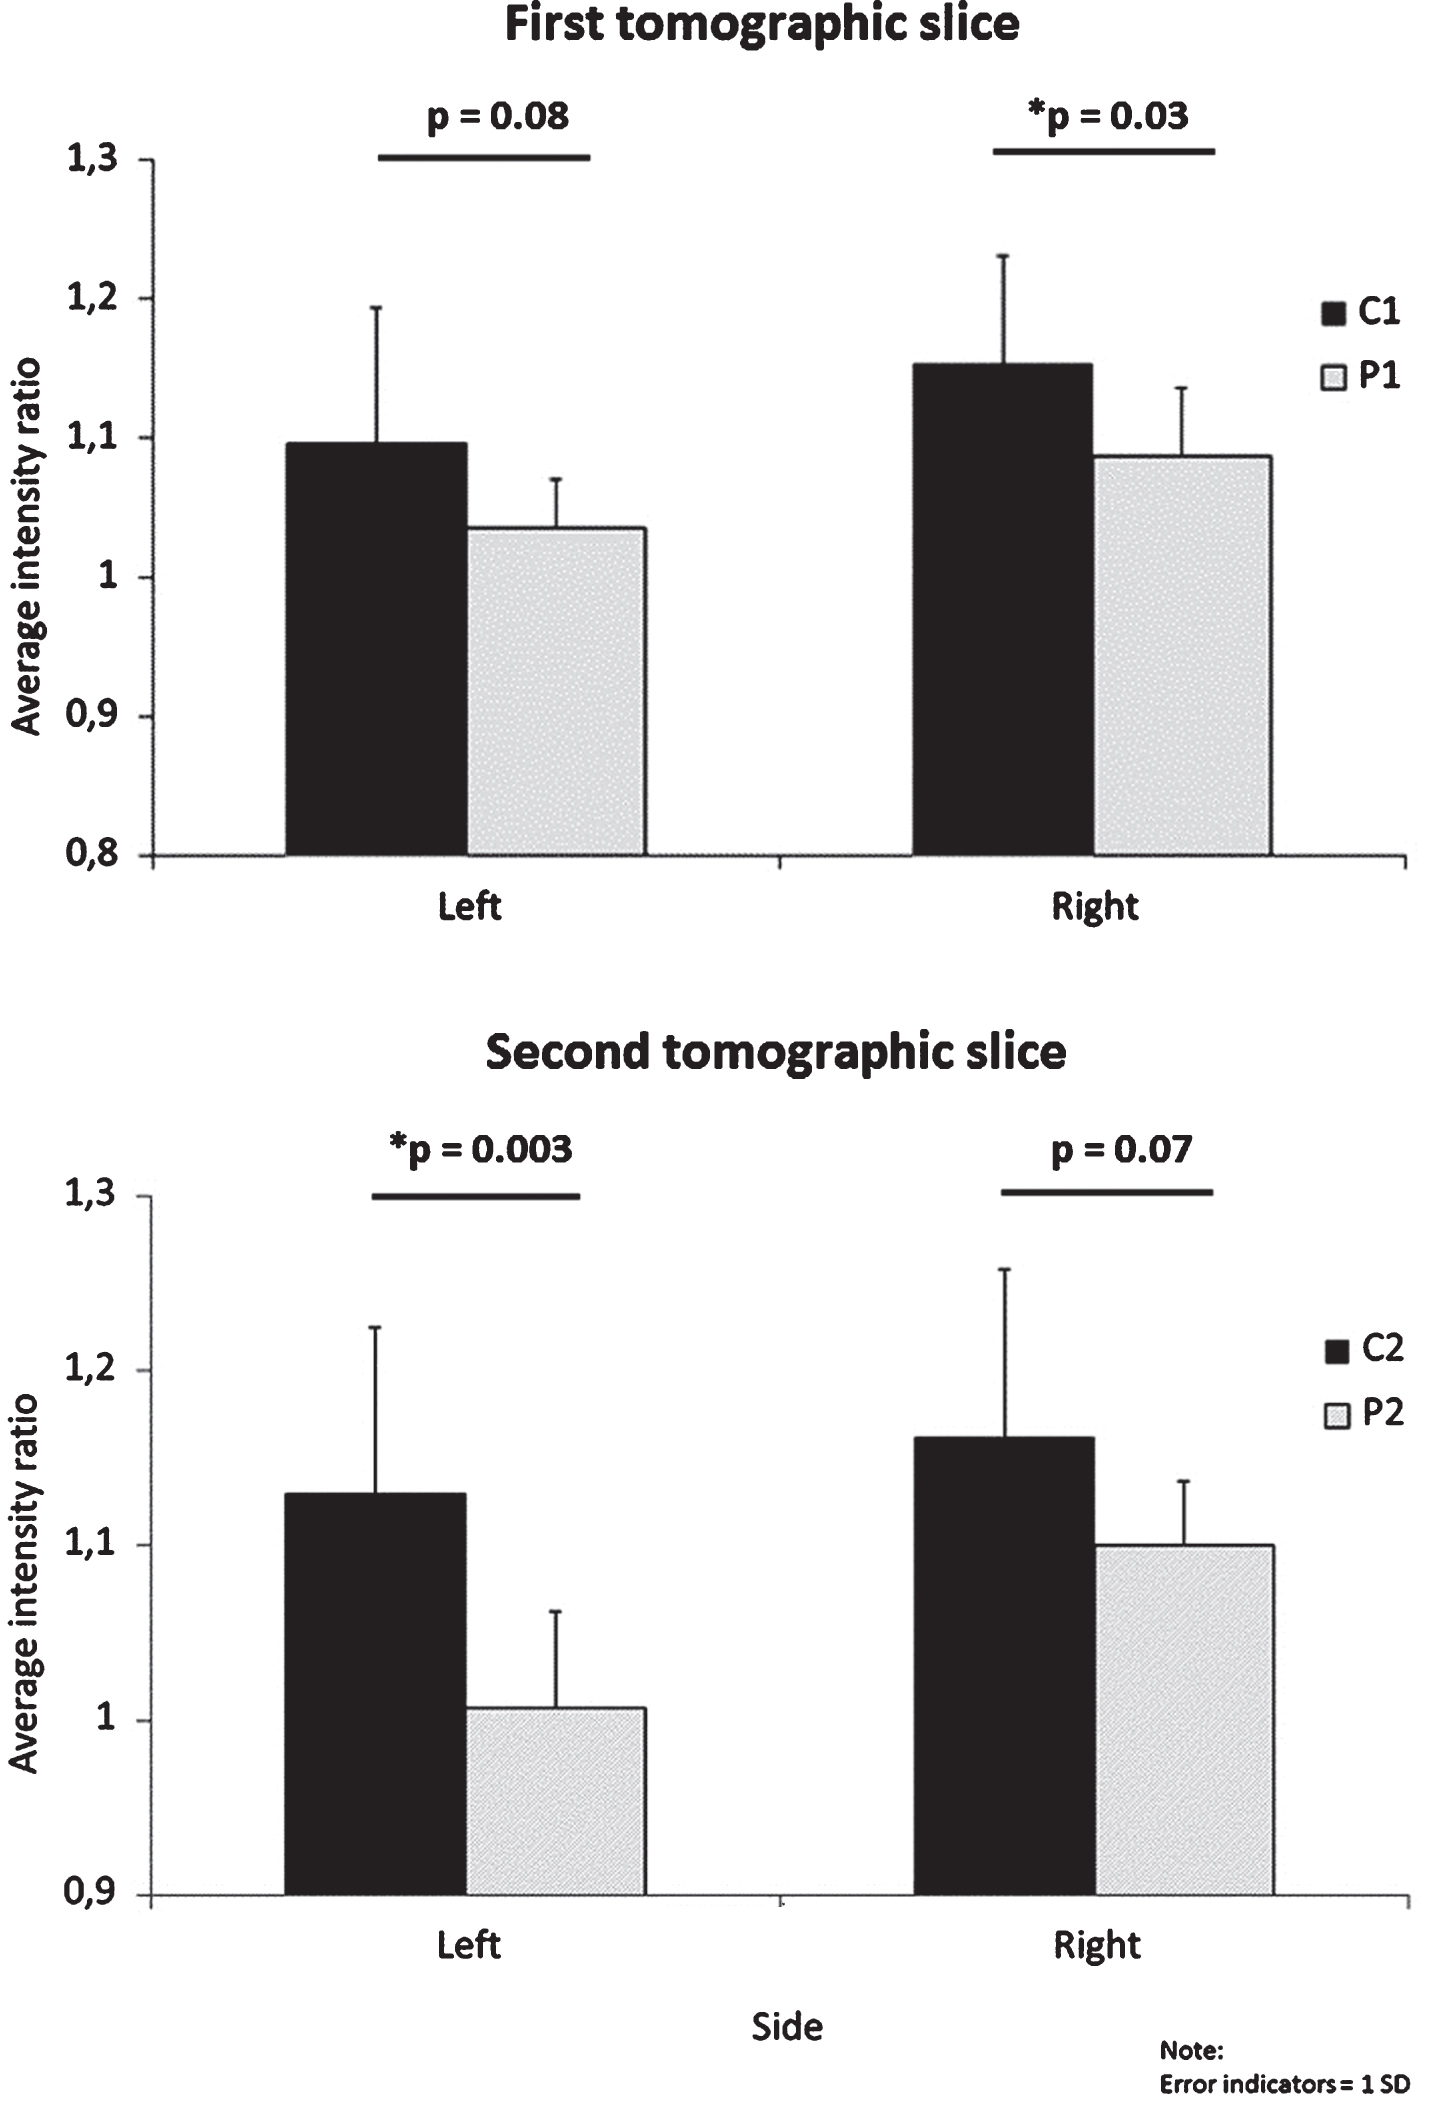
Observed differences in intensity ratios between the two groups were significant or near to significant, with large to very large effect sizes (Table 2, Fig. 2). The largest difference (on average 12.3%) and effect size (d = 1.577) we noticed was within the second analyzed slice (C2 versus P2) for the left LC.
Table 2
Difference in intensity ratios between patients and controls on each side for the two slices; *p < 0.05. C, controls; P, patients; 1, first tomographic slice; 2, second tomographic slice
| Side | Comparison | Average | Difference confidence | Effect | p-value |
| difference | interval to 95% | size (d) | |||
| Left | C1 versus P1 | 6.1% | –0.8% to 13% | 0.831 | 0.080 |
| C2 versus P2 | 12.3% | 5% to 19.6% | 1.577 | 0.003* | |
| Right | C1 versus P1 | 6.6% | 0.5% to 12.7% | 1.023 | 0.034* |
| C2 versus P2 | 6.2% | –0.6% to 13% | 0.856 | 0.072 |
Fig.2
Difference in intensity ratios between patients and controls for each side on the two slices. C, controls; P, patients; 1, first tomographic slice; 2, second tomographic slice.
For the purpose of establishing a cut-off value, or the value below which all of the patients’ intensity ratios will be located, we plotted intensity ratios for each participant in our study, for both sides (Fig. 3). The cut-off value was then established by selecting the highest of all patients’ intensity ratio values. As displayed, for the left side the established value was 1.09, whereas for the right side it was 1.17. For the left side, 11 of 20 (55%) of all intensity ratios of healthy controls were above the respective threshold, with 8/10 (80%) from the second slice (C2) and 3/10 (30%) from the first slice (C1). On the right side the ratios of the two groups were less divergent, with only 7 of 20 (35%) healthy controls’ intensity ratios being over the respective threshold, of which 3/10 (30%) came from the first and 4/10 (40%) from the second slice. From these data, it appears that the left side has a higher potential in differentiating between healthy controls and patients.
Fig.3
Intensity ratios for each participant and each slice; C, controls; P, patients; 1, first tomographic slice; 2, second tomographic slice.
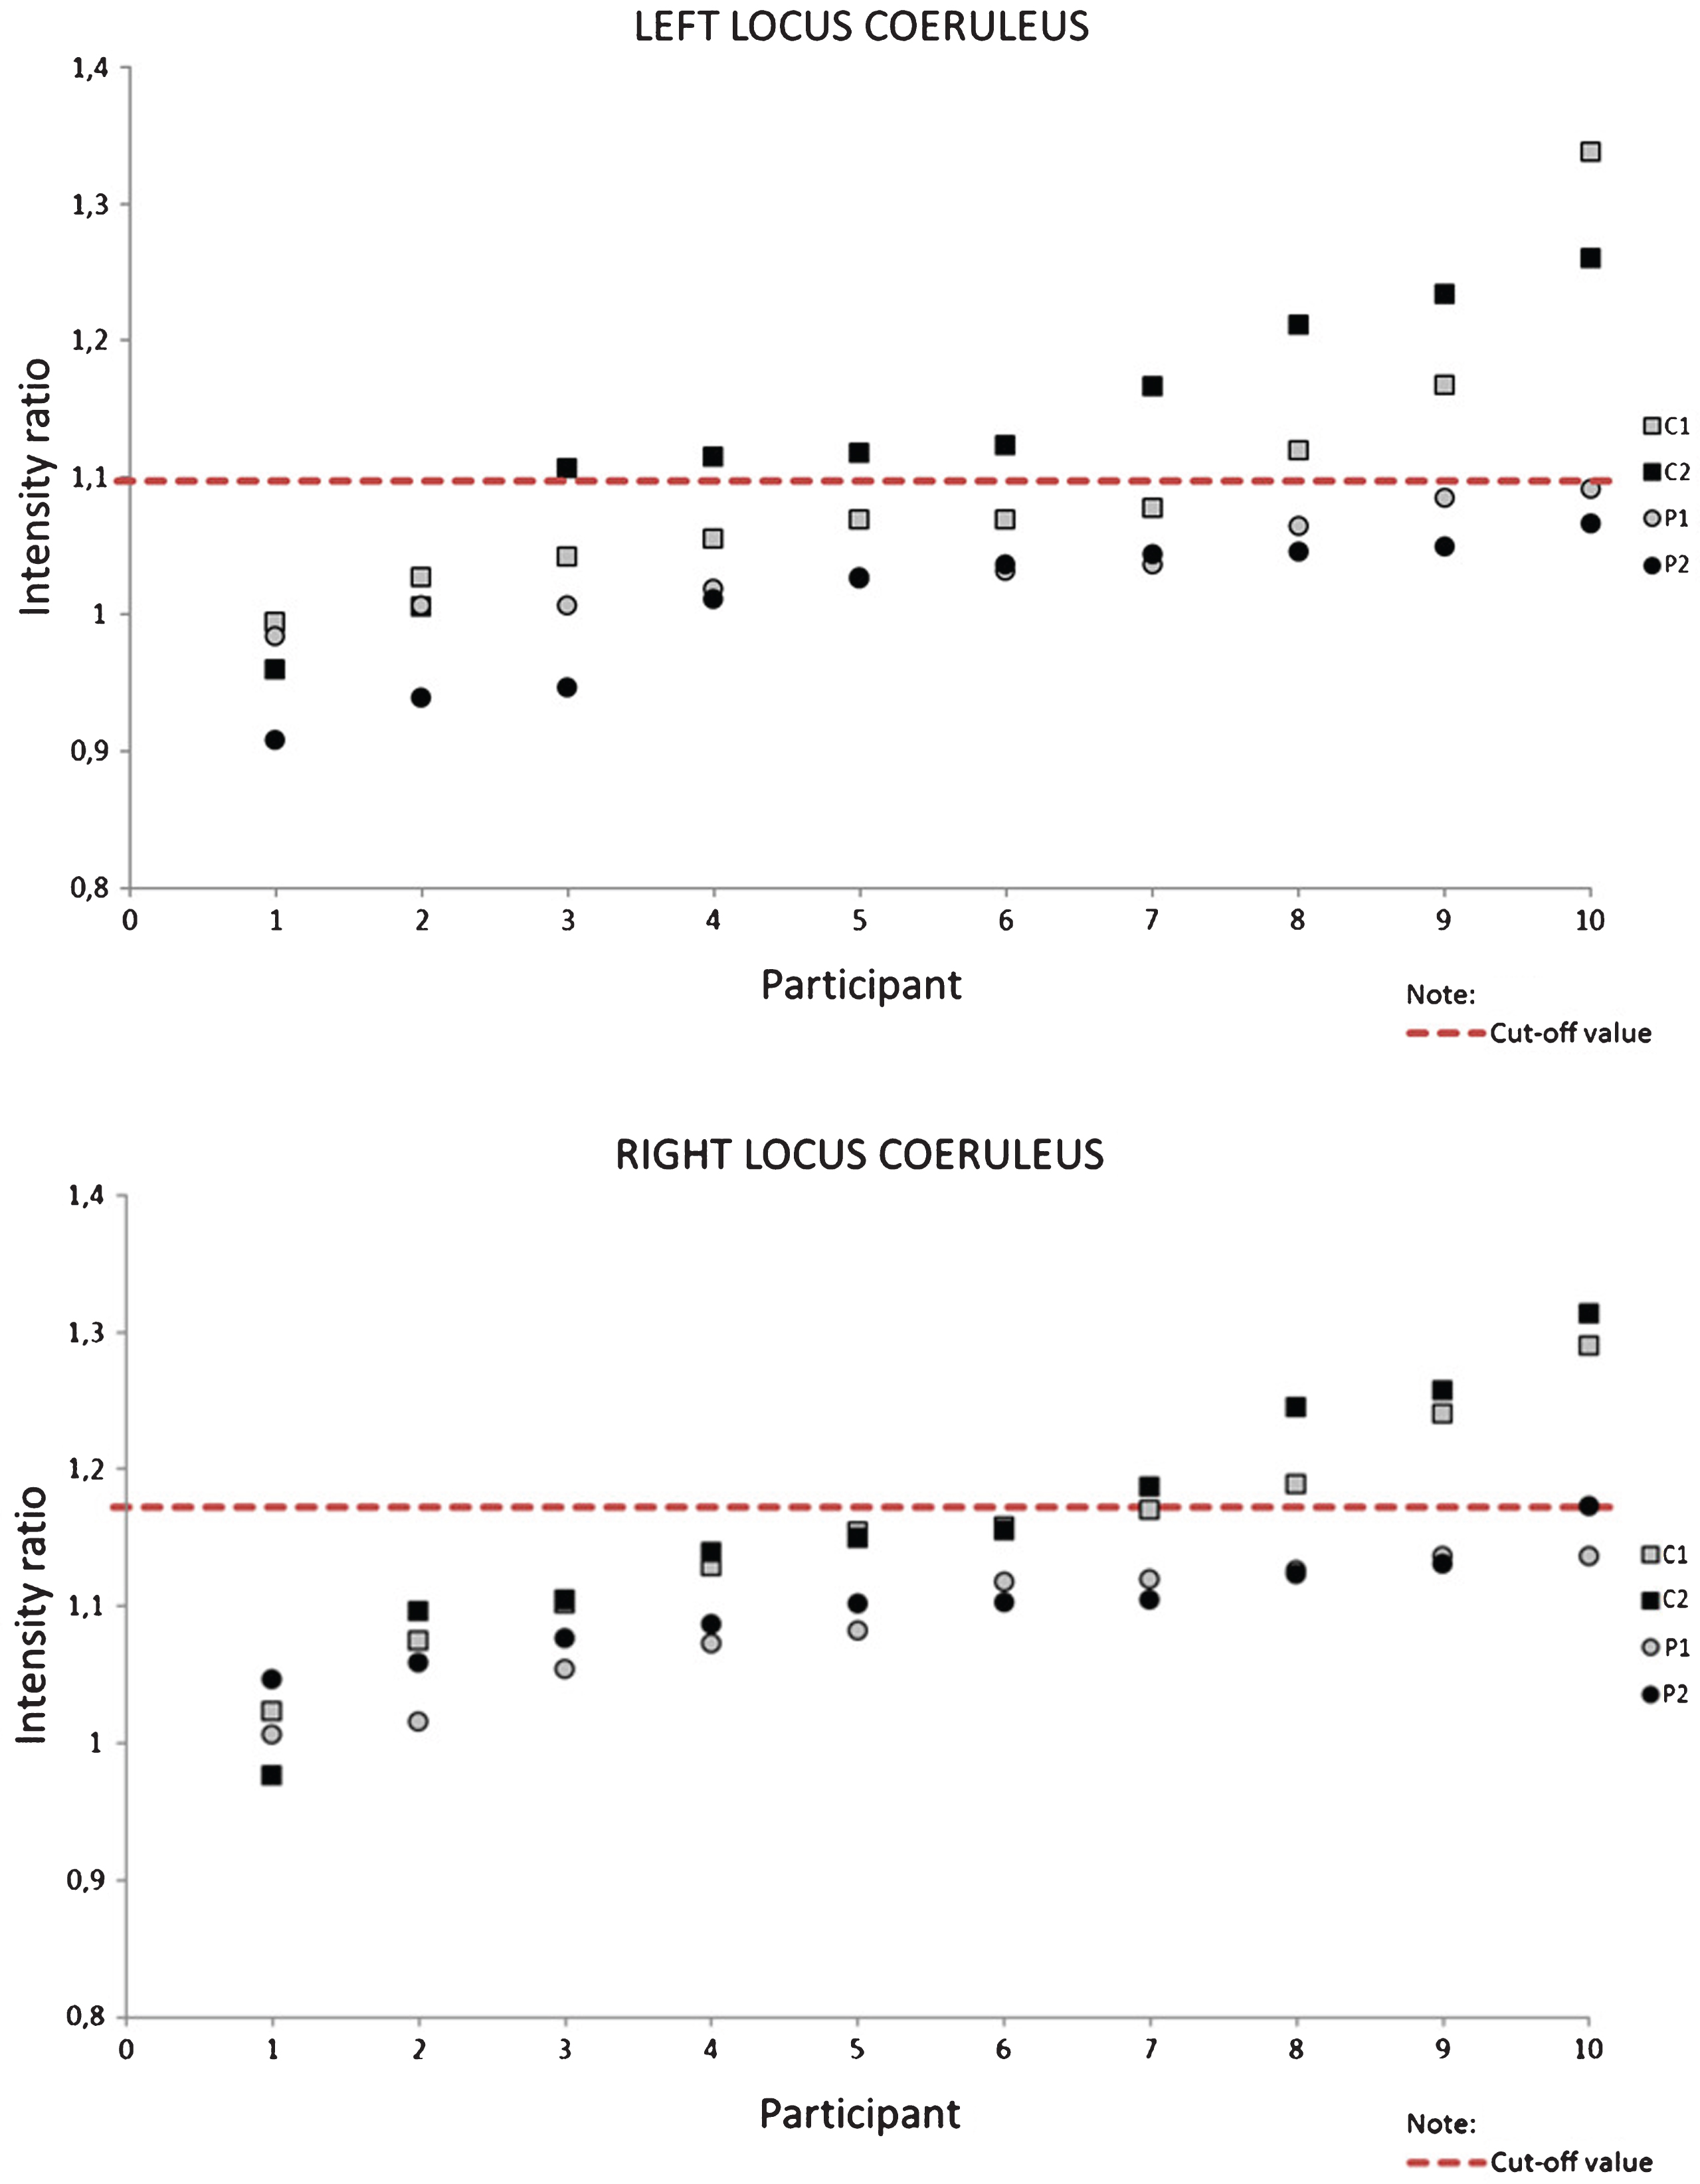
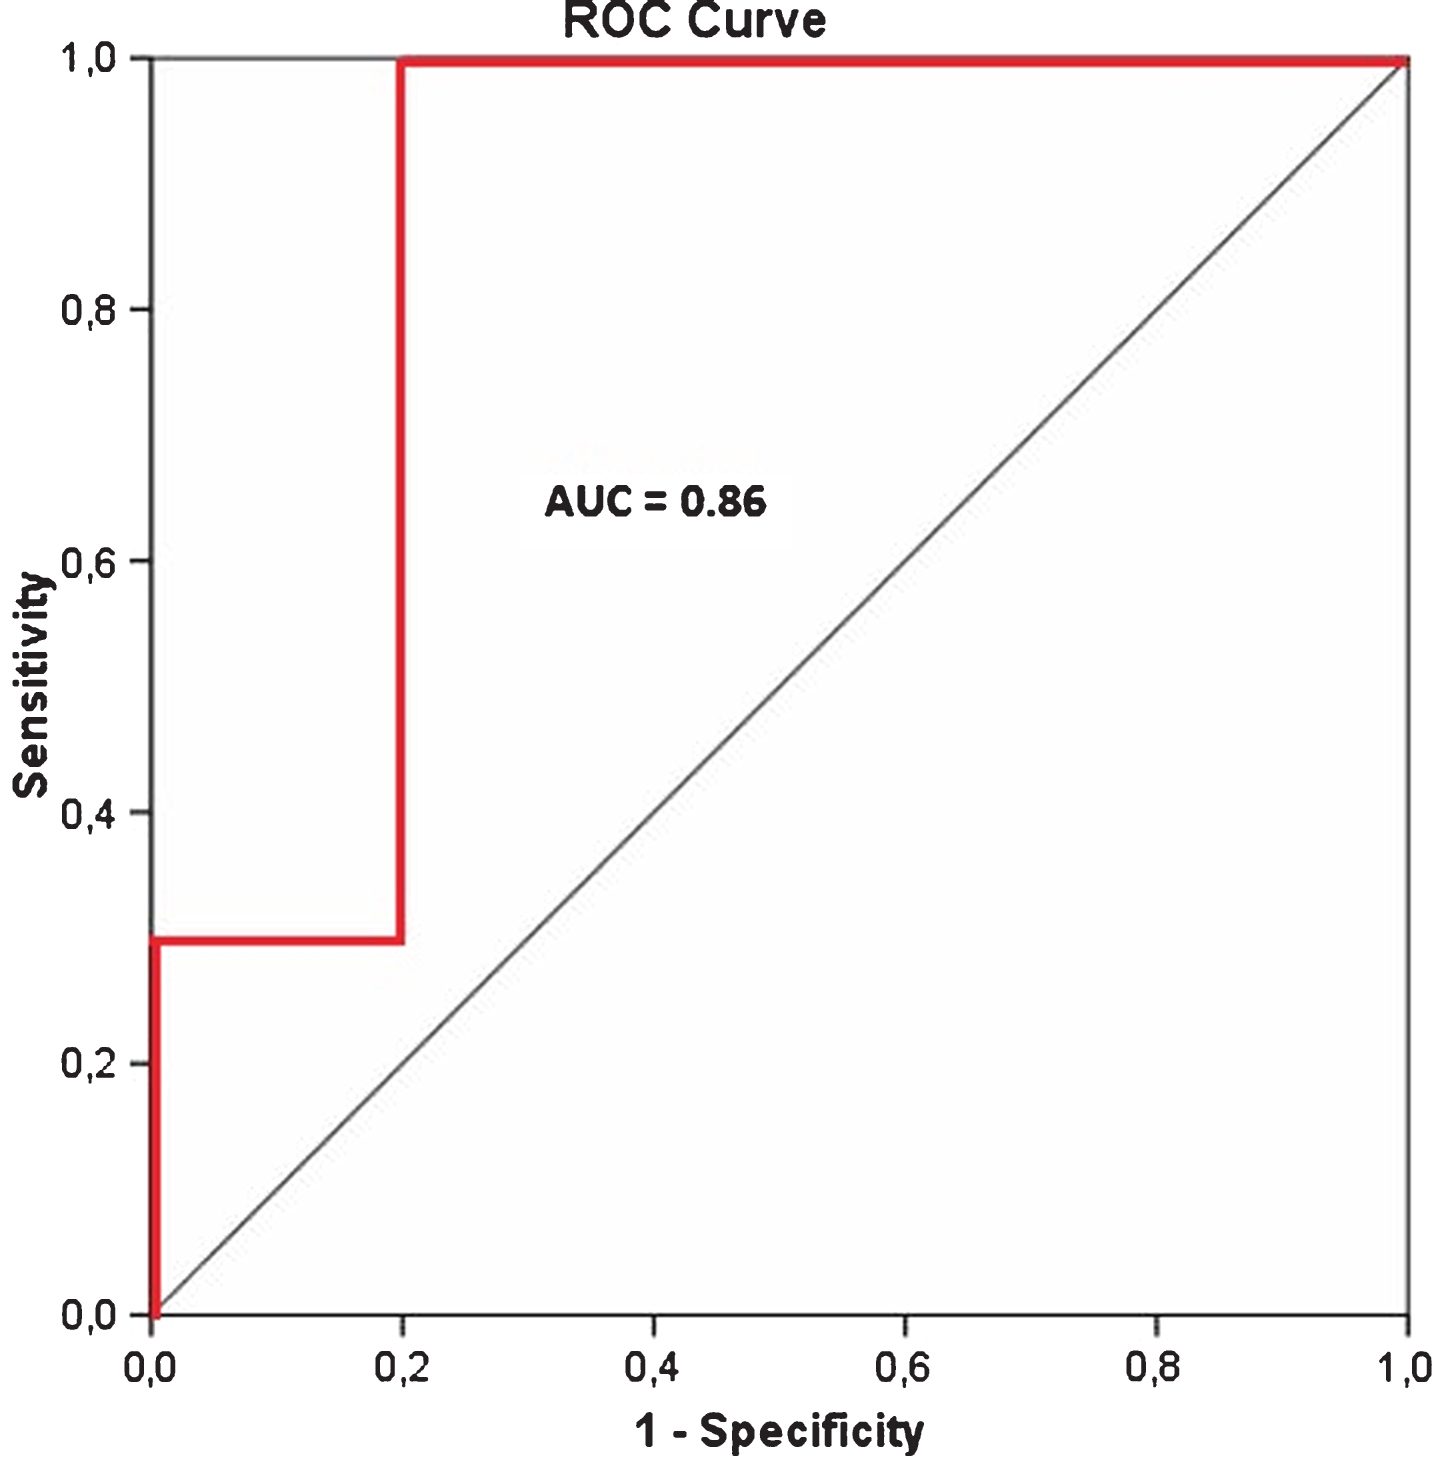
Table 3 lists the area under the curve (AUC) values from the receiver operator characteristic (ROC) analysis for each slice and side measured, as a comparison between control participants and patients. For the cut-off threshold of 1.09 the highest AUC-value of 0.86 was also obtained for the left side on the second slice, where C2 was compared to P2, as illustrated in Fig. 4. Corresponding sensitivity and specificity values were 100% and 80%, respectively.
Table 3
Values from receiver operator characteristic (ROC) analysis for each side on the two slices; bolded – the highest values
| Side | Slice | Area under | 95% confidence |
| curve | interval | ||
| Left | C1 versus P1 | 0.74 | 0.514–0.966 |
| C2 versus P2 | 0.86 | 0.674–1 | |
| Right | C1 versus P1 | 0.79 | 0.583–0.997 |
| C2 versus P2 | 0.78 | 0.560–1 |
Fig.4
Receiver operator characteristic (ROC) curve (in red) for C2 versus P2.
DISCUSSION
The goal of our study was to develop an efficient easy-to-use method for establishing a clinically relevant cut-off threshold with optimal sensitivity and specificity values of the LC-to-pons intensity ratio, thus increasing the potential of neuromelanin-sensitive MRI imaging in differentiating between elderly patients at various stages of Alzheimer’s and healthy controls in the clinical routine. According to our results, the location of this threshold was 10 millimeters below the inferior colliculus in the left hemisphere, and its value was determined to be 1.09; that is, after we placed all patients’ values below this determined cut-off standard (equivalent to 100% sensitivity), we demonstrated that 80% of values of healthy controls would remain above it. In other words, based on these pilot data, if the suggested method was to be applied in clinical settings, detection of any value above this threshold would mean exclusion of the possibility that the participant suffers from AD, whereas detection of a value below it could be interpreted as a likelihood of AD in 83.3% of cases (10 out of 12). The method also provided the AUC value of 0.86, from the ROC analysis, which is the highest AUC value obtained by any similar method thus far. This outcome can be attributed mainly to our detailed analysis of five subsequent slices in each hemisphere, where the LC neurons are present. It suggests that previous methods that analyzed only one slice and then averaged the values from both sides of the slice [14] may not provide the optimal values.
It has already been shown that neuromelanin-sensitive MRI has a high sensitivity and specificity for differentiating between patients suffering from Parkinson’s disease and healthy population, and the method has been proposed as an unbiased disease biomarker [15, 20, 21]. Some studies using neuromelanin-sensitive MRI have also demonstrated its potential for differentiating between healthy persons and MCI/AD patients [14], with a high sensitivity and specificity values derived from receiver operator curves. However, their limitations included focusing on only one slice, not taking into account the left and right LC separately (left to right variation has been observed before [1, 12]); they also have not established a clinically relevant cut-off value. To avoid these limitations in our study, we analyzed both sides within each of the five subsequent slices and determined the location of the slice and side with the highest possible ratio, which in our case was on the left side of the slice located 10 millimeters below the inferior colliculus. The obtained sensitivity and specificity values were thus 100% and 80%, respectively, for the value of 1.09 as the ratio cut-off value. We believe that such a threshold can aid the clinical decision-making process for patients suspected of suffering from neurodegenerative diseases that involve the LC, namely MCI and AD.
LC neurons are the primary source of cortical, thalamic, cerebellar, brain stem, and spinal cord norepinephrine. The highest concentration of LC neurons (as indexed by intensity values) in our study was found in about the same regions as in computer reconstructions done by German and colleagues, where the largest frequency of neurons was observed at about 10 millimeters below the inferior colliculus [1]. A similar location for the highest concentration of LC neurons was detected by other studies [12]. Marcyniuk and colleagues compared LC cell densities between AD patients and healthy controls and found the highest difference at about the mid-way through the LC. It appears that dorsal LC cells innervate the neocortex and hippocampus whereas those in the ventral area innervate the spinal cord, basal ganglia, hypothalamus, thalamus, and cerebellum. Furthermore, those dorsal cells are further divided into a rostral portion that projects mainly to the frontal cortex, a central portion that projects to temporal regions and a caudal portion projecting to occipital regions [6, 22, 23].
It has been reported that neuromelanin pigment accumulates within these neurons in a linear fashion from the first to the 6th decade of life, as does the size of the LC somata. Neuromelanin is currently considered to be a waste product of the catecholamine metabolism, derived from the oxidation of catecholamines and related compounds. Some investigators have proposed that neuromelanin is cytotoxic in that its accretion mechanically disrupts the microanatomy of intracellular membranes. Others have proposed that the oxidation of catecholamines produces hydrogen peroxide, superoxide anions, and hydroxyl radicals, which are cytotoxic to these cells. Neuromelanin is present in lower concentrations in LC cells at a younger age (e.g., at 25 years), but after the age of 50 most of the LC cells are occupied by neuromelanin and their presence can therefore be assessed based on this biomarker [1, 24, 25].
Other studies also identified the LC as the major site of subcortical neuronal loss in AD (on average 68% loss compared to controls) [7]. Therefore, neuropathological staging of AD has been rethought and it appears that the first, prodromal phase begins in the LC and not in temporal cortical regions, as previously believed; e.g., 22 of 42 individuals tested had subcortical pretangles in the absence of pretangles in transentorhinal region of the cerebral cortex. These data suggest that tauopathy associated with sporadic AD may begin earlier than previously thought and possibly not in the transentorhinal region, but rather in the lower brainstem, particularly in the LC [8, 10, 26]. Work on detection of an early AD biomarker, by analyzing the LC structural integrity, it is thus justified, since it could aid in the characterization of AD etiology and further guide targeted pharmacotherapies for affected individuals [3, 6].
Our study contains many limitations, some of which we would like to list here. First, the sample size was small, only ten participants per group, and thus the results cannot be easily transferred to a larger, representative population. However, a very high effect size (d = 1.577), which is independent of the sample size, was nevertheless observed. Second, we have included patients with a large age-range (65 to 80 years) and with varying disease severity and grouped them all together. Our small sample size did not allow us to categorize our participants into groups with narrower age-ranges and thus extrapolate our conclusions to various age groups; still, our participants were age-matched with no significant difference in this criterion. Third, our grouping criteria were based on clinical expertise; we did not systematically determine other important disease characteristics such as cerebrospinal fluid biomarkers or PET data, hence a correlation analysis of these established markers with the current ones was not possible. In our future studies, we will strive to eliminate these and other shortcomings of our present pilot study.
Conclusion
In conclusion, we extended findings of previous studies and developed a novel method for determining an intensity ratio cut-off threshold on neuromelanin-sensitive MRI scans with the highest sensitivity and specificity values obtained thus far, which can potentially contribute to the differentiation between elderly patients at various stages of AD and healthy elderly persons, and thus aid the clinical decision-making process during dementia diagnostic workup. The most relevant cut-off ratio value of 1.09 was established in the left hemisphere of the slice located 10 millimeters below the inferior colliculus. While eight of ten healthy control participants’ values were located above this threshold, all patients’ values remained below it, which is equivalent to true-positive rate (sensitivity) of 100% and true-negative (specificity) rate of 80%. The corresponding AUC value of 0.86 from the ROC analysis also demonstrated a very good test capacity. This method can be considered as a promising clinical tool for AD diagnosis but future studies with larger cohorts are needed before any stronger conclusions can be made.
CONFLICT OF INTEREST
The authors report no conflict of interest.
REFERENCES
[1] | German DC , Walker BS , Manaye K , Smith WK , Woodward DJ , North AJ ((1988) ) The human locus coeruleus: Computer reconstruction of cellular distribution. J Neurosci 8: , 1776–1788. |
[2] | Sasaki M , Shibata E , Tohyama K , Kudo K , Endoh J , Otsuka K , Sakai A ((2008) ) Monoamine neurons in the human brain stem: Anatomy, magnetic resonance imaging findings, and clinical implications. Neuroreport 19: , 1649–1654. |
[3] | Keren NI , Taheri S , Vazey EM , Morgan PS , Granholm ACE , Aston-Jones GS , Eckert MA ((2015) ) Histologic validation of locus coeruleus MRI contrast in post-mortem tissue. Neuroimage 113: , 235–245. |
[4] | Shibata E , Sasaki M , Tohyama K , Kanbara Y , Otsuka K , Ehara S , Sakai A ((2006) ) Age-related changes in locus ceruleus on neuromelanin magnetic resonance imaging at 3 Tesla. Magn Reson Med Sci 5: , 197–200. |
[5] | Aston-Jones G , Cohen JD ((2005) ) An integrative theory of locus coeruleus-norepinephrine function: Adaptive gain and optimal performance. Annu Rev Neurosci 28: , 403–450. |
[6] | Grudzien A , Shaw P , Weintraub S , Bigio E , Mash DC , Mesulam MM ((2007) ) Locus coeruleus neurofibrillary degeneration in aging, mild cognitive impairment and early Alzheimer’s disease. Neurobiol Aging 28: , 327–335. |
[7] | Zarow C , Lyness SA , Mortimer JA , Chui HC ((2003) ) Neuronal loss is greater in the locus coeruleus than nucleus basalis and substantia nigra in Alzheimer and Parkinson diseases. Arch Neurol 60: , 337–341. |
[8] | Braak H , Thal DR , Ghebremedhin E , Del Tredici K ((2011) ) Stages of the pathologic process in Alzheimer disease: Age categories from 1 to 100 years. J Neuropathol Exp Neurol 70: , 960–969. |
[9] | German DC , Manaye KF , White CL 3rd , Woodward DJ , McIntire DD , Smith WK , Kalaria RN , Mann DM ((1992) ) Disease-specific patterns of locus coeruleus cell loss. Ann Neurol 32: , 667–676. |
[10] | Braak H , Del Tredici K ((2011) ) The pathological process underlying Alzheimer’s disease in individuals under thirty. Acta Neuropathol 121: , 171–181. |
[11] | Sasaki M , Shibata E , Kudo K , Tohyama K ((2008) ) Neuromelanin-sensitive MRI. Clin Neuroradiol 18: , 147–153. |
[12] | Keren NI , Lozar CT , Harris KC , Morgan PS , Eckert MA ((2009) ) In vivo mapping of the human locus coeruleus. Neuroimage 47: , 1261–1267. |
[13] | Langley J , Huddleston DE , Liu CJ , Hu X ((2017) ) Reproducibility of locus coeruleus and substantia nigra imaging with neuromelanin sensitive MRI. MAGMA 30: , 121–125. |
[14] | Takahashi J , Shibata T , Sasaki M , Kudo M , Yanezawa H , Obara S , Kudo K , Ito K , Yamashita F , Terayama Y ((2015) ) Detection of changes in the locus coeruleus in patients with mild cognitive impairment and Alzheimer’s disease: High-resolution fast spin-echo T1-weighted imaging. Geriatr Gerontol Int 15: , 334–340. |
[15] | Castellanos G , Fernandez-Seara MA , Lorenzo-Betancor O , Ortega-Cubero S , Puigvert M , Uranga J , Vidorreta M , Irigoyen J , Lorenzo E , Munoz-Barrutia A , Ortiz-de-Solorzano C , Pastor P , Pastor MA ((2015) ) Automated neuromelanin imaging as a diagnostic biomarker for Parkinson’s disease. Mov Disord 30: , 945–952. |
[16] | Shibata E , Sasaki M , Tohyama K , Otsuka K , Endoh J , Terayama Y , Sakai A ((2008) ) Use of neuromelanin-sensitive MRI to distinguish schizophrenic and depressive patients and healthy individuals based on signal alterations in the substantia nigra and locus ceruleus. Biol Psychiatry 64: , 401–406. |
[17] | McKhann G , Drachman D , Folstein M , Katzman R , Price D , Stadlan EM ((1984) ) Clinical diagnosis of Alzheimer’s disease: Report of the NINCDS-ADRDA Work Group under the auspices of Department of Health and Human Services Task Force on Alzheimer’s Disease. Neurology 34: , 939–944. |
[18] | Jenkinson M , Bannister P , Brady M , Smith S ((2002) ) Improved optimization for the robust and accurate linear registration and motion correction of brain images. Neuroimage 17: , 825–841. |
[19] | Cohen J ((1988) ) Statistical power analysis for the behavioral sciences. Stat Power Anal Behav Sci 2nd 567: . |
[20] | Ohtsuka C , Sasaki M , Konno K , Koide M , Kato K , Takahashi J , Takahashi S , Kudo K , Yamashita F , Terayama Y ((2013) ) Changes in substantia nigra and locus coeruleus in patients with early-stage Parkinson’s disease using neuromelanin-sensitive MR imaging. Neurosci Lett 541: , 93–98. |
[21] | Ohtsuka C , Sasaki M , Konno K , Kato K , Takahashi J , Yamashita F , Terayama Y ((2014) ) Differentiation of early-stage parkinsonisms using neuromelanin-sensitive magnetic resonance imaging. Parkinsonism Relat Disord 20: , 755–760. |
[22] | Marcyniuk B , Mann DMA , Yates PO ((1986) ) Loss of nerve cells from locus coeruleus in Alzheimer’s disease is topographically arranged. Neurosci Lett 64: , 247–252. |
[23] | Marcyniuk B , Mann DMA , Yates PO ((1986) ) The topography of cell loss from locus caeruleus in Alzheimer’s disease. J Neurol Sci 76: , 335–345. |
[24] | Graham DG ((1979) ) On the origin and significance of neuromelanin. Arch Pathol Lab Med 103: , 359–362. |
[25] | Manaye KF , McIntire DD , Mann DMA , German DC ((1995) ) Locus coeruleus cell loss in the aging human brain: A non-randomrocess. J Comp Neurol 358: , 79–87. |
[26] | Braak H , Del Tredici K ((2011) ) Alzheimer’s pathogenesis: Is there neuron-to-neuron propagation? Acta Neuropathol 121: , 589–595. |


