
Methylation Profiling RIN3 and MEF2C Identifies Epigenetic Marks Associated with Sporadic Early Onset Alzheimer’s Disease
Abstract
A number of genetic loci associate with early onset Alzheimer’s disease (EOAD); however, the drivers of this disease remains enigmatic. Genome wide association and in vivo modeling have shown that loss-of-function, e.g., ABCA7, reduced levels of SIRT1 and MEFF2C, or increased levels of PTK2β confer risk or link to the pathogenies. It is known that DNA methylation can profoundly affect gene expression and can impact on the composition of the proteome; therefore, the aim of this study is to assess if genes associated with sporadic EOAD (sEOAD) are differentially methylated. Epi-profiles of DNA extracted from blood and cortex were compared using a pyrosequencing platform. We identified significant group-wide hypomethylation in AD blood when compared to controls for 7 CpGs located within the 3’UTR of RIN3 (CpG1 p = 0.019, CpG2 p = 0.018, CpG3 p = 0.012, CpG4 p = 0.009, CpG5 p = 0.002, CpG6 p = 0.018, and CpG7 p = 0.013, respectively; AD/Control n = 22/26; Male/Female n = 27/21). Observed effects were not gender specific. No group wide significant differences were found in the promoter methylation of PTK2β, ABCA7, SIRT1, or MEF2C, genes known to associate with late onset AD. A rare and significant difference in methylation was observed for one CpG located upstream of the MEF2C promoter in one AD individual only (22% reduction in methylation, p = 2.0E-10; Control n = 26, AD n = 25, Male/Female n = 29/22). It is plausible aberrant methylation may mark sEOAD in blood and may manifest in some individuals as rare epi-variants for genes linked to sEOAD.
INTRODUCTION
Alzheimer’s disease (AD) is a progressive neurodegenerative condition and the leading cause of dementia among the elderly [1]. AD can segment into two classifications depending on age at diagnosis, raising the possibility of different initiators of disease for each group. Late onset AD (LOAD) is the most prevalent form, a condition which affects those over the age of 65 and accounts for approximately 90 to 95% of all those diagnosed with AD. Early onset AD (EOAD) typically affects those under the age of 65 and is much rarer, accounting for just 5% to 10% of all AD cases [2].
The genetic explanation for LOAD is complex with a growing number of different genes implicated, reviewed by [3], yet none in isolation fully accounts for disease susceptibility. EOAD however can be sub-divided into two groups, familial and sporadic. Familial AD (fAD) is thought to be easier to explain, driven by mutations within a growing list of different genes, including but not limited to amyloid protein precursor (APP) or presenilin (PSEN1 and PSEN2) genes [2, 4]. Sporadic EOAD (sEOAD), although like fAD occurs in individuals under the age of 65, has proven much harder to pin to any one gene or pathway. Comparative transcriptomic analysis of sEOAD and fAD brain tissue identified over 3000 differentially expressed genes [5], suggesting sEOAD and fAD may be distinct neurodegenerative processes.
An increasing number of genes link with LOAD, an association identified through comparative genome wide association data analysis (GWAS) [6]. These new studies link numerous pathways to pathogenesis, correlating genes and cellular processes not previously considered relevant [6]. Current models suggest LOAD may be a complex multifactorial condition driven by a number of different genes located within independent pathways [3]. Although each genetic variant links to disease, frequency within the wider population can vary; even the most common LOAD risk APOE ɛ4 allele only presents in 40% of LOAD patients. Diversity in the frequency of genetic drivers of AD may be considered surprising given the similarities in the pathology of the disease collectively among AD sufferers. One plausible hypothesis is that these genes could be differentially regulated within groups of AD suffers, existing within the population as variants at an epigenetic or regulatory level. Some data exists to support this notion. Differences in DNA methylation of AD associated genes have been identified in DNA samples taken from both the blood and the brain of patients diagnosed with LOAD [7–12]. Notably APP has been found to be differentially methylated within the promoter region in LOAD, while sirtuin1 (SIRT1) has been shown to be differential methylated in a Chinese AD population [13–15]. Little, however, is currently known about the epigenetic status of genes that associate with sEOAD.
Stable changes in DNA methylation can be induced by a person’s lifestyle or environment and may progressively accumulate over many years. Levels of methylation may direct gene expression leading to changes in the levels of proteins, which may cause, drive, or exacerbate AD disease symptoms [16, 17]. Initial epi-profiling already undertaken using LOAD samples suggests this hypothesis may be correct for later onset AD [7]; however, little work to date has been undertaken to investigate any putative epigenetic link with sEOAD. We therefore sought to investigate if those LOAD genes genetically associated with AD occur as epi-variants in sEOAD.
Genes previously associated with LOAD through GWAS profiling are likely candidates for epi-profiling with variation encoded by methylation. Genes already profiled using genetic association with LOAD include but are not limited to PTK2β, ABCA7, and MEF2C [18]. These three genes are all implicated in a range of pathways associated with AD pathology. PTK2β functions in memory formation and cell proliferation and survival [19, 20], ABCA7 has a role in regulating AβPP processing and inhibiting amyloid-β [21–23], while MEF2C is a transcription factor involved in preventing excessive synapse formation [24].
Another gene, a candidate target of interest for both genetic and epigenetic analysis, is SIRT1. This gene is functionally implicated in AD disease pathology in a number of studies [25–28]. Disease linked differential methylation of a non-coding region of SIRT1 has already been demonstrated in peripheral blood leukocytes of a Chinese LOAD population [13], therefore a comparative approach investigating sEOAD could be informative. Previous research by Hou et al. [13] identified two CpGs outside of the promoter CpG Island (CGI) to be significantly hypermethylation in LOAD samples; this suggests that epi-profiling should not just be restricted to CpG repeats, exploring the wider gene region may reveal interesting information around regulation linked to disease.
There is some evidence to suggest that investigating regulatory features other than the promoter region could be productive. A 3’UTR CGI found within the RIN3 gene is located on chromosome 14 and sits between two AD associated genes SLC24A4 and LGMN [18]. RIN3 is interesting in isolation as this gene associates with AD pathology through its interaction with BIN1, a gene that shows the second most significant LOAD score after APOE [29]. Further it has also been found to be differentially methylated in LOAD [8]. It is likely that BIN1 and RIN3 interact in the process of endocytosis negatively effecting amyloid trafficking [30, 31]. Since 3’ UTR methylation has recently emerged as an important epigenetic mark influencing gene expression, transcriptional elongation and splicing it is a valid hypothesis that this CGI may represent an informative target for epi-profiling [32–34].
To date most transcriptomic or proteomic analysis is conducted using brain tissue. While profiles obtained from brain material may be informative about the direct epigenetic consequences of AD pathology, this tissue it is not a viable source for the identification of new biomarkers. Also it is well established that brain methylation can differ significantly between the different regions of the brain [12]. Additional technical limitations include a restriction on test subject numbers through limited availability of tissue. Interestingly leukocytes are thought to acquire epigenetic markers linked to disease as they transit through the afflicted tissue. In limited studies to date, peripheral blood DNA methylation has been shown to be representative of brain methylation [35]. Blood based epigenetic biomarkers may be a useful addition to the AD diagnostic tool kit available, while also informing on the fundamental biology of sEOAD.
This study profiles comparative levels of methylation present in individuals presenting with sEOAD. Through profiling DNA extracted from both blood and brain, we have identified variation in the methylation of key genes that may link to AD and the progression of sEOAD. Differences in methylation may be consistent across many CpGs or could be restricted to a single bp.
MATERIALS AND METHODS
DNA samples
sEOAD DNA samples were obtained from the Alzheimer’s Research UK Consortium DNA Bank, a resource curated by the University of Nottingham and were either extracted from leukocytes (n = 51) or brain (cortex) (n = 24). In total 40 sEOAD and 21 control samples were used. 25 blood and 14 cortex brain AD samples and 26 blood and 10 brain control samples were used (See Table 1 for further information). DNA samples used in this study have been genetically tested by Alzheimer’s Research UK Consortium DNA Bank and none contained fAD mutations.
Table 1
Shows clinical features of AD and control samples
| Group | Sex M/F | Age at death | Age at onset of disease | Age at sampling | |
| Blood | AD | 17/8 | 57.95 (SD 3.28) | 48.6 (SD 2.98) | 47.2 (SD 2.28) |
| Control | 13/13 | N/A | N/A | 82.8 (SD 4.5) | |
| Brain | AD | 4/10 | 59.35 (SD 6.95) | 48.85 (SD 3.32) | 59.35 (SD 6.95) |
| Control | 6/4 | 84.2 (SD 3.55) | N/A | 84.2 (SD 3.55) |
All samples used in this study were received with informed consent and experimental procedures were approved by the local ethics committee, Nottingham Research Ethics Committee 2 (REC reference 04/Q2404/130). All experimental procedures were conducted in accordance with approved guidelines.
DNA extraction
Approximately 200 mg of cortex tissue was chopped finely on dry ice then transferred to a 1.5 ml Eppendorf tube. This was then incubated overnight (∼18 h, shaking at 380 rpm, 50°C) with 500 μl AL lysis buffer and 50 μl proteinase K (both Qiagen) and 10 μl RNase A. Next, 500 μl of refrigerated phenol chloroform was added to the sample (Sigma), which was mixed by inverting before being subjected to centrifugation for 5 min at 13,000 rpm. The top phase of the resultant sample was then removed to a clean lock phase-gel 2 ml Eppendorf, and the addition of phenol chloroform, mixing and centrifugation repeated. The top phase of this was removed, and has 3 M sodium acetate (pH 5.2) added to it in a 1 : 9 ratio of sodium acetate to the sample. Chilled 100% ethanol was then added, at an equal volume to the sample, to precipitate out the DNA. Following centrifugation at 13,000 rpm for 15 min, a wash was performed using 500 μl 70% ethanol, before another centrifugation step, for 15 min (13,000 rpm). The remaining ethanol was then discarded and the pellet air-dried, before resuspension in 100 μl 1xTE buffer, by heating to 50°C for 1 h.
Bisulphite treatment
First DNA was bisulphite-treated using the EpiTect Bisulphite Conversion Kit (Qiagen, Germany), following the manufacturer’s instructions. Bisulphite treatment converted any non-methylated cytosines to uracil; therefore, in the following PCR product, non-methylated cytosines became thymine, allowing pyrosequencing of the PCR product to result in identification of cytosine methylation. 500 ng of genomic DNA was bisulphite-treated for each patient sample and 10 ng of converted DNA was used in subsequent PCRs.
In silico methods
Target regions were identified using the UCSC Genome Browser (University of California, Santa Cruz, CA, USA) (http://www.genome.ucsc.edu/index). Pyrosequencing primers were then designed for these regions using the PyroMark Assay Design software version 2.0 (Qiagen) and obtained from Eurofins MWG. Pyrosequencing assays were designed using the PyroMark Q24 software.
Polymerase chain reaction (PCR)
PCRs were conducted using the PyroMark PCR Kit (Qiagen, Germany) following manufactures instructions. PCRs contained 12.5 μl PyroMark PCR Mastermix 2x (Qiagen), 2.5 μl CoralLoad Concentrate 10x (Qiagen), 0.25 ng of each PCR primer, and 10 ng DNA, made up to 25 μl with RNase-free water. Details of PCR primers can be found in Supplementary Table 1; all PCR primer pairs contained a biotinylated primer to result in a biotinylated PCR product which could be captured by sepharose coated beads during pyrosequencing. PCR programs varied depending on primers used; details can be found in Supplementary Table 2. PCR product quality was assessed by running 5 μl of PCR product on a 1% agarose gel prior to pyrosequencing.
Pyrosequencing
A pyrosequencing platform Q24 pyrosequencer (Qiagen, Germany) with PyroMark Gold Q24 Reagents (Qiagen, Germany) was used to determine percentage methylation. Pyrosequencing was carried out following manufacturer’s instructions/protocol. Pyrosequencing results were interpreted using the PyroMark Q24 software.
Statistical analysis
For all the methylation percentage data, one-way analyses of variance were used to test the blood and brain tissue data for differences between the AD and control groups of subjects. Each of the cytosines were analyzed separately as were the blood and brain tissue data sets. When multiple values were recorded for the same cytosine from the same subject, the values were averaged to produce one value per person for each cytosine. These averages were then analyzed using the Analysis of Variance routines within the Genstat18 statistical package.
The residuals from each analysis were plotted to check the assumptions of normality and homogeneity of residuals, and also to highlight possible rare variants. For rare variants, the probability of obtaining residual values as, or more, extreme than the one observed was calculated from the standard normal distribution curve. To achieve this, the residual deviation between the individual outlier and the mean of its group; and the overall standard deviation from the rerun analysis were used as input to the Genstat Normal probability distribution routine.
RESULTS
PTK2β, ABCA7, SIRT1, and the MEF2C promoter CGI showed no significant methylation in AD
PTK2β, ABCA7, and MEF2C: Promoter regions of AD candidate genes PTK2β, ABCA7, MEF2C, and SIRT1 were chosen as targets for analysis (see Supplementary Table 1 and Supplementary Figure 1); initial gene targets were selected based on previously published GWAS risk analysis data [18] or in the case of SIRT1, published promoter methylation data [13]. Previous research identified PTK2β, ABCA7, and MEF2C to be associated with LOAD through GWAS [18, 36]; however, to date few experiments have investigated the contribution of these genes to sEOAD. These genes may be considered prime candidates for regulation via an epigenetic mechanism; therefore, we first chose to profile methylation at these loci in blood and brain tissue taken from sEOAD patients.
For PTK2β, ABCA7, and MEF2C, the CpG island closest to the start site of transcription was chosen for analysis (details in Supplementary Figures 1 and 2). In total, we profiled 5, 8, and 4 CpGs for PTK2β, ABCA7, and MEF2C, respectively; however, unexpectedly, we failed to detect any significant difference in the average regional level of methylation across genes investigated in sEOAD blood or brain derived samples (Fig. 1) (p > 0.05). It is interesting to note that for PTK2β, ABCA7, and MEF2C, the regions targeted showed relatively low average levels of methylation in cortex and blood tissue of both AD and control samples.
Fig.1
Box plots showing data representing average methylation across the regions investigated for PTK2β (A), ABCA7 (B), SIRT1 (C), and the MEF2C promoter CGI (D). No significant difference in methylation was observed between AD and control in either blood or brain tissue. Box plots represent median with 25th and 75th percentile as edges, the whiskers either show the lowest and highest values or extend to the first quartile minus the interquatile range multiplied by 1.5 and up to the third quartile add the interquartile range times 1.5, depending on which values are largest or smallest (for the top and bottom whiskers respectively). For PTK2β control blood n = 6, AD blood n = 5, control brain n = 3, and AD brain n = 4. For ABCA7 control blood n = 7, AD blood n = 4, control brain n = 3, AD brain = 6. For SIRT1 control blood n = 4, AD blood n = 5, control brain n = 3, and AD brain n = 3. For the MEF2C CGI region Control blood n = 3, AD blood n = 5, Control brain n = 3, AD brain n = 4.
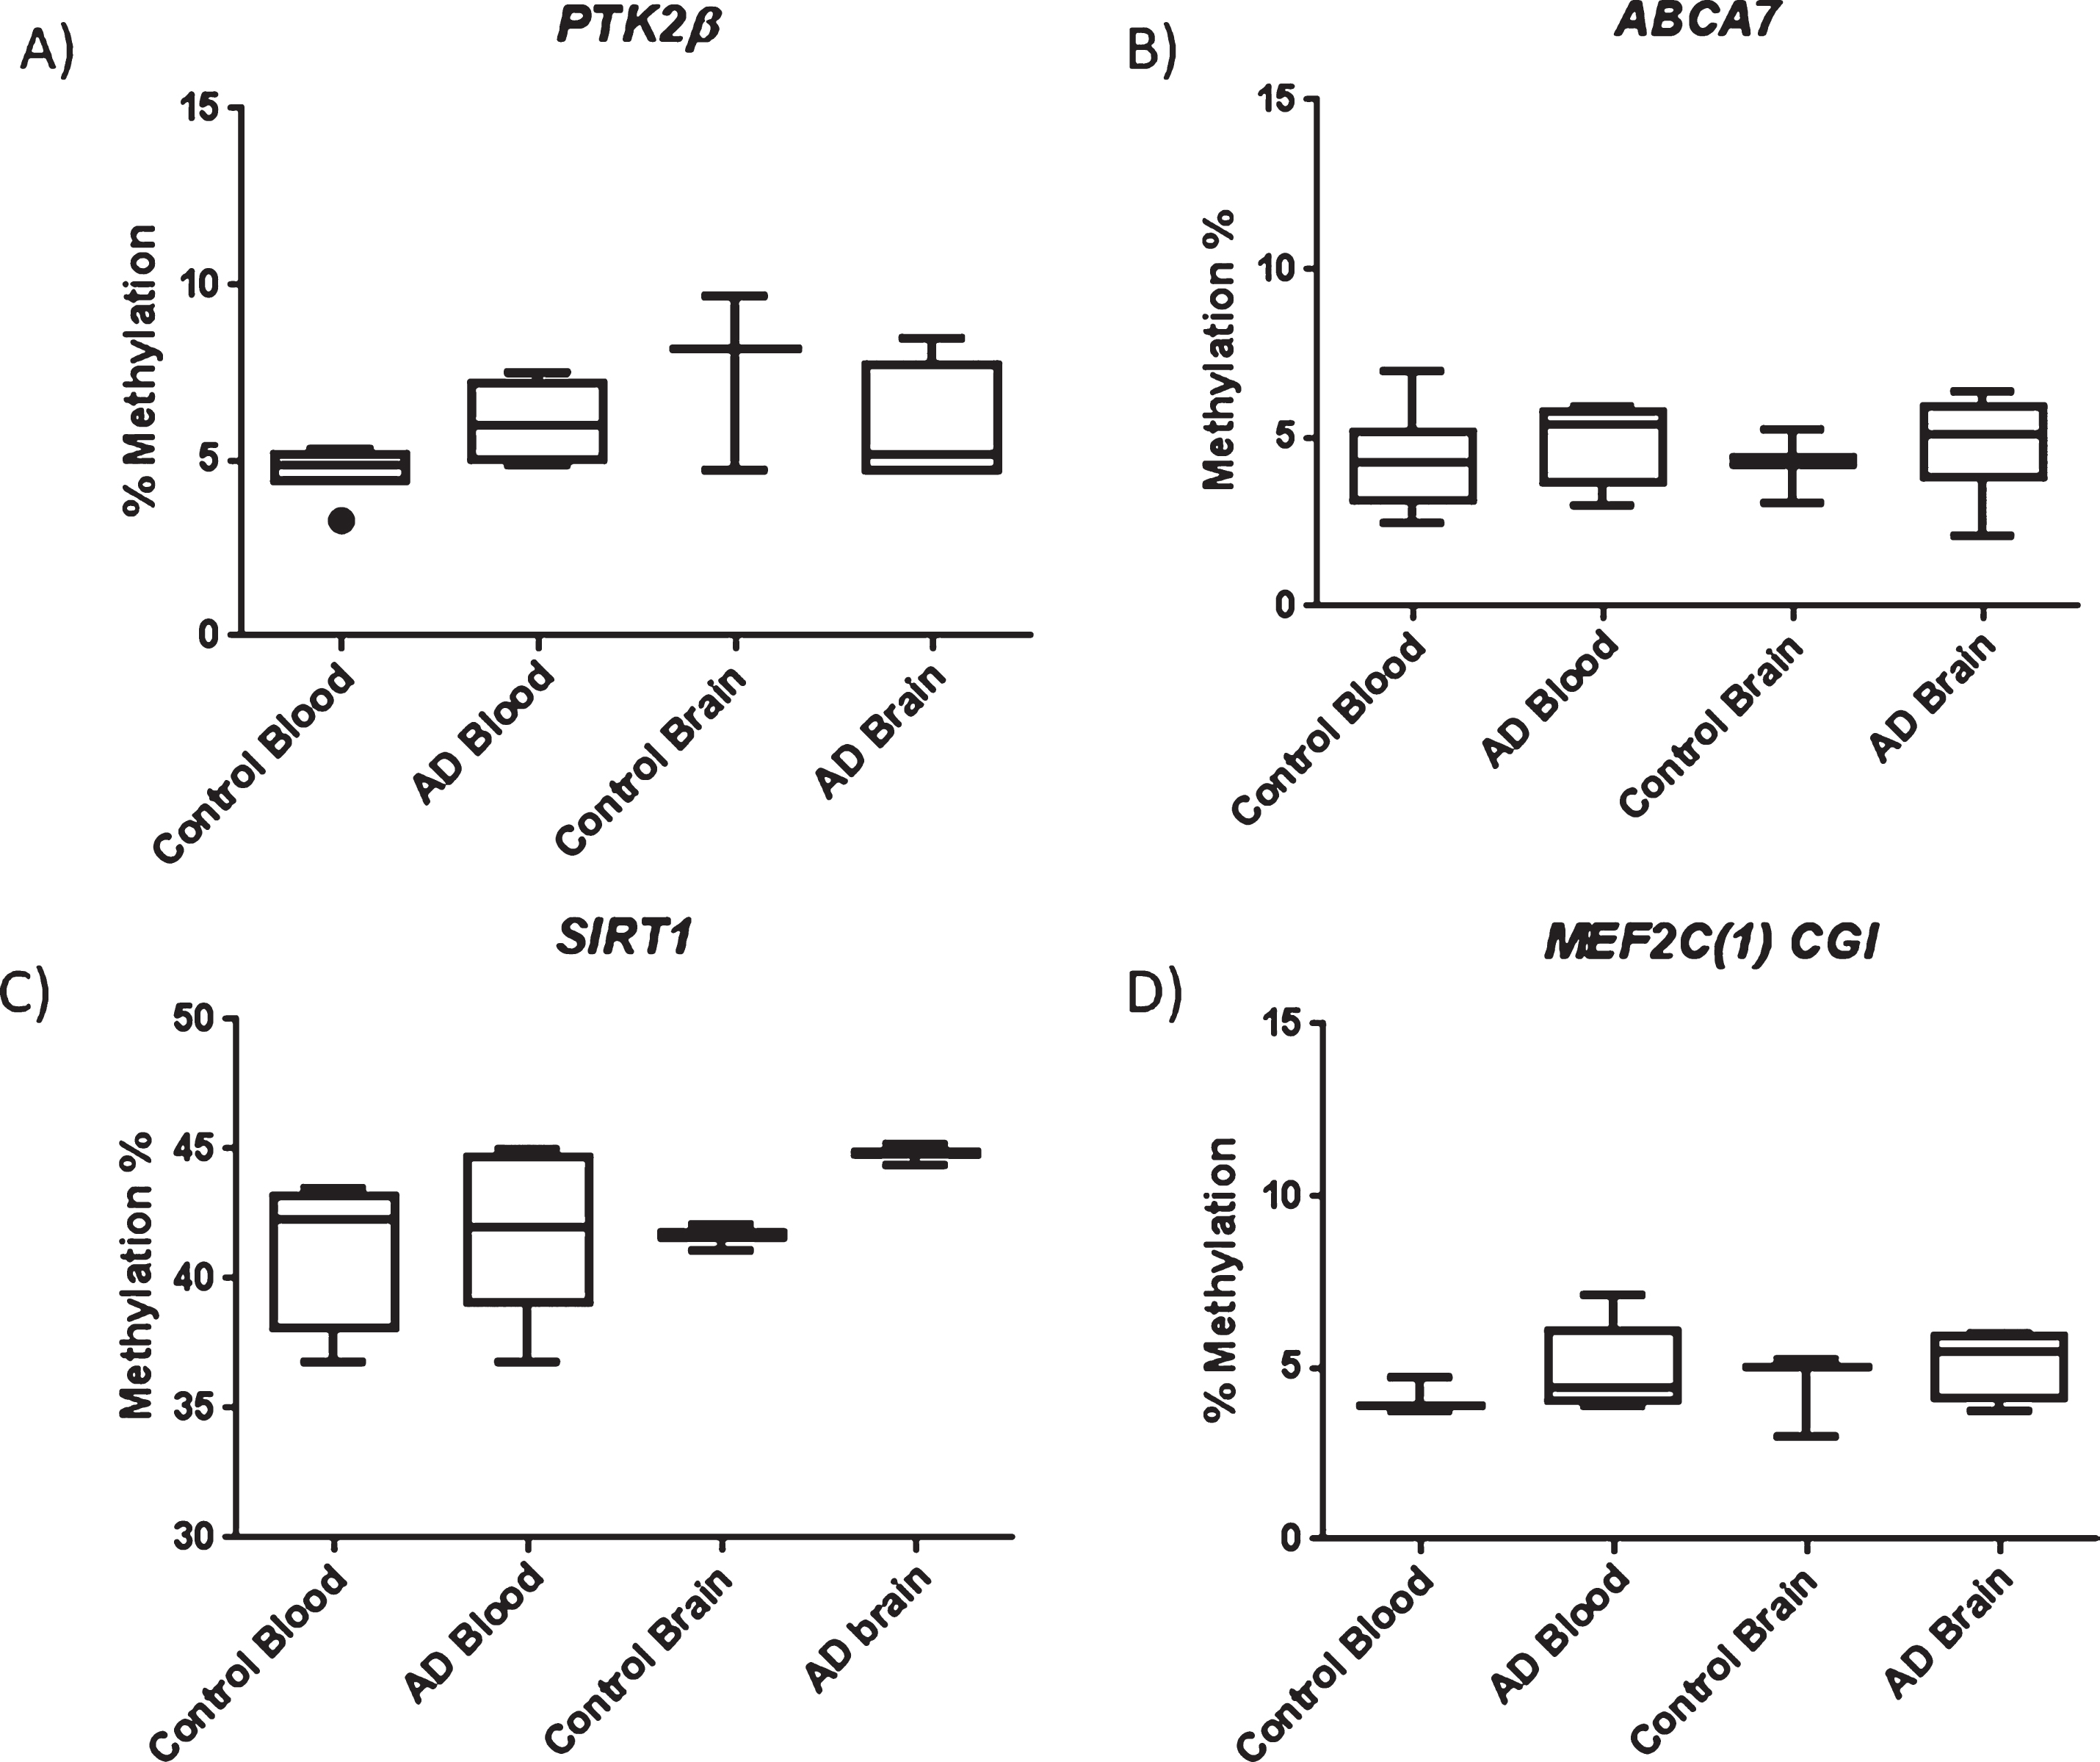
Given the absence of variation we observed for PTK2β, ABCA7, and MEF2C, we opted to profile levels of methylation at an AD linked loci previously reported to be differentially methylated [13]. SIRT1 associates with AD pathology through its role in attenuating Aβ toxicity and preventing tau cytotoxicity [25–28]; therefore, it is reasonable to suggest aberrant methylation may impede this protective effect. As this previous study was undertaken using samples obtained from LOAD patients, we chose to investigate if the epigenetic variation previously reported could also be observed in sEOAD patients. In order to directly compare levels of methylation for our sEOAD sample library with a previously published candidate AD associated epi-loci, we profiled two CpGs reported to be hypermethylated in LOAD peripheral blood [13]. Where tested, we found no significant difference in methylation compared to controls at either CpG site in blood.
Methylation at the resolution of individual CpGs
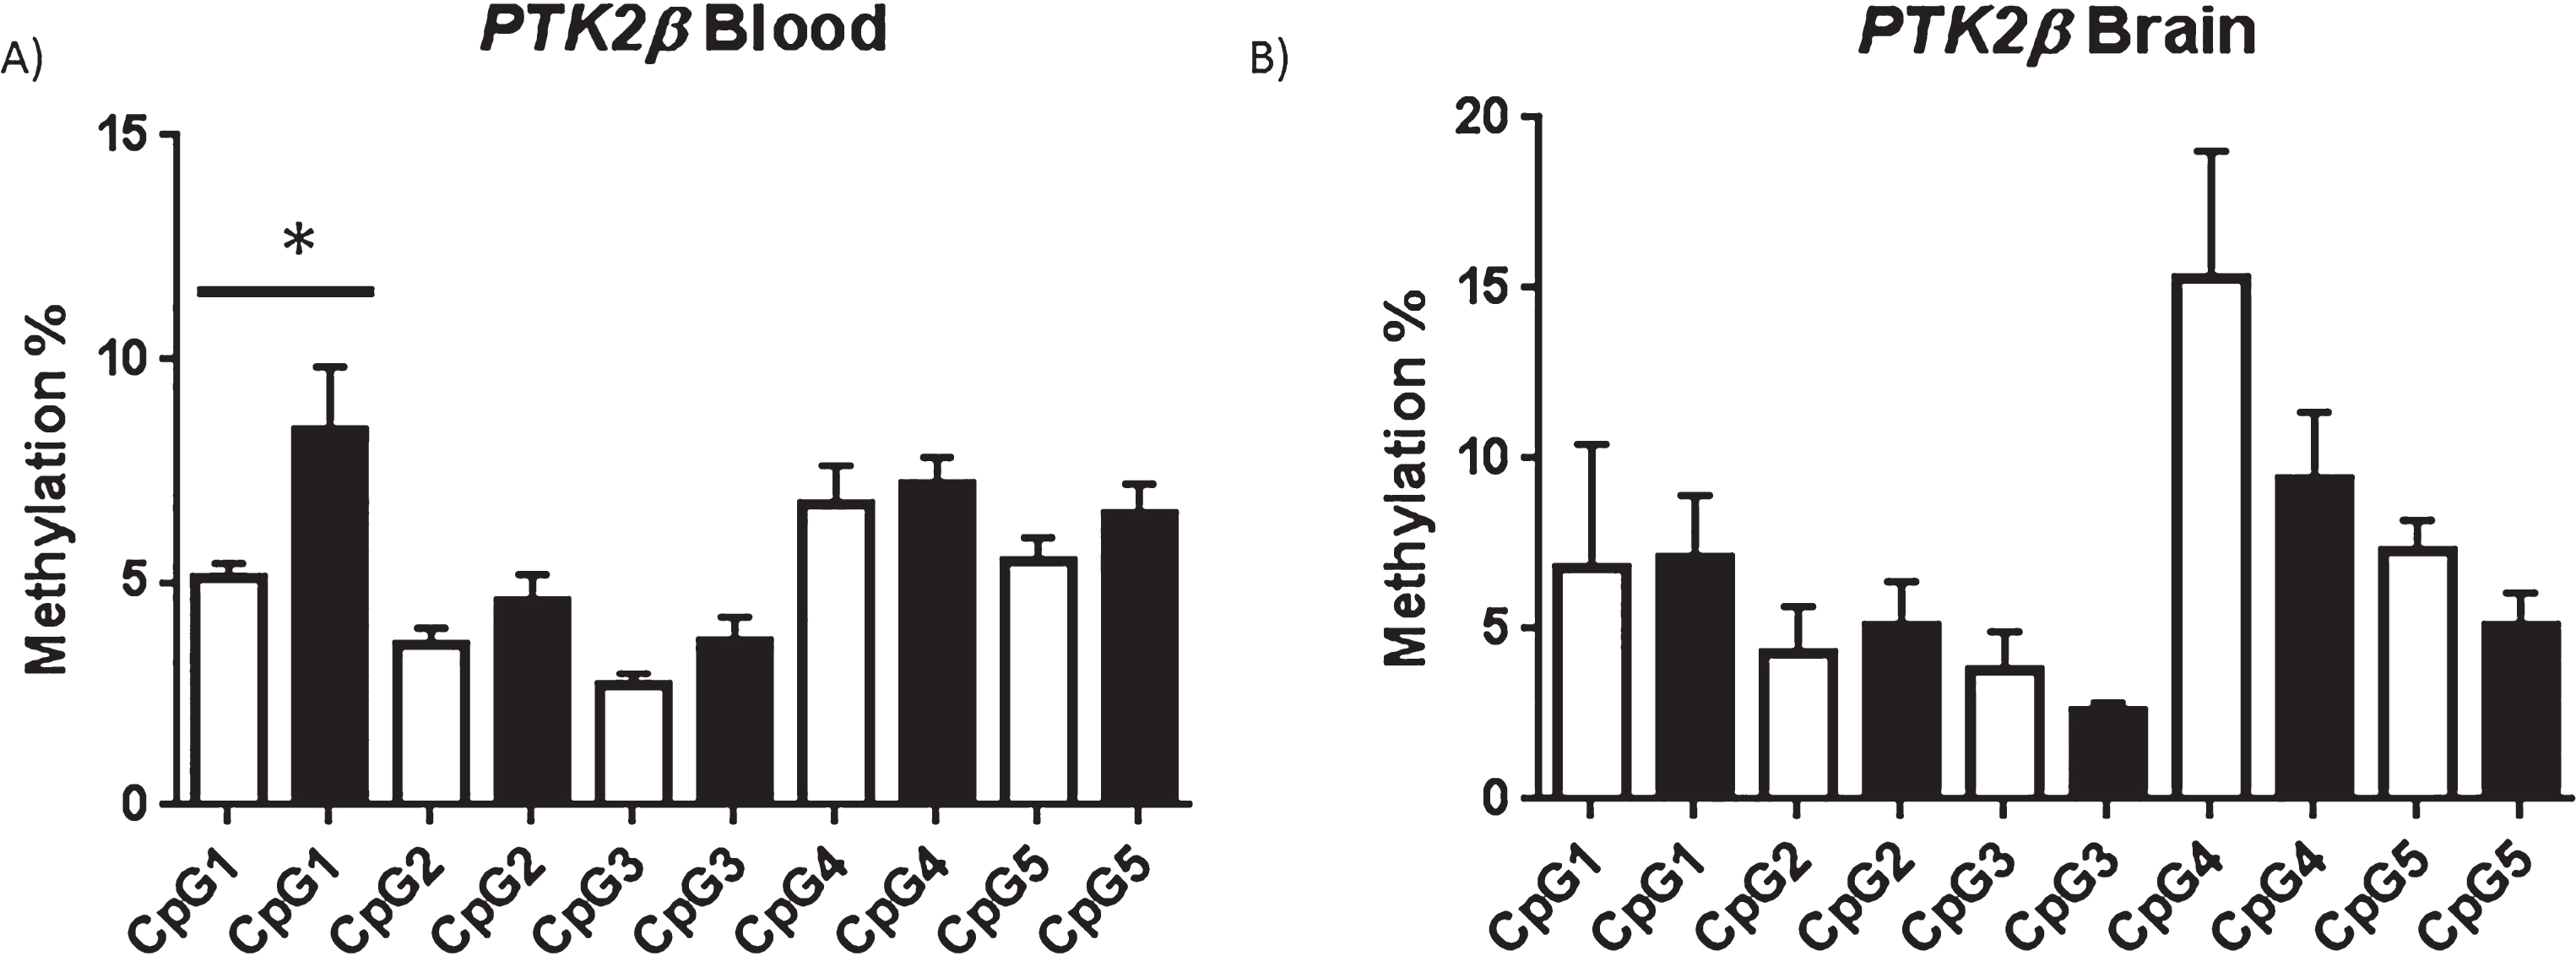
We detected no difference in the average regional level of methylation for each of the four candidate genes tested and no significant difference in methylation was identified for any individual CpG duplet within CpG islands upstream of ABCA7, SIRT1 or MEF2C in either tissue (p > 0.05; Supplementary Figure 3). However, interestingly, one specific CpG site investigated within the PTK2β promoter CGI showed significant hypermethylation in AD blood (p = 0.04) but not AD cortex (p = 0.47) (Fig. 2). The average methylation found at CpG1 in AD blood was 8.4% compared to 5% in control blood. Although statistically significant, and all samples were completed in duplicate, it should be noted that this difference is relatively small [37].
Fig.2
PTK2β shown at resolution of individual CpG: For the target region investigated in the PTK2β promoter CpG1 was found to be significantly hypermethylated in AD Blood but not AD brain. Average methylation at each CpG investigated in controls (white bar) and AD (black bar) in blood (A) and brain (B) is shown, error bars represent S.E.M. *p < 0.05 (one tailed T-test). For blood control n = 6 AD = 5, for brain control n = 3, AD n = 4.
MEF2C Epi-variant CpG upstream of promoter CGI investigated
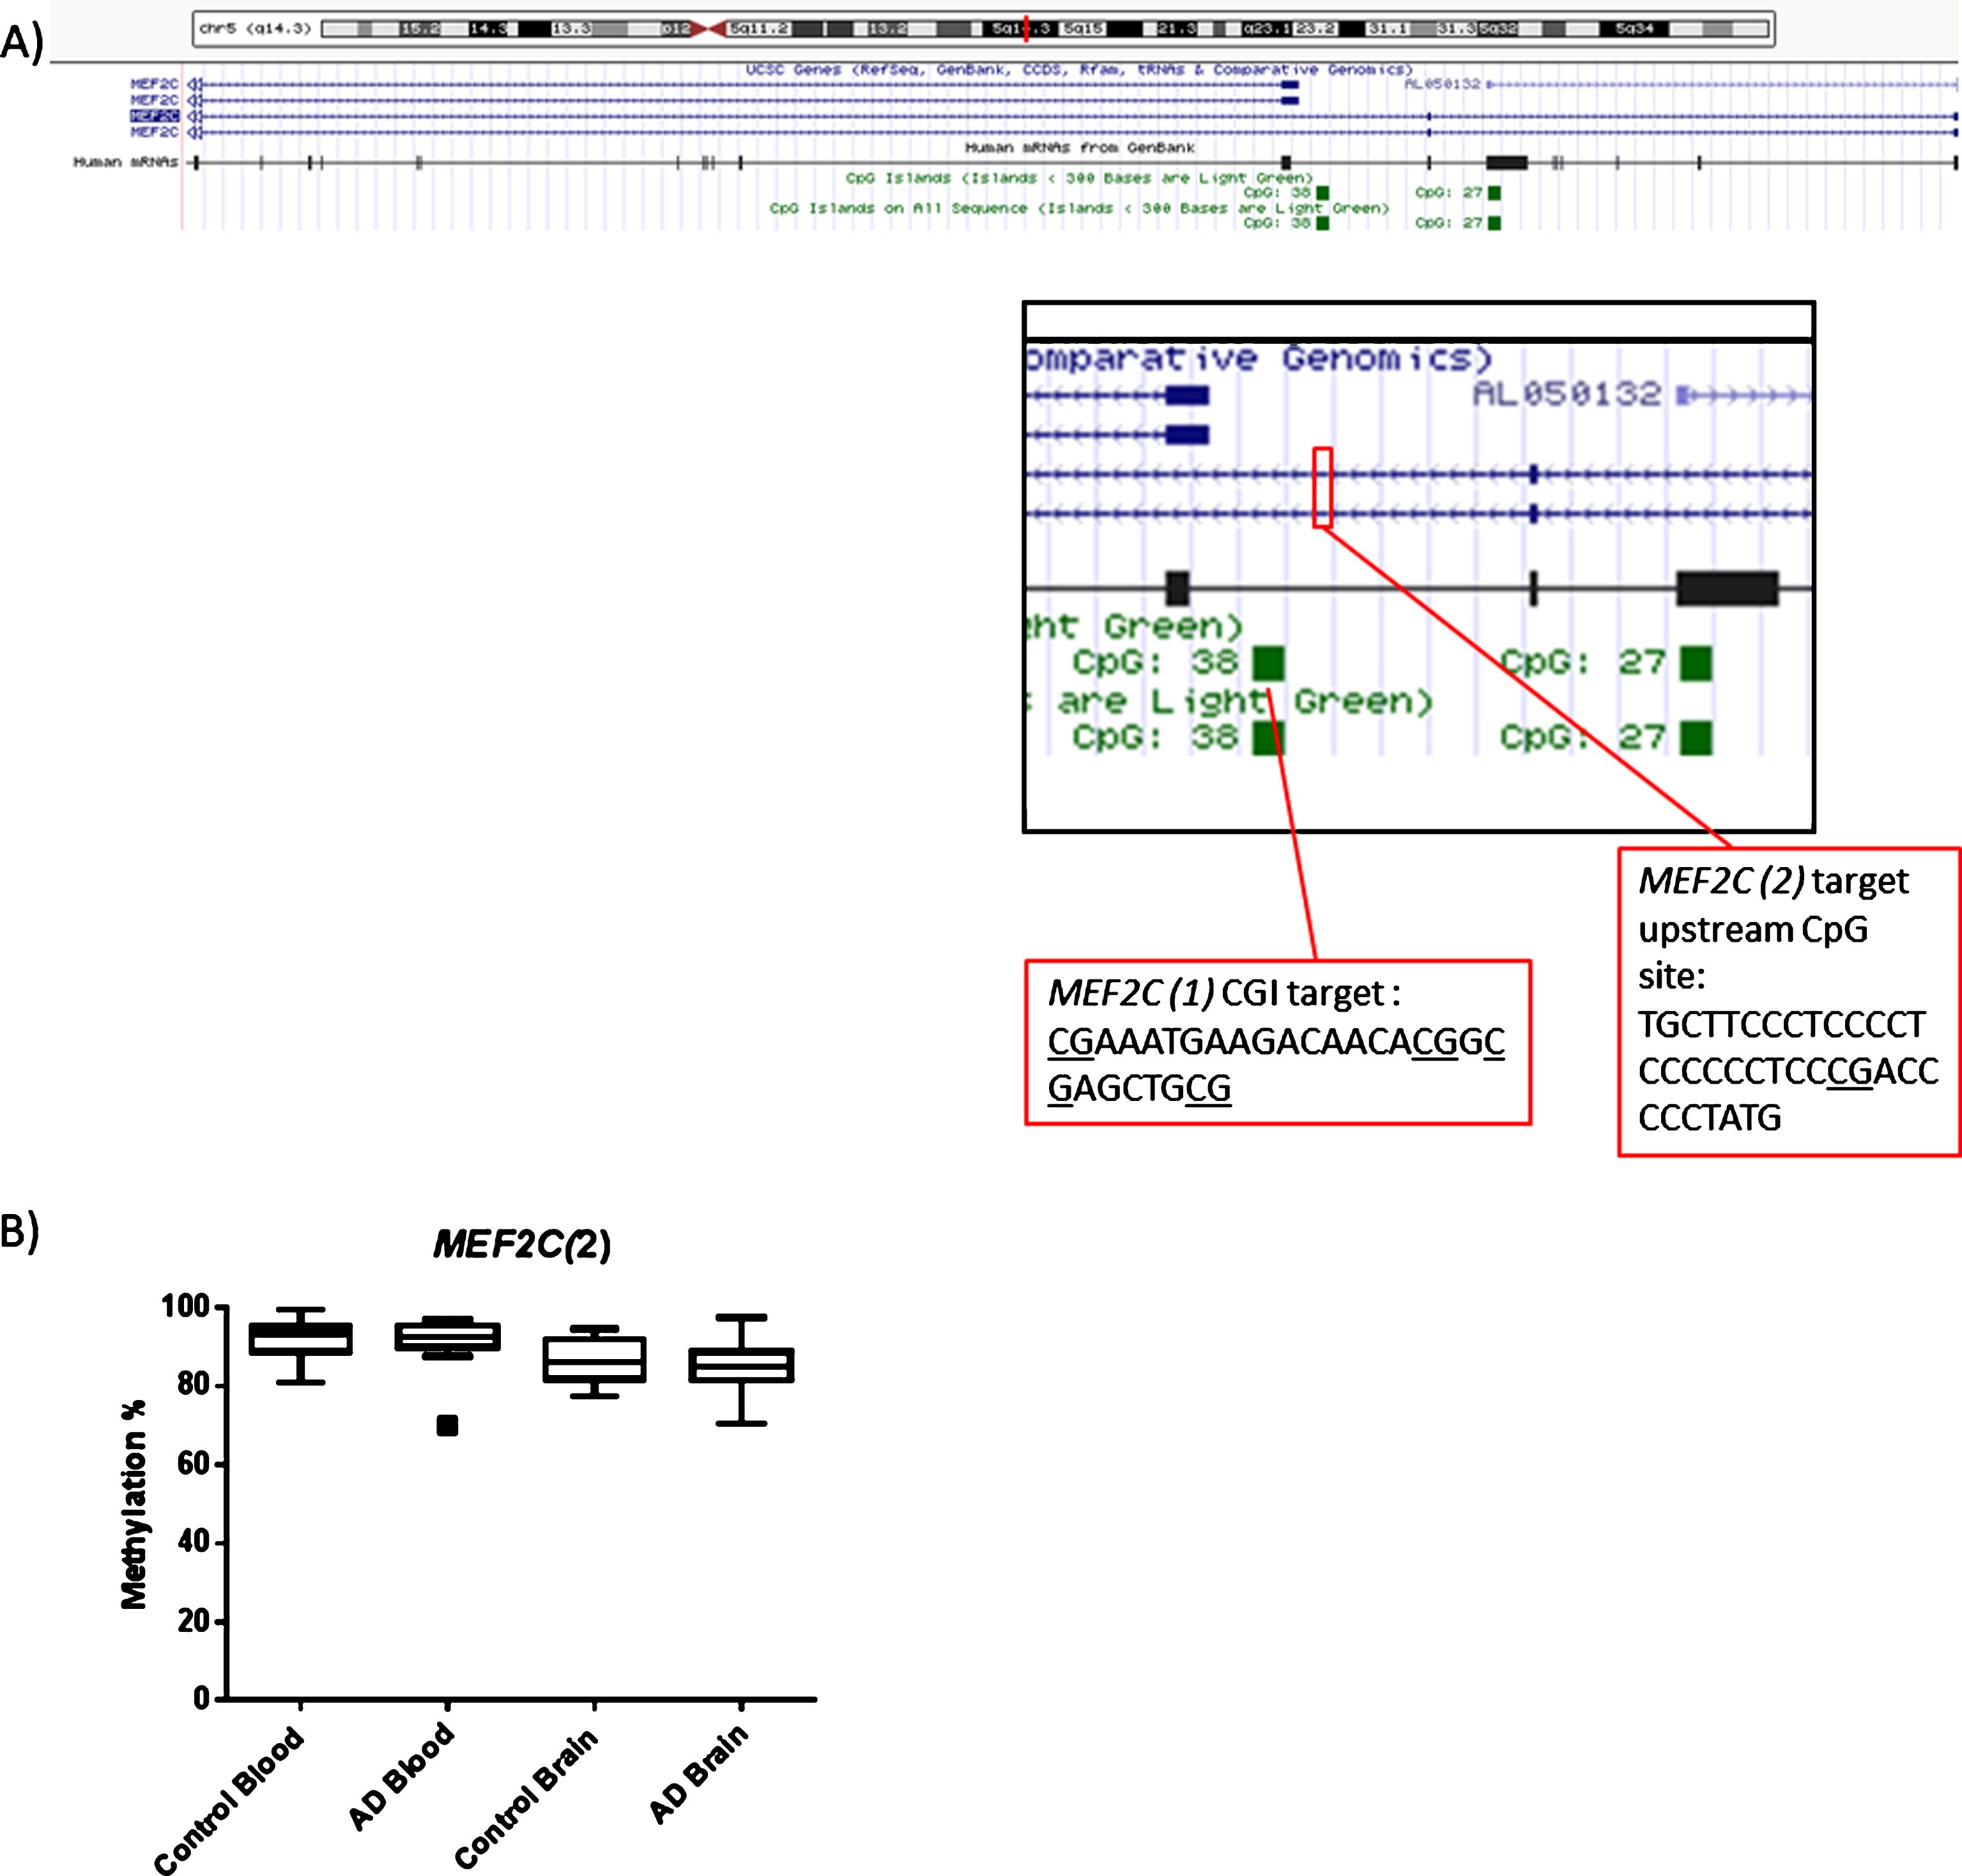
CpGs located within the CpG island upstream of the transcription start site of MEF2C(1), (see Fig. 3), show equivalent levels of methylation between AD and control samples. However, it is plausible that methylation located at other upstream CpGs outside of this location may be crucial in determining either levels of transcription or the structure of the transcript expressed, therefore a further CpG site was targeted (shown as MEF2C(2) in Fig. 3). As a group wide average, there was no evidence of a difference between the AD and control groups in either the blood (p = 0.708) or cortex (p = 0.593) data set (Fig. 3). Average levels of methylation were substantially higher than those of the other genes tested; average methylation of 91% in blood and 86% in brain average. No significant difference in methylation was observed between the tissue types (p > 0.05) (Supplementary Figure 4).
Fig.3
(A) Diagram showing the location of MEF2C(1) and MEF2C(2) targets within the MEF2C gene. (B) In terms of the second region of MEF2C investigated no obvious collective group wide differences between Control and AD at this CpG site were observed. Box plots shows median with 25th and 75th percentile as edges, the whiskers extend to the first quartile minus the interquatile range multiplied by 1.5 and up to the third quartile add the interquartile range time 1.5. Control blood n = 26, AD blood n = 25, Control brain n = 10, AD brain n = 14.
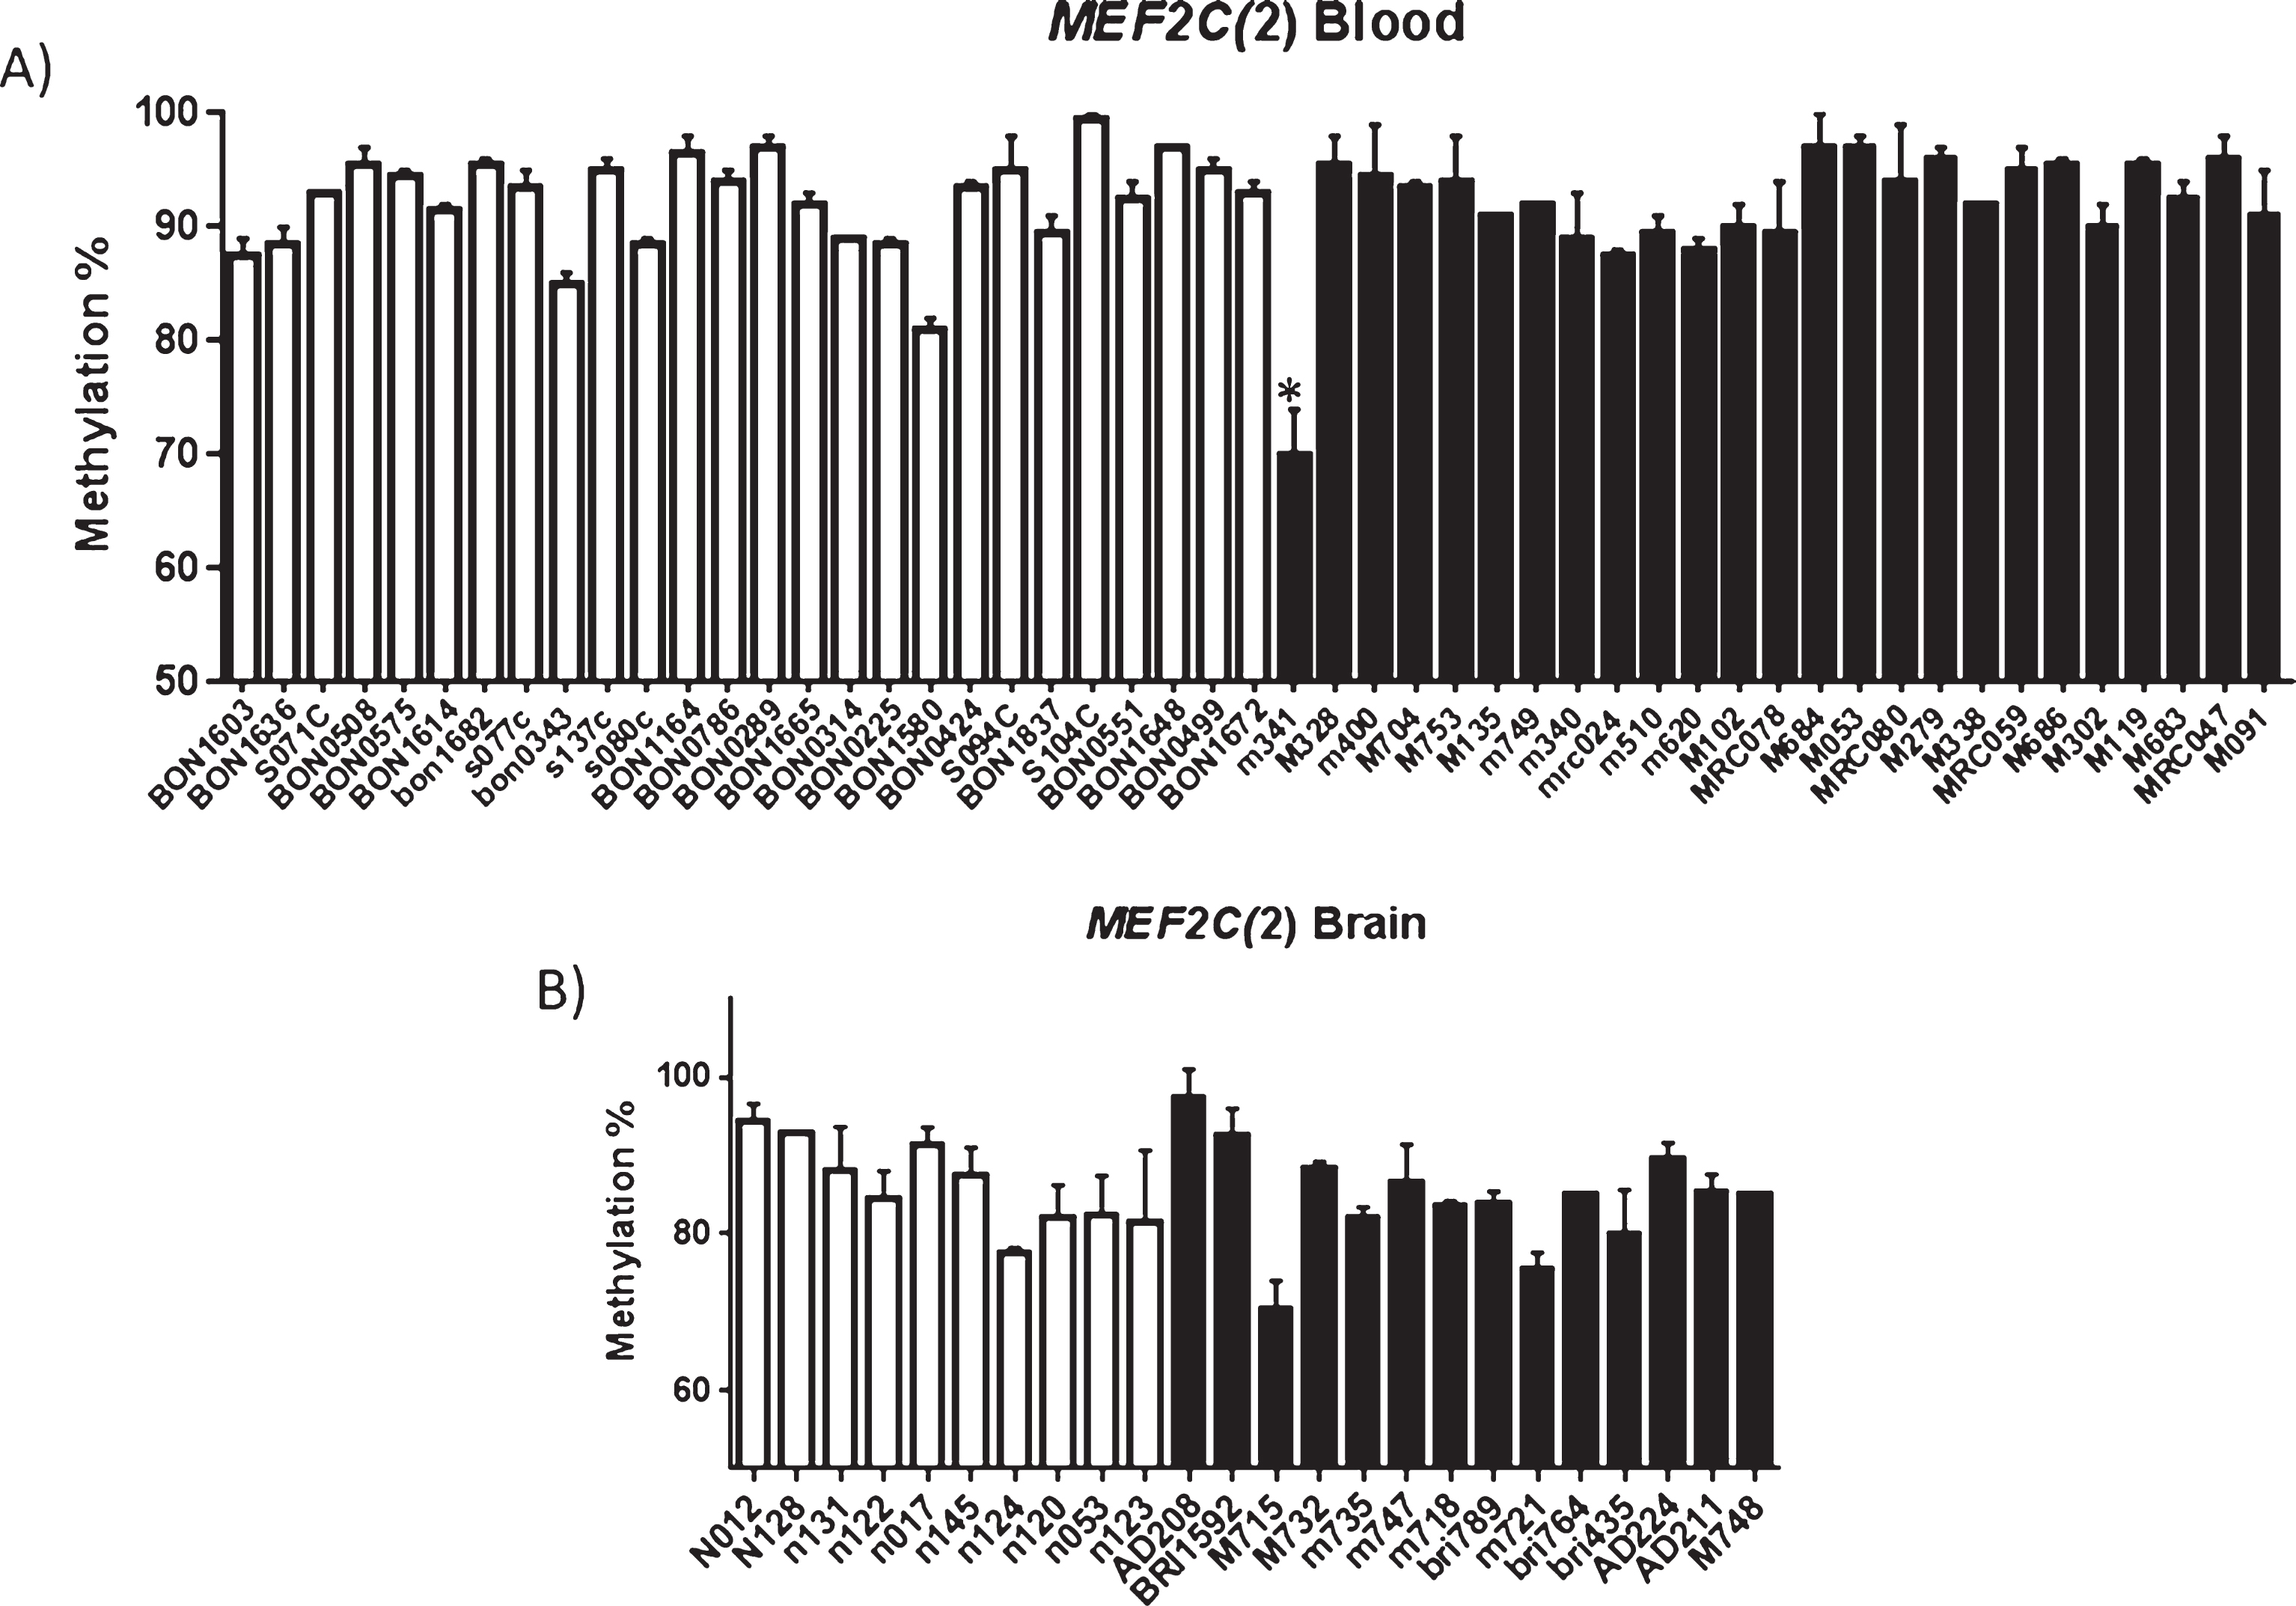
Intriguingly however, we identified a difference in methylation at this CpG in one AD patient blood sample only (Fig. 4). The probability of observing, by chance, a value as low or lower than 70 for the AD group in the blood data was calculated using one-way analyses of variance 2.0E-10. Average methylation at the CpG of 70% was recorded for the individual M341 (blood sample). This represented a 22% reduction in methylation when compared to average methylation in blood at this site in the other samples tested (total n = 51). Average methylation was calculated using data obtained from at least two technical repetitions in order to exclude the possibility of a technical error. It is established that rare genetic differences within this gene can be associated with sEOAD, it could be suggested that rare epigenetic variation at this site may also associate as a risk factor.
Fig.4
(A) Methylation profiling identifies rare individual AD hypomethylation of the upstream MEF2C CpG site. Patient sample M341 showed statistically significant difference in methylation (p = 2.0E-10) when compared to other blood samples (A), statistical significance was not observed for patient M715 in brain (B). A) Shows average methylation at the CpG investigated in each sample investigated (average of at least two runs). Controls are shown in white and AD samples in black. Error bars represent the S.E.M. Control blood = 26, AD blood n = 25, control brain n = 10, AD brain n = 14; Male brain n = 10, Female brain n = 14, Male blood n = 29 0, Female blood n = 22.
In order to eliminate the possibility of a genetic cause of the methylation observed in this experiment, samples were genotyped for the published GWAS SNP; no association with this genotype was found.
RIN3 3’UTR showed significant hypomethylation in AD blood but not AD brain
RIN3 has been proven to interact with the AD associated protein BIN1, which in turn has also been significantly associated with AD via GWAS. This gene has also been shown to be differentially methylated in LOAD with an established link to AD pathology [8, 9, 38]. We chose to investigate a CpG island identified within the 3’UTR of RIN3 (see Supplementary Table 1 and Supplementary Figure 2). Pyrosequencing covered seven CpGs in total within this region (shown in Supplementary Figure 2) and average levels of methylation was calculated for AD blood, control blood, AD brain, and control brain (Fig. 5) across all seven CpGs tested. AD blood samples showed hypomethylation when compared to control blood (see Fig. 5).
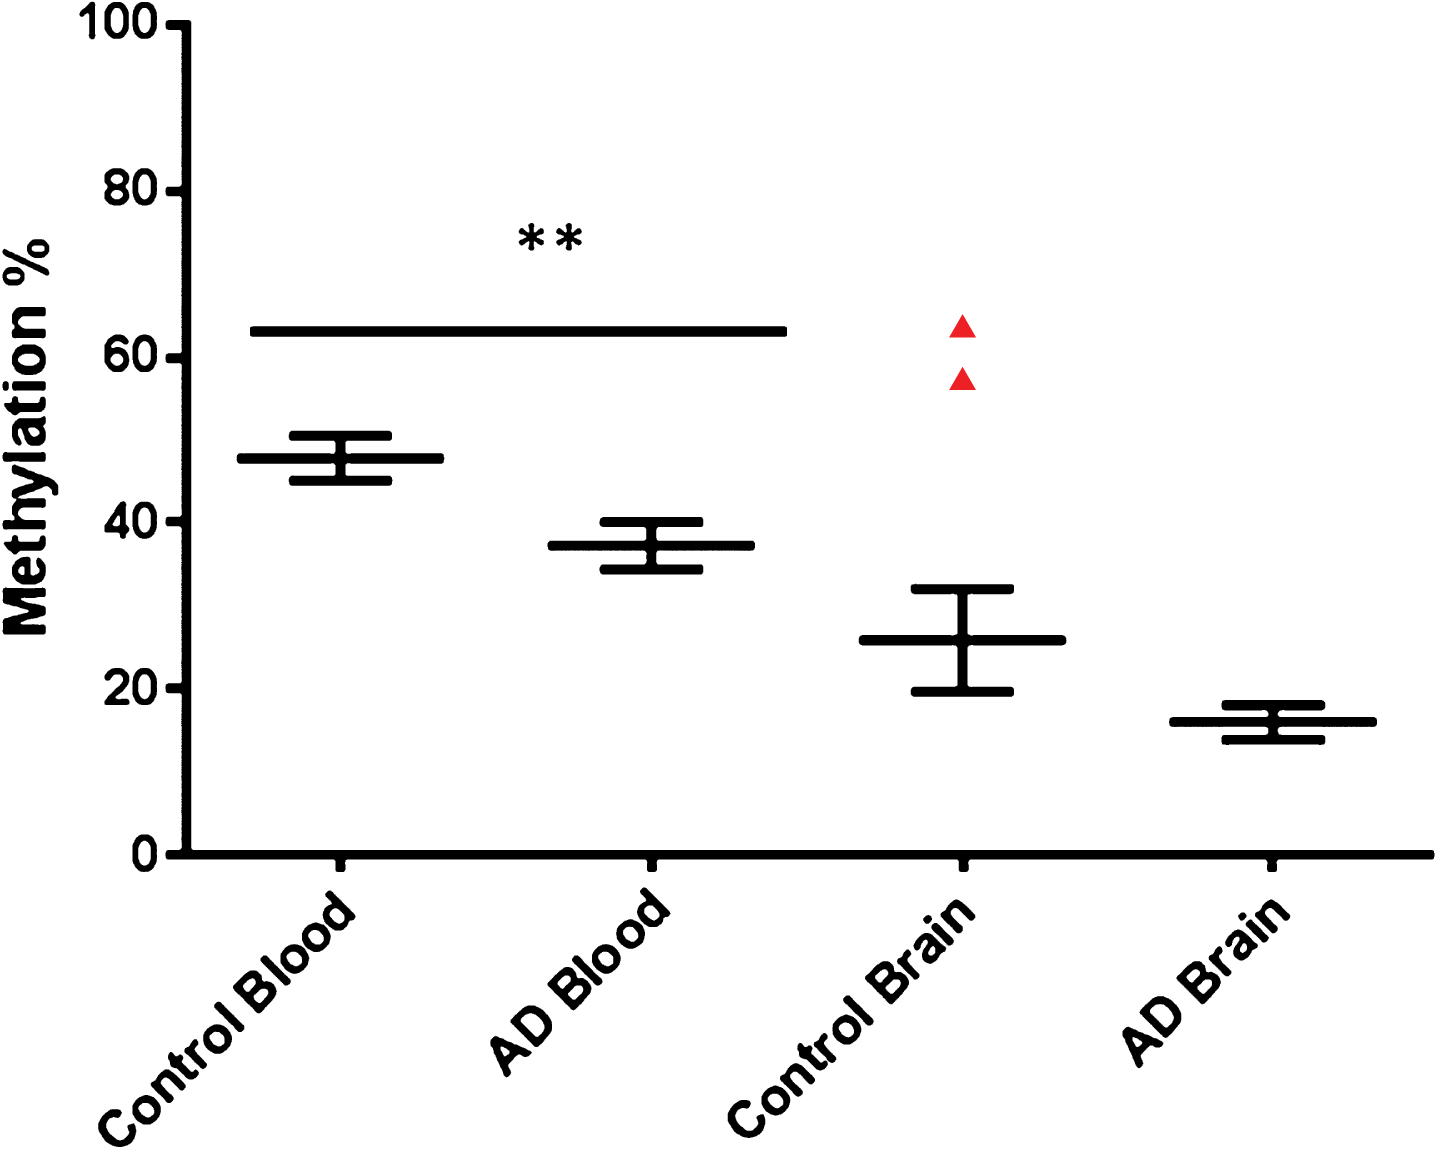
Fig.5
Collective group wide methylation Control versus AD for RIN3. Graph shows average methylation across the whole region investigated in the RIN3 3’UTR. Control blood n = 26, AD blood n = 22, Control brain n = 10, AD brain n = 14. Control blood Male to Female n = 12/14, AD blood Male to Female n = 15/7.
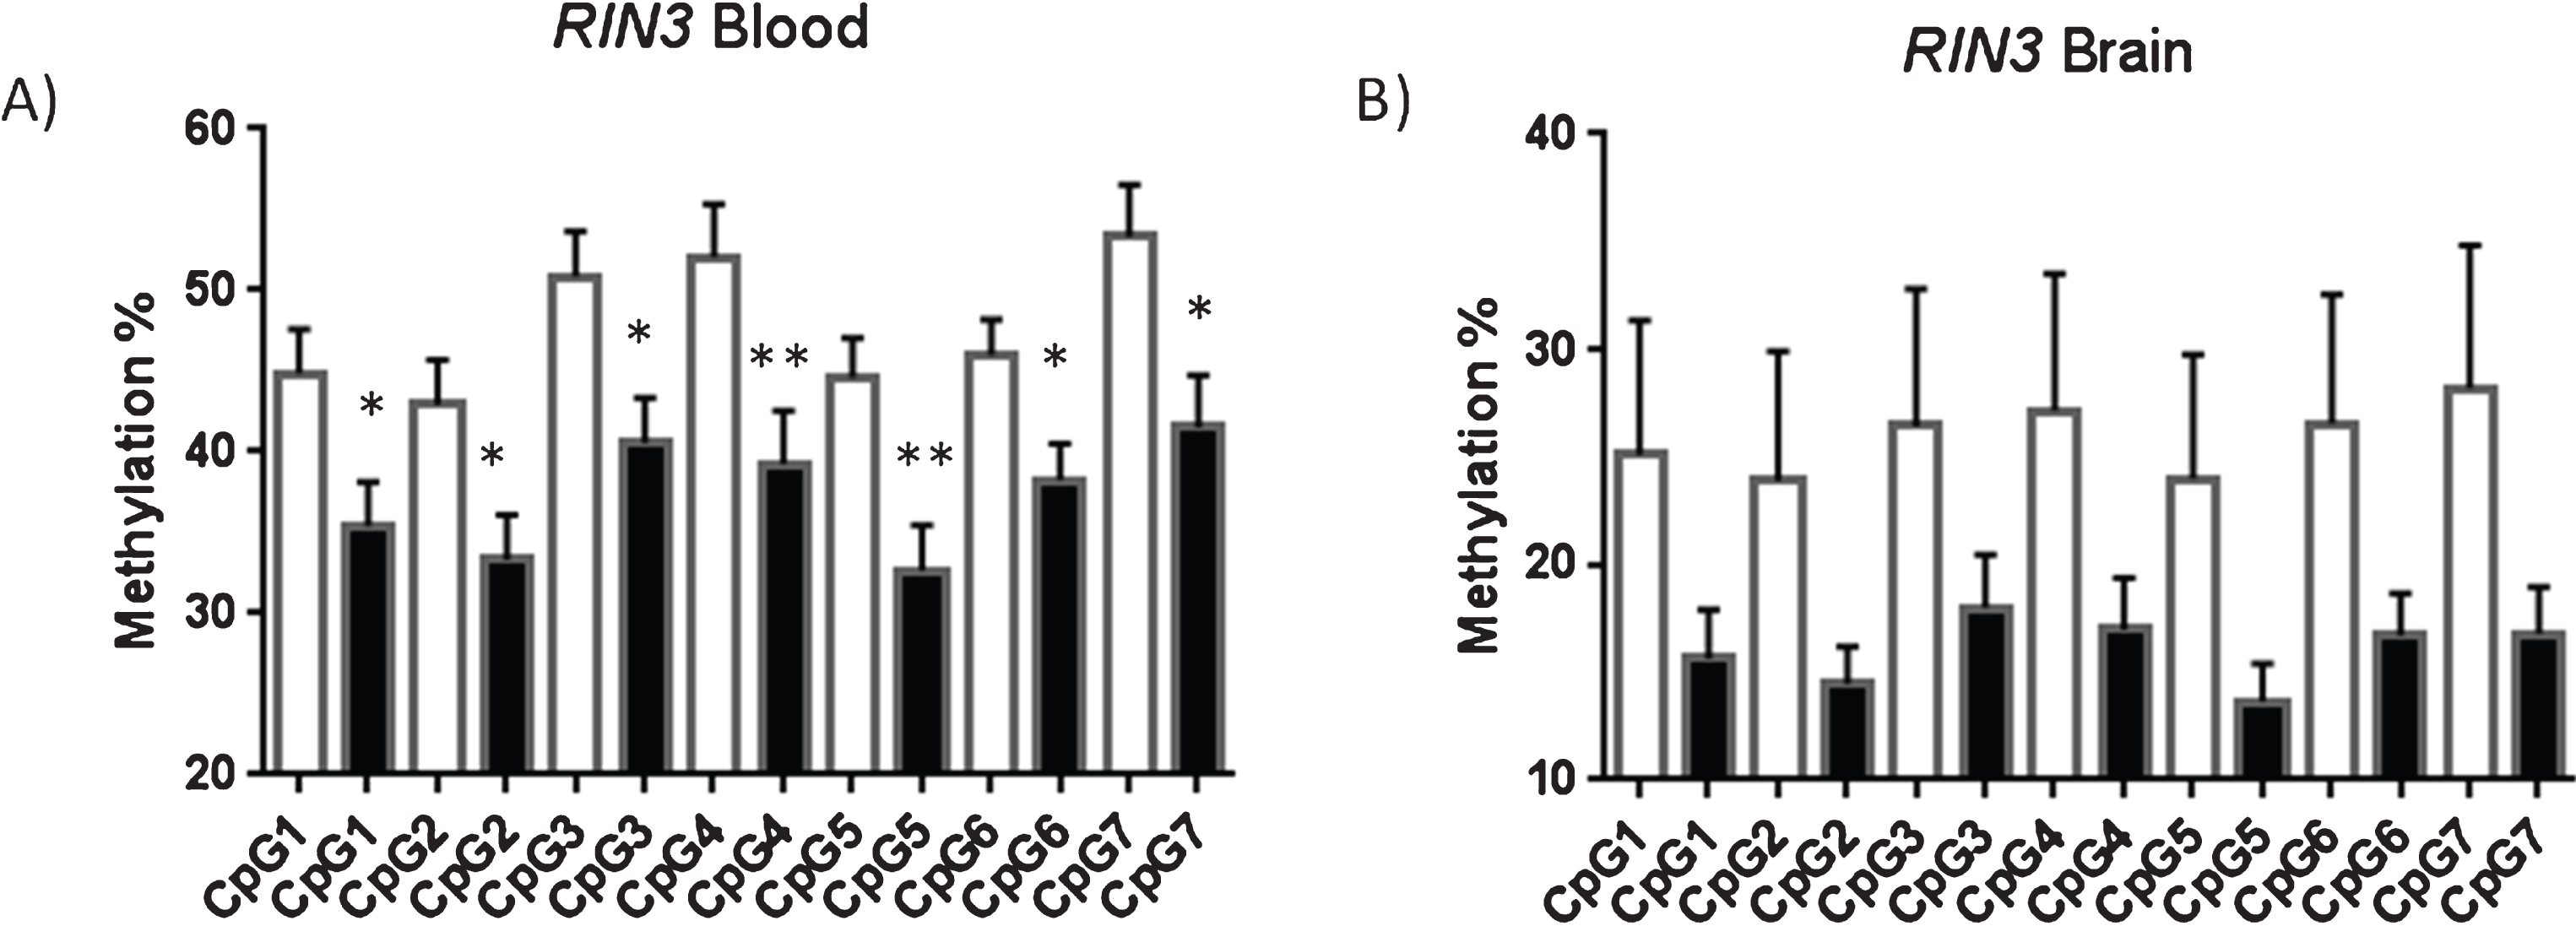
For each of the cytosines CPG1-7 data (Fig. 6) from the blood samples, there was a significant difference between the AD and control group in % methylation (p < 0.05) (CpG1 p = 0.019, CpG2 p = 0.018, CpG3 p = 0.012, CpG4 p = 0.009, CpG5 p = 0.002, CpG6 p = 0.018 and CpG7 p = 0.013, respectively); the AD group being lower than the control for all CPG 1–7 and there were no extreme outliers. The p values from the analyses were also compared to Bonferroni adjusted critical p values of 0.05/7 = 0.007 to adjust for the fact that 7 CGP data-sets were analyzed separately from each individual. CpG5 retained significance (p = 0.002) after strict Bonferroni correction for multiple comparisons, suggesting that aberrant methylation is centered within this region and spreads outwards across neighboring CpGs.
Fig.6
RIN3 Blood and Brain; resolution of each CpG. All of the seven CpG sites investigate in RIN3 were shown to be significantly hypomethylated in AD blood (A) but not brain (B). Showing average methylation found at each CpG site in the RIN3 3’UTR. Control shown as a white bar (blood n = 26, brain n = 10) and AD (blood n = 22, brain n = 14) shown as a black bar. Error bars represent S.E.M.
There was no evidence (p > 0.05) of a difference between groups in % methylation for any of the cytosines CPG1-7 from the brain samples. Average methylation across this region in control blood was 47.8% while average methylation in AD blood was 37.29% a reduction of 10%. No significant difference in average methylation was detected between AD brain and control brain. No link with gender was identified for overall levels of methylation at the RIN3 site; no aggregate difference could be detected between male and female samples for either blood or brain (see Supplementary Figure 6).
Tissue specific hypomethylation was observed in AD brain
Having established that in some instances comparative regional differences in methylation may be specific to AD patients, we chose to compare relative levels of methylation between tissues tested in this study. No significant difference in methylation was observed between tissues in either control or AD samples (Supplementary Figure 5) for AD and Control PTK2β (p = 0.42; p = 0.1), ABCA7 (p = 0.43; p = 0.46), SIRT1 (p = 0.06; p = 0.24), and MEF2C(1) (p = 0.33; p = 0.37) (these are the p values using one-tailed T-tests, two tailed are, for AD and control PTK2β (p = 0.85: p = 0.2), ABCA7 (p = 0.87; p = 0.9), SIRT1 (p = 0.13; p = 0.49), and MEF2C(1) (p = 0.66; p = 0.73). However, within the RIN3 3’UTR region of blood DNA was significantly hypermethylated in both AD and control blood when compared to AD and control brain (Supplementary Figure 7). Hypomethylation was also observed in brain tissue for the MEF2C(2) site tested (Supplementary Figure 4).
DISCUSSION
Much resource has been committed to investigating the pathogenesis of LOAD, however a comprehensive understanding of sEOAD has thus far remained elusive; it is likely that new ways of understanding drivers of sEOAD are required. Although a number of genes have been identified as drivers or causal to LOAD and fAD, those genes and associated pathways do not necessarily explain the underlying causes of sEOAD. We propose that aberrant epigenetic regulation contributes at least in part to this process for some individuals. Uncontrolled or dysregulation of a number of varied gene pathways or processes has been implicated in neurodegeneration; therefore, it is plausible that aberrant regulation of one of many genes may exacerbate pathogenesis [5].
Methylation of the SIRT1 promoter in LOAD patient samples has been previously reported by Hou et al. [13]; we therefore chose to test if equivalent methylation could also be detected in sEOAD samples. It could be suggested that due to the core similarities of disease progression between AD sub-types, any epigenetic markers which are a feature of LOAD would be matched in sEOAD. Surprisingly we found no evidence of variation in levels of methylation between sEOAD samples and controls. This suggests that the methylation directed regulation of SIRT1 is not impaired in the process of sEOAD, and the sEOAD epigenome is distinct from LOAD in at least some instances. It is not obvious how this difference impacts on the development of sEOAD, although given the role of SIRT1 in attenuating toxicities of both tau and amyloid it is likely to have some influence on the progression of disease. Further research is required to investigate the consequence of SIRT1 regulation in both conditions.
Within our test group, we identified that the gene MEF2C was significantly hypomethylated in comparison to controls for only two individuals presenting with sEOAD. As an aggregate no group-wide differences could be detected, however we observed two individuals with pronounced differences in methylation within a key regulatory region of this gene (22% and 15% lower in blood and brain, respectively). The aberrant epigenetic marks recorded for this gene in this study may represent an example of a rare epi-variant risk factors existing within the population that accentuates the risk of developing sEOAD. Changes in epialleles can occur as very rare events within large populations and can have profound effects on morphology or phenotype [39]. It is therefore a valid hypothesis to suggest that if the expression of the affected gene links with disease pathogenesis and levels of methylation controlling expression are altered, then this change methylation can alter the risk at the level of the individual however infrequently this may occur within a population. We evaluated the possibility that methylation at this site correlates with a known genetic risk factors however upon analysis hypomethylation did not correlate to this particular genotype.
Where tested, we observed group wide differences in the levels of promoter methylation at the RIN3 locus between sEOAD and control samples. Intriguingly statistically significant differences in the levels of methylation were not limited to one CpG, but span a number of CpGs located within this region. The group-wide nature of these epi-polymorphisms suggests that the condition of sEOAD leads to changes in methylation at the RIN3 locus rather than being a rarer spontaneous causative driver of disease. The equivalence in both tissue samples also supports this hypothesis, e.g., it is likely that the levels of methylation identified in leukocyte DNA are reflective of AD pathology experienced as these cells transit through the brain. Methylation of these sites is therefore likely driven by the environment of the diseased tissue, rather than methylation being causative of the disease.
The consequence of changes in the levels of methylation located with the 3’UTR of RIN3 is unclear. RIN3 is known to associate with BIN1 and links with the process of endocytosis and Aβ processing; therefore, it is plausible that any change that impacts on regulation could exacerbate the progression of AD. One hypothesis is that the AD brain ramps up the production of RIN3 in response to the amyloid environment via demethylation of the 3’UTR region; increased methylation within 3’UTRs associates with reduced expression in reporter assay tests [33]. This is supported by the relative hypomethylation we observed in AD brain relative to blood. This may suggest a direct correlation between the length of exposure to the amyloid environment and levels of methylation for RIN3. Further experiments will be required to determine the consequence of 3’UTR methylation on levels of gene expression and ultimately to sEOAD pathogenesis.
Our data suggests that differences in methylation may mark the development of sEOAD. Epigenetic regulation of regions other than promoters can be aberrantly methylated in sEOAD patients promoting, initiating or driving AD pathology, suggesting that changes in epigenetic marks are a feature of the development of sEOAD. The ability to detect variations in blood allows for the testing of a large numbers of blood samples to further explore this hypothesis; an option not available if the effects manifest only in the brain epi-genome.
Details for ARUK Consortium
David M. Mann1, Peter Passmore2, David Craig2, Janet Johnston2, Bernadette McGuinness2, Stephen Todd2, Reinhard Heun3, Heike Kölsch4, Patrick G. Kehoe5, Emma R.L.C. Vardy6, Nigel M. Hooper1, Stuart Pickering-Brown1, Julie Snowden9, Anna Richardson7, Matt Jones7, David Neary7, Jenny Harris7, Christopher Medway1, James Lowe1, A. David Smith8, Gordon Wilcock8, Donald Warden8, Clive Holmes9.
1Institute of Brain, Behaviour and Mental Health, Faculty of Medical and Human Sciences, University of Manchester, Manchester, UK; 2Centre for Public Health, School of Medicine, Queen’s University Belfast, UK; 3Royal Derby Hospital, Derby, UK; 4Department of Psychiatry, University of Bonn, Bonn, Germany; 5School of Clinical Sciences, John James Laboratories, University of Bristol, Bristol, UK; 6Salford Royal NHS Foundation Trust; 7Cerebral Function Unit, Greater Manchester Neurosciences Centre, Salford Royal Hospital, Stott Lane, Salford, UK; 8University of Oxford (OPTIMA), Oxford, UK; 9Clinical and Experimental Science, University of Southampton, Southampton, UK.
CONFLICT OF INTEREST
The authors have no conflict of interest to report.
ACKNOWLEDGMENTS
This work was funded and supported by the Biotechnology and Biological Sciences Research Council (BBSRC) Doctoral Training Partnership.
SUPPLEMENTARY MATERIAL
[1] The supplementary material is available in the electronic version of this article: http://dx.doi.org/10.3233/ADR-170015.
REFERENCES
[1] | Bekris LM , Yu C-E , Bird TD , Tsuang DW ((2010) ) Review article: Genetics of Alzheimer disease. J Geriatr Psychiatry Neurol 23: , 213–227. |
[2] | Minati L , Edginton T , Bruzzone MG , Giaccone G ((2009) ) Current concepts in Alzheimer’s disease: A multidisciplinary review. Am J Alzheimers Dis Other Demen 24: , 95–121. |
[3] | Van Cauwenberghe C , Van Broeckhoven C , Sleegers K ((2016) ) The genetic landscape of Alzheimer disease: Clinical implications and perspectives. Genet Med 18: , 421–430. |
[4] | van der Flier WM , Pijnenburg YAL , Fox NC , Scheltens P ((2011) ) Early-onset versus late-onset Alzheimer’s disease: The case of the missing APOE epsilon 4 allele. Lancet Neurol 10: , 280–288. |
[5] | Antonell A , Llado A , Altirriba J , Botta-Orfila T , Balasa M , Fernandez M , Ferrer I , Sanchez-Valle R , Molinuevo JL ((2013) ) A preliminary study of the whole-genome expression profile of sporadic and monogenic early-onset Alzheimer’s disease. Neurobiol Aging 34: , 1772–1778. |
[6] | Karch CM , Goate AM ((2015) ) Alzheimer’s disease risk genes and mechanisms of disease pathogenesis. Biol Psychiatry 77: , 43–51. |
[7] | Wang SC , Oelze B , Schumacher A ((2008) ) Age-specific epigeneticdrift in late-onset Alzheimer’s disease. PLos One 3: , e2698. |
[8] | De Jager PL , Srivastava G , Lunnon K , Burgess J , Schalkwyk LC , Yu L , Eaton ML , Keenan BT , Ernst J , McCabe C , Tang AN , Raj T , Replogle J , Brodeur W , Gabriel S , Chai HS , Younkin C , Younkin SG , Zou FG , Szyf M , Epstein CB , Schneider JA , Bernstein BE , Meissner A , Ertekin-Taner N , Chibnik LB , Kellis M , Mill J , Bennett DA ((2014) ) Alzheimer’s disease: Early alterations in brain DNA methylation at ANK1, BIN1, RHBDF2 and other loci. Nat Neurosci 17: , 1156–1163. |
[9] | Yu L , Chibnik LB , Srivastava GP , Pochet N , Yang J , Xu J , Kozubek J , Obholzer N , Leurgans SE , Schneider JA , Meissner A , De Jager PL , Bennett DA ((2015) ) Association of brain DNA methylation in SORL1, ABCA7, HLA-DRB5, SLC24A4, and BIN1 with pathological diagnosis of Alzheimer disease. JAMA Neurol 72: , 15–24. |
[10] | Lunnon K , Smith R , Hannon E , De Jager PL , Srivastava G , Volta M , Troakes C , Al-Sarraj S , Burrage J , Macdonald R , Condliffe D , Harries LW , Katsel P , Haroutunian V , Kaminsky Z , Joachim C , Powell J , Lovestone S , Bennett DA , Schalkwyk LC , Mill J ((2014) ) Methylomic profiling implicates cortical deregulation of ANK1 in Alzheimer’s disease. Nat Neurosci 17: , 1164–1170. |
[11] | Chouliaras L , Mastroeni D , Delvaux E , Grover A , Kenis G , Hof PR , Steinbusch HWM , Coleman PD , Rutten BPF , van den Hove LA ((2013) ) Consistent decrease in global DNA methylation andhydroxymethylation in the hippocampus of Alzheimer’s diseasepatients. Neurobiol Aging 34: , 2091–2099. |
[12] | Coppieters N , Dieriks BV , Lill C , Faull RLM , Curtis MA , Dragunow M ((2014) ) Global changes in DNA methylation and hydroxymethylation in Alzheimer’s disease human brain. Neurobiol Aging 35: , 1334–1344. |
[13] | Hou YP , Chen HY , He Q , Jiang W , Luo T , Duan JH , Mu N , He YS , Wang HQ ((2013) ) Changes in methylation patterns of multiple genes from peripheral blood leucocytes of Alzheimer’s disease patients. Acta Neuropsychiatr 25: , 66–76. |
[14] | Iwata A , Nagata K , Hatsuta H , Takuma H , Bundo M , Iwamoto K , Tamaoka A , Murayama S , Saido T , Tsuji S ((2014) ) Altered CpG methylation in sporadic Alzheimer’s disease is associated with APP and MAPT dysregulation. Hum Mol Genet 23: , 648–656. |
[15] | West RL , Lee JM , Maroun LE ((1995) ) Hypomethylation of the amyloidprecursor protein gene in the brain of an Alzheimer’s diseasepatient. J Mol Neurosci 6: , 141–146. |
[16] | Feinberg AP , Irizarry RA , Fradin D , Aryee MJ , Murakami P , Aspelund T , Eiriksdottir G , Harris TB , Launer L , Gudnason V , Fallin MD ((2010) ) Personalized epigenomic signatures that are stable over time and covary with body mass index. Sci Transl Med 2: , 49ra67. |
[17] | Feinberg AP , Irizarry RA ((2010) ) Evolution in health and medicineSackler colloquium: Stochastic epigenetic variation as a drivingforce of development, evolutionary adaptation, and disease. Proc Natl Acad Sci U S A 107: (Suppl 1), 1757–1764. |
[18] | Lambert JC , Ibrahim-Verbaas CA , Harold D , Naj AC , Sims R , Bellenguez C , DeStafano AL , Bis JC , Beecham GW , Grenier-Boley B , Russo G , Thorton-Wells TA , Jones N , Smith AV , Chouraki V , Thomas C , Ikram MA , Zelenika D , Vardarajan BN , Kamatani Y , Lin CF , Gerrish A , Schmidt H , Kunkle B , Dunstan ML , Ruiz A , Bihoreau MT , Choi SH , Reitz C , Pasquier F , Cruchaga C , Craig D , Amin N , Berr C , Lopez OL , De Jager PL , Deramecourt V , Johnston JA , Evans D , Lovestone S , Letenneur L , Morón FJ , Rubinsztein DC , Eiriksdottir G , Sleegers K , Goate AM , Fiévet N , Huentelman MW , Gill M , Brown K , Kamboh MI , Keller L , Barberger-Gateau P , McGuiness B , Larson EB , Green R , Myers AJ , Dufouil C , Todd S , Wallon D , Love S , Rogaeva E , Gallacher J , St George-Hyslop P , Clarimon J , Lleo A , Bayer A , Tsuang DW , Yu L , Tsolaki M , Bossú P , Spalletta G , Proitsi P , Collinge J , Sorbi S , Sanchez-Garcia F , Fox NC , Hardy J , Deniz Naranjo MC , Bosco P , Clarke R , Brayne C , Galimberti D , Mancuso M , Matthews F , European Alzheimer’s Disease Initiative (EADI), Genetic and Environmental Risk in Alzheimer’s Disease, Alzheimer’s Disease Genetic Consortium, Cohorts for Heart and Aging Research in Genomic Epidemiology, Moebus S , Mecocci P , Del Zompo M , Maier W , Hampel H , Pilotto A , Bullido M , Panza F , Caffarra P , Nacmias B , Gilbert JR , Mayhaus M , Lannefelt L , Hakonarson H , Pichler S , Carrasquillo MM , Ingelsson M , Beekly D , Alvarez V , Zou F , Valladares O , Younkin SG , Coto E , Hamilton-Nelson KL , Gu W , Razquin C , Pastor P , Mateo I , Owen MJ , Faber KM , Jonsson PV , Combarros O , O’Donovan MC , Cantwell LB , Soininen H , Blacker D , Mead S , Mosley TH Jr , Bennett DA , Harris TB , Fratiglioni L , Holmes C , de Bruijn RF , Passmore P , Montine TJ , Bettens K , Rotter JI , Brice A , Morgan K , Foroud TM , Kukull WA , Hannequin D , Powell JF , Nalls MA , Ritchie K , Lunetta KL , Kauwe JS , Boerwinkle E , Riemenschneider M , Boada M , Hiltuenen M , Martin ER , Schmidt R , Rujescu D , Wang LS , Dartigues JF , Mayeux R , Tzourio C , Hofman A , Nöthen MM , Graff C , Psaty BM , Jones L , Haines JL , Holmans PA , Lathrop M , Pericak-Vance MA , Launer LJ , Farrer LA , van Duijn CM , Van Broeckhoven C , Moskvina V , Seshadri S , Williams J , Schellenberg GD , Amouyel P ((2013) ) Meta-analysis of 74,046 individuals identifies 11 new susceptibility loci for Alzheimer’s disease. Nat Genet 45: , 1452–1458. |
[19] | Lev S , Moreno H , Martinez R , Canoll P , Peles E , Musacchio JM , Plowman GD , Rudy B , Schlessinger J ((1995) ) Protein-tyrosine kinasePYK2 involved in Ca2+-induced regulation of ion-channel and MAPkinase functions. Nature 376: , 737–745. |
[20] | Otero K , Turnbull IR , Poliani PL , Vermi W , Cerutti E , Aoshi T , Tassi I , Takai T , Stanley SL , Miller M ((2009) ) Macrophage colony-stimulating factor induces the proliferation and survival of macrophages via a pathway involving DAP12 and β-catenin. Nat Immunol 10: , 734–743. |
[21] | Tanaka N , Abe-Dohmae S , Iwamoto N , Yokoyama S ((2011) ) Roles of ATP-binding cassette transporter A7 in cholesterol homeostasis and host defense system. J Atheroscler Thromb 18: , 274–281. |
[22] | Chan SL , Kim WS , Kwok JB , Hill AF , Cappai R , Rye KA , Garner B ((2008) ) ATP-binding cassette transporter A7 regulates processing of amyloid precursor protein in vitro. J Neurochem 106: , 793–804. |
[23] | Kim WS , Li HY , Ruberu K , Chan S , Elliott DA , Low JK , Cheng D , Karl T , Garner B ((2013) ) Deletion of Abca7 increases cerebral amyloid-beta accumulation in the J20 mouse model of Alzheimer’s disease. J Neurosci 33: , 4387–4394. |
[24] | Akhtar MW , Kim MS , Adachi M , Morris MJ , Qi XX , Richardson JA , Bassel-Duby R , Olson EN , Kavalali ET , Monteggia LM ((2012) ) In vivoanalysis of MEF2 transcription factors in synapse regulation andneuronal survival. PLoS One 7: , e34863. |
[25] | Gao J , Wang WY , Mao YW , Graff J , Guan JS , Pan L , Mak G , Kim D , Su SC , Tsai LH ((2010) ) A novel pathway regulates memory and plasticity via SIRT1 and miR-134. Nature 466: , 1105–1109. |
[26] | Julien C , Tremblay C , Emond V , Lebbadi M , Salem N Jr , Bennett DA , Calon F ((2009) ) Sirtuin 1 reduction parallels the accumulation of tau in Alzheimer disease. J Neuropathol Exp Neurol 68: , 48–58. |
[27] | Michan S , Li Y , Chou MM , Parrella E , Ge H , Long JM , Allard JS , Lewis K , Miller M , Xu W , Mervis RF , Chen J , Guerin KI , Smith LE , McBurney MW , Sinclair DA , Baudry M , de Cabo R , Longo VD ((2010) ) SIRT1 is essential for normal cognitive function and synaptic plasticity. J Neurosci 30: , 9695–9707. |
[28] | Min SW , Cho SH , Zhou Y , Schroeder S , Haroutunian V , Seeley WW , Huang EJ , Shen Y , Masliah E , Mukherjee C , Meyers D , Cole PA , Ott M , Gan L ((2010) ) Acetylation of tau inhibits its degradation and contributes to tauopathy. Neuron 67: , 953–966. |
[29] | Tan MS , Yu JT , Tan L ((2013) ) Bridging integrator 1 (BIN1): Form, function, and Alzheimer’s disease. Trends Mol Med 19: , 594–603. |
[30] | Kajiho H , Saito K , Tsujita K , Kontani K , Araki Y , Kurosu H , Katada T ((2003) ) RIN3: A novel Rab5 GEF interacting with amphiphysin II involved in the early endocytic pathway. J Cell Sci 116: , 4159–4168. |
[31] | Treusch S , Hamamichi S , Goodman JL , Matlack KE , Chung CY , Baru V , Shulman JM , Parrado A , Bevis BJ , Valastyan JS , Han H , Lindhagen-Persson M , Reiman EM , Evans DA , Bennett DA , Olofsson A , DeJager PL , Tanzi RE , Caldwell KA , Caldwell GA , Lindquist S ((2011) ) Functional links between Abeta toxicity, endocytic trafficking, and Alzheimer’s disease risk factors in yeast. Science 334: , 1241–1245. |
[32] | Choi JK , Bae JB , Lyu J , Kim TY , Kim YJ ((2009) ) Nucleosome deposition and DNA methylation at coding region boundaries. Genome Biol 10: , R89. |
[33] | Maussion G , Yang J , Suderman M , Diallo A , Nagy C , Arnovitz M , Mechawar N , Turecki G ((2014) ) Functional DNA methylation in a transcript specific 3′UTR region of TrkB associates with suicide. Epigenetics 9: , 1061–1070. |
[34] | Malumbres M , Perez de Castro I , Santos J , Fernandez Piqueras J , Pellicer A ((1999) ) Hypermethylation of the cell cycle inhibitorp15INK4b 3′-untranslated regioninterferes with its transcriptionalregulation in primary lymphomas. Oncogene 18: , 385–396. |
[35] | Horvath S , Zhang Y , Langfelder P , Kahn RS , Boks MP , van Eijk K , van den Berg LH , Ophoff RA ((2012) ) Aging effects on DNA methylation modules in human brain and blood tissue. Genome Biol 13: , R97. |
[36] | Hollingworth P , Harold D , Sims R , Gerrish A , Lambert J-C , Carrasquillo MM , Abraham R , Hamshere ML , Pahwa JS , Moskvina V ((2011) ) Common variants at ABCA7, MS4A6A/MS4A4E, EPHA1, CD33 and CD2AP are associated with Alzheimer’s disease. Nat Genet 43: , 429–435. |
[37] | Tost J , Gut IG ((2007) ) DNA methylation analysis by pyrosequencing. Nat Protoc 2: , 2265–2275. |
[38] | Chapuis J , Hansmannel F , Gistelinck M , Mounier A , Van Cauwenberghe C , Kolen KV , Geller F , Sottejeau Y , Harold D , Dourlen P , Grenier-Boley B , Kamatani Y , Delepine B , Demiautte F , Zelenika D , Zommer N , Hamdane M , Bellenguez C , Dartigues JF , Hauw JJ , Letronne F , Ayral AM , Sleegers K , Schellens A , Broeck LV , Engelborghs S , De Deyn PP , Vandenberghe R , O’Donovan M , Owen M , Epelbaum J , Mercken M , Karran E , Bantscheff M , Drewes G , Joberty G , Campion D , Octave JN , Berr C , Lathrop M , Callaerts P , Mann D , Williams J , Buee L , Dewachter I , Van Broeckhoven C , Amouyel P , Moechars D , Dermaut B , Lambert JC ((2013) ) Increased expression of BIN1 mediates Alzheimer genetic risk by modulating tau pathology. Mol Psychiatry 18: , 1225–1234. |
[39] | Agorio A , Durand S , Fiume E , Brousse C , Gy I , Simon M , Anava S , Rechavi O , Loudet O , Camilleri C , Bouche N ((2017) ) An arabidopsis natural epiallele maintained by a feed-forward silencing loop between histone and DNA. PLoS Genet 13: , e1006551. |


