
Differential Effect of APOE Alleles on Brain Glucose Metabolism in Targeted Replacement Mice: An [18F]FDG-μPET Study
Abstract
Background:
The Apolipoprotein E (ApoE) alleles ɛ2, ɛ3, and ɛ4 are known to differentially modulate cerebral glucose metabolism and the risk for Alzheimer’s disease (AD) via both amyloid-β (Aβ)-dependent and independent mechanisms.
Objective:
We investigated the influence of ApoE on cerebral glucose metabolism in humanized APOE Targeted Replacement (TR) mice at ages that precede the comparison of Aβ parenchymal deposits in APOE4-TR mice.
Methods:
Fludeoxyglucose ([18F]FDG) positron emission tomography (PET) measures were performed longitudinally in homozygous APOE-TR mice (APOE2, APOE3, APOE4; n = 10 for each group) at 3, 5, 11, and 15 months. Results were quantified using standard uptake values and analyzed statistically using a linear mixed effects model. Levels of the Aβ40 and Aβ42 peptides were quantified ex vivo using enzyme-linked immunosorbent assay (ELISA) at 15 months in the same animals.
Results:
APOE2 mice (versus APOE3) showed a significant increase in glucose metabolism starting at 6 months, peaking at 9 months. No evidence of hypometabolism was apparent in any region or time point for APOE4 mice, which instead displayed a hypermetabolism at 15 months. Whole brain soluble Aβ40 and Aβ42 levels were not significantly different between genotypes at 15 months.
Conclusions:
Introduction of human APOE alleles ɛ2 and ɛ4 is sufficient to produce alterations in brain glucose metabolism in comparison to the control allele ɛ3, without a concomitant alteration in Aβ40 and Aβ42 levels. These results suggest novel Aβ-independent metabolic phenotypes conferred by ɛ2 and ɛ4 alleles and have important implications for preclinical studies using TR-mice.
INTRODUCTION
APOE, a glycoprotein widely expressed throughout the periphery and the central nervous system (CNS), has a pivotal role in the transport and metabolism of cholesterol and lipids [1, 2].
In humans, the ApoE gene is polymorphic with three common isoforms (ApoE2, ApoE3, and ApoE4). The three alleles have a skewed distribution in most human populations with a frequency of 5–10% for the ɛ2 allele, 50–70% for ɛ3 allele, and 10–15% for the ɛ4 allele [3, 4]. Although the three isoforms only differ in one to two amino acids, these substitutions have a profound effect on APOE structure and function, affecting, for instance, cholesterol and triglyceride plasma levels in humans [5, 6].
In clinical neuroscience research a strong interest for ApoE has arisen from the finding that the ɛ4 allele is an established risk factor for Alzheimer’s disease (AD) [7] while the ɛ2 allele, at least in some human samples, appears to be protective against AD in comparison to ɛ3 [8, 9].
The radiotracer [18F]FDG has been used in a number of PET studies to demonstrate a pattern of decrease in glucose metabolism in distinct brain regions in AD patients. On the basis of this observation it has been suggested that [18F]FDG imaging could be used as a biomarker for AD [10–13]. Interestingly, more recently it has been shown that, in patients populations with a history of AD and healthy adults, carriers of the ɛ4 allele have lower brain glucose metabolism compared to non-carriers [14–17].
Several rodent and cell culture studies have demonstrated that APOE status also has a direct impact on Aβ aggregation and clearance (reviewed in [18–20]). However, it is debated whether APOE4 is a risk factor for AD solely because of its role in amyloid deposition. An alternative hypothesis is that other physiological roles of APOE may contribute to the pathophysiology of AD independently of Aβ[21, 22]. For instance, a reduction in brain metabolism measured with [18F]FDG in ɛ4 carriers has also been reported at an age that normally precede amyloid deposition (i.e., 20–39 years [23]).
A line of evidence for Aβ-independent effects of APOE on brain metabolism has also come from preclinical studies using APOE targeted replacement (TR) mice [24–26], which express human apoE (hApoE) isoforms under the control of the murine ApoE (mApoE) promoter. APOE4-TR have limited parenchymal amyloid deposits which are only evident at 18 months [27]. At ages preceding the formation of amyloid deposits it has been reported that APOE4-TR (in comparison to APOE3-TR mice) display deficits in long term potentiation in the hippocampus [28], dendritic length and spine density [29], insulin signaling [30], as well as in the function and axonal transport of mitochondria [31, 32]. All these factors may concur in producing the metabolic deficits associated with the ɛ4 allele in a way that is independent from effects on Aβ aggregation [22, 33].
To our knowledge, a crucial aspect of APOE-TR mice has not been investigated to date, namely, do APOE4-TR mice display the hypometabolism phenotype identified in humans? In addition, no human [18F]FDG study has so far concentrated on the metabolic profile of carriers of the protective ɛ2 allele, probably because of its low frequency in human populations [33].
The aim of the present [18F]FDG PET study was to examine longitudinally alterations in glucose metabolism in adult APOE2/3/4-TR mice up to an age (<18 months) that precedes the appearance of Aβ plaque deposits. To test for any concurrent alteration in Aβ aggregation, brain Aβ40 and Aβ42 levels were quantified ex vivo after the last PET measurement.
METHODS
Animals
All animal experiments were conducted according to Swedish regulations with the approval of the Animal Research Ethics Committee of the Swedish Animal Welfare Agency (Northern Stockholm Region) and were performed according to the Karolinska Institutet guidelines for working with experimental animals (Dnr.: N557/11).
APOE2/3/4 TR female mice (C57BL/6 background) were obtained from Taconic (Denmark). Female mice were selected because previous work has shown that behavioral and molecular deficits in APOE4-TR mice are more pronounced for female gender (reviewed in [34]), consistent with observations in humans showing higher risk for AD in female ApoE4 carriers [35]. Animals were housed under a 12 : 12 h light/dark cycle at constant temperature (∼22°C) and humidity with ad libitum access to food and water. Animal were fed on a regular chow diet (LABFOR r70 pellets with 4.5% fat content). Information on the time-course for animal weight is reported in Supplementary Table 1.
Study design
The study employed a balanced longitudinal design in which n = 10 mice for each genotype were scanned at 3, 6, 11, and 15 months of age. The 30 animals were imaged over 3 days at each time point with scan order being randomized according to genotype.
In vivo imaging with small animal PET
Mice were fasted for at least 4 h before the start of the experiments. Animals were anesthetized with isofluorane for a short period of time (induction 4–5% mixed with oxygen and maintenance 1.5–2% mixed with air/oxygen (50/50)) and [18F]FDG was administered via a bolus-injection in the tail vein. After injection of [18F]FDG, animals were allowed to wake and each mouse was transferred to an individual box with temperature controlled via a heating pad to allow distribution of the tracer (45 min total). The animals were then re-anesthetized with isoflurane and positioned into the nanoScan PET/MRI or nanoScan PET/CT (Mediso Ltd., Budapest, Hungary) in a transaxial position with their heads in the center of the field of view. Values for injected radioactivity were in the range of 10.1 MBq–15.6 MBq, except 2 out of 120 measurements where injected radioactivity was 21.2 and 21.8 MBq, respectively (Supplementary Table 2).
The PET data was acquired in list mode and was reconstructed to one 40-min static scan with Maximum Likelihood Estimation Method (MLEM) reconstruction (20 iterations). The acquired PET data was not corrected for attenuation or scatter.
Aβ40 and Aβ42 ELISA
Upon termination of the last [18F]FDG measurement animals were returned to their home-cage. Animals were sacrificed 2–4 days after the last PET measurement and the whole brain was dissected and preserved at –85°C. Soluble brain Aβ40 and Aβ42 levels were quantified using a commercial sandwich ELISA (KMB3481 and KMB3441; Invitrogen), following a diethylamine extractionprocedure described previously [36].
PET data analysis
The reconstructed static images were manually aligned to a standard mouse template [37] using PMOD (PMOD 3.7, Zurich, Switzerland). Images were then normalized voxel-wise to represent standardized uptake value (SUV) according to equation 1:
(1)
Four regions of interest (ROIs) and the whole brain were defined using the mouse template atlas available in PMOD. The ROIs were cortex, cingulate cortex,hippocampus and cerebellum. We selected these regions because in human studies they have been consistently associated either with hypometabolism or, in case of the cerebellum, display no metabolic change [38–40].
To examine potential alterations in glucose metabolism outside of the brain, we also defined a ROI in the Harderian glands. First, a template ROI for Harderian glands was manually drawn using PMOD on the average PET image for the study (i.e., average of 120 PET measurements). Then the Harderian gland ROI was manually realigned to the average PET image for each time point and genotype.
Custom made MATLAB (MATLAB 2015a, The MathWorks Inc., USA) scripts based on SPM12 (Wellcome Department of Cognitive Neurology, University College London, UK) were used to compute regional average SUV values.
Statistics
Statistical analysis was performed in R (R Development Core Team, 2009). For the PET data, a linear mixed-effects (LME) model was employed for the statistical analysis (lme4 package [41]). The LME applied included genotype, region, weight and injected radioactivity as fixed effects (descriptive statistics in Supplementary Tables 1-2). Time was included as a categorical variable due to its nonlinear effect on SUV (see Fig. 3). Second order interactions between time and genotype were also included in the model. Likelihood ratio test was performed to assess the significant inclusion of each fixed effect and of the interactions in the model. Animal-specific intercepts were included as random effects in the model. Predicted values were estimated from the previously specified LME model for each region of interest described above.
Fig.1
Average horizontal SUV PET images of [18F]FDG uptake in 3, 6, 11, and 15 months old APOE2/3/4 TR mice (A). Bright red spots in each PET image correspond to the Harderian glands. Quantification of the whole brain SUV (B). Boxplots show median and the 25th and 75th percentiles; upper and lower whisker extends±1.5 times the inter-quartile range. Raw data points are plotted superimposed to the boxplot
![Average horizontal SUV PET images of [18F]FDG uptake in 3, 6, 11, and 15 months old APOE2/3/4 TR mice (A). Bright red spots in each PET image correspond to the Harderian glands. Quantification of the whole brain SUV (B). Boxplots show median and the 25th and 75th percentiles; upper and lower whisker extends±1.5 times the inter-quartile range. Raw data points are plotted superimposed to the boxplot](https://content.iospress.com:443/media/adr/2017/1-1/adr-1-1-adr170006/adr-1-adr170006-g001.jpg)
Fig.2
SUV uptake of [18F]FDG in cingulate cortex (A), cortex (B), hippocampus (C), cerebellum (D), and Harderian glands (D) at 3, 6, 11, and 15 months. Means and 95% confidence intervals are shown.
![SUV uptake of [18F]FDG in cingulate cortex (A), cortex (B), hippocampus (C), cerebellum (D), and Harderian glands (D) at 3, 6, 11, and 15 months. Means and 95% confidence intervals are shown.](https://content.iospress.com:443/media/adr/2017/1-1/adr-1-1-adr170006/adr-1-adr170006-g002.jpg)
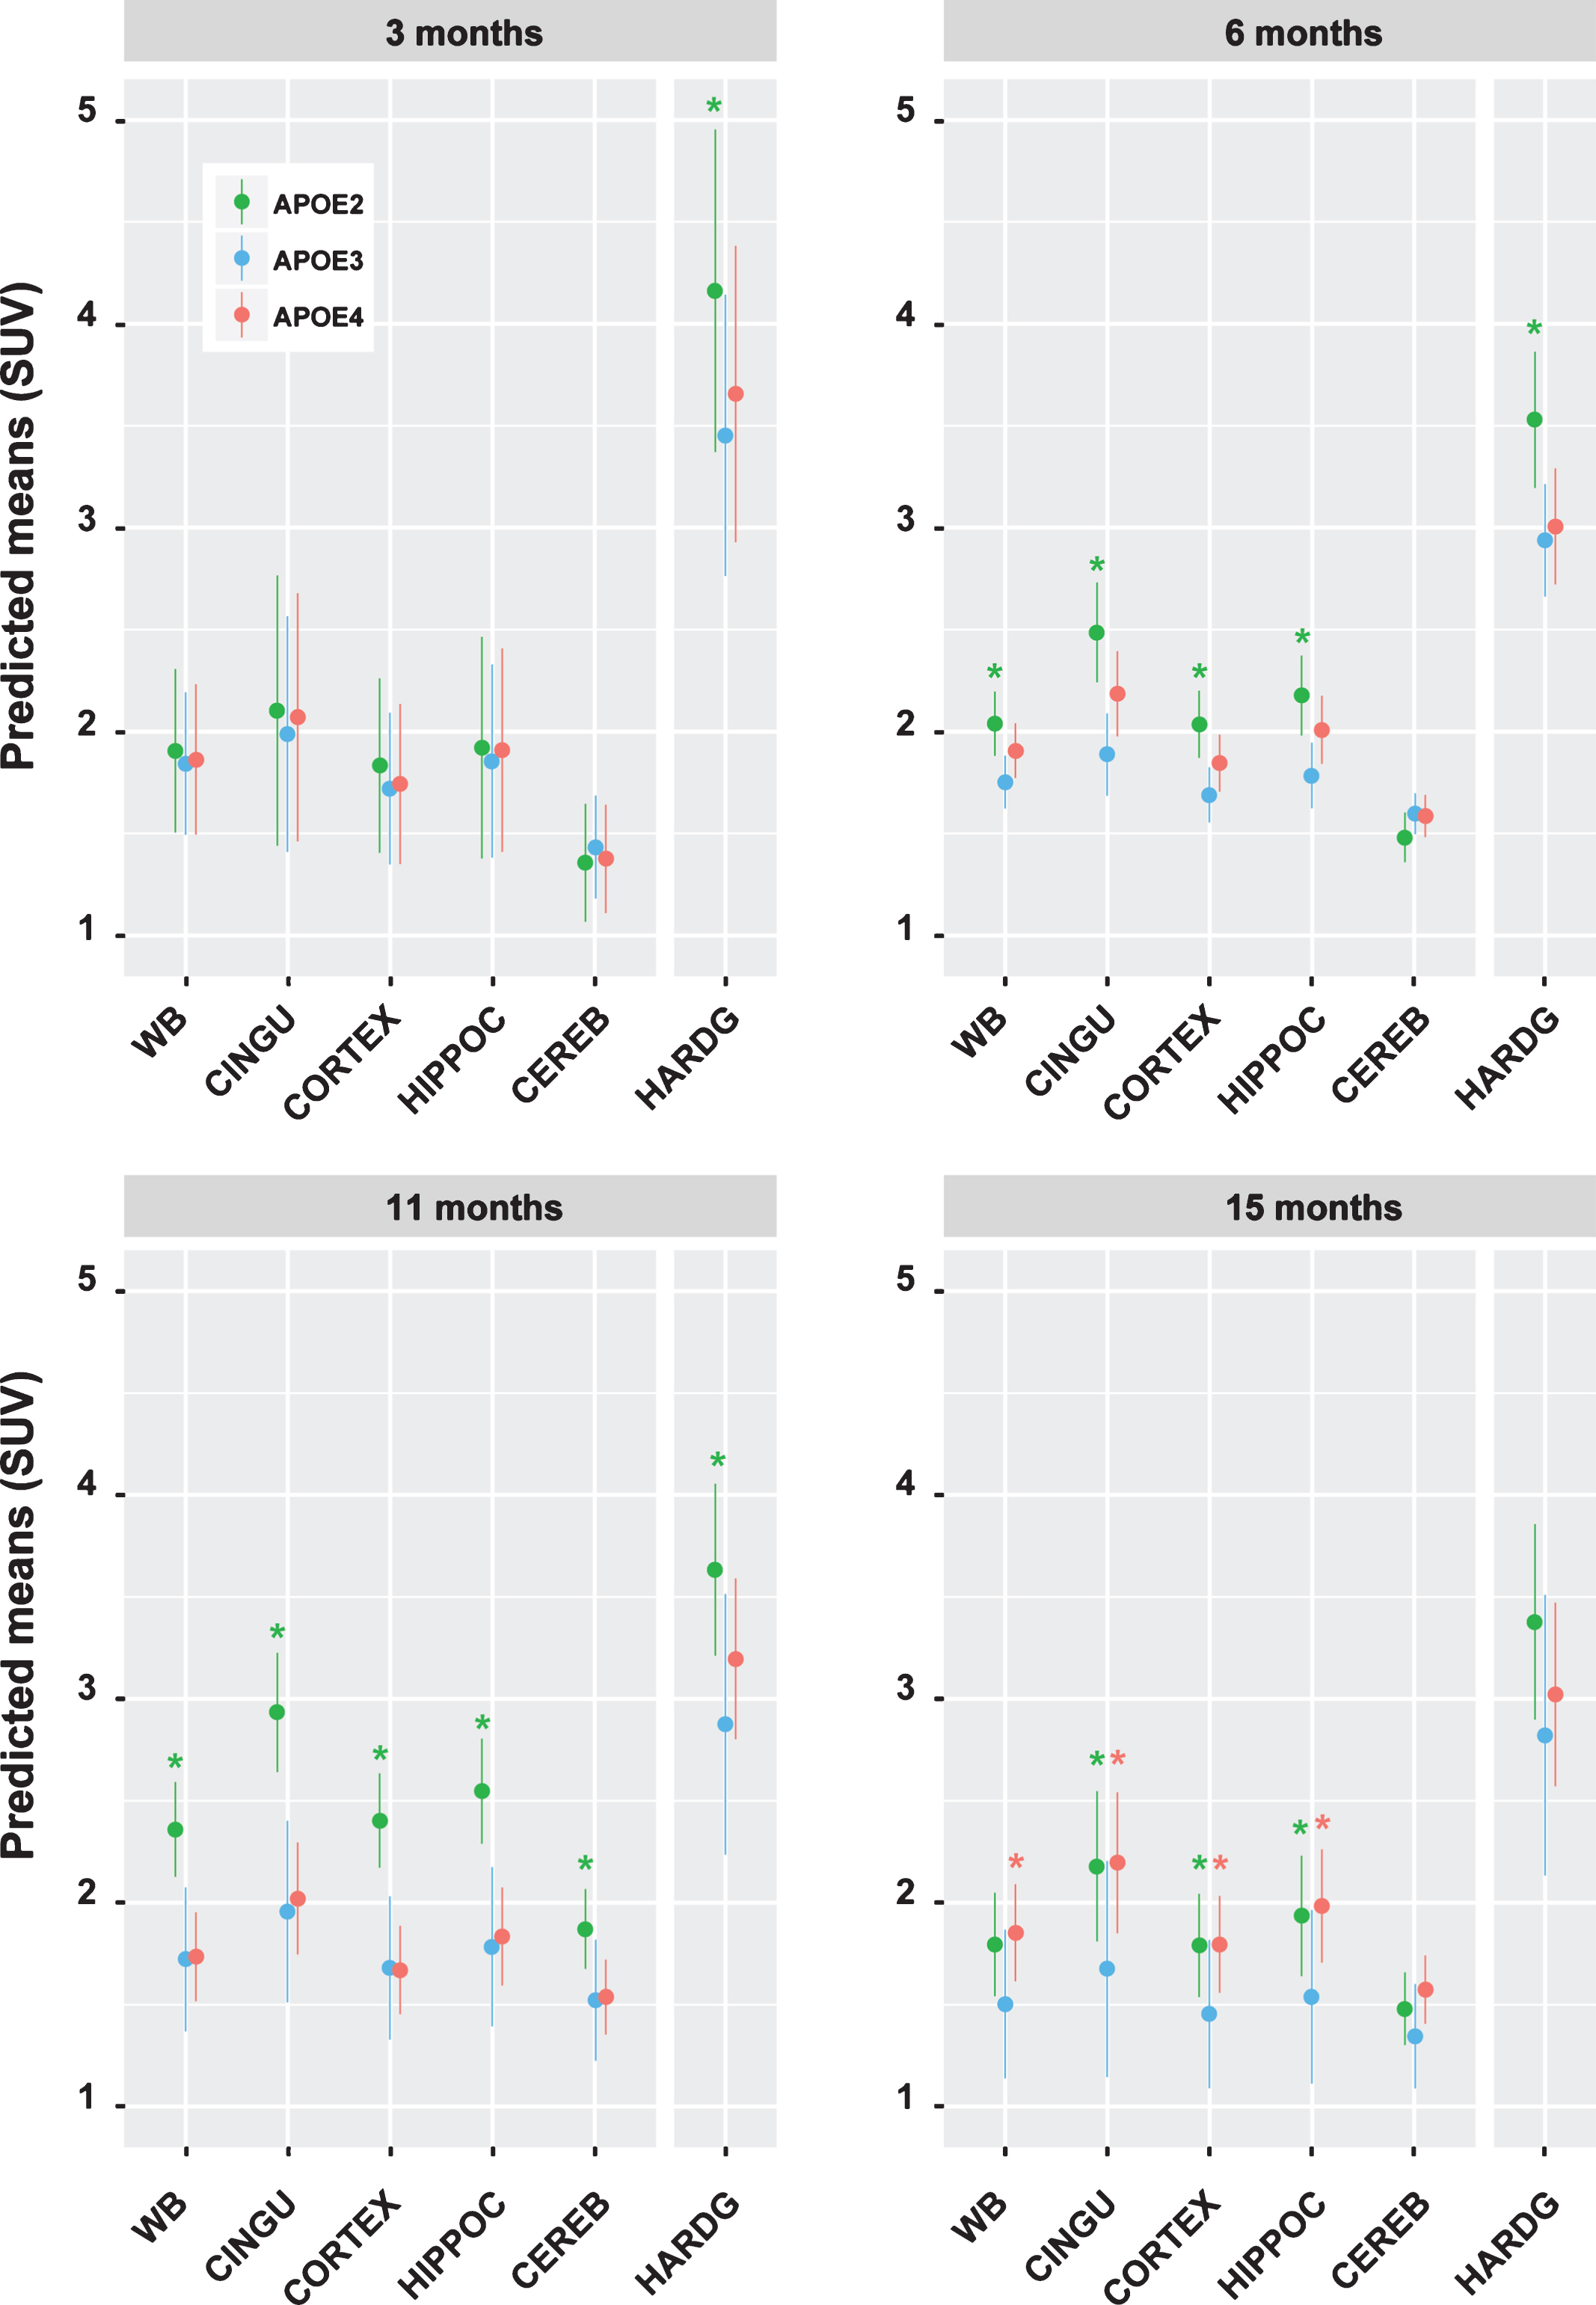
Fig.3
Predicted means for the linear mixed model showing effect of age by genotype and by region at the four time points. Asterisks represent p < 0.05 for the comparison APOE2 or APOE4 versus APOE3 for each ROI; lines represent confidence intervals. Whole brain (WB), cingulate cortex (CINGU), hippocampus (HIPPOC), cerebellum (CEREB), Harderian glands (HARDG).
Given that Aβ40 and Aβ42 concentrations were available only for the last PET measure in each animal, they were not included in the LME model. Differences in Aβ40 and Aβ42 levels due to genotype were tested with Kruskal–Wallis one-way analysis of variance. Correlation of Aβ40 and Aβ42 levels with whole brain SUV values at the last PET measure was computed with the Kendall rank correlation coefficient and tau test.
RESULTS
All PET measurements (n = 120) were performed according to the protocol and included in theanalysis. The average horizontal SUV images for the APOE-TR mice at the four time points investigated are presented in Fig. 1A (sagittal slice images in Supplementary Figure 1).
The uptake of [18F]FDG in the whole brain was rather homogenous. In the Harderian glands mean SUV values were about twice as high as in whole brain. For each of the three genotypes, the variability for the whole brain SUV (Fig. 1B) was low in the baseline scan at 3 months (first quartile 1.58 SUV –third quartile 1.90 SUV) and there was no obvious difference between genotypes. At later time points the variability increased within groups and between group differences also became apparent.
Similarly to the whole brain data, regional differences in posterior cingulate cortex, cortex, hippocampus and cerebellum (Fig. 2A-D) were not apparent across groups at baseline. The highest [18F]FDG uptake in APOE2-TR animals was at the 11 month time point in the four brain ROIs. In APOE4-TR mice a small increase in SUV was only consistently observed at the last time point (i.e., 15 months).
In the case of the extracerebral Harderian glands (Fig. 2E), differences between genotypes were already apparent at the time of the baseline scan. In addition, the variability within groups was greater than for the whole brain. APOE2-TR had higher mean [18F]FDG uptake in the Harderian glands compared to the other genotypes at all time points, while in APOE4-TR mice no difference in Harderian glands SUVs was apparent in comparison to the control group APOE3-TR mice.
To analyze the differences in our longitudinal dataset we employed a linear mixed effects (LME) model (the coefficients of the LME are listed in Supplementary Table 3). Predicted means from the fitted LME model, computed at weight = 25 g, and injected radioactivity = 13 MBq, for the three genotypes and four time points are presented in Fig. 3. In the following paragraph, we report statistical significance (p-value <0.05) for the comparison of APOE2 and APOE4 ROIs vs the respective ROI of the control group APOE3 at each time point. Absolute p-values are listed in Supplementary Table 4.
At baseline, no statistically significant differences were found for the whole brain and brain ROIs. APOE2-TR mice displayed an increase in [18F]FDG uptake at later time-points, in particular in whole brain, cingulate cortex, cortex, and hippocampus at 6 months and a global increase at 9 months (p-value <0.05 in all brain ROIs), with the strongest effect in cingulate cortex. At 15 months, the significant increase persisted in all brain ROIs except the cerebellum.
APOE4-TR mice showed no significant decrease in [18F]FDG uptake in any brain region in comparison with APOE3-TR, but at 15 months a significant increase in [18F]FDG uptake was present (p-value <0.05) in whole brain and all brain ROIs except the cerebellum.
As for the predicted means for the Harderian glands, APOE2-TR had significantly higher [18F]FDG uptake at baseline, an effect that persisted at 6 and 11 months. In APOE4-TR mice no statistically significant difference was observed for the Harderian glands at any time point.
Ex vivo quantification of Aβ40 and Aβ42 levels immediately after the last PET measurement revealed no effect of genotype on the brain soluble Aβ40 or Aβ42 fraction (Aβ40: Kruskal-Wallis chi-squared = 1.0661, p-value = 0.59; Aβ42: Kruskal-Wallis chi-squared = 2.7948, p-value = 0.25) (Fig. 4A-B, left panel). In one animal in the APOE4-TR group the Aβ40 quantification was not possible due to a technical error.
Fig.4
Ex vivo quantification of soluble mouse Aβ40 (A) and Aβ42 (B) in whole brain homogenate at the 15-months in the same APOE-TR animals for which [18F]FDG PET measures were obtained (left panel). Correlation plot between whole brain SUV and Aβ40 (A) or Aβ42 (B) concentrations according to genotype; estimated linear regression lines and shaded 95% confidence regions are superimposed (right panel).
![Ex vivo quantification of soluble mouse Aβ40 (A) and Aβ42 (B) in whole brain homogenate at the 15-months in the same APOE-TR animals for which [18F]FDG PET measures were obtained (left panel). Correlation plot between whole brain SUV and Aβ40 (A) or Aβ42 (B) concentrations according to genotype; estimated linear regression lines and shaded 95% confidence regions are superimposed (right panel).](https://content.iospress.com:443/media/adr/2017/1-1/adr-1-1-adr170006/adr-1-adr170006-g004.jpg)
The levels of Aβ40 were not significantly correlated with the whole brain [18F]FDG uptake at 15 months in any of the three genotypes (APOE2, tau = 0.02, p-value = 0.19; APOE3, tau = 0.11,p-value = 0.36; APOE4, tau = 0.11, p-value = 0.38). As for Aβ42, we note that in the case of APOE4 the Kendall’s tau coefficient was 0.38 (p-value = 0.08), while in the case of APOE2 and APOE4 no such trend was apparent (APOE2, tau = 0.02, p-value = 0.50; APOE3, tau = –0.06, p-value = 0.64) (Fig. 4A-B, right panel).
DISCUSSION
In this longitudinal study, we used [18F]FDG PET to investigate age-related changes in glucose metabolism in APOE-TR mice. We demonstrated that hAPOE alleles ɛ2 and ɛ4 produce alterations in brain glucose metabolism in comparison to the control allele ɛ3 without a concomitant change in Aβ40 and Aβ42 levels.
Effect of the ɛ2 allele on brain glucose metabolism
There was no evident difference in glucose metabolism between the alleles at 3 months. However, beyond 3 months the APOE2-TR mice exhibited a global increase in [18F]FDG brain uptake compared to both APOE3 and APOE4-TR mice. The size of the change was highest in the cingulate cortex, cortex and hippocampus, and lowest in the cerebellum.
The ɛ2 allele is known to be protective for AD but, to our knowledge, no human [18F]FDG study has been carried out to investigate differences in glucose metabolism in homozygous ɛ2 carriers. Indeed, ɛ2/ɛ2 are only present in 1% of the human population which imposes obvious practical limitations in the design of powered studies [33]. Thus, our study is the first to demonstrate a modulation of glucose metabolism driven by the human ɛ2 allele.
Although human [18F]FDG data is lacking, there is some structural MRI evidence that young ɛ2 carriers have higher cortical thickness compared to the other ApoE genotypes [42, 43]. Moreover APOE2-TR mice have been shown to have more complex dendritic arborization and spine length in cortical neurons compared to both APOE3 and APOE4-TR mice [44]. We can speculate that these morphological changes may contribute to the protective role of the ɛ2 allele [43] and result in a relative increase in cerebral glucose metabolism as demonstrated by the current study.
Effect of the ɛ4 allele on brain glucose metabolism
In the case of the ɛ4 allele, differences in brain metabolism were only observed in the LME model analysis at the last time-point 15 months. APOE4-TR mice exhibited a general increase in [18F]FDG brain uptake in comparison with APOE3. The increase in glucose metabolism was significant in cingulate cortex, cortex and hippocampus, whereas the cerebellum was unaffected, showing some consistency with the altered regional pattern seen in human ɛ4 carriers[33, 45].
However, the direction of the metabolic change was unexpected given that the vast majority of human [18F]FDG studies in ɛ4 carriers have instead identified patterns of hypometabolism in the brain [45]. Instead, we observed hypermetabolism in APOE4-TR mice at 15 months. The transgenic mice employed in our study were generated with a back-translation approach in which hApoE alleles replace the mApoE gene and APOE isoforms are expressed at physiological levels [46]. We did not confirm the human finding of glucose hypometabolism associated with the ɛ4 allele and we cannot exclude that this is due to species difference between human and murine hosts. Indeed, APOE4-TR mice replicate some, but not all, phenotypes related to cholesterol clearance and lipid energetics found in human ɛ4 carriers [26, 47].
Extracerebral modulation of glucose metabolism
While at 3 months, the time of the first PET measurement, there was no effect of genotype on brain glucose metabolism, our analysis demonstrated an already increased [18F]FDG uptake in the extracerebral Harderian glands of APOE2-TR mice. This ɛ2-driven relative hypermetabolism persisted at 6 and 11 months.
This observation suggests that the ɛ2 allele also has a role in modulating glucose metabolism in extracerebral areas; the direction of the change is consistent with the increase in [18F]FDG uptake in brain, but temporally precedes cerebral hypermetabolism. Moreover, the fact that APOE2-TR mice display increased plasma cholesterol and lipid levels starting from an age of 2 months [25, 48], taken together with our data, suggests that the ɛ2 allele may modulate peripheral energy metabolism before having an effect on cerebral metabolism.
Interplay between cerebral glucose metabolism and levels of Aβ40 and Aβ42
Brain soluble mouse Aβ40 and Aβ42 concentrations were not significantly different between the three APOE-TR strains at 15 months, indicating that APOE alleles can drive a modulation of cerebral [18F]FDG uptake before any dysregulation of Aβ levels can be detected.
These results were surprising given that APOE4-TR mice have been reported to have parenchymal Aβ deposits (albeit to a very limited extent) that are detectable with immunohistochemistry at 18 months age [27]. However, in the only study in adult animals where parenchymal deposits of Aβ have been reported, no absolute quantification was performed and Aβ deposits were only described qualitatively for the cortex. Moreover, the authors reported that the Aβ pathology effect did not appear with complete penetrance in the animals. Thus it is possible that that our quantitative analysis, performed at the “whole-brain homogenate level” ex vivo, did not pick up potential subtle, region specific changes in Aβlevels.
In addition, one study described an increase in Aβ42 levels in hippocampal homogenates of young APOE4-TR compared to APOE3-TR mice, but the effect was mainly driven by the hippocampal CA3 area [49]. The same authors also reported that the strain difference in Aβ42 immunoreactivity in the hippocampus was abolished by behavioral testing [50], indicating that the differences in Aβ42 may be sensitive to subtle manipulations of the environment of the animals.
Therefore the most parsimonious interpretation of our study is that, in our experimental conditions, the introduction of hAPOE alleles is sufficient to elicit a modulation of cerebral glucose metabolism and that this effect is independent from global changes in soluble Aβ40 or Aβ42 levels.
Notably, in the case of APOE4 we detected a trend for a positive correlation between Aβ42 levels and the brain [18F]FDG uptake. Although this result should be replicated in a larger cohort, it cannot be excluded that the hypermetabolism phenotype observed in APOE4-TR mice at 15 months is related to an increase in endogenous Aβ42 levels.
Limitations
In our experimental design, animals fasted for a different amount of time according to when during the day the PET measure was performed. Fasting duration is known to have an effect on [18F]FDG uptake in μPET studies [51]; nonetheless, in our design the PET scan order was randomized across genotypes, so this factor is unlikely to have affected our results.
Moreover, in our experiments, [18F]FDG was injected during isofluorane anesthesia, which is expected to decrease [18F]FDG uptake in brain and Harderian glands [51]. However, to our knowledge there is no evidence suggesting that this baseline reduction in [18F]FDG uptake would be different across genotypes.
It has been previously shown that APOE2 and APOE4 TR mice fed on a high-fat diet exhibit significant changes in peripheral cholesterol and triglycerides levels compared to APOE-3 TR mice ([24, 26], but see [52]). In view of the interplay between brain glucose metabolism and peripheral lipid homeostasis [53], this could suggest that some of the brain glucose metabolism changes observed were driven by peripheral changes in lipid metabolism. However, all animal strains in the study were fed on the same, standard, low-fat diet. Therefore, we think that this is unlikely to explain the differences in [18F]FDG uptake observed in the current study, but this hypothesis could be explicitly tested in future studies comparing the effect of low vs high fat diet on brain glucose metabolism in APOE-TR mice.
Implications for future preclinical studies using APOE-TR mice
The increase in [18F]FDG uptake in APOE2-TR mice is highly interesting because it indicates a novel example of cerebral and extra cerebral modulation of glucose metabolism conferred by the ɛ2 allele. It was recently shown that in the same transgenic animals, the ɛ2 allele is protective against cognitive decline independently from Aβ accumulation [54]. In future studies it would be of interest to correlate theperformance of APOE-TR mice in memory tasks with their [18F]FDG uptake to investigate any causal role of glucose hypermetabolism on neuroprotection.
Conclusion
In the current study, we have shown novel metabolic phenotypes conferred by human ApoE alleles, in particular we demonstrated that the ɛ2 and ɛ4 alleles can modulate brain glucose metabolism (in comparison to the control allele ɛ3) in the absence of a concomitant change in Aβ40 and Aβ42 levels. The increase in glucose metabolism in APOE2-TR mice may indicate a novel mechanism for theneuroprotective role of the ɛ2 allele in AD.
DISCLOSURE STATEMENT
M.V., A.R., A.B, A.M., and L.F. were full-time employees of AstraZeneca R&D at the time of the study conduct and/or manuscript preparation.
M.T., J.H. and P.F. declare no conflict of interest. The study was carried out under research agreement between AstraZeneca and Department of Clinical Neuroscience, PET Centre, Karolinska Institutet, Stockholm, Sweden.
ACKNOWLEDGMENTS
The study was sponsored by the Stockholm Brain Institute (SBI) and AstraZeneca R&D. The authors thank collaborators at AstraZeneca and members of the PET group at the Karolinska Institutet forexcellent technical assistance during the study.
SUPPLEMENTARY MATERIAL
[1] The supplementary material is available in the electronic version of this article: http://dx.doi.org/10.3233/ADR-170006.
REFERENCES
[1] | Mahley RW ((1988) ) Apolipoprotein E: Cholesterol transport protein with expanding role in cell biology. Science 240: , 622–630. |
[2] | Srivastava RA , Bhasin N , Srivastava N ((1996) ) Apolipoprotein E gene expression in various tissues of mouse and regulation by estrogen. Biochem Mol Biol Int 38: , 91–101. |
[3] | Corbo RM , Scacchi R ((1999) ) Apolipoprotein E (APOE) allele distribution in the world. Is APOE*4 a “thrifty” allele? Ann Hum Genet 63: , 301–310. |
[4] | Mahley RW , Rall SCJ ((2000) ) Apolipoprotein E: Far more than a lipid transport protein. Annu Rev Genomics Hum Genet 1: , 507–537. |
[5] | Huang Y , Mahley RW ((2014) ) Apolipoprotein E: Structure and function in lipid metabolism, neurobiology, and Alzheimer’s diseases. Neurobiol Dis 72: , 3–12. |
[6] | Mahley RW , Weisgraber KH , Huang Y ((2006) ) Apolipoprotein E4: A causative factor and therapeutic target in neuropathology, including Alzheimer’s disease. Proc Natl Acad Sci USA 103: , 5644–5651. |
[7] | Corder EH , Saunders AM , Strittmatter WJ , Schmechel DE , Gaskell PC , Small GW , Roses AD , Haines JL , Pericak-Vance MA ((1993) ) Gene dose of apolipoprotein E type 4 allele and the risk of Alzheimer’s disease in late onset families. Science 261: , 921–923. |
[8] | Corder EH , Saunders AM , Risch NJ , Strittmatter WJ , Schmechel DE , Gaskell PC , Rimmler JB , Locke PA , Conneally PM , Schmader KE ((1994) ) Protective effect of apolipoprotein E type 2 allele for late onset Alzheimerdisease. Nat Genet 7: , 180–184. |
[9] | Farrer LA , Cupples LA , Haines JL , Hyman B , Kukull WA , Mayeux R , Myers RH , Pericak-Vance MA , Risch N , van Duijn CM ((1997) ) Effects of age, sex, and ethnicity on the association between Apolipoprotein E genotype and Alzheimer disease: A meta-analysis. JAMA 278: , 1349–1356. |
[10] | McGeer EG , Peppard RP , McGeer PL , Tuokko H , Crockett D , Parks R , Akiyama H , Calne DB , Beattie BL , Harrop R ((1990) ) 18Fluorodeoxyglucose positron emission tomography studies in presumed Alzheimer cases, including 13 serial scans. Can J Neurol Sci 17: , 1–11. |
[11] | Smith GS , de Leon MJ , George AE , Kluger A , Volkow ND , McRae T , Golomb J , Ferris SH , Reisberg B , Ciaravino J ((1992) ) Topography of cross-sectional and longitudinal glucose metabolic deficits in Alzheimer’s disease. Pathophysiologic implications. Arch Neurol 49: , 1142–1150. |
[12] | Mielke R , Herholz K , Grond M , Kessler J , Heiss WD ((1994) ) Clinical deterioration in probable Alzheimer’s disease correlates with progressive metabolic impairment of association areas. Dementia 5: , 36–41. |
[13] | Minoshima S , Frey KA , Koeppe RA , Foster NL , Kuhl DE ((1995) ) A diagnostic approach in Alzheimer’s disease using three-dimensional stereotactic surface projections of fluorine-18-FDG PET. J Nucl Med 36: , 1238–1248. |
[14] | Small GW , Mazziotta JC , Collins MT , Baxter LR , Phelps ME , Mandelkern MA , Kaplan A , La Rue A , Adamson CF , Chang L ((1995) ) Apolipoprotein E type 4 allele and cerebral glucose metabolism in relatives at risk for familial Alzheimer disease. JAMA 273: , 942–947. |
[15] | Reiman EM , Caselli RJ , Yun LS , Chen KW , Bandy D , Minoshima S , Thibodeau SN , Osborne D ((1996) ) Preclinical evidence of Alzheimer’s disease in persons homozygous for the ɛ-4 allele for Apolipoprotein E. N Engl J Med 334: , 752–758. |
[16] | Lowe VJ , Weigand SD , Senjem ML , Vemuri P , Jordan L , Kantarci K , Boeve B , Jack CR , Knopman D , Petersen RC ((2014) ) Association of hypometabolism and amyloid levels in aging, normal subjects. Neurology 82: , 1959–1967. |
[17] | Altmann A , Ng B , Landau SM , Jagust WJ , Greicius MD ((2015) ) Regional brain hypometabolism is unrelated to regional amyloid plaque burden. Brain 138: , 3734–3746. |
[18] | Kanekiyo T , Xu H , Bu G ((2014) ) ApoE and Aβ in Alzheimer’s disease: Accidental encounters or partners? Neuron 81: , 740–754. |
[19] | Holtzman D , Herz J ((2012) ) Apolipoprotein E and apolipoprotein receptors: Normal biology and roles in Alzheimer’s disease. Cold Spring Harb Perspect Med 2: , a006312. |
[20] | Yu J-T , Tan L , Hardy J ((2014) ) Apolipoprotein e in Alzheimer’s disease: An update. Annu Rev Neurosci 37: , 79–100. |
[21] | Wolf A , Valla J , Bu G , Kim J , LaDu M , Reiman E , Caselli R ((2013) ) Apolipoprotein E as a beta-amyloid-independent factor in Alzheimer’s disease. Alzheimers Res Ther 5: , 38. |
[22] | Huang Y ((2010) ) Aβ-independent roles of apolipoprotein E4 in the pathogenesis of Alzheimer’s disease. Trends Mol Med 16: , 287–294. |
[23] | Reiman EM , Chen K , Alexander GE , Caselli RJ , Bandy D , Osborne D , Saunders AM , Hardy J ((2004) ) Functional brain abnormalities in young adults at genetic risk for late-onset Alzheimer’s dementia. Proc Natl Acad Sci USA 101: , 284–289. |
[24] | Sullivan PM , Knouff C , Najib J , Reddick RL , Quarfordt SH ((1997) ) Targeted replacement of the mouse Apolipoprotein E gene with the common human. J Biol Chem 272: , 17972–17980. |
[25] | Sullivan PM , Mezdour H , Quarfordt SH , Maeda N ((1998) ) Type III hyperlipoproteinemia and spontaneous atherosclerosis in mice resulting from gene replacement of mouse Apoe with human APOE*2. J Clin Invest 102: , 130–135. |
[26] | Knouff C , Hinsdale ME , Mezdour H , Altenburg MK , Watanabe M , Quarfordt SH , Sullivan PM , Maeda N ((1999) ) Apo E structure determines VLDL clearance and atherosclerosis risk in mice. J Clin Invest 103: , 1579–1586. |
[27] | Sullivan PM , Mace BE , Estrada JC , Schmechel DE , Alberts MJ ((2008) ) Human Apolipoprotein E4 targeted replacement mice show increased prevalence of intracerebral hemorrhage associated with vascular amyloid deposition. J Stroke Cerebrovasc Dis 17: , 303–311. |
[28] | Trommer BL , Shah C , Yun SH , Gamkrelidze G , Pasternak ES , Ye GL , Sotak M , Sullivan PM , Pasternak JF , LaDu MJ ((2004) ) ApoE isoform affects LTP in human targeted replacement mice. Neuroreport 15: , 2655–2658. |
[29] | Klein RC , Mace BE , Moore SD , Sullivan PM ((2010) ) Progressive loss of synaptic integrity in human apolipoprotein E4 targeted replacement mice and attenuation by apolipoprotein E2. Neuroscience 171: , 1265–1272. |
[30] | Ong Q-R , Chan ES , Lim M-L , Cole GM , Wong B-S ((2014) ) Reduced phosphorylation of brain insulin receptor substrate and Akt proteins in apolipoprotein-E4 targeted replacement mice. Sci Rep 4: , 3754. |
[31] | Tesseur I , Van Dorpe J , Bruynseels K , Bronfman F , Sciot R , Van Lommel A , Van Leuven F ((2000) ) Prominent opathy and disruption of axonal transport in transgenic mice expressing human apolipoprotein E4 in neurons of brain and spinal cord. Am J Pathol 157: , 1495–1510. |
[32] | James R , Searcy JL , Le Bihan T , Martin SF , Gliddon CM , Povey J , Deighton RF , Kerr LE , McCulloch J , Horsburgh K ((2012) ) Proteomic analysis of mitochondria in APOE transgenic mice and in response to an ischemic challenge. J Cereb Blood Flow Metab 32: , 164–176. |
[33] | Wolf AB , Caselli RJ , Reiman EM , Valla J ((2013) ) APOE and neuroenergetics: An emerging paradigm in Alzheimer’s disease. Neurobiol Aging 34: , 1007–1017. |
[34] | Tai LM , Youmans KL , Jungbauer L , Yu C , Ladu MJ ((2011) ) Introducing Human APOE into Aβ Transgenic Mouse Models. Int J Alzheimers Dis 2011: , 810981. |
[35] | Mortensen EL , Hogh P ((2001) ) A gender difference in the association between APOE genotype and age-related cognitive decline. Neurology 57: , 89–95. |
[36] | Eketjall S , Janson J , Jeppsson F , Svanhagen A , Kolmodin K , Gustavsson S , Radesater A-C , Eliason K , Briem S , Appelkvist P , Niva C , Berg A-L , Karlstrom S , Swahn B-M , Falting J ((2013) ) AZ-4217: A high potency BACE inhibitor displaying acute central efficacy in different in vivo models and reduced amyloid deposition in Tg2576 mice. J Neurosci 33: , 10075–10084. |
[37] | Ma Y , Hof PR , Grant SC , Blackband SJ , Bennett R , Slatest L , Mcguigan MD , Benveniste H ((2005) ) A three-dimensional digital atlas database of the adult C57BL/6J mouse brain by magnetic resonance microscopy. Neuroscience 135: , 1203–1215. |
[38] | Liu Y , Yu J-T , Wang H-F , Han P-R , Tan C-C , Wang C , Meng X-F , Risacher SL , Saykin AJ , Tan L ((2015) ) APOE genotype and neuroimaging markers of Alzheimer’s disease: Systematic review and meta-analysis. J Neurol Neurosurg Psychiatry 86: , 127–134. |
[39] | Knopman DS , Jack CR , Wiste HJ , Lundt ES , Weigand SD , Vemuri P , Lowe VJ , Kantarci K , Gunter JL , Senjem ML , Mielke MM , Roberts RO , Boeve BF , Petersen RC ((2014) ) 18F-fluorodeoxyglucose positron emission tomography, aging, and apolipoprotein E genotype in cognitively normal persons. Neurobiol Aging 35: , 2096–2106. |
[40] | Rimajova M , Lenzo NP , Wu J-S , Bates KA , Campbell A , Dhaliwal SS , McCarthy M , Rodrigues M , Paton A , Rowe C , Foster JK , Martins RN ((2008) ) Fluoro-2-deoxy-D-glucose (FDG)-PET in APOE epsilon 4 carriers in the Australian population. J Alzheimers Dis 13: , 137–146. |
[41] | Bates D , Mächler M , Bolker BM , Walker SC ((2015) ) Fitting linear mixed-effects models using lme4. J Stat Softw 67: , 1–48. |
[42] | Shaw P , Lerch JP , Pruessner JC , Taylor KN , Rose AB , Greenstein D , Clasen L , Evans A , Rapoport JL , Giedd JN ((2007) ) Cortical morphology in children and adolescents with different apolipoprotein E gene polymorphisms: An observational study. Lancet Neurol 6: , 494–500. |
[43] | Suri S , Heise V , Trachtenberg AJ , Mackay CE ((2013) ) The forgotten APOE allele: A review of the evidence and suggested mechanisms for the protective effect of APOE e2. Neurosci Biobehav Rev 37: , 2878–2886. |
[44] | Dumanis SB , Tesoriero JA , Babus LW , Nguyen MT , Trotter JH , Ladu MJ , Weeber EJ , Turner RS , Xu B , Rebeck GW , Hoe H-S ((2009) ) ApoE4 decreases spine density and dendritic complexity in cortical neurons in vivo. J Neurosci 29: , 15317–15322. |
[45] | Fouquet M , Besson FL , Gonneaud J , La Joie R , Chételat G ((2014) ) Imaging brain effects of APOE4 in cognitively normal individuals across the lifespan. Neuropsychol Rev 24: , 290–299. |
[46] | Sullivan PM ((2011) ) APOE-based models of “pre-dementia.”. Neuromethods 48: , 439–447. |
[47] | Chan ES , Chen C , Cole GM , Wong B-S ((2015) ) Differential interaction of Apolipoprotein-E isoforms with insulin receptors modulates brain insulin signaling in mutant human amyloid precursor protein transgenic mice. Sci Rep 5: , 13842. |
[48] | Kuhel DG , Konaniah ES , Basford JE , McVey C , Goodin CT , Chatterjee TK , Weintraub NL , Hui DY ((2013) ) Apolipoprotein E2 accentuates postprandial inflammation and diet-induced obesity to promote hyperinsulinemia in mice. Diabetes 62: , 382–391. |
[49] | Liraz O , Boehm-Cagan A , Michaelson DM ((2013) ) ApoE4 induces Abeta42, tau, and neuronal pathology in the hippocampus of young targeted replacement apoE4 mice. Mol Neurodegener 8: , 16. |
[50] | Salomon-Zimri S , Liraz O , Michaelson DM ((2015) ) Behavioral testing affects the phenotypic expression of APOE ɛ3 and APOE ɛ4 in targeted replacement mice and reduces the differences between them. Alzheimers Dement (Amst) 1: , 127–135. |
[51] | Fueger BJ , Czernin J , Hildebrandt I , Tran C , Halpern BS , Stout D , Phelps ME , Weber WA ((2006) ) Impact of animal handling on the results of 18F-FDG PET studies in mice. J Nucl Med 47: , 999–1006. |
[52] | Huebbe P , Dose J , Schloesser A , Campbell G , Glüer CC , Gupta Y , Ibrahim S , Minihane AM , Baines JF , Nebel A , Rimbach G ((2015) ) Apolipoprotein E (APOE) genotype regulates body weight and fatty acid utilization-Studies in gene-targeted replacement mice. Mol Nutr Food Res 59: , 334–343. |
[53] | Lam TKT , Gutierrez-Juarez R , Pocai A , Bhanot S , Tso P , Schwartz GJ , Rossetti L ((2007) ) Brain glucose metabolism controls the hepatic secretion of triglyceride-rich lipoproteins. Nat Med 13: , 171–180. |
[54] | Shinohara M , Kanekiyo T , Yang L , Linthicum D , Shinohara M , Fu Y , Price L , Frisch-Daiello JL , Han X , Fryer JD , Bu G ((2016) ) APOE2 eases cognitive decline during aging: Clinical and preclinical evaluations. Ann Neurol. doi: 10.1002/ana.24628 |


