
Quadriceps activation during maximal isometric and isokinetic contractions: The minimal real difference and its implications
Abstract
BACKGROUND:
A method of measurement of voluntary activation (VA, percent of full muscle recruitment) during isometric and isokinetic concentric contractions of the quadriceps femoris (QF) at 60
OBJECTIVE:
This study aimed to quantify the test-retest minimal real difference (MRD) of VA during isometric (ISOM) and isokinetic concentric contractions of QF (100
METHODS:
VA was measured through the interpolated twitch technique. Pairs of electrical stimuli were delivered to the QF at 40
RESULTS:
The VA (median, range) was 84.20% (38.2–99.9%) in ISOM and 94.22% (33.8–100%) in ISOK. MRD was 0.78 and 1.12 logit for ISOM and ISOK, respectively. As an example, in terms of percent VA these values correspond to a change from 76% to 95% and from 79% to 98% in ISOM and in ISOK, respectively.
CONCLUSIONS:
The provided MRD values allow to detect significant individual changes in VA, as expected after training and rehabilitation programs.
1.Introduction
Voluntary activation (VA) is defined as the degree of recruitment of muscles engaged in a voluntary contraction effort [1]. VA is usually measured as a percentage of the maximum force that could be provided by a muscle if all its fibres contract at tetanic frequency. A 100% VA is rarely achieved for the quadriceps femoris (QF), and for most muscles, even among trained healthy participants [2]. The most commonly used method for VA measurement is the interpolated twitch technique (ITT) which consists of stimulating a representative portion of the muscle belly through an electric shock, causing some initial discomfort but no pain. The stimulus is delivered both at rest and during maximal contraction effort. If the shock does not generate extra force during contraction, all muscle fibres belonging to the sample reached by the electric shock can be claimed to be tetanized [1, 3]. Otherwise, the contraction/rest ratio of the peak forces during the “twitches” evoked by the shock provides an estimate of the percentage of muscle fibres not (or not fully) engaged by the volitional drive: VA is the complement to this ratio. Therefore, the ITT provides an estimation of how voluntary effort translates into muscle force production [3].
A less common procedure, known as the central activation ratio (CAR), implies that the peak moment is evoked with supramaximal stimulation of the femoral nerve, making the resting twitch unnecessary [4, 5, 6, 7, 8]. The two methods provide quite superimposable results. In previous research on various muscle groups VA has been measured through ITT during isometric contractions (ISOM) [2, 9, 10, 11] and during both muscle shortening (“concentric contraction”) [9, 12] and lengthening (“eccentric contraction”) [13, 14, 15, 16]. Given that muscle force depends both on muscle length and velocity of shortening (or lengthening), most studies adopted isokinetic dynamometers Here, the activation of the QF during lower limb extension is of concern. The extant literature agrees (despite initial controversies [16, 17, 18]) that VA of QF is incomplete during ISOM (around 80–95%) [10, 19, 20, 21]. In contrast, the debate is ongoing for isokinetic (ISOK) concentric and eccentric contractions. Some authors concluded that maximal ISOK concentric VA did not differ significantly from ISOM VA either at slow (20
In a previous paper [1] a method of measurement of VA during ISOM and ISOK knee extension (velocities of 60 and 120
A key property of measurement is its test-retest reliability. This parameter for VA has been evaluated in isometric conditions at 90
Another neglected issue was the nonlinearity of percentage measures, flawed by floor and/or ceiling effects. In the present study, measures of VA and their changes were analysed both as raw percentages (VA) and as values transformed (VA
The primary endpoint of the present study was to determine the MRD of VA
2.Methods
The trial was conducted from September 2019 to April 2020 in a research laboratory on human movement, within a hospital department of neurorehabilitation.
2.1Participants
Twenty-five healthy participants (18–45 years old, 12 women) took part in the experiments. The inclusion criteria were: i) ability to sign the informed consent form; ii) ability to understand the instructions and to complete the motor task; and iii) to be recreationally active.
Exclusion criteria were: i) pregnancy; ii) a history of epilepsy (to avoid the risk of seizures triggered by the stimuli); iii) implanted electro-sensitive devices; iv) any neurologic or orthopaedic condition limiting the articular mobility or muscular strength of the lower limbs; and v) current treatment with oral anticoagulant or antiplatelet therapy (to avoid the risk of muscle haemorrhage). None of the participants were familiar with the testing method.
2.2Ethics
All participants gave written informed consent before participating. The study was approved by the ethics committee of the institution (project code 24C721_2017 date of approval 14
2.3Procedures
2.3.1Test sequencing
Participants took part in the experiment during two sessions, test (T0) and retest (T1), with a 14-day interval. The two sessions took place at about the same time of the day and participants were asked to maintain the same lifestyle habits between the sessions. The 14-day interval was chosen as it is close to the time frame usually adopted for re-testing after rehabilitation or sports training. Both lower limbs were tested. The order in which the lower limbs were tested was randomised (see below).
2.3.2Trial sequencing
In a separate way for both men and women, for the first enrolled participant the limb to be tested first (dominant vs. non-dominant) was randomly selected. For subsequent participants, the sequence in limb testing was alternated. Then, those participants who had their dominant limb tested as first at T0 started retest with the non-dominant limb, and vice-versa.
2.3.3Anthropometric measurements
All anthropometric parameters were measured at T0 and at T1 at the beginning of the testing session. Participants were tested for foot dominance using the Waterloo footedness questionnaire-revised [27]. Height and weight were measured.
2.3.4Instruments
All tests were performed using a Cybex Humac Norm
2.3.5Range of knee motion and rotation speeds
Isometric tests were conducted with the knee held at 40
2.3.6Electrical stimulation of quadriceps muscle
VA levels were determined according to the ITT method. Electric shocks were delivered through large percutaneous rubber electrodes (120
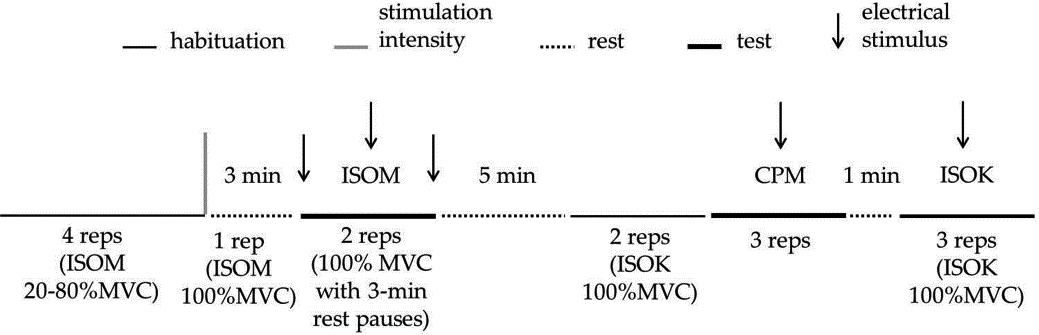
Figure 1.
Schematic representation of the experimental protocol for one limb. The experimental session starts with isometric (ISOM) habituation in which 4 submaximal repetitions were requested. Then, one ISOM repetition at 100%MVC was asked for, in order to calculate the parameters of the electrical doublets to be delivered in the test (represented by the vertical gray bar). After 3-min rest, the participants performed two ISOM repetitions separated by a 3-min rest. In each ISOM repetition, three electrical doublets (represented by arrows) were delivered: the first one was delivered at rest, the second one was delivered 3–4 s after the beginning of the effort initiation, and the third one was delivered at rest 2–3 s after the contraction ended. After the ISOM test, a 5-min rest separated the habituation trials, made by two isokinetic knee extension-flexion contractions at 100
2.3.7Voluntary efforts and electrical stimulation
Joint moments were displayed online on a PC-screen. The participant was instructed to neglect the screen and to focus on perceiving her/his maximal effort. Verbal encouragement was provided to the participants to elicit maximal effort.
To achieve habituation at the beginning of each session participants performed 2–4 submaximal isometric contractions at increasing effort at the pre-determined joint angle (40
After a 3-minute pause, ISOM contractions were requested. During ISOM (knee immobilised at 40
A 5-minute pause separated the end of ISOM testing from the beginning of isokinetic habituation: two extension-flexion repetitions at maximal effort at the chosen angular velocity (100
2.3.8Surface electromyography (sEMG) recording
The sEMG was recorded at rest to ascertain the fully relaxed state of the vastus lateralis and the homolateral biceps femoris muscle. Two pairs of silver chloride surface electrodes were applied to each muscle according to the SENIAM guidelines [35]. Low impedance (
2.3.9.1. Data acquisition and analysis
A signal acquisition system (CED 1401, Cambridge Electronic Designed Limited-Ced, Cambridge) was used to simultaneously record knee moment, angle, and angular velocity through the isokinetic dynamometer. These variables were sampled at 500 Hz. A customised software (Spike 2, version 8, Cambridge Electronic Design Limited-CED, Cambridge) connected to the acquisition system controlled the electric stimulator in eliciting the stimulus at the desired knee angle. The average moment applied to the transducer when the lower limb was fully extended was used to offset the gravitational moment at all angles by proper computation. Moment signals were off-line filtered (low-pass FIR filter, 1.3 Hz).
The VA was determined by the following formula:
Figure 2.
Tracings from a representative participant (woman, 35 years, 53 kg, 163 m). The gravity-corrected moment (Nm), on the ordinate, is given as a function of time (s), on the abscissa. From top to bottom, in the left column the panels refer to a maximal isometric contraction at 40
![Tracings from a representative participant (woman, 35 years, 53 kg, 163 m). The gravity-corrected moment (Nm), on the ordinate, is given as a function of time (s), on the abscissa. From top to bottom, in the left column the panels refer to a maximal isometric contraction at 40∘ knee angle (0∘= full extension) (ISOM), a maximal isokinetic contraction at 100∘/s (ISOK), and a continuous passive motion (CPM) at 100∘/s, respectively. In the top panel the first moment peak (resting twitch) anticipates the beginning of the voluntary effort by a variable interval of 2–3 s (see the break on the abscissa). Arrows mark the delivery of the doublet. The dashed rectangles delimit the events occurring in a short time frame encasing the superimposed twitch. The straight gray segments represent the regression line built on the moment values observed just before the doublet: 300 ms in ISOM, 50 ms in ISOK, and 100 ms in CPM, respectively. In the right column, events in the rectangles are zoomed-in. Circles delimit the regression time windows. The upper and lower black triangles give the peak of the increment following the doublet, and the moment that would have occurred, in the same instant of time, without stimulation, respectively. The difference between the observed peak and the synchronously estimated moment gives the IT value [1].](https://content.iospress.com:443/media/ies/2021/29-3/ies-29-3-ies203241/ies-29-ies203241-g002.jpg)
where IT and RT are the peak moments caused by the electric doublets during the voluntary contraction and at rest, respectively. During ISOM contractions, pre-contraction RT was adopted in the computation of VA. Indeed, like the twitch during contraction the post-contraction RT may exhibit some potentiation, but it may also be diminished by fatigue [36, 37]. The pre-contraction twitch is preferred for consistency with ISOK computation of VA [1]. During ISOK contractions, the time course of the moments was visually analysed off-line to detect any gross abnormalities. In particular, IT had to occur during the descending part of the bell-shaped moment curve (see ref. 1 for details) (Fig. 2).
2.3.9.2. Algebraic considerations
The goal of this study was the computation of the minimal real difference (MRD) of VA, at two time points. The MRD is the minimal change that cannot be attributed to random error, only (usually, at
where
2.3.10. Statistical analyses
For each participant, the best repetition out of two ISOM contractions and out of three ISOK contractions were selected for statistical analysis [39, 40, 41]. The normality of data distribution was assessed using the Shapiro-Wilk’s test. When applicable, means (SD) were computed and Student’s
Table 1
Means, medians, first lower quartiles (Q1) and third upper quartiles (Q3) for age, weight, height, body mass index (BMI) of the dominant and the non-dominant limbs of the twenty-five participants
| Mean | Median | Q1 | Q3 | |
| Age (years) | 27.3 | 26.0 | 24.0 | 30.0 |
| Weight (kg) | 70.4 | 71.0 | 59.0 | 78.0 |
| Height (cm) | 174.8 | 176.0 | 166.0 | 183.0 |
| BMI (kg m | 22.9 | 22.1 | 21.0 | 24.0 |
Figure 3.
The ordinate gives the voluntary activation (VA) values of the participants (
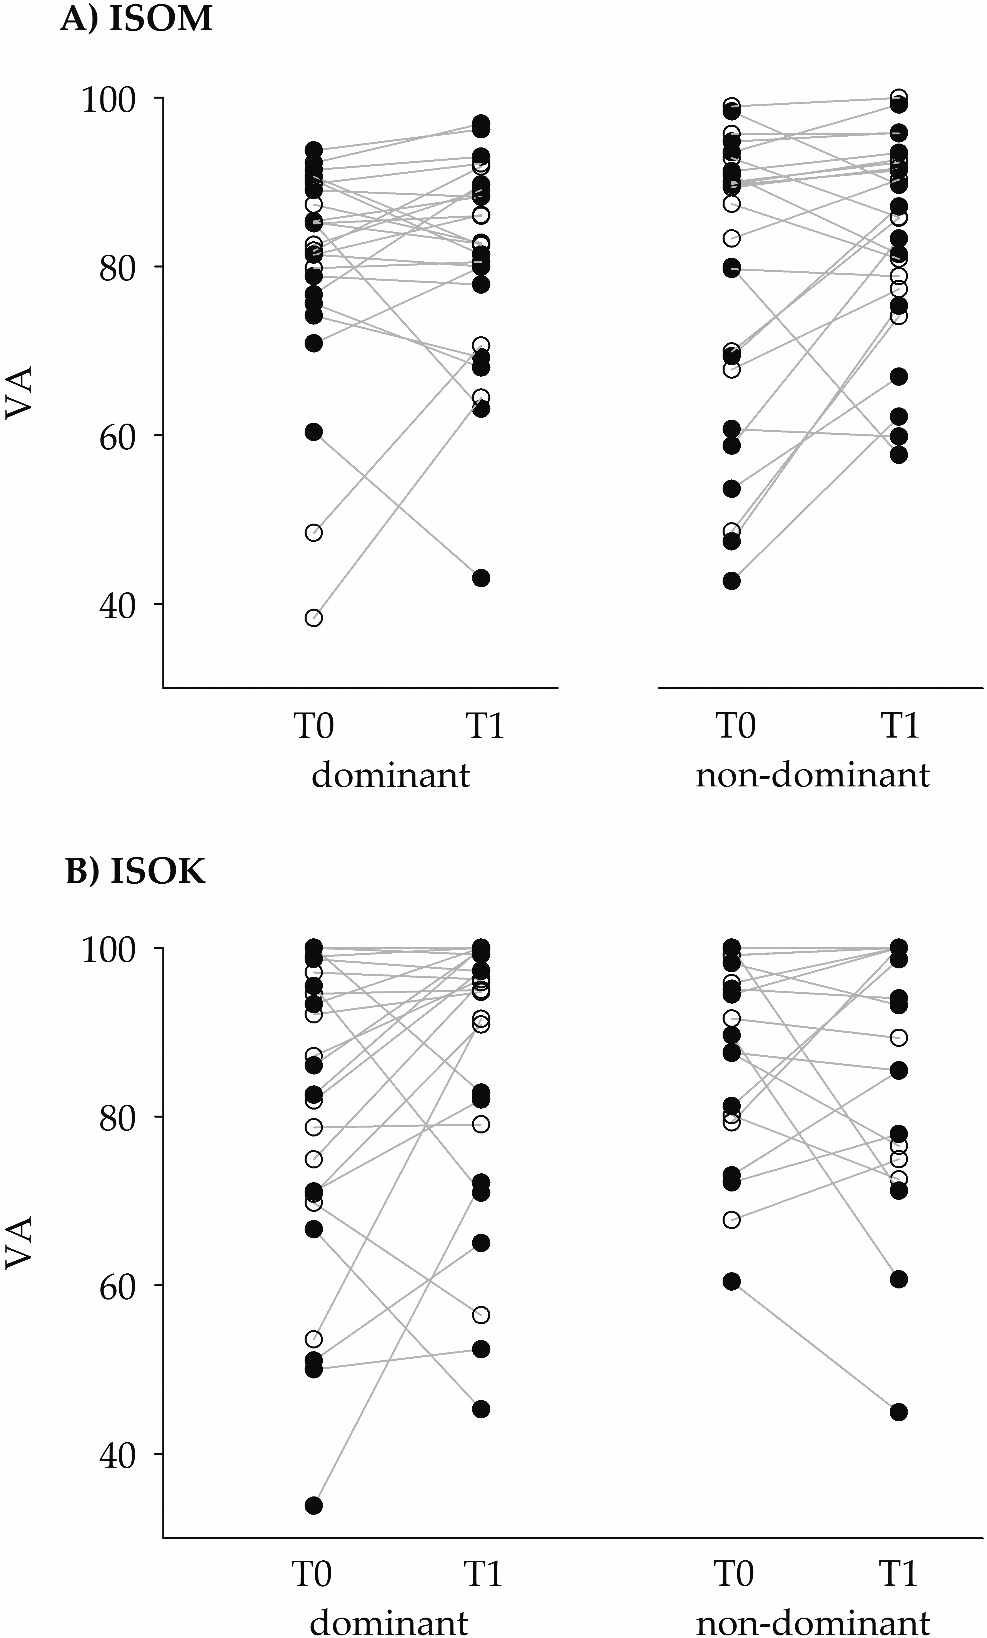
Figure 4.
The left ordinate gives the voluntary activation levels after logit transformation (VA
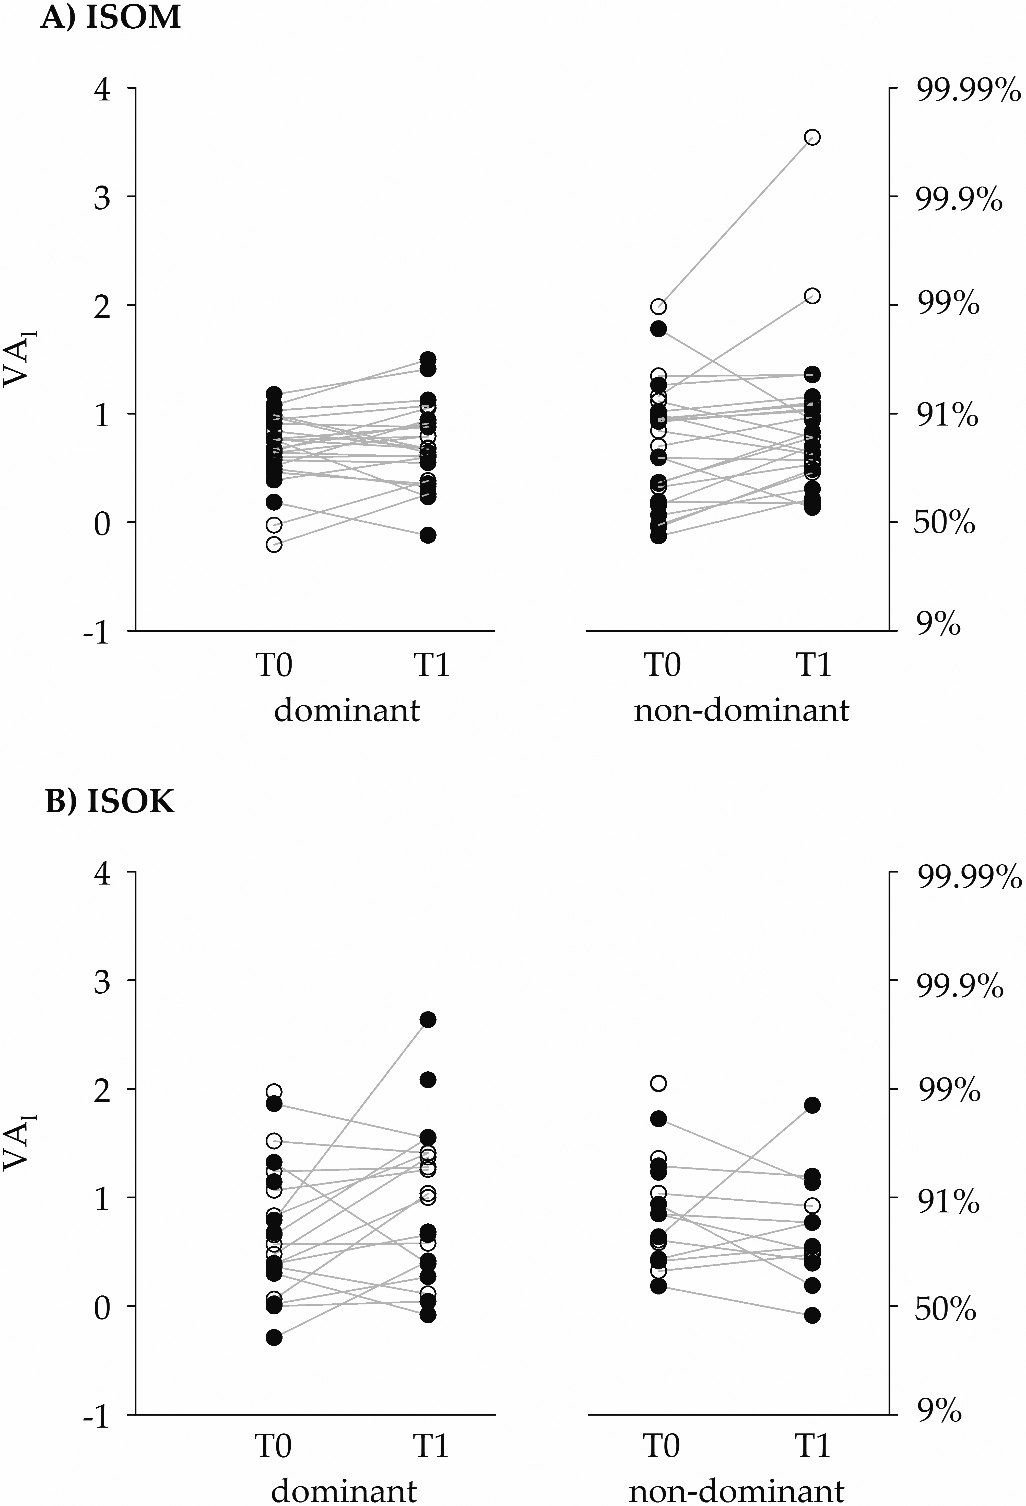
The absolute agreement between VA
2.3.11. Software
Computations, statistics, and graphic representations were performed using MATLAB
Table 2
Means, medians, 5
| T0 ( | T1 ( | |||||||
|---|---|---|---|---|---|---|---|---|
| Mean | Median | 5 | Mean | Median | 5 | |||
| VA (voluntary activation, %) | ||||||||
| ISOM_dominant men | 81.52 | 81.39 | 60.36 | 93.75 | 78.20 | 80.00 | 43.03 | 96.91 |
| ISOM_dominant women | 79.97 | 83.81 | 38.30 | 90.66 | 83.47 | 84.37 | 64.42 | 92.19 |
| ISOM_non-dominant men | 74.68 | 79.92 | 42.70 | 98.36 | 80.24 | 83.29 | 57.64 | 95.84 |
| ISOM_non-dominant women | 82.77 | 88.39 | 48.55 | 98.97 | 87.11 | 88.06 | 74.10 | 99.97 |
| ISOK_dominant men | 79.12 | 86.30 | 33.83 | 100.00 | 82.05 | 82.79 | 45.28 | 100.00 |
| ISOK_dominant women | 83.28 | 84.49 | 53.55 | 100.00 | 91.10 | 95.44 | 56.43 | 100.00 |
| ISOK_non-dominant men | 88.59 | 94.40 | 60.41 | 100.00 | 85.49 | 93.17 | 44.94 | 100.00 |
| ISOK_non-dominant women | 91.68 | 97.44 | 67.70 | 100.00 | 92.76 | 100.00 | 72.52 | 100.00 |
| Moment (Nm) | ||||||||
| ISOM_dominant men | 184.85 | 176.15 | 135.15 | 221.08 | 196.62 | 206.30 | 127.00 | 240.77 |
| ISOM_dominant women | 107.78 | 110.26 | 69.74 | 210.54 | 113.82 | 108.15 | 70.98 | 223.31 |
| ISOM_non-dominant men | 168.99 | 167.33 | 139.08 | 213.42 | 163.69 | 174.92 | 103.54 | 191.85 |
| ISOM_non-dominant women | 102.53 | 105.48 | 45.86 | 179.23 | 109.90 | 105.19 | 64.41 | 181.50 |
| ISOK_dominant men | 130.51 | 141.03 | 69.32 | 174.62 | 121.97 | 126.30 | 74.22 | 164.05 |
| ISOK_dominant women | 74.64 | 72.60 | 42.48 | 111.83 | 80.61 | 78.30 | 54.03 | 130.98 |
| ISOK_non-dominant men | 132.42 | 131.42 | 88.15 | 163.42 | 118.82 | 122.75 | 69.19 | 144.08 |
| ISOK_non-dominant women | 81.45 | 78.48 | 55.52 | 140.68 | 76.91 | 65.36 | 47.69 | 111.31 |
Table 3
From left to right, the columns report the values of intraclass correlation coefficients (ICC
| VA | ICC | 95% C.I. | MRD |
|---|---|---|---|
| ISOM (obs.; | 0.63 | 0.42–0.77 | 0.78 |
| ISOK (obs.; | 0.63 | 0.12–0.7 | 1.12 |
3.Results
Twenty-five subjects (12 women), median age 27.3 (24.0
In agreement with the classic muscle force-velocity relationship [45], higher moment peaks were recorded during ISOM with respect to ISOK, both at T0 and T1. Means, medians, and 5
Tests on raw VA data are given in the Appendix, Table A1.
In the present healthy sample, complete activation was never achieved during ISOM, either on the dominant or on the nondominant limb by any participant. During ISOK at T0 one woman and three men reached VA 100% with the dominant limb, while four women and four men reached VA 100% with the nondominant limb. During ISOK at T1 two women and three men reached VA 100% with the dominant limb, while nine women and four men reached VA 100% with the nondominant limb. Among these participants, one woman and one man, only, performed 100% VA during all isokinetic tests.
The distribution of VA
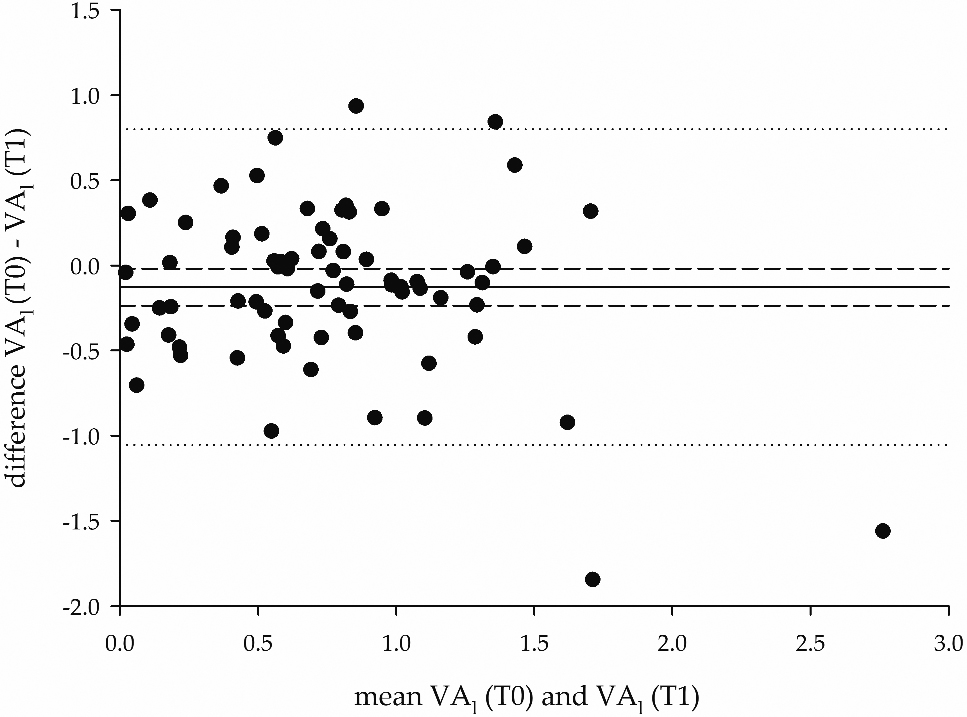
Figure 5.
Bland-Altman plot of the differences between the VA
It can be seen that the logit transformation provided a wider spread of measures (hence, a higher discrimination), compared to the original VA observations. The distribution of the data was tested with Shapiro Wilk’s test (Appendix: Table A2). The repeated ANOVA model on VA
In contrast, no differences were recorded depending on side dominance (
The values of ICC
Figure 5 shows a Bland-Altman plot on VA
4.Discussion
The results indicate that the proposed method of isokinetic measurement of VA on a sample of healthy participants through the ITT method may be reliable and clinically acceptable. To the best of the authors’ knowledge, this is the first study proposing aggregate data and test-retest reliability evaluation of quadriceps muscle VA under isokinetic conditions.
4.1Amount and reliability of activation
These results confirm that VA of the quadriceps muscle is incomplete during maximal ISOM contractions [2, 4, 19, 20, 23]. In contrast, some participants in this study displayed complete activation (i.e. VA 100%) during maximal ISOK at 40
4.2Comparison with previous studies; reasons for discrepancies
In this sample VA levels did not differ significantly between ISOK and ISOM, although mean and median values were slightly higher in isokinetic conditions (see Table 2). Previous findings by Babault reported slightly higher VA levels in isokinetic concentric contractions at 120
A possible explanation for these discrepancies lies in the higher VA levels reported for QF at joint angles closer to 90
In this sample, as far as between-limb differences are concerned, the dominant and non-dominant limbs displayed superimposable VA
The present study revealed statistically significant differences between women and men, with women demonstrating higher VA
Of relevance here, in the above cited studies and in most currently used isokinetic VA measurement techniques, the electrical stimulus was triggered when the joint reaches a certain angle during its movement. This technique of stimulation introduces an element of variability in the time of elicitation of the interpolated twitch along the curve because its latency depends on many factors: type of contraction (isometric vs. isokinetic), joint angular velocity, muscle conduction velocity, electrode positioning, time for excitation-contraction coupling, and tendon stiffness [1]. Therefore, comparisons are difficult when different angular velocities and knee joint angles are involved. In contrast, the stimulation technique performed in the present study is characterised by the computation of the instant of stimulation in order to have the peak of the interpolated twitch to occur consistently at exactly the desired knee angle [1].
4.3Advantages of logit linearisation
In the present study, only the analysis performed on transformed data was able to detect a sex-related difference in VA
a) a difference in muscle fibre structure. Although the overall distribution of fast and slow fibre types in the vastus lateralis muscle is similar between women and men, a significant difference exists when the total area occupied by each fibre type is considered. In a study by Staron et al. [52], slow fibres were observed to occupy a greater area in the vastus lateralis muscle of women, whereas fast IIA fibres occupied a greater area in the vastus lateralis muscle of men. According to Henneman’s size principle of motor unit recruitment, the fast motor units also have the highest recruitment thresholds [53]. As already hypothesised by Behm et al. [2], fast-twitch predominant muscles may be more difficult to fully activate during voluntary contractions. Therefore, when compared to women, the quadriceps femoris muscle of men might display lower mean and median values in voluntary activation levels.
b) The results may reflect a (hardly avoidable) mechanical artefact. Since VA is calculated as the complement to the ratio of IT and RT, the modification of one of these two parameters would alter the resulting VA value. In particular, an anterior tilt of the pelvis during knee extension would imply a shortening of the rectus femoris muscle and, as a consequence, a loss of knee extensor moment. The subsequent reduction of IT would lead to an increase in VA. Anatomical resting pelvic tilt does not display significant betweensex differences [54, 55]. Nevertheless, women are known to have significantly lower abdominal muscle thickness than men [56], hence a potentially lower capacity for preventing pelvic tilt during maximal knee-extension effort. In addition, women might demonstrate later onsets in anticipatory postural adjustments of trunk muscles compared to men in single lower limb lift movements [57]. Again, these differences may eventually lead to a pelvic tilt causing lower IT peaks and higher VA estimates in women.
4.4The need for a logit transformation
The suggestion of using logit units, unfamiliar to most clinicians, may appear a major limitation of the method. However, the simple computation of the MRD (second Equation in the Methods) can be easily performed on any spreadsheet or hand calculator. This value represents a threshold that is easy to interpret for decisions on individuals. Its critical advantage on percentage scores is that the measure of change becomes independent of the baseline values. In other words, a 1-logit change means the same amount of change of “activation” at whatever level of the 0–100% scale. It is not so for raw percent changes, which are “compressed” (and therefore, underestimated) when the VA values are approaching the extremes of the acceptable range [46]. The linearization problem, often overlooked in the biomedical literature, arises with VA but not with moments: these are intrinsically linear (i.e., a 1-moment change means the same change whatever was the baseline level). Moments, however, were not the topic of the present article.
The provided MRD values found here can be used to exemplify the logit-to-percentages transformation of change values. The MRD was 0.78 and 1.12 logits for ISOM and ISOK, respectively. A 0.78 logit change might reflect a change in VA from 28% to 70% (see the second Equation in the Methods) and from 76% to 95%. Likewise, a 1.12 logit change might reflect a change in VA from 79% to 98% and from 30% to 85%. In clinical practice, mirror reasoning may apply. The typical question may be checking whether a given observed percentage change does reveal or not a “real” change. In the latter example above, baseline and retest ISOK VA values of 30% and 85% correspond to
4.5On the size of the observed MRD
In clinical terms, the MRD values of activation, for both ISOM and ISOK contexts, seem rather large. Stated otherwise, a large change must be observed before it can be considered as “real”. This may reflect a) limitations of the present study as well as b) difficulties intrinsic to the measurement of this variable.
a) In this particular study, some test-retest instability (thus increasing the MRD) may be due to the small sample size and to the presence of outliers. On the other hand, there were no previously available data allowing for a-priori estimation of sample size. In addition, even smaller sample sizes are common in the literature on isokinetic quadriceps dynamometry [10, 12, 46]. Some instability might also stem from the absence of substantial habituation-learning processes, prevented by the experimental design. On the other hand, the design aimed to reproduce clinical contexts, in which no substantial practice is usually allowed.
b) With respect to activation itself, this seems to be intrinsically unstable. In fact, VA is a psychological (not a biological) variable which may be influenced by numerous extraneous factors (learning, fatigue, fear, motivation, attention, etc.). In addition, in human physiology the maximum voluntary muscle activation is close to its limit (i.e., 100%). The “crowding” of values hinders the precision of measurement, hence reliability studies.
Last, a “real” change, i.e., a statistically significant one, is not necessarily a clinically important one. In general, clinical “significance” requires statistical significance, but the cut-off is higher and based on external criteria (e.g., mortality risk, the incidence of a given disease, success probability in an examination, or whatever) [58]. In the case of VA
4.6Further limitations and conclusions
The study limits cannot be overemphasised. The results refer to isometric contraction and to one isokinetic velocity (100
Author contributions
CONCEPTION: Luigi Tesio.
PERFORMANCE OF WORK: Luigi Catino, Chiara Malloggi, Valeria Cerina and Stefano Scarano.
INTERPRETATION OR ANALYSIS OF DATA: Luigi Catino, Chiara Malloggi, Stefano Scarano and Luigi Tesio.
PREPARATION OF MANUSCRIPT: Luigi Catino and Stefano Scarano.
REVISION FOR IMPORTANT INTELLECTUAL CONTENT: Luigi Catino Chiara Malloggi, Valeria Cerina, Stefano Scarano, Viviana Rota and Luigi Tesio.
SUPERVISION: Luigi Tesio.
Ethical considerations
All participants gave written informed consent before participating. The study was approved by the ethics committee of the institution (project code 24C721_ 2017, date of approval 14
Funding
The study was supported by Istituto Auxologico Italiano, IRCCS [AMULET, “ricerca corrente” project code 24C721_2017].
Acknowledgments
The authors have no acknowledgments.
Conflict of interest
The authors have no conflicts of interest to report.
References
[1] | Malloggi C, Catino L, Rota V, et al. ((2019) ). Measuring voluntary activation of the quadriceps femoris during isokinetic concentric contractions. Isokinetic Exerc Sci. 27: : 125–134. doi: 10.3233/IES-182224. |
[2] | Behm DG, Whittle J, Button D, Power K. ((2002) ). Intermuscle differences in activation. Muscle and Nerve. 25: : 236–243. doi: 10.1002/mus.10008. |
[3] | Taylor JL. ((2009) ). Point: the interpolated twitch does provide a valid measure of the voluntary activation of muscle. J Appl Physiol. 107: : 354–358. doi: 10.1152/japplphysiol.91220.2008. |
[4] | Belanger AY, McComas AJ. ((1981) ). Extent of motor unit activation during effort. J Appl Physiol Respir Env Exerc Physiol. 51: : 1131–1135. |
[5] | Campbell EL, Seynnes OR, Bottinelli R, et al. ((2013) ). Skeletal muscle adaptations to physical inactivity and subsequent retraining in young men. Biogerontology. 14: : 247–259. doi: 10.1007/s10522-013-9427-6. |
[6] | Matkowski B, Martin A, Lepers R. ((2011) ). Comparison of maximal unilateral versus bilateral voluntary contraction force. Eur J Appl Physiol. 111: : 1571–1578. doi: 10.1007/s00421-010-1775-1. |
[7] | De Serres SJ, Enoka RM, Serres D. ((1998) ). Older adults can maximally activate the biceps brachii muscle by voluntary command. J Appl Meas. 84: : 284–291. |
[8] | Krishnan C, Williams GN. ((2010) ). Quantification method affects estimates of voluntary quadriceps activation. Muscle and Nerve. 41: : 868–874. doi: 10.1002/mus.21613. |
[9] | Gandevia SC, Herbert RD, Leeper JB. ((1998) ). Voluntary activation of human elbow flexor muscles during maximal concentric contractions. J Physiol. 512: : 595–602. doi: 10.1111/J.1469-7793.1998.595BE.X. |
[10] | Newham DJ, McCarthy T, Turner J. ((1991) ). Voluntary activation of human quadriceps during and after isokinetic exercise. J Appl Physiol. 71: : 2122–2126. doi: 10.1152/jappl.1991.71.6.2122. |
[11] | Gandevia SC, McNeil CJ, Carroll TJ, Taylor JL. ((2013) ). Twitch interpolation: superimposed twitches decline progressively during a tetanic contraction of human adductor pollicis. J Physiol. 591: : 1373–83. doi: 10.1113/jphysiol.2012.248989. |
[12] | Babault N, Pousson M, Ballay Y, Van Hoecke J. ((2001) ). Activation of human quadriceps femoris during isometric, concentric, and eccentric contractions. J Appl Physiol. 91: : 2628–2634. doi: 10.1152/jappl.2001.91.6.2628. |
[13] | Duchateau J, Enoka RM. ((2016) ). Neural control of lengthening contractions. J Exp Biol. 219: : 197–204. doi: 10.1242/jeb.123158. |
[14] | Wilder MR, Cannon J. ((2009) ). Effect of age on muscle activation and twitch properties during static and dynamic actions. Muscle and Nerve. 39: : 683–691. doi: 10.1002/mus.21233. |
[15] | Linnamo V, Strojnik V, Komi PV. ((2006) ). Maximal force during eccentric and isometric actions at different elbow angles. Eur J Appl Physiol. 96: : 672–678. doi: 10.1007/s00421-005-0129-x. |
[16] | Rice CL, Vollmer TL, Bigland-Ritchie B. ((1992) ). Neuromuscular responses of patients with multiple sclerosis. Muscle Nerve. 15: : 1123–1132. doi: 10.1002/mus.880151011. |
[17] | Phillips SK, Bruce SA, Newton D, Woledge RC. ((1992) ). The weakness of old age is not due to failure of muscle activation. J Gerontol. 47: : M45–49. |
[18] | Rutherford OM, White PD. ((1991) ). Human quadriceps strength and fatiguability in patients with post viral fatigue. J Neurol Neurosurg Psychiatry. 54: : 961–964. |
[19] | Kalmar JM, Cafarelli E. ((1999) ). Effects of caffeine on neuromuscular function. J Appl Physiol. 87: : 801–808. |
[20] | Strojnik V. ((1995) ). Muscle activation level during maximal voluntary effort. Eur J Appl Physiol Occup Physiol. 72: : 144–149. |
[21] | Morton JP, Atkinson G, MacLaren DP, et al. ((2005) ). Reliability of maximal muscle force and voluntary activation as markers of exercise-induced muscle damage. Eur J Appl Physiol. 94: : 541–548. doi: 10.1007/s00421-005-1373-9. |
[22] | Kean CO, Birmingham TB, Garland SJ, et al. ((2010) ). Minimal detectable change in quadriceps strength and voluntary muscle activation in patients with knee osteoarthritis. Arch Phys Med Rehabil. 91: : 1447–1451. doi: 10.1016/j.apmr.2010.06.002. |
[23] | Behrens M, Husmann F, Gube M, et al. ((2017) ). Intersession reliability of the interpolated twitch technique applied during isometric, concentric, and eccentric actions of the human knee extensor muscles. Muscle Nerve. 56: : 324–327. doi: 10.1002/mus.25498. |
[24] | Portney L, Watkins M. ((2015) ). Statistical measures of reliability. In: Foundations of clinical research. Applications to practice, 3rd ed. F.A. Davis Company, Philadelphia, pp. 585–618. |
[25] | Tesio L. ((2012) ). Outcome measurement in behavioural sciences: a view on how to shift attention from means to individuals and why. Int J Rehabil Res. 35: : 1–12. doi: 10.1097/MRR.0b013e32834fbe89. |
[26] | Beckerman H, Roebroeck ME, Lankhorst GJ, et al. ((2001) ). Smallest real difference, a link between reproducibility and responsiveness. Qual Life Res. 10: : 571–578. doi: 10.1023/A:1013138911638. |
[27] | Elias LJ, Bryden MP, Bulman-Fleming MB. ((1998) ). Footedness is a better predictor than is handedness of emotional lateralization. Neuropsychologia. 36: : 37–43. doi: 10.1016/S0028-3932(97)00107-3. |
[28] | Li CK, Chan KM, Hsu SY, et al. ((1993) ). The Johnson antishear device and standard shin pad in the isokinetic assessment of the knee. Br J Sports Med. 27: : 49–52. doi: 10.1136/bjsm.27.1.49. |
[29] | Suter E, Herzog W. ((2001) ). Effect of number of stimuli and timing of twitch application on variability in interpolated twitch torque. J Appl Physiol. 90: : 1036–1040. doi: 10.1152/jappl.2001.90.3.1036. |
[30] | Bampouras TM, Reeves ND, Baltzopoulos V, Maganaris CN. ((2006) ). Muscle activation assessment: effects of method, stimulus number, and joint angle. Muscle Nerve. 34: : 740–746. doi: 10.1002/mus.20610. |
[31] | Folland JP, Williams AG. ((2007) ). Methodological issues with the interpolated twitch technique. J Electromyogr Kinesiol. 17: : 317–327. doi: 10.1016/j.jelekin.2006.04.008. |
[32] | Nørregaard J, Lykkegaard JJ, Bülow PM, Danneskiold-Samsøe B. ((1997) ). The twitch interpolation technique for the estimation of true quadriceps muscle strength. Clin Physiol. 17: : 523–532. doi: 10.1046/j.1365-2281.1997.05555.x. |
[33] | Bülow PM, Nørregaard J, Mehlsen J, Danneskiold-Samsøe B. ((1995) ). The twitch interpolation technique for study of fatigue of human quadriceps muscle. J Neurosci Methods. 62: : 103–109. doi: 10.1016/0165-0270(95)00062-3. |
[34] | Pap G, Machner A, Awiszus F. ((2004) ). Strength and voluntary activation of the quadriceps femoris muscle at different severities of osteoarthritic knee joint damage. J Orthop Res. 22: : 96–103. doi: 10.1016/S0736-0266(03)00128-1. |
[35] | Hermens HJ, Freriks B, Merletti R, et al. ((1999) ). European Recommendations for Surface ElectroMyoGraphy. |
[36] | Kufel TJ, Pineda LA, Jeffery Mador M. ((2002) ). Comparison of potentiated and unpotentiated twitches as an index of muscle fatigue. Muscle and Nerve. 25: : 438–444. doi: 10.1002/mus.10047. |
[37] | Place N, Maffiuletti NA, Martin A, Lepers R. ((2007) ). Assessment of the reliability of central and peripheral fatigue after sustained maximal voluntary contraction of the quadriceps muscle. Muscle Nerve. 35: : 486–495. doi: 10.1002/mus.20714. |
[38] | Warton DI, Hui FKC. ((2011) ). The arcsine is asinine: the analysis of proprtions in ecology. Ecology. 92: : 3–10. |
[39] | Canning CG, Ada L, O’Dwyer N. ((1999) ). Slowness to develop force contributes to weakness after stroke. Arch Phys Med Rehabil. 80: : 66–70. doi: 10.1016/S0003-9993(99)90309-X. |
[40] | Marklund I, Klässbo M. ((2006) ). Effects of lower limb intensive mass practice in poststroke patients: single-subject experimental design with long-term follow-up. Clin Rehabil. 20: : 568–576. doi: 10.1191/0269215506cr973oa. |
[41] | Wade D. ((1992) ). Measurement in neurological rehabilitation. Oxford University Press. |
[42] | Tesio L, Rota V, Chessa C, Perucca L. ((2010) ). The 3D path of body centre of mass during adult human walking on force treadmill. J Biomech. 43: : 938–944. doi: 10.1016/j.jbiomech.2009.10.049. |
[43] | Cavagna GA, Tesio L, Fuchimoto T, Heglund NC. ((1983) ). Ergometric evaluation of pathological gait. J Appl Physiol. 55: : 607–613. doi: 10.1152/jappl.1983.55.2.606. |
[44] | Altman DG, Bland JM. ((1983) ). Measurement in medicine: the analysis of method comparison studies. Stat. 32: : 307–311. |
[45] | Hill AV. ((1938) ). The heat of shortening and the dynamic constants of muscle. Proc R Soc B Biol Sci. 126: : 136–195. doi: 10.1098/rspb.1938.0050. |
[46] | Babault N, Pousson M, Michaut A, et al. ((2002) ). EMG activity and voluntary activation during knee-extensor concentric torque generation. Eur J Appl Physiol. 86: : 541–547. doi: 10.1007/s00421-002-0579-3. |
[47] | Krishnan C, Theuerkauf P. ((2015) ). Effect of knee angle on quadriceps strength and activation after anterior cruciate ligament reconstruction. J Appl Physiol. 119: : 223–231. doi: 10.1152/japplphysiol.01044.2014. |
[48] | Pietrosimone BG, Park CM, Gribble PA, et al. ((2012) ). Inter-limb differences in quadriceps strength and volitional activation. J Sports Sci. 30: : 471–477. doi: 10.1080/02640414.2011.645054. |
[49] | Philippot R, Boyer B, Testa R, et al. ((2012) ). The role of the medial ligamentous structures on patellar tracking during knee flexion. Knee Surgery, Sport Traumatol Arthrosc. 20: : 331–336. doi: 10.1007/s00167-011-1598-6. |
[50] | Sanchis-Alfonso V. ((2016) ). How to deal with chronic patellar instability: what does the literature tell us? Sports Health. 8: : 86–90. doi: 10.1177/1941738115604156. |
[51] | Berger MJ, McKenzie CA, Chess DG, et al. ((2012) ). Sex differences in quadriceps strength in OA. Int J Sports Med. 33: : 926–933. doi: 10.1055/s-0032-1311587. |
[52] | Staron RS, Hagerman FC, Hikida RS, et al. ((2000) ). Fiber type composition of the vastus lateralis muscle of young men and women. J Histochem Cytochem. 48: : 623–629. doi: 10.1177/002215540004800506. |
[53] | Henneman E, Clamann HP, Gillies JD, Skinner RD. ((1974) ). Rank order of motoneurons within a pool: law of combination. J Neurophysiol. 37: : 1338–49. doi: 10.1152/jn.1974.37.6.1338. |
[54] | Imai N, Suzuki H, Nozaki A, et al. ((2019) ). Evaluation of anatomical pelvic parameters between normal, healthy men and women using three-dimensional computed tomography: a cross-sectional study of sex-specific and age-specific differences. J Orthop Surg Res. 14: : 1–7. doi: 10.1186/s13018-019-1165-2. |
[55] | Herrington L. ((2011) ). Assessment of the degree of pelvic tilt within a normal asymptomatic population. Man Ther. 16: : 646–648. doi: 10.1016/j.math.2011.04.006. |
[56] | Rankin G, Stokes M, Newham DJ. ((2006) ). Abdominal muscle size and symmetry in normal subjects. Muscle and Nerve. 34: : 320–326. doi: 10.1002/mus.20589. |
[57] | Bussey MD, de Castro MP, Aldabe D, Shemmell J. ((2018) ). Sex differences in anticipatory postural adjustments during rapid single leg lift. Hum Mov Sci. 57: : 417–425. doi: 10.1016/j.humov.2017.10.003. |
[58] | Page F. ((2014) ). Clinical commentary beyond statistical significance: clinical interpretation of rehabilitation research corresponding author. Int J Sports Phys Ther. 9: : 726–736. |
[59] | Shrout PE, Fleiss JL. ((1979) ). Intraclass correlations: uses in assessing rater reliability. Psychol Bull. 86: : 420–428. |
Appendices
Appendix
Table A1
Results from A) Shapiro-Wilk’s, B) and C) Wilcoxon signed rank tests on percent voluntary activation (VA) data for the isometric contractions (ISOM) and the isokinetic concentric contractions (ISOK) for both limb sides (dominant and non-dominant) during the test (T0) and the retest (T1).
| VA | |
|---|---|
| Shapiro-Wilk’s test | Bonferroni corrected |
| ISOM_T0 | 0.000 |
| ISOM_T1 | 0.005 |
| ISOK_T0 | 0.000 |
| ISOK_T1 | 0.000 |
| ISOM_dominant | 0.000 |
| ISOM_non-dominant | 0.000 |
| ISOK_dominant | 0.000 |
| ISOK_non-dominant | 0.000 |
Table A2
Results from the Shapiro-Wilk test on logit-transformed voluntary activation (percent voluntary activation, VA, converted to the logit of the raw values, VA
| VA | |
|---|---|
| Shapiro-Wilk test | Bonferroni corrected |
| ISOM_T0 | 0.30 |
| ISOM_T1 | 0.00 |
| ISOK_T0 | 0.24 |
| ISOK_T1 | 0.05 |
| ISOM_dominant | 0.54 |
| ISOM_non-dominant | 0.00 |
| ISOK_dominant | 0.11 |
| ISOK_non-dominant | 0.10 |
Table A3
Results from the repeated ANOVA model for VA
| VA | |
|---|---|
| Repeated ANOVA model | |
| R | 0.06 |
| P | |
| Model | 0.08 |
| Sex | 0.01 |
| Test (ISOM vs. ISOK) | 0.18 |
| Lower limb side dominance | 0.29 |
| Time point | 0.27 |
| Dominance#Time point | 0.49 |
| Sex#Time point | 0.89 |


