
Heart rate variability as a possible predictor of sport performance in junior rhythmic gymnastics
Abstract
BACKGROUND:
Heart rate variability may reveal sensitive information about the athletes’ physiological adaptation when exercising for sport performance.
OBJECTIVE:
The aim of this study was to demonstrate whether heart rate variability (HRV) measurements were able to predict sport results and determine which type of measurements, at rest or during routines, were relevant in anticipating the performance.
METHOD:
Ten female gymnasts, aged 11–14 years old, and 16 age-matched non-active adolescents participated in this study. HRV was measured at rest for 10 minutes and throughout the training routines one week prior to competition. Correlations and multivariate analysis determined the parameters predicting performance. Significance was set at
Results:
At rest, the gymnasts displayed higher HRV values than controls. At rest, sympathetic parameters correlated with sport results whereas no correlation was observed during routines. The magnitude of the predictive factors highlighted the importance of Ln SD2 (coefficient
CONCLUSIONS:
HRV at rest may predict results in competition, being a complementary tool for coaches.
1.Introduction
The specific characteristics of rhythmic gymnastics involve high technical-combinative content, both from physiological and motor control perspectives. In this context, numerous studies have acknowledged the importance of monitoring biological factors as a resource to refine athletes’ preparation [1].
Given the complex physical and neuro-motor specific demands (linked to kinematic, dynamic and artistic high requirements), coaches need to access in-depth information about the gymnasts’ training level and physiological readiness in order to decide the best strategy for the competition.
In this context, heart rate variability measurements allow assessment of physiological readiness expressed by a balanced ratio between sympathetic and parasympathetic drives in certain periods of training and competition [2]. This has been demonstrated in male gymnasts, some authors pointing out that the period preceding an important competition influences the performances and HRV in this category of athletes [3].
Heart rate variability (HRV) describing the oscillations of each interval between consecutive heart beats allows analysis of the components of the autonomous nervous system (ANS) and therefore offers global information concerning the regulation of physiological processes under specific conditions, such as psychological state during sport competition [4]. Regarding literature reviews, studies have shown that cardiac autonomic modulation is related to physical activity [5] and it can be improved by physical training [6]. Nuances are introduced by some authors regarding HRV measurements not widely implemented to monitor athletes’ responses to training load, probably because of apparent contradictory findings in the literature [7].
Given the myriad of aspects determining sports success in rhythmic gymnastics, the aim of this study is to demonstrate whether HRV measurements may predict competition results and to determine which type of measurements, at rest or during routines, are relevant in anticipating the performance.
We hypothesized that significant differences would be found in terms of HRV between junior rhythmic gymnasts and non-athletes peers while resting HRV parameters might predict sports performance in rhythmic gymnastics.
2.Methods
2.1Subjects
The study included 10 junior rhythmic gymnasts, aged between 11 and 14 years old and a group of 16 age-matched non-active adolescent females, recruited in school classes to serve as a control group. The number of participants reflected the need to obtain a correlation coefficient greater than 0.8, for a two-sided type I error at 5% and a statistical power at 80%.
The gymnasts had 5–8 years of training experience, with a structured training of 20–24 hours/week, being involved in high level national and international junior competitions. No exclusion criteria were used because the group of athletes included a small population, without major health issues and common healthy active life styles. The control group was not enrolled in any sports performance activities, being involved only in the physical education classes – 2 sessions of 50 minutes per week. All participants had no significant medical records or health disorders. The local Research Ethics Commission approved the research protocol of this study, which was in conformity with the Declaration of Helsinki. All participants and their parents were informed about the aim of the study, benefits and risks of the procedure, prior to parental signing the informed consent.
2.2Design
This research used a cross-sectional study design based on providing data about HRV measurements on two groups, one involving junior gymnasts and the other one representing non-athletes controls. For the athletes’ group we also investigated whether HRV response was different at rest compared to training routines, along with examining the relationship between HRV parameters and the variable results in competition. The choice of including athletes and non-athletes participants underpins the extent to which specific training requirements in rhythmic gymnastics impact HRV parameters, besides other typical long-term adaptations emphasized in the literature, by comparison with the standard physical activity provided in school curricula.
2.3Anthropometric characteristics
The participants’ weights and heights were measured whilst wearing light clothes and bare-footed, using a digital scale and a standard wall-mounted stadiometer respectively. Body mass index (BMI) was calculated. Assessment of body fat mass was performed based on the sum of four skinfold measurements: bicipital, tricipital, subscapular and suprailiac. The maturation status of both groups was assessed by means of Tanner stages.
2.4Procedure
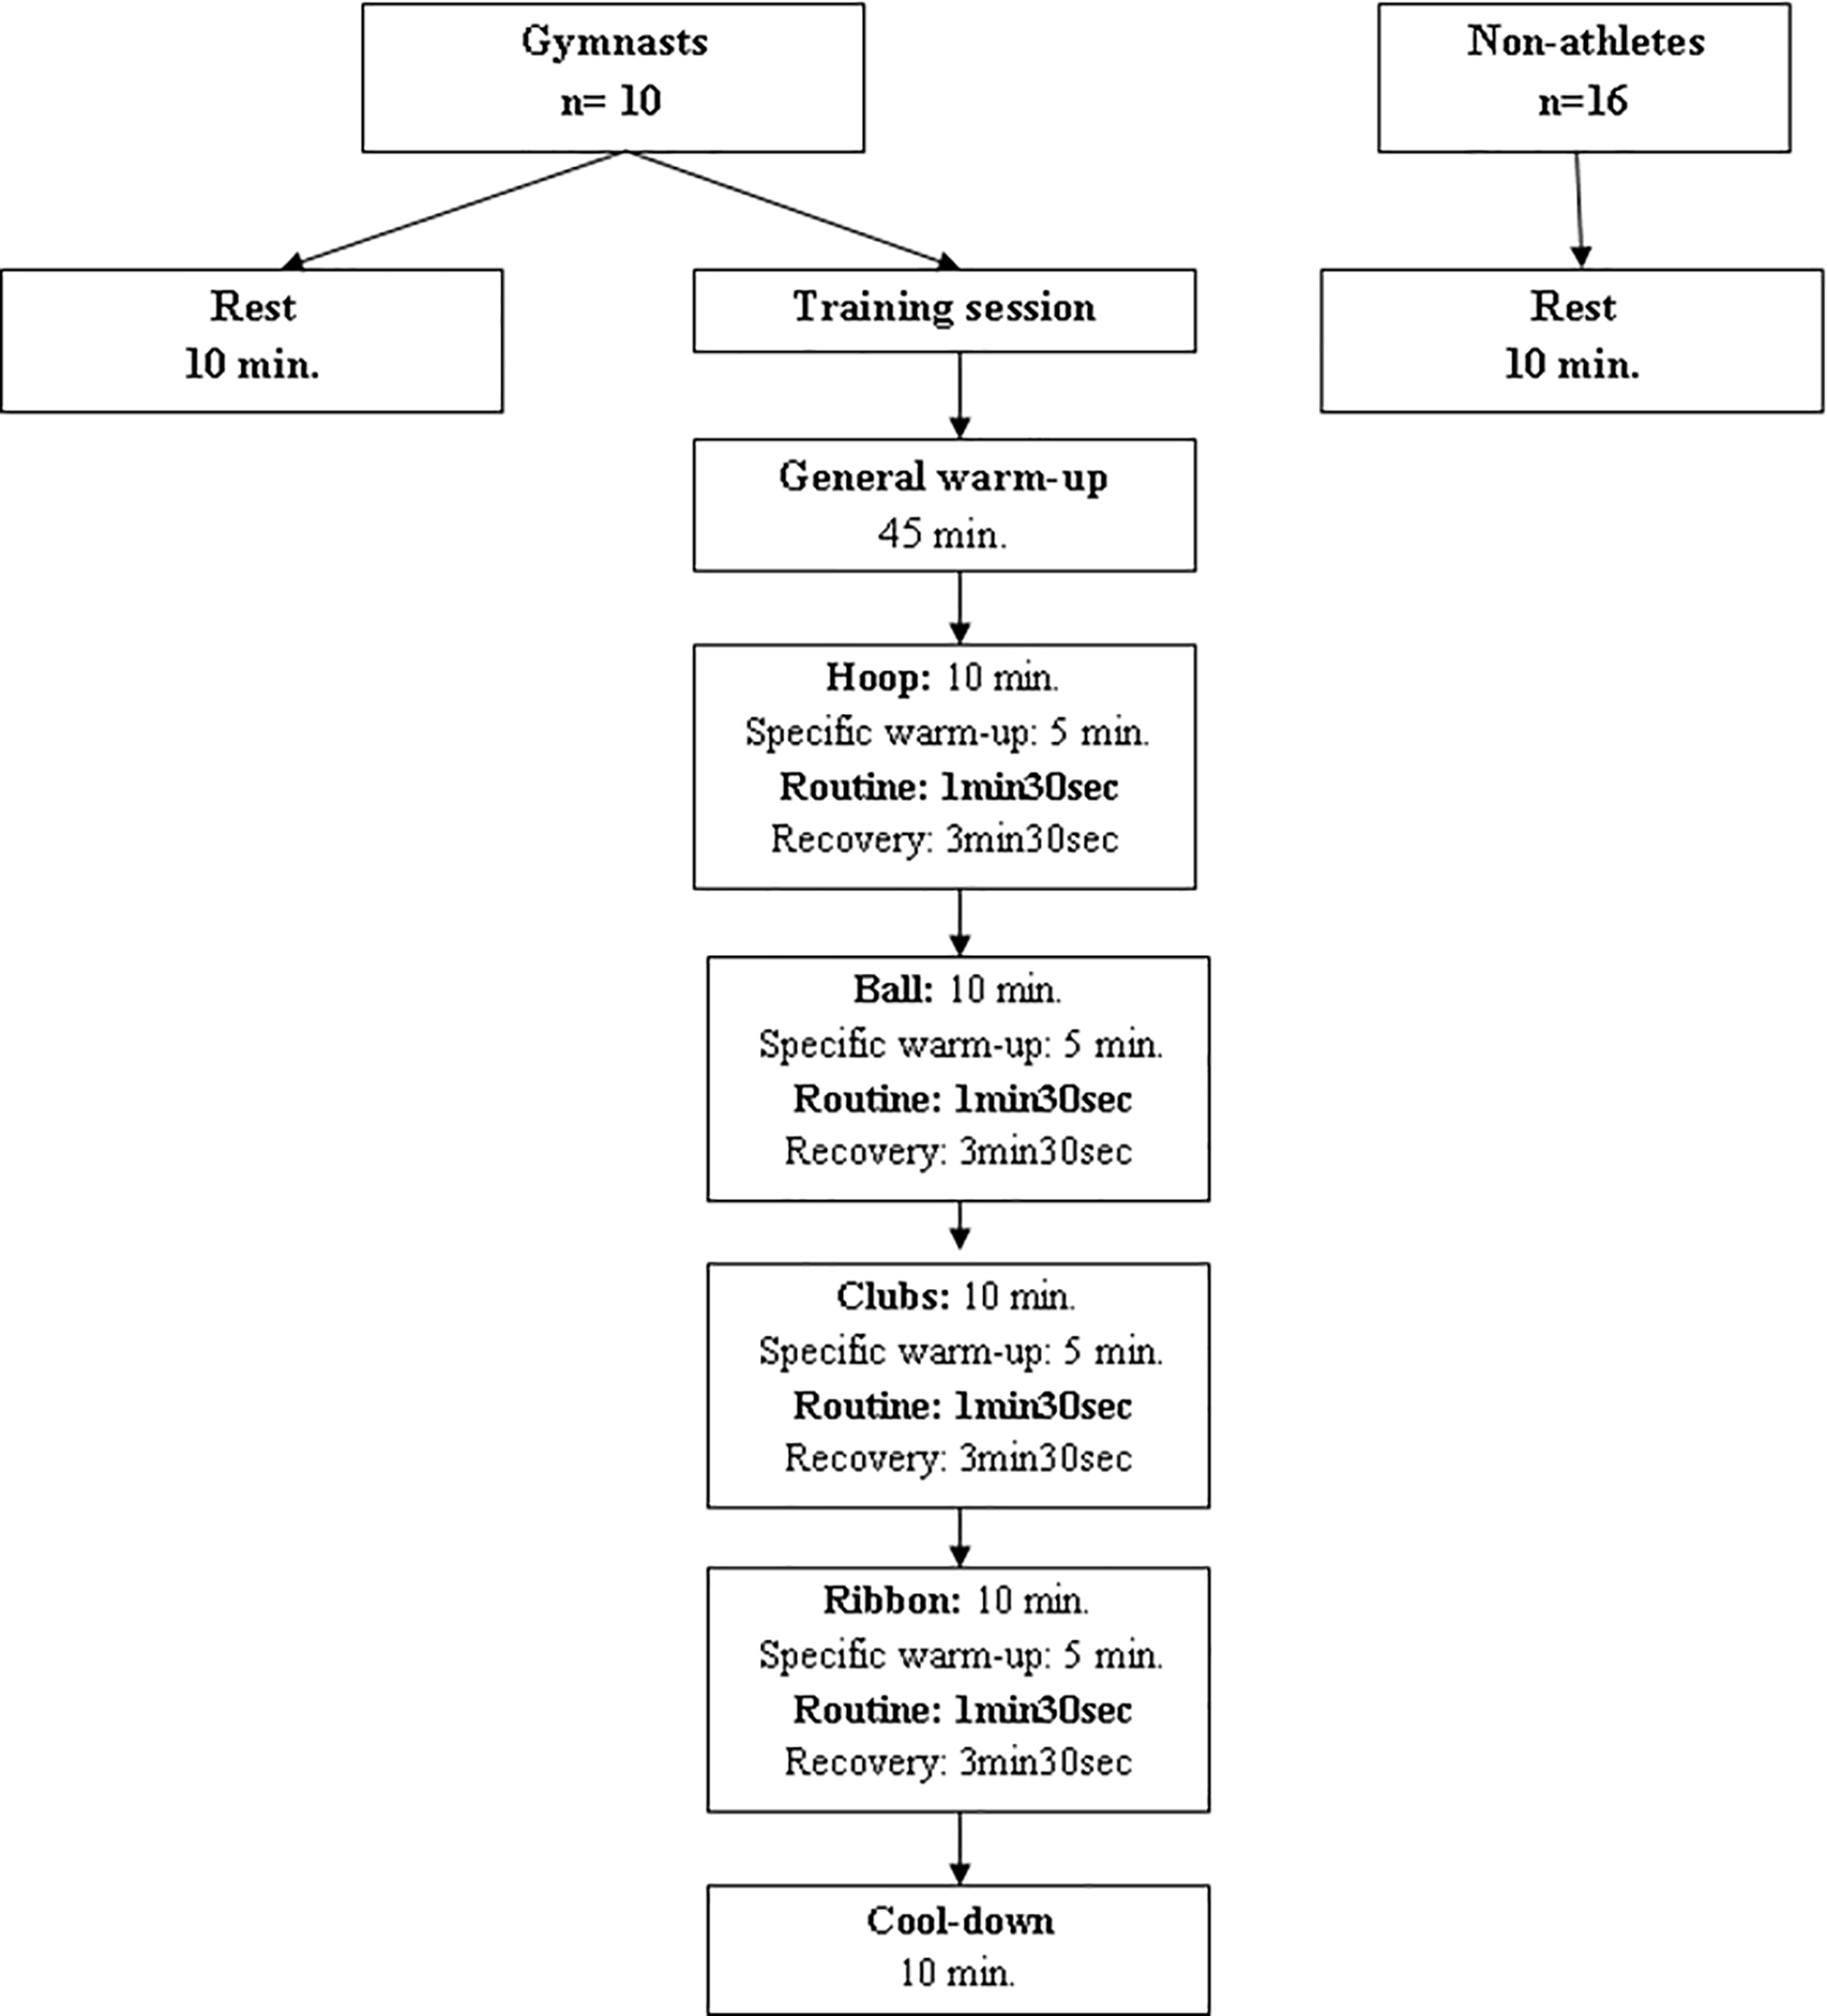
2.4.1Heart rate variability (HRV) monitoring (Fig. 1)
In order to fulfil the aim of the study, the following objectives were pursued: assessing HRV parameters at rest and during specific routines; identifying specific notes of HRV in rhythmic gymnasts compared to controls; exploring HRV as a possible predictor for the sports results.
Figure 1.
Study design and flow chart.
BioHarness BT3 units from Zephyr Tech- nologies
Therefore, for rhythmic gymnasts the measurements of HRV were performed during ten minutes at rest, before the training session, early in the morning, one week before the competition. This parameter was also monitored during the training session, with specific selection of the periods while the four apparatus routines were performed: hoop, ball, clubs, and ribbon. Each of the routines has a duration of 1 min 30 sec. In order to analyse HRV only within the training routines, each apparatus was timed and marked from the whole period monitored. We mention that the training session was entirely shaped according to the competition requirements. Concretely, this was part of a micro-cycle wherein training loads (volume) were reduced, sports specific fitness was maintained, allowing a greater potential for future competitive conduct. In order the gymnasts to perform at their peak, this taper period ended two days before the target competition so their bodies could take a break from the intense exercise rigor. The session was structured in three parts: 45 minute general warm-up, 40 minute including specific warm-up and one routine performance for each apparatus, followed by a 10 minute cool-down. The controls were measured during twenty minutes at rest, in the morning, under the same conditions and we analysed a 10-minute period of stable periodogram. The participants followed a natural breathing pattern, without any guided alterations. Indeed, even if it is well known that breathing pattern may impact the HRV values, the 20-minute duration of acquisition did not allow a breathing control.
2.4.2Scoring of results in competition
All gymnasts took part in national and international gymnastics events in 2018. In order to allow relevant statistical analysis, the performance of each athlete was converted into a score, depending on the individual, team and apparatus finals rankings of the subjects. We mention that judging in gymnastics is based on the scores obtained for technical difficulty and execution accuracy (determining the ranking), without any interference from other competitors. Thus, the sport results of the gymnasts were codified as follows: Code 1: gold, regardless of the competition event (individual, team, apparatus finals); Code 2: silver, regardless of the competition event (individual, team, apparatus finals); Code 3: bronze, regardless of the competition event (individual, team, apparatus finals); Code 4: 4 to 15 places, regardless of the competition event (individual, team, apparatus finals); Code 5: 16 to the last place, regardless of the competition event; Code 6: no participation in one or more competition events.
2.4.3HRV – data analysis
At rest: The raw HRV (R-R interval) data extracted from the BioHarness3 units were analyzed with Kubios HRV software (version 2.0; Department of Physics, University of Kuopio, Kuopio, Finland) by the same operator. HRV analysis followed task force recommendations [12]. Indexes obtained for the rest measurements from linear methods were calculated and compared between gymnasts and controls. Data was processed by using the ten-minute recording while in a supine position, the first and last thirty seconds being discarded. Artifact correction was carried out using Kubios’ artifact correction option; a very low correction level was used as default.
In the time domain, R-R intervals, standard deviation of R-R intervals (SDNN), square root of the mean squared difference of successive R-R intervals (RMSSD), and the number of adjacent N-N differing by more than 50 milliseconds divided by the total number of N-N intervals (pNN50) were analyzed. We also assessed the HRV triangular index, which is the integral of the RR interval histogram divided by the height of the histogram. The RMSSD and pNN50 are associated with high-frequency power (HF) and hence parasympathetic activity. As usually done, RMSSD was natural log (ln) transformed for analysis [13].
Concerning the frequency domain analysis, the Fast Fourier transformation spectrum was used. In the spectral domain, we analyzed low-frequency power (LF: 0.04–0.15 Hz), an index of both sympathetic and parasympathetic activity, and high-frequency power (HF: 0.15–0.4 Hz), representing the vagal (parasympathetic) activity of the sinus node. Very low frequency (VLF; 0.003–0.04 Hz) partially reflects thermoregulatory mechanisms, fluctuation of the renin-angiotensin system activity, and the function of peripheral chemoreceptors. LF and HF were also assessed in normalized units (nu), which represent the relative value of each power component in proportion to the total power, minus the VLF component. Thus, LF and HF are considered to best represent sympathetic and parasympathetic activities, respectively. The LF/HF ratio, i.e. the sympatho-vagal balance, was also calculated [14].
For the nonlinear HRV analysis, we assessed the parameters of the Poincaré-plot indexes: SD1 (transverse axis), which is proportional to parasympathetic activity, SD2 (longitudinal axis), which is inversely proportional to sympathetic activity, and the SD1/SD2 ratio.
From the Poincaré-plot, we calculated the stress score (SS) [15] as SS
Because this study concerns elite athletes, we also chose to calculate the Elite HRV score, based upon the study of the elite HRV group (elitehrv.com). The average HRV score for Elite HRV users is 59.3 (on a 1–100 scale) with 75% of users’ HRV scores falling between 46.3 and 72.0.
Finally, we assessed the Approximate Entropy (ApEn) and Sample Entropy (SampEn), which measure the regularity and complexity of a time series.
During training: For each gymnast, we extracted the 4 routines from the tachogram and merged them in order to be analyzed in Kubios software as a whole period of training activity.
2.5Data processing
Statistical analysis was performed using SPSS software, v20. The tests were two-sided with a type I error set at
A multivariate analysis was performed in order to discriminate between and hierarchize the place of each HRV factor in explaining the competitive results. The sample size was calculated “a posteriori” taking into account the significant differences between LF/HF ratio and SD1/SD2 ratio. Using the calculation provided by Cohen [16], the number of participants was seven per group with type 1 errors of 5% and a statistical power of 80%.
3.Results
3.1Subjects’ description
As displayed in Table 1, the gymnast group was significantly less mature (Tanner stage 1 – pre pubertal – vs. median Tanner stage for controls – all reached menarche) with a trend to lower chronological age. The gymnasts had lower body weight and body height, resulting in lower BMI than the controls. s expected in such a population, fat mass, assessed through skinfold measurements, was lower in gymnasts than in the controls and the HRV score was significantly higher, compared with HRV elite score adult reference.
Table 1
Anthropometric, maturation and HRV characteristics of the individuals. HRV values are adjusted for age and maturity
| Controls | Gymnasts | Between group differences | ||||
| Characteristics | ||||||
| Age | 12.72 | 12.32 | 0.15 | |||
| Body weight | 51.19 | 37.20 | 0.001 | |||
| Body height | 162.13 | 150 | 0.001 | |||
| Maturity | 3.81 | 1.00 | 0.000 | |||
| BMI | 19.45 | 16.34 | 0.006 | |||
| Skinfold – sum | 49.25 | 19.10 | 0.001 | |||
| Sport experience (years) | 0.00 | 6.00 | | 0.001 | ||
| HRV score | 56.40 | 63.30 | 0.046 | |||
| Time domain | ||||||
| Heart rate | 96.02 | 84.24 | 0.047 | |||
| LnSDNN | 4.143 | 4.079 | NS | |||
| LnRMSSD | 3.668 | 4.116 | 0.045 | |||
| LnPNN50 | 2.477 | 3.185 | 0.055 | |||
| LnHRV triangular index | 2.844 | 2.697 | NS | |||
| LnTINN | 5.945 | 5.859 | NS | |||
| Frequency domain | ||||||
| Ln VLF peak |
| 0.001 | ||||
| LnLF peak | NS | |||||
| LnHF peak | 0.12 | |||||
| Ln LF power nu | 4.179 | 3.821 | 0.003 | |||
| LnHFpower nu | 3.429 | 3.935 | 0.001 | |||
| LnLF/HF | 2.47 | 1.00 | 0.002 | |||
| Non-linear parameters | ||||||
| LnSD1 | 3.321 | 3.770 | 0.052 | |||
| LnSD2 | 4.428 | 4.261 | NS | |||
| SD1/SD2 | 0.349 | 0.620 |
| 0.001 | ||
| Stress score | 12.6 | 15.2 | NS | |||
| SPSratio | 0.581 | 0.478 | NS | |||
| Ln apen | 0.227 | 0.355 | 0.033 | |||
| Ln sampen | 0.221 | 0.495 | 0.007 | |||
3.2HRV parameters
Table 1 presents the main parameters in terms of time domain, frequency domain and nonlinear analysis for both control and gymnasts groups measured at rest.
• Time domain data: Despite there being no difference between groups for SDNN, the gymnasts displayed lower heart rate and higher RMSSD suggesting a better parasympathetic activity (reinforced by the tendency to have higher PNN50,
• Frequency domain data: With lower LF power (nu) and higher HF power (nu) the gymnasts showed a higher parasympathetic activity than the controls, results emphasized by a significantly lower balance between sympathetic and parasympathetic systems (LF/HF) for the non-athlete group.
• Nonlinear domain data: The ratio of SD1/SD2, which measures the unpredictability of the RR time-series was significantly higher in gymnasts, indicating a faster spontaneous response of variability in this group, which was reinforced by the SD1 trend to be higher in gymnasts (
Sample and Approximate Entropy values were higher in gymnasts than in the controls, indicating a low predictability of fluctuations in successive RR intervals and therefore a better capability to react.
The stress score calculated for the two groups did not reveal any significant difference between the groups, probably indicating that the gymnasts had appropriate coping mechanisms in this training period.
3.3HRV values between rest and gymnastics routine training
According to Table 2, it was noticeable that, for the period of training, heart rate increased (twofold) and, most significantly, the stress score was multiplied by three.
Table 2
Changes in HRV values between rest and gymnastics routine training (Mean
| Rest | Gymnastics routine training | Between group differences | ||||
|---|---|---|---|---|---|---|
| Heart rate | 84.2 | 163.4 | | 0.001 | ||
| Ln SDNN | 4.079 | 3.166 | 0.003 | |||
| Ln RMSSD | 4.116 | 3.345 | 0.013 | |||
| Ln pNN50 | 3.185 | 1.474 | 0.004 | |||
| Ln HRV triangular index | 2.697 | 0.835 |
| 0.001 | ||
| Ln VLF peak | NS | |||||
| Ln LF peak | NS | |||||
| Ln HF peak | NS | |||||
| Ln LF power nu | 3.821 | 3.755 | NS | |||
| Ln HF power nu | 3.935 | 3.878 | NS | |||
| Ln Total Power | 8.059 | 5.296 |
| 0.001 | ||
| LF/HF | 1.005 | 0.016 | ||||
| Ln SD1 | 3.770 | 3.000 | 0.013 | |||
| Ln SD2 | 4.261 | 3.270 | 0.002 | |||
| SD1/SD2 | 0.620 | 0.788 | 0.071 | |||
| Stress score | 15.244 | 45.394 | 0.009 | |||
| Ln ApEn | 0.355 |
| 0.001 | |||
| Ln SampEn | 0.495 |
| 0.001 | |||
All the parameters reflecting the parasympathetic nervous activity were improved during the routines. The change in SDNN was not taken into account due to the very short period of measurement (bouts of one minute and thirty seconds for each routine).
Table 3
Codified competition results
| 2018 National Championships junior – after HRV testing | ||||||
| Gymnasts | Team competition | Individual event | Hoop | Ball | Ribbon | Clubs |
| 1 | 1 | 1 | 1 | 1 | 1 | 3 |
| 2 | 1 | 4 | 4 | 2 | 6 | 4 |
| 3 | 1 | 5 | 6 | 6 | 6 | 6 |
| 4 | 1 | 5 | 6 | 6 | 6 | 6 |
| 5 | 6 | 5 | 6 | 6 | 6 | 6 |
| 6 | 1 | 4 | 6 | 6 | 6 | 6 |
| 7 | 1 | 1 | 2 | 6 | 6 | 6 |
| 8 | 1 | 6 | 6 | 2 | 6 | 6 |
| 9 | 1 | 4 | 6 | 6 | 2 | 6 |
| 10 | 6 | 6 | 6 | 4 | 6 | 1 |
3.4Relationship between HRV parameters and results obtained in competition
Table 3 presents the codified results of the investigated gymnasts in the target competition.
Table 4 displays the Spearman correlations between HRV data and the codified results in competition, at rest and during exercise.
Table 4
Correlation between the results obtained in national competitions and HRV values assessed at rest and during gymnastics routine training, one week before the competition
| At rest | During gymnastics | |||||
| routine training | ||||||
| Spearman | Spearman | |||||
| correlation | correlation | |||||
| Heart rate | 0.617 | 0.058 | 0.381 | 0.277 | ||
| LnSDNN |
| 0.718 | 0.019 | 0.210 | 0.561 | |
| LnRMSSD |
| 0.585 | 0.076 | 0.197 | 0.585 | |
| LnpNN50 |
| 0.661 | 0.037 | 0.254 | 0.478 | |
| LnHRV triangular |
| 0.750 | 0.012 | 0.375 | 0.286 | |
| index | ||||||
| Ln_tinn | | 0.814 | 0.004 |
| 0.112 | 0.759 |
| LnLFnu | 0.222 | 0.537 |
| 0.153 | 0.674 | |
| LnHF nu |
| 0.222 | 0.537 | 0.153 | 0.674 | |
| Ln total power |
| 0.610 | 0.061 |
| 0.051 | 0.889 |
| LF/HF | 0.222 | 0.537 |
| 0.153 | 0.674 | |
| LnSD1 |
| 0.585 | 0.076 | 0.197 | 0.585 | |
| LnSD2 |
| 0.686 | 0.028 | 0.133 | 0.713 | |
| SD1/SD2 |
| 0.509 | 0.133 |
| 0.248 | 0.490 |
| Stress score | 0.686 | 0.028 |
| 0.133 | 0.713 | |
| SPSratio | 0.750 | 0.012 |
| 0.242 | 0.501 | |
| Ln apen | 0.191 | 0.598 | | 0.044 | 0.903 | |
| Ln sampen |
| 0.044 | 0.903 | 0.013 | 0.972 | |
One can point out the remarkable negative correlations between the competitive results and SDNN, pNN50, HRV triangular index, TINN, total power SD2, at rest. We also noticed a tendency for negative correlations between the competition results and RMSSD, total power and SD1. Statistically, there have been identified strong positive correlations between sport results and stress score. SPS ratio also positively correlated with the competitive results.
There were no significant correlations between the HRV parameters measured during the training routines.
3.5Multivariate analysis
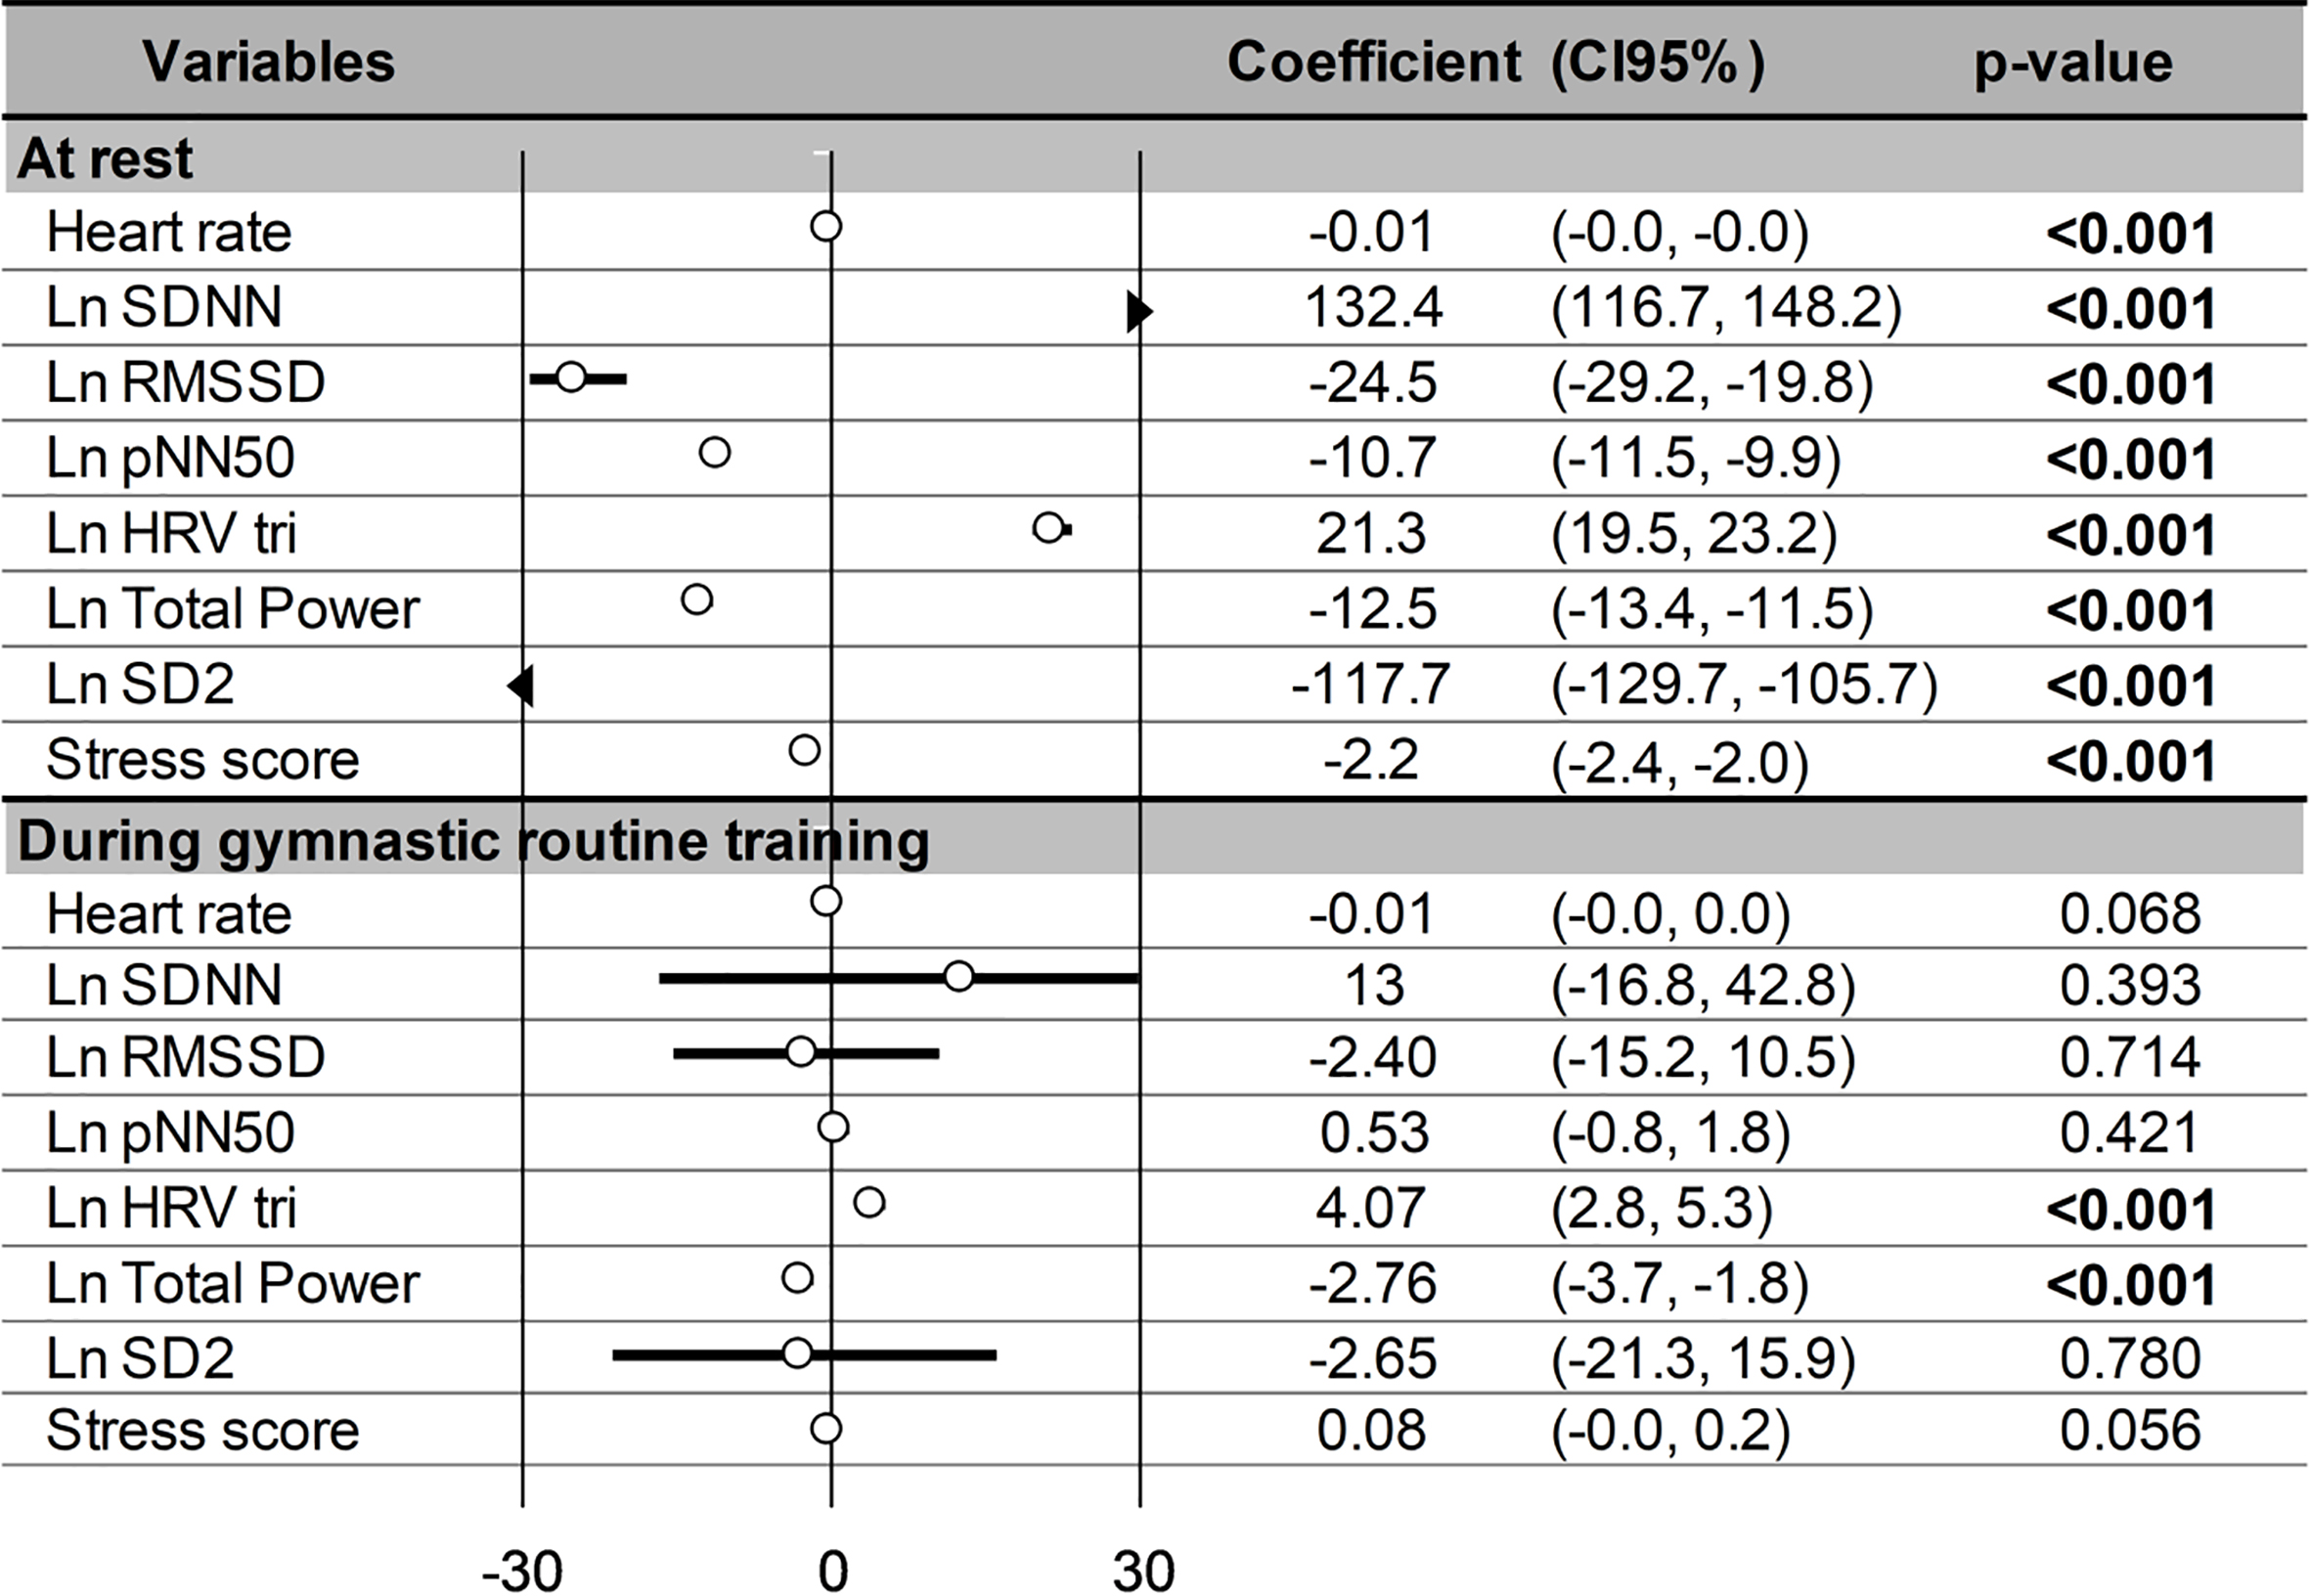
Similarly, multivariate analysis confirmed the impact of the HRV factors measured at rest, whereas no significant influence was retrieved during training. The magnitude of the factors in predicting the performances highlighted the importance of SD2, RMSSD, pNN50 and Total power, hierarchically. More precisely, an increase of SD2, RMSSD, pNN50 and Total power at rest predicted a better ranking place in competition. Conversely, an increase in HRV triangular index predicted a bad ranking place in competition (Fig. 2).
Figure 2.
Predictive factors for results in competition. Empty circles indicate the magnitude (coefficient) of the factor on the results in competition, and vertical lines correspond to 95% confidence intervals.
4.Discussion
4.1Comparison to controls
In our study, from the anthropometrical point of view, even if both control and gymnast groups fitted into normal healthy weights and heights, the lower fat mass in gymnasts is one of the standard requirements for successfully performing in this sport [17]. The significant weight differences between groups is a clear indicator of both selection requirements in rhythmic gymnastics and specific training contents with emphasis on extremely low body fat and low muscle mass.
Although at puberty, no gymnasts experienced menarche whereas controls did, in accordance with data commonly reported in similar populations [18, 19]. This supports the idea that intensive training at early ages is commonly associated with delayed menarche, although other genetic or environmental factors may influence this development event.
At rest, the HRV values expressed a greater activity of the parasympathetic system in gymnasts than in controls [20]. Considering the fitness status of our high level athletes [21], the Elite HRV score was higher when compared to controls. This was a predictable result, given the training major adaptations in gymnasts associated with an enhanced effort capacity and stress coping.
The HRV score of the gymnasts emphasized an absence of overtraining, and also indicated an optimal health status [22]. Our data also confirmed the optimal executive functions of the gymnasts resulting in a good level of attention and control of emotions [23].
4.2HRV may predict results in competition
This study was designed to be a complementary approach in predicting gymnasts’ results in official competitions, as well as to determine training and stress levels during the precompetitive period, depending on the HRV parameters’ values.
The main findings of the present study were that measuring of HRV during ten minutes at rest may be considered a predictor of the results in competition. Moreover, this study points out that HRV at rest is discriminative when compared to measurements taken during training. Finally, although nonlinear parameters are still under debate and thus not frequently applied, the relevant informative factors in our study were able to predict future competition results. Of course, future studies are needed in adding more information and clarifications in this research area.
Recent references acknowledge the role of HRV not only as a marker used in clinical studies, but also as a tool applicable in physical exercise training [2, 3]. Several arguments can support these assumptions regarding the training level cues: recovery status, lack of overtraining, and capability to adapt to physical and mental stress. Potential prediction of the performance in competition [24], as well as the susceptibility to illness or sports injury, were also mentioned in different studies [25]. Data of our study demonstrated that the HRV approach confirmed the appropriateness of the training loads administered to the gymnasts in the precompetitive period as a prerequisite of the competition results. From a practical point of view, the gymnasts’ coach took into consideration the HRV values of the investigated gymnasts as a tool for choosing the final team members according to their autonomic nervous system status. The high results in the official competition of the gymnasts (gold medals in team competition and individual event) matched the enhanced values of the HRV score at rest, acknowledging that sports performance can be to a certain extent predicted by HRV.
4.3Only the values at rest were discriminative
It is noticeable that only the rest values of HRV correlated with the performances obtained by the gymnasts in National Championships. The decrease in HRV during training showed a sign of sympathetic activation in handling the corporal technical elements and mastering apparatus skills [26]. Those HRV changes confirm that the complex and non-linear oscillations of a healthy heart provide the flexibility to adjust to different uncertainties or changing factors occurring within the environment [27], including the sports settings. Values of HRV triangular index
4.4Non-linear parameters and HRV scores
Despite a few studies reporting non-linear HRV data, SD2 at rest and HRV triangular index as predictive factors for results in competition, our study revealed that HRV triangular index and total power were the only parameters able to predict competition results through training values. As revealed in literature, SD1 and SD2 demonstrated a positive relationship with the intensity of training [28], while in this study we reported the efficiency of Poincaré plot parameters in predicting results in competition. Contrary to data suggesting an increase of dispersion in Poincaré plot parameters during exercise [29], we identified a decrease of SD1 and SD2 during the training routine. SD1 is an index of instantaneous recording of HRV, and SD2 represents the long term variability in HVR [30]. The decrease in SD1 and SD2 during training may signify a good adaptation of our athletes to the specific training. A low Approximate Entropy indicates a good predictability in response to environmental stimuli [27], in agreement with our findings. Even if Sample Entropy is primarily designed to provide better information than Approximate Entropy, both Sample and Approximate Entropies in our study demonstrated a good adaptation of the gymnasts to the routines (
4.5Limitations of the study
The main limitation of our research was the number of participants, precluding generalizability. However, results were highly significant and met the sample size statistically required. Our study embedded a snapshot-type of HRV assessment so we only took into consideration the HRV values, without introducing the progression of the training load, training content and lifestyle factor changes occurring throughout a longer period prior to National Championships. Also, reiterating HRV measurements in different training periods would increase the data confidence.
5.Conclusions
In summary, we suggest that measuring HRV during ten minutes at rest may be a complementary tool in predicting results in competition in junior rhythmic gymnasts.
Moreover, the measurements performed during the training were not relevant in predicting the performance.
The method used in this study justified the interest shown in analyzing the nonlinear parameters in addition to the usual time and frequency HRV domains.
Acknowledgments
We express our sincere thanks to the gymnasts and controls who participated in this study. This study was funded by the University of Clermont Auvergne, France. All relevant data are within the paper.
Conflict of interest
The authors have no conflicts of interest relevant to this article.
References
[1] | Leandro C, Avila-Carvalho L, Sierra-Palmeiro E, Bobo-Arce M. Technical content of elite rhythmic gymnastics. Science of Gymnastics Journal. (2016) ; 8: (1): 85-96. |
[2] | Sala R, Malacarne M, Tosi F, Benzi M, Solaro N, Tamorri S, et al. May a unitary autonomic index help assess autonomic cardiac regulation in elite athletes? Preliminary observations on the national Italian Olympic committee team. J Sports Med Phys Fitness. (2017) ; 57: (12): 1702-10. |
[3] | Sartor F, Capuzzoni S, Rospo G, La Torre A, Vailati F, Vailati E. Influence of competition day on cognitive control and HRV in young male gymnasts. J Strength Cond Res. (2017) ; 31: (7): 1982-93. |
[4] | Hufnagel C, Chambres P, Bertrand PR, Dutheil F. The need for objective measures of stress in autism. Frontiers in Psychology. (2017) ; 8: (4). |
[5] | Goldsmith RL, Bloomfield DM, Rosenwinkel ET. Exercise and autonomic function. Coron Artery Dis. (2000) ; 11: (2): 129-35. |
[6] | Oliveira RS, Barker AR, Williams CA. Cardiac autonomic function, cardiovascular risk and physical activity in adolescents. Int J Sports Med. (2018) ; 39: (2): 89-96. |
[7] | Buchheit M. Monitoring training status with HR measures: Do all roads lead to Rome? Frontiers in Physiology. (2014) ; 5: (73). |
[8] | Moohialdin ASM, Bambang TS, Siddiqui MK. Practical validation measurements of a physiological status monitoring sensor in real construction activities. Streamlining Information Transfer between Construction and Structural Engineering Edited by Shiau, J, Vimonsatit, V, Yazdani, S, and Singh, A. (2018) . |
[9] | Sartor F, Vailati E, Valsecchi V, Vailati F, Torre A. Heart rate variability reflects training load and psychophysiological status in young elite gymnasts. J Strength Cond Res. (2013) ; 27: (10): 2782-90. |
[10] | Botek M, McKune AJ, Krejci J, Stejskal P, Gaba A. Change in performance in response to training load adjustment based on autonomic activity. International Journal of Sports Medicine. (2014) ; 35: (6): 482-8. |
[11] | Proietti R, Di Fronso S, Pereira LA, Bortoli L, Robazza L, Nakamura FY, et al. Heart rate variability discriminates competitive levels in professional soccer players. Journal of Strength and Conditioning Research. (2017) ; 31: (6): 1719-25. |
[12] | Electrophysiology TFotESoCatNASoPa. Heart rate variability: standards of measurement, physiological interpretation and clinical use. Task Force of the European Society of Cardiology and the North American Society of Pacing and Electrophysiology. Circulation. (1996) ; 93: (5): 1043-65. |
[13] | Liao CD, Tsauo JY, Hsiao DJ, Liou TH, Huang SW, Lin LF. Association of physical capacity with heart rate variability based on a short-duration measurement of resting pulse rate in older adults with obesity. PLoS One. (2017) ; 12: (12): e0189150. |
[14] | Boudet G, Walther G, Courteix D, Obert P, Lesourd B, Pereira B, et al. Paradoxical dissociation between heart rate and heart rate variability following different modalities of exercise in individuals with metabolic syndrome: The RESOLVE study. Eur J Prev Cardiol. (2017) ; 24: (3): 281-96. |
[15] | Naranjo Orellana J, de la Cruz Torres B, Sarabia Cachadina E, de Hoyo M, Dominguez Cobo S. Two new indexes for the assessment of autonomic balance in elite soccer players. Int J Sports Physiol Perform. (2015) ; 10: (4): 452-7. |
[16] | Cohen J. Statistical Power Analysis for the Behavioral Sciences 1988. |
[17] | Galetta F, Franzoni F, D’alessandro C, Piazza M, Tocchini L, Fallahi P, et al. Body composition and cardiac dimensions in elite rhythmic gymnasts. J Sports Med Phys Fitness. (2015) ; 55: (9): 7. |
[18] | Georgopoulos NA, Markou KB, Theodoropoulou A, Benardot D, Leglise M, Vagenakis AG. Growth retardation in artistic compared to rhythmic elite female gymnasts. J Clin Endocrinol Metab. (2002) ; 87: : 5. |
[19] | Theodoropoulou A, Markou K, Vagenakis GA, Benardot D, Leglise M, Kourounis G, et al. Delayed but normally progressed puberty is more pronounced in artistic compared with rhythmic elite gymnasts due to the intensity of training. J Clin Endocrinol Metab. (2005) ; 90: : 6. |
[20] | Dong J. The role of heart rate variability in sports physiology. Exp Ther Med. (2016) ; 11: (5): 6. |
[21] | Aubert AE, Seps B, Beckers F. Heart rate variability in athletes. Sports Med. (2003) ; 33: (12): 889-919. |
[22] | Coates AM, Hammond S, Burr JF. Investigating the use of pre-training measures of autonomic regulation for assessing functional overreaching in endurance athletes. Eur J Sport Sci. (2018) ; 18: (7): 965-74. |
[23] | McCraty R, Shaffer F. Heart rate variability: new perspectives on physiological mechanisms, assessment of self-regulatory capacity, and health risk. Glob Adv Health Med. (2015) ; 4: : 16. |
[24] | Flatt AA, Esco MR. Heart rate variability stabilization in athletes: Towards more convenient data acquisition. Clin Physiol Funct Imaging. (2016) ; 36: (5): 331-6. |
[25] | Gisselman AS, Baxter GD, Wright A, Hegedus E, Tumilty S. Musculoskeletal overuse injuries and heart rate variability: Is there a link? Med Hypotheses. (2016) ; 87: : 7. |
[26] | Plews DJ, Laursen PB, Kilding AE, Buchheit M. Heart-rate variability and training-intensity distribution in elite rowers. Int J Sports Physiol Perform. (2014) ; 9: (6): 1026-32. |
[27] | Shaffer F, Ginsberg JP. An overview of heart rate variability metrics and norms. Front Public Health. (2017) ; 5: : 258. |
[28] | de Sousa TLW, Ostoli T, Sperandio EF, Arantes RL, Gagliardi ART, Romiti M, et al. Dose-response relationship between very vigorous physical activity and cardiovascular health assessed by heart rate variability in adults: Cross-sectional results from the EPIMOV study. PLoS One. (2019) ; 14: (1): e0210216. |
[29] | de Rezende Barbosa MPC, Junior JN, Cassemiro BM, Bernardo AFB, Franca da Silva AK, Vanderlei FM, et al. Effects of functional training on geometric indices of heart rate variability. J Sport Health Sci. (2016) ; 5: (2): 183-9. |
[30] | Vanderlei LC, Pastre CM, Hoshi RA, Carvalho TD, Godoy MF. Basic notions of heart rate variability and its clinical applicability. Rev Bras Cir Cardiovasc. (2009) ; 24: (2): 205-17. |


