
The effect of high-impulse- electromyostimulation on adipokine profiles, body composition and strength: A pilot study
Abstract
BACKGROUND
: Although whole body electromyostimulation (WB-EMS) has been shown to improve body composition and muscle strength in several research studies, it has not been confirmed whether a dose-response effect using various impulse-intensities exists and how they affect adipose tissue-derived adipokines (APK), body composition, and strength.
OBJECTIVE:
To investigate the dose-response effect of wearing a WB-EMS suit in conjunction with isometric exercise on adipokines (APK), body composition including thigh circumference, and thigh muscle strength in normal healthy men for 6 weeks.
METHOD:
Fifty-two male subjects were randomly assigned to one of four groups: control group (CON,
RESULTS:
Compared with the CON group, 1) there was a significant group by time interaction difference in Resistin (
CONCLUSIONS:
WB-EMS administered at high impulse intensity can improve Resistin, body composition including thigh circumference, and isokinetic strength in healthy men after approximately 4 to 6 weeks.
1.Introduction
In the 1960s, electromyostimulation (EMS) was often used to prevent the atrophy of skeletal muscles or to rehabilitate muscles after injury or surgery. Since the 1980s, researchers have developed units with an improved ability to modulate a variety of electrical wave forms resulting in an electrical current that can be effectively used to stimulate innervated muscles [1]. EMS is very gentle on the joints and reduces the risk of injury due to the absence of weights or excessive loading [2]. During EMS, impulses are transmitted through electrodes on the skin close to the dermis tissue for stimulation [3]. The major difference between the mechanisms of involuntary and voluntary contractions induced by EMS is in muscle fiber mobilization. In the case of spontaneous muscle contraction, a small motor unit with low threshold is first activated. In the case of muscle contraction due to EMS, the motor units under the control of the larger nerves are activated and muscle fibers with high threshold are easily mobilized resulting in positive effects on muscle strength [4, 5]. Moreover, although voluntary contraction may result in selective motor unit mobilization from slow to fast muscle fibers, non-selective contraction occurs when both fibers are mobilized simultaneously during involuntary contraction through EMS.
Recent whole body WB-EMS suits have advanced functions and capabilities, unlike older systems that had many limitations and inconveniences. For example, the cumbersome process of spraying water or wearing wet clothes to allow electrical currents to pass through the body has been replaced by inserting a silicone conductive pad into the garment. In addition, wires connecting the electrodes to the WB-EMS device have been replaced with wireless sensors via Bluetooth technology to enable a wider range of activity that can be adjusted within 40 meters [6]. This advanced WB-EMS system allows for more comfort, ease of use, and potentially faster results in rehabilitating patients with musculoskeletal diseases as well as improving body composition and muscle strength as shown in previous studies [2, 7, 8, 9]. In fact, WB-EMS is time-efficient and less debilitating, thus producing higher acceptance among non-athletes [7]. Gondin et al. provided an overview of the main training studies in which neuromuscular electrical stimulation was applied to healthy subjects, including competitive athletes with the objective of improving muscle function [10]. Other researchers also suggested that electrical stimulation can promote maximal strength gains in human subjects [11, 12, 13].
Table 1
Physical characteristics of participants at baseline
| Items | Groups | One way ANOVA | ||||
|---|---|---|---|---|---|---|
| CON ( | LII ( | MII ( | HII ( |
|
| |
| Age (y) | 28.33 | 24.00 | 23.25 | 25.00 | 3.415 | 0.061 |
| Height (cm) | 171.67 | 176.67 | 174.00 | 178.50 | 3.086 | 0.077 |
| Weight (kg) | 71.37 | 75.27 | 76.13 | 80.78 | 0.666 | 0.592 |
| WHR | 0.86 | 0.86 | 0.86 | 0.87 | 0.283 | 0.836 |
| Percent fat (%) | 18.87 | 19.07 | 17.88 | 20.38 | 0.234 | 0.871 |
| Muscle mass (kg) | 32.93 | 34.67 | 35.68 | 36.65 | 0.432 | 0.735 |
| Fat mass (kg) | 13.60 | 14.47 | 13.65 | 16.30 | 0.378 | 0.771 |
| BMI (kg/m | 22.27 | 22.10 | 21.68 | 22.30 | 0.110 | 0.952 |
| BMR (kcal) | 1617.33 | 1683.00 | 1719.25 | 1762.50 | 0.511 | 0.684 |
All values are expressed as mean
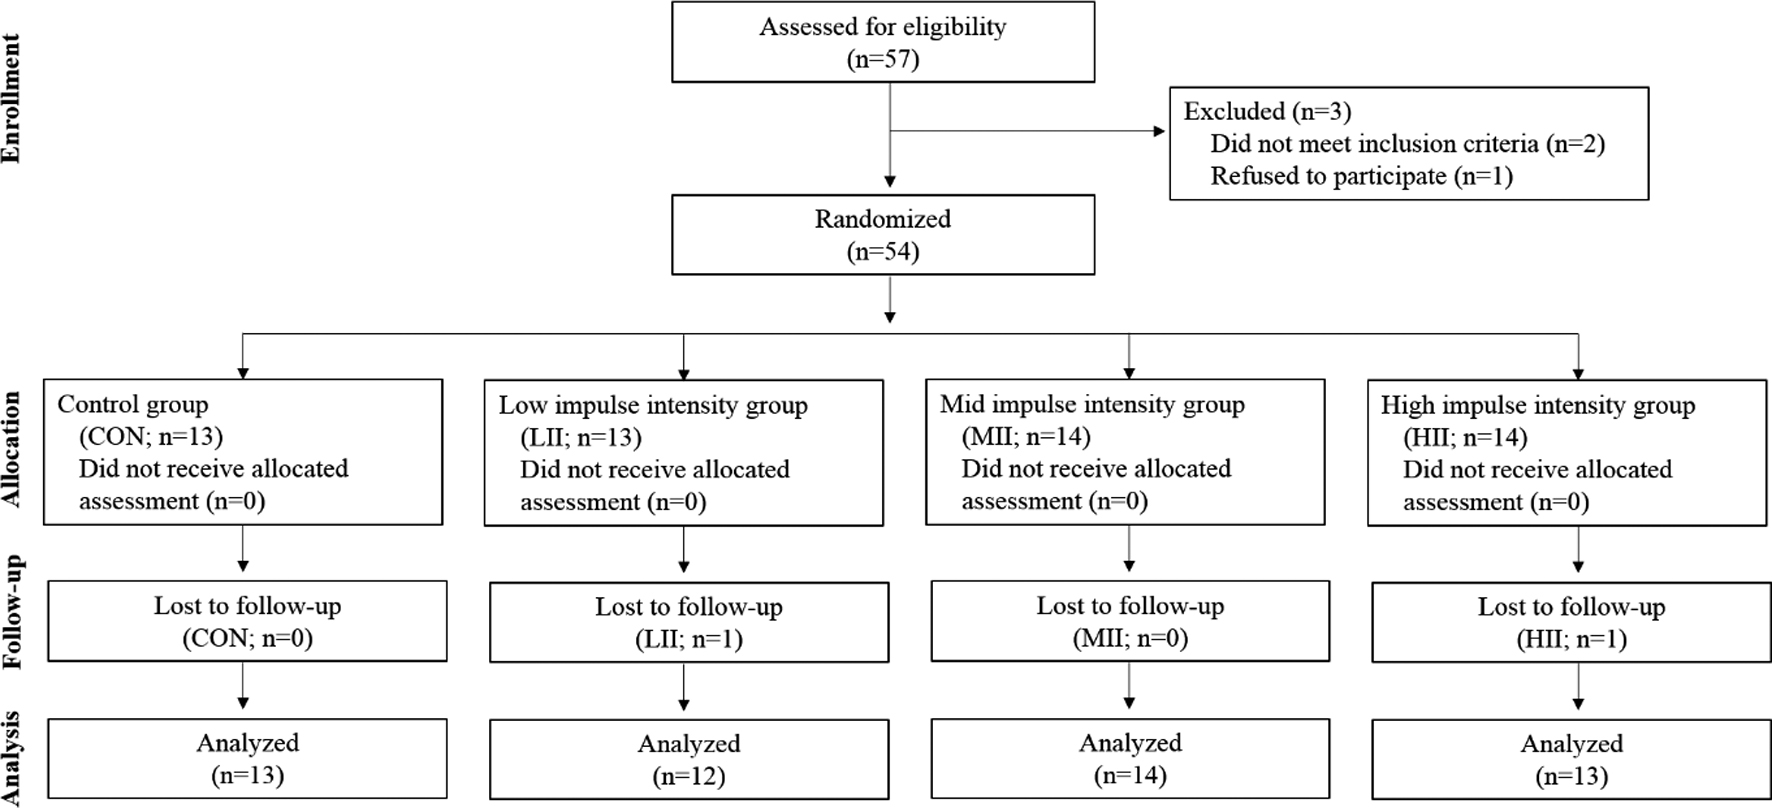
Figure 1.
Flow diagram participants (assessed for eligibility;
However, even though there is some evidence that WB-EMS suit favorably improves body composition and increases muscle mass and strength, few studies clearly address these issues or investigate the practicality of using WB-EMS. In particular, no studies have investigated if a dose-response effect exists between different impulse intensities and how WB-EMS affects body composition and adipose tissue-derived factors in men with normal levels of fat. Since the effects of EMS have already been shown to be effective on subjects with obesity, this study investigated the effectiveness of WB-EMS suit on subjects with normal levels of fat. The reason for selecting these participants reflected not only the dearth of studies on WB-EMS on but to also find what kind of benefits people with various body compositions can gain, in particular, those with normal levels of fat. Additionally, by applying WB-EMS on normal subjects, it may be possible to gain a better understanding of how electrical impulses react to various body compositions. In other words, analyzing subjects with normal levels of fat would provide more insight into whether EMS is more or less effective due to the electrical impulses stimulating the outer fat layer, skeletal muscle, or blood content. Therefore, this study was performed to investigate the dose-response effect of wearing a WB-EMS suit in conjunction with isometric exercise on adipokines (APK), body composition including thigh circumference, and thigh muscle strength in normal healthy men for 6 weeks.
2.Methods
2.1Participants
This study was performed from July 7 to August 18, 2017. Healthy collegiate men aged between 20 and 29 years old were recruited on a voluntary basis. They were motivated by the wish to improve their body shape and were examined by a specialist using the bioelectrical impedance analysis (BIA) method. The subjects who took part in this study did not exercise regularly for a duration of 6 months. Additionally, the subjects did not take any treatment for weight loss or any medication known to affect body composition and had not undergone any major surgery during the one year prior to the start of the study. Exclusion criteria included subjects who were overweight or obese according to waist/hip ratio (WHR,
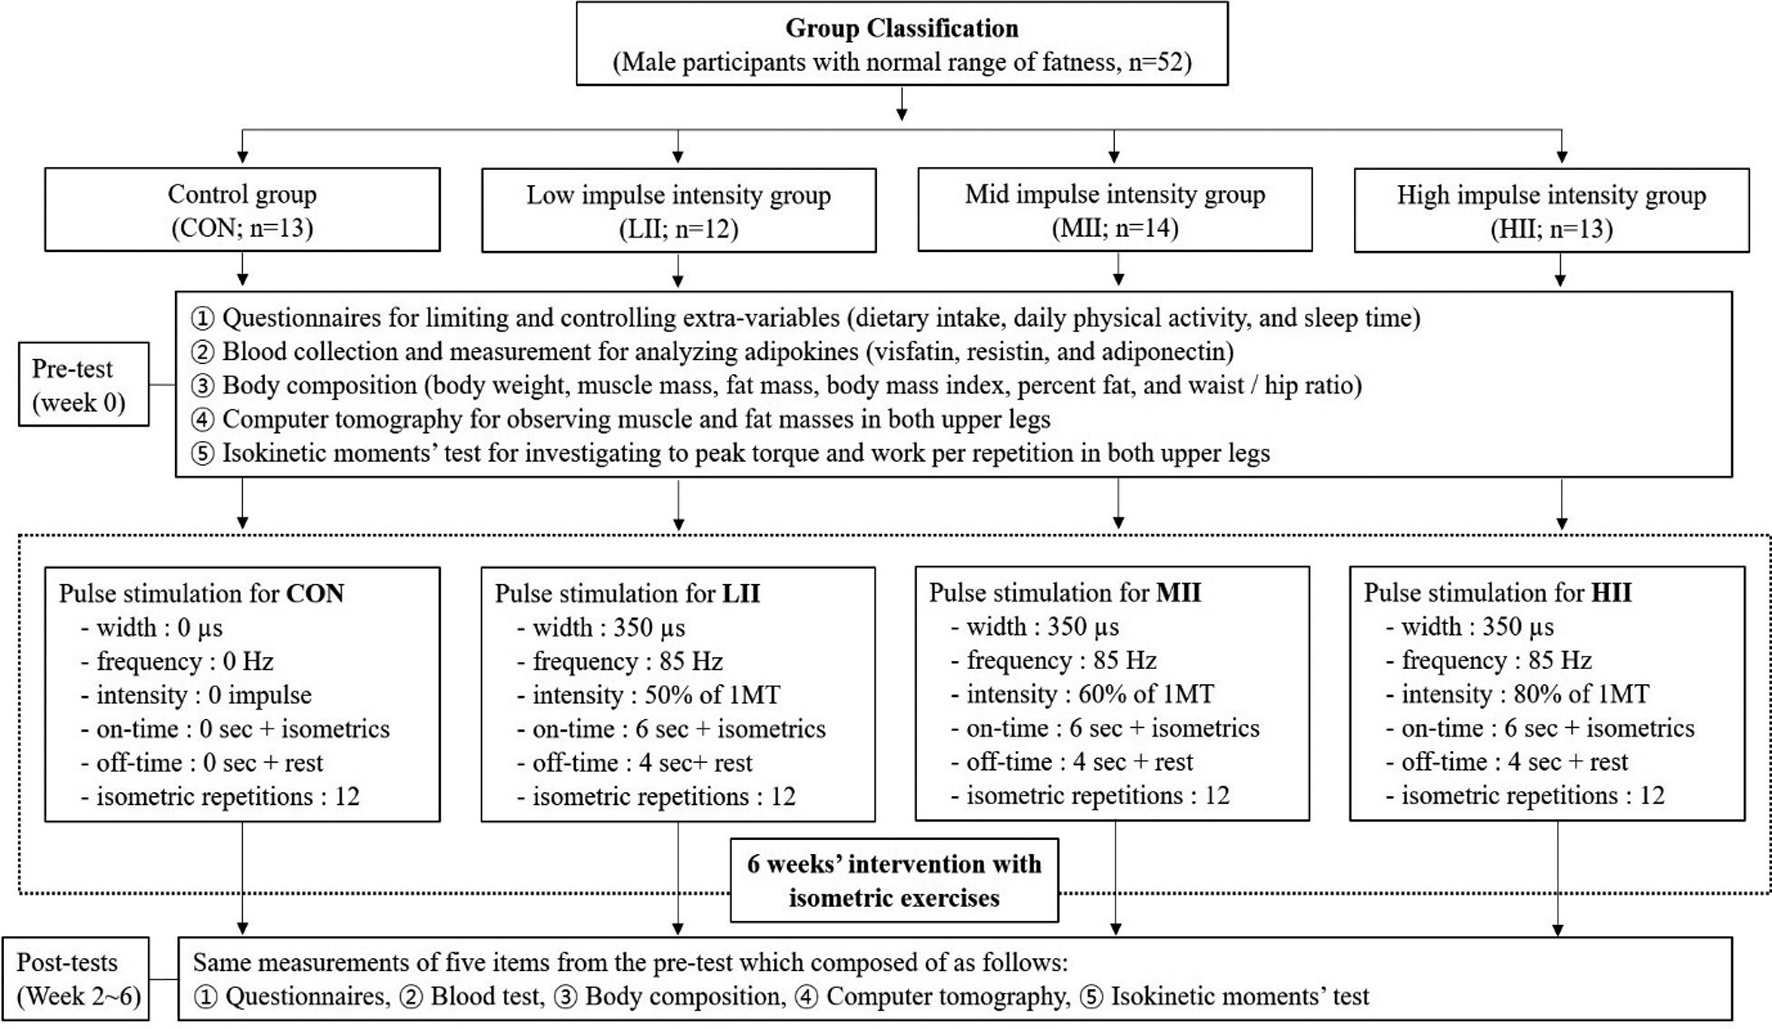
Figure 2.
Experimental design for group classification, test periods, measurement variables, and intervention methods.
As shown in Fig. 1, of the 57 participants who completed the survey, three subjects were disqualified. Two of them took part in an exercise program for over 6 months and another refused to participate. In the follow-up phase, there were also two subjects who dropped out due to personal reasons. Finally, 52 male subjects took part in this study. After taking baseline measurements, the participants were randomly assigned to one of four groups: control group (CON,
All participants wore the WB-EMS suits that fit their individual size. Although all groups underwent 20-minute WB-EMS sessions combined with isometric exercises 3 times a week for 6 weeks, the participants of CON group did not receive any electrical stimuli. The three experimental groups received one of three types of electrical stimuli at different intensities according to maximum tolerance (1MT).
2.2Experimental design
Prior to the study, the principal investigator explained all the procedures to the subjects in detail. All participants read and signed an informed consent form approved by the Hanseo University College of Health Science Human Studies Committee and was completed in accordance with the guidelines of the Korean Academy of Medical Sciences. The study was approved by the Institutional Review Board at Sahmyook University (2-1040781-AB-N-01-2017083HR). All participants arrived at the research center to complete a self-reported questionnaire about their health status, calorie intake, and physical activity level, which was included in the physical examination. The first assessment was conducted in Seoul Song-Do Hospital from July 7 to 8, 2017, and the second and third assessments were conducted in the same hospital from July 21 to 22 and from August 4 to 5, respectively. The program lasted for 6 weeks, similar to the duration of previous studies [2, 10, 41, 42, 43, 44]. However, the assessments were performed every 2 weeks for 6 weeks. The experimental design for group classification, test periods, measurement variables, and intervention methods are presented in Fig. 2.
Table 2
Definition and degrees of category scores by international physical activity questionnaire
| Category | Criteria | |
|---|---|---|
| # | Degree | |
| 1 | Low activity | No activity is reported OR Some activity is reported but not enough to meet categories 2 or 3. |
| 2 | Moderate activity | Either of the following 3 criteria 3 or more days of vigorous activity of at least 20 minutes per day OR 5 or more days of moderate-intensity activity and/or walking of at least 30 minutes per day OR 5 or more days of any combination of walking, moderate-intensity or vigorous-intensity. |
| 3 | High activity | Any one of the following 2 criteria vigorous-intensity activity on at least 3 days and accumulating at least 1,500 MET-minutes/week OR 7 or more days of any combination of walking, moderate-or vigorous-intensity activities accumulating at least 3,000 MET-minutes/week. |
Equations for calculating physical activity degree as follows; Walking MET-min/week
2.3Outcome measures
2.3.1Measurement of calorie intake, calorie output, and physical activity
This study investigated the calorie intake, calorie output, and physical activity in order to control and minimize the extrinsic variables that may affect the results of the experiment. At the pre-experiment session, the participants were provided a diary to record what they consumed for breakfast, lunch, and dinner throughout the 6-week experimental period. During this time, an expert calculated their daily caloric intake volume using CAN-Pro 5.0 (Korean Nutrition Society, Korea) every days for 6 weeks. The daily amount of physical activity that was performed outside the experiment was recorded and calculated using the shortened Korean version of the self-reported international physical activity questionnaire (IPAQ) as shown in Table 2. In order to increase the accuracy of the responses, an expert provided a diary to record the contents of the questionnaire on a daily basis. The participants answered the questionnaires based on the recordings of physical activity for the past 7 days for 6 weeks. The total score was obtained through the summation of the duration (in minutes) and frequency (days) of walking, moderate-intensity activity, and vigorous-intensity activity. Then, the data were used to calculate the amount of physical activity based on the IPAQ score conversion method using the metabolic equivalent (MET)-minutes score. Finally, the calorie intake, calorie output, and physical activity were recorded from Week 1 to Week 6.
2.3.2Isometric exercise with WB-EMS suit
Participants were given variously sized WB-EMS suits made by Miracle
Based on recommendations from available literature, the stimulation frequency was selected at 85 Hz, the impulse-width at 350 microseconds, the impulse-rise as a rectangular application, and variable electrostimulation intensities relative to the maximum peak voltage (160 V). Impulse duration was 6 s with a 4-s break between impulses [2, 8, 41, 43, 44]. For each group, a qualified instructor conducted 20-minute WB-EMS sessions 3 times a week on two non-consecutive days to allow for a rest interval of 48 hours between each session. In order to generate effective muscular contractions, isometric movements composed of crunches, bridges, leg raises, side planks on right and left sides, superman back raises, front planks, lunges on right and left sides, and squats were performed for 12 repetitions during the impulse phase as per the instructor’s directions.
This study used 1MT as the maximum peak voltage, similar to calculating the maximal voluntary contraction (MVC) as one maximal repetition. Recently, Gondin et al. reported that the maximal toleration, expressed in this study as the corresponding incomplete muscle activation, is the inability to produce an electrically-evoked force equal to 100% of MVC [5]. 1MT was determined by progressively administering electrical intensity until the subjects expressed their maximum tolerance [6, 49]. Several researchers have described exercise intensity based on the concept of MVC in the recommendation for resistance exercise in which under 50% of MVC is considered light intensity, 60% as moderate intensity, and over 80% as vigorous intensity [50, 51]. In this experiment, 1MT was measured as follows. Each participant in the WB-EMS group stood still while wearing WB-EMS suits. Starting from 10% of 1MT, the intensity was gradually increased according to the response of the participant and the electric stimulation was stopped at the request of the participant when reaching an unbearable level, at which point the intensity was set as 1MT. The participants were assigned to 0% of 1MT in CON group, 50% (81.15
2.3.3Measurement of APK
Blood samples were taken after fasting for 10 hours before assessment. Five ml of blood was collected from the antecubital vein of the subjects with a disposable syringe by a medical laboratory technologist on Week 0 (before the experiment), Week 2, Week 4, and Week 6. 2 ml from the 5 ml of venous blood was added to an anticoagulant tube (EDTA bottle), shaken, and centrifuged at 3,000 rpm for 5 minutes. The remaining 3 ml was left at room temperature for 1 hour and centrifuged at 1,000 rpm for 15 minutes. Isolated plasma and serum were kept frozen until the test.
APK was measured using Spectra-Max190 (molecular device). The color development stop solution for each APK was added and the absorbance was recorded, respectively. These were quantitative tests using the principle of sandwich enzyme immunoassay. Three analysis methods were used as follows. First, a sample of the standard solution for visfatine was added to a microplate coated with a specific Nampt monoclonal antibody and bound to Nampt (#AG-45A-0006YEK-KI01; Adipogen/Switzerland) to form an immobilized antibody. Subsequently, unbound material was removed by washing and a biotinylated polyclonal antibody specific for Nampt was added to each well. Second, the standard solution and sample for Resistin was added to a microplate coated with a specific Resistin monoclonal antibody and bound to Resistin (#AG-45A-0023YEK-KI01; Adipogen/Switzerland) to form immobilized antibodies. Afterwards, unbound material was removed by washing and biotinylated polyclonal antibody specific for Resistin was added to each well. Third, the standard solution and sample for adiponectin was added to a microplate coated with a specific monoclonal antibody, which was immobilized by binding with adiponectin (#AG-45A-0001YEK-KI01; Adipogen/Switzerland). Afterwards, unbound material was removed by washing and adiponectin specific biotinylated polyclonal antibody was added to each well. Unbound antibody-enzymes for visfatin, Resistin, and adiponectin were removed by washing and HRPs were added to each well, respectively. Nampt, Resistin, and adiponectin binding substances were developed after the washing process and addition of TMB.
Table 3
Differences of controlled variables among four groups
| Items | Week | Groups | One way ANOVA | ||||
|---|---|---|---|---|---|---|---|
| CON | LII | MII | HII |
|
| ||
| Calorie | 1 | 8883.00 | 10946.00 | 11371.25 | 9629.00 | 0.795 | 0.524 |
| intake | 2 | 10008.67 | 10673.67 | 10648.50 | 10939.75 | 0.089 | 0.964 |
| (kcal) | 3 | 9278.33 | 12028.00 | 10443.50 | 11096.50 | 0.620 | 0.618 |
| 4 | 9694.67 | 9504.00 | 9689.25 | 11453.50 | 0.327 | 0.806 | |
| 5 | 9910.00 | 9976.00 | 10148.25 | 11010.50 | 0.235 | 0.870 | |
| 6 | 9709.33 | 9140.33 | 10953.00 | 9806.75 | 0.664 | 0.593 | |
| Calorie | 1 | 2310.00 | 715.00 | 2570.25 | 3257.63 | 0.947 | 0.454 |
| output | 2 | 2310.00 | 616.00 | 2438.25 | 3247.50 | 1.565 | 0.259 |
| (kcal) | 3 | 3830.00 | 726.00 | 2105.25 | 2787.00 | 1.363 | 0.310 |
| 4 | 2808.00 | 1741.50 | 1617.00 | 2924.25 | 0.505 | 0.687 | |
| 5 | 1928.00 | 1334.00 | 2804.25 | 2384.25 | 0.185 | 0.904 | |
| 6 | 1928.00 | 1334.00 | 1122.75 | 1504.50 | 0.151 | 0.927 | |
| PAC | 1 | 2.00 | 1.67 | 2.50 | 2.50 | 2.113 | 0.162 |
| scores | 2 | 2.00 | 1.67 | 2.25 | 2.50 | 1.790 | 0.213 |
| 3 | 2.33 | 1.67 | 2.25 | 2.00 | 0.690 | 0.579 | |
| 4 | 2.33 | 2.00 | 2.00 | 2.25 | 0.183 | 0.905 | |
| 5 | 2.00 | 2.00 | 2.00 | 2.25 | 0.088 | 0.965 | |
| 6 | 2.00 | 2.00 | 1.75 | 1.75 | 0.130 | 0.940 | |
All values are expressed as mean
2.3.4Measurement of body composition
Body weight, muscle mass, fat mass, BMI, percent fat, and WHR were measured using the BIA method using InBody 230 Body Composition Analyzer (BioSpace, Seoul, Korea) and height was measured using BMS 330 Anthropometer (BioSpace, Seoul, Korea). The body composition analyzer is a segmental impedance device in which the electrodes are made of stainless steel interfaces. The subjects stood upright by placing their bare feet on the foot electrodes and gripping the hand electrodes. Eight tactile electrodes were attached to the surfaces of both hands and feet: palms, fingers, front soles, and rear soles [45]. Analysis of body composition was measured before dinner and after voiding [46, 47].
2.3.5Measurement of thigh circumference
Participants of the study visited Songdo Hospital in Seoul, Korea. The subjects lied horizontally with the face and torso facing up with both arms raised overhead. A radiologist performed a computer tomography (CT) scan of the thighs four times (before the experiment, Week 2, Week 4, and Week 6). The CT scan (Toshiba Scanner Aquilion Prime Model TSX-303A, Toshiba Medical Systems Corporation, Tokyo, Japan) was performed on the thickest part of both thighs. Visceral and total fat of both thighs were estimated by delineating the regions and calculating an attenuation range of
2.3.6Measurement of isokinetic strength
All subjects were submitted to a stretching program and a warm up program before the tests. An isokinetic dynamometer (HUMAC
Table 4
Changes and differences of adipokine profiles
| Items | Week | Groups | ||||||
|---|---|---|---|---|---|---|---|---|
| CON | LII | MII | HII | G | T | G | ||
| Visfatin | 0 | 0.61 | 1.26 | 0.98 | 1.56 | 0.466 | 0.194 | 0.458 |
| (ng/mL) | 2 | 0.55 | 1.49 | 0.94 | 2.52 | |||
| 4 | 0.75 | 1.46 | 1.17 | 2.17 | ||||
| 6 | 0.72 | 1.74 | 0.74 | 1.98 | ||||
| Resistin | 0 | 16.96 | 14.74 | 15.33 | 14.78 | 0.433 | 0.195 | 0.016 |
| (ng/mL) | 2 | 17.03 | 15.83 | 15.38 | 15.36 | |||
| 4 | 17.75 | 16.47 | 14.28 | 14.32 | ||||
| 6 | 18.69 | 15.11 | 13.52 | 11.81 | ||||
| Adiponectin | 0 | 3.513 | 3.636 | 4.289 | 2.576 | 0.256 | 0.705 | 0.968 |
| (10 | 2 | 3.301 | 3.760 | 4.236 | 2.617 | |||
| 4 | 3.096 | 4.544 | 4.188 | 2.642 | ||||
| 6 | 3.469 | 3.855 | 4.464 | 2.674 | ||||
All values are expressed as mean
Table 5
Changes and differences of body composition profile analyzed by bioelectrical impedance
| Items | Week | Groups | ||||||
|---|---|---|---|---|---|---|---|---|
| CON | LII | MII | HII | G | T | G | ||
| Body weight (kg) | 0 | 71.37 | 75.27 | 76.13 | 80.78 | 0.525 | 0.142 | 0.024 |
| 2 | 69.23 | 74.40 | 75.60 | 79.40 | ||||
| 4 | 68.80 | 75.13 | 75.65 | 78.73 | ||||
| 6 | 68.80 | 75.23 | 75.85 | 78.53 | ||||
| Muscle mass (kg) | 0 | 32.93 | 34.67 | 35.68 | 36.65 | 0.615 | 0.307 | 0.037 |
| 2 | 32.23 | 34.17 | 35.83 | 36.98 | ||||
| 4 | 31.73 | 35.23 | 35.90 | 36.30 | ||||
| 6 | 31.77 | 33.93 | 35.68 | 37.48 | ||||
| Fat mass (kg) | 0 | 13.60 | 14.47 | 13.65 | 16.30 | 0.898 | 0.304 | 0.119 |
| 2 | 12.77 | 14.30 | 13.03 | 14.70 | ||||
| 4 | 12.97 | 13.20 | 12.88 | 14.33 | ||||
| 6 | 13.00 | 15.63 | 13.58 | 15.03 | ||||
| BMI (kg/m | 0 | 22.27 | 22.10 | 21.68 | 25.30 | 0.890 | 0.169 | 0.217 |
| 2 | 22.53 | 22.73 | 22.00 | 24.90 | ||||
| 4 | 22.40 | 22.93 | 22.03 | 24.68 | ||||
| 6 | 22.40 | 22.93 | 22.05 | 24.63 | ||||
| Percent fat (%) | 0 | 18.87 | 19.07 | 17.88 | 20.38 | 0.951 | 0.825 | 0.208 |
| 2 | 18.27 | 19.10 | 17.13 | 19.30 | ||||
| 4 | 18.73 | 17.43 | 16.90 | 18.78 | ||||
| 6 | 18.70 | 20.57 | 17.93 | 18.38 | ||||
| Waist hip ratio | 0 | 0.86 | 0.86 | 0.86 | 0.87 | 0.777 | 0.881 | 0.381 |
| 2 | 0.86 | 0.86 | 0.87 | 0.88 | ||||
| 4 | 0.85 | 0.86 | 0.87 | 0.87 | ||||
| 6 | 0.85 | 0.87 | 0.86 | 0.87 | ||||
All values are expressed as mean
2.4Statistical analyses
All data were reported as mean
Table 6
Changes and differences of thigh circumferences analyzed by computer tomography
| Items | Week | Groups | ||||||
|---|---|---|---|---|---|---|---|---|
| CON | LII | MII | HII | G | T | G | ||
| Right TVF (cm | 0 | 3.26 | 2.21 | 1.73 | 2.47 | 0.726 | 0.027 | 0.717 |
| 2 | 4.46 | 3.08 | 3.28 | 4.93 | ||||
| 4 | 3.19 | 3.82 | 2.28 | 3.62 | ||||
| 6 | 5.96 | 4.97 | 3.77 | 3.57 | ||||
| Right TSF (cm | 0 | 62.39 | 108.00 | 75.29 | 96.47 | 0.102 | 0.141 | 0.045 |
| 2 | 59.06 | 108.32 | 83.81 | 86.57 | ||||
| 4 | 60.16 | 106.98 | 84.03 | 87.16 | ||||
| 6 | 64.74 | 109.96 | 86.64 | 80.23 | ||||
| Right TTF (cm | 0 | 65.65 | 110.20 | 77.02 | 98.94 | 0.134 | 0.276 | 0.019 |
| 2 | 63.52 | 111.39 | 87.09 | 91.50 | ||||
| 4 | 63.36 | 110.80 | 86.31 | 90.77 | ||||
| 6 | 65.70 | 114.94 | 90.41 | 83.80 | ||||
| Left TVF (cm | 0 | 3.16 | 2.25 | 1.70 | 3.05 | 0.705 | 0.006 | 0.139 |
| 2 | 5.16 | 2.80 | 2.25 | 4.29 | ||||
| 4 | 3.00 | 4.20 | 2.21 | 3.65 | ||||
| 6 | 5.23 | 3.57 | 5.25 | 3.43 | ||||
| Left TSF (cm | 0 | 60.13 | 108.60 | 75.43 | 97.97 | 0.082 | 0.108 | 0.038 |
| 2 | 56.78 | 106.67 | 84.28 | 87.68 | ||||
| 4 | 57.62 | 104.75 | 82.89 | 87.54 | ||||
| 6 | 63.99 | 109.15 | 85.60 | 83.58 | ||||
| Left TTF (cm | 0 | 63.29 | 110.86 | 77.13 | 101.02 | 0.106 | 0.246 | 0.011 |
| 2 | 61.94 | 109.47 | 86.53 | 91.96 | ||||
| 4 | 60.62 | 108.95 | 85.09 | 91.18 | ||||
| 6 | 64.22 | 114.73 | 90.85 | 87.01 | ||||
All values are expressed as mean
3.Results
3.1Comparison of demographic factors, calorie intake and output, and physical activity
As shown in Table 1, there were no significant differences among the four groups for all variables. In particular, WHR, percent fat and BMI, which are indicators of obesity, were not significantly different among groups. As shown in Table 3, there were no significant differences among groups in calorie intake, calorie output, and physical activity level for every recorded week during the 6-week experimental period. To summarize, the above controlled variables showed no significant differences in all four groups, indicating group homogeneity.
3.2Dose-response effect of WB-EMS with isometric exercise on APK
As shown in Table 4, no significant effect of the WB-EMS intervention was found in visfatin and adipo- nectin when comparing the intervention groups and the control group. However, the Resistin level was significantly different in group by time interaction (
3.3Dose-response effect of WB-EMS with isometric exercise on body composition
As shown in Table 5, no significant effect of the WB-EMS intervention was found in fat mass, BMI, percent fat, and WHR when comparing the intervention and the control groups. However, body weight (
3.4Dose-response effect of WB-EMS with isometric exercise on thigh circumference
As shown in Table 6, there were significant differences in the circumference of thigh subcutaneous fat (TSF) and thigh total fat (TTF) on right and left sides in interaction. In detail, the right TSF (
3.5Dose-response effect of WB-EMS with isometric exercise on thigh strength
No significant effects of the WB-EMS intervention were found in the PM of the right extensor and left flexor when comparing the intervention groups and the control group (Table 7). However, there were significant interactions in the PM of the left extensor (
Table 7
Changes and differences of PT in isokinetic knee extensor and flexor at 60
| Items | Week | Groups | ||||||||||
|---|---|---|---|---|---|---|---|---|---|---|---|---|
| CON | LII | MII | HII | G | T | G | ||||||
| Right PT of | 0 | 140.33 | 121.00 | 163.50 | 173.75 | 0.089 | 0.527 | 0.314 | ||||
| extensor (Nm) | 2 | 139.33 | 121.67 | 139.75 | 169.25 | |||||||
| 4 | 129.33 | 128.67 | 140.00 | 170.00 | ||||||||
| 6 | 130.36 | 114.00 | 152.00 | 180.25 | ||||||||
| Left PT of | 0 | 136.10 | 106.67 | 156.75 | 163.75 | 0.778 | 0.707 | 0.037 | ||||
| extensor (Nm) | 2 | 122.12 | 109.33 | 151.75 | 160.25 | |||||||
| 4 | 120.08 | 103.67 | 130.25 | 163.25 | ||||||||
| 6 | 123.07 | 117.33 | 154.75 | 176.75 | ||||||||
| Right PT of | 0 | 89.00 | 63.00 | 107.75 | 107.00 | 0.164 | 0.381 | 0.012 | ||||
| flexor (Nm) | 2 | 90.67 | 83.67 | 97.00 | 114.25 | |||||||
| 4 | 90.30 | 89.00 | 98.50 | 120.00 | ||||||||
| 6 | 71.33 | 76.00 | 99.25 | 119.25 | ||||||||
| Left PT of | 0 | 78.33 | 68.00 | 107.25 | 104.50 | 0.064 | 0.256 | 0.337 | ||||
| flexor (Nm) | 2 | 76.00 | 73.67 | 94.00 | 99.25 | |||||||
| 4 | 73.33 | 76.67 | 88.00 | 109.50 | ||||||||
| 6 | 87.00 | 87.33 | 97.75 | 115.00 | ||||||||
All values are expressed as mean
Table 8
Changes and differences of WR in isokinetic knee extensor and flexor at 180
| Items | Week | Groups | ||||||||||
|---|---|---|---|---|---|---|---|---|---|---|---|---|
| CON | LII | MII | HII | G | T | G | ||||||
| Right WR of | 0 | 113.33 | 58.00 | 119.00 | 128.25 | 0.076 | 0.011 | 0.215 | ||||
| extensor (Nm) | 2 | 109.33 | 83.67 | 116.25 | 130.75 | |||||||
| 4 | 107.33 | 98.67 | 118.50 | 137.25 | ||||||||
| 6 | 133.33 | 98.00 | 119.25 | 144.50 | ||||||||
| Left WR of | 0 | 115.67 | 58.67 | 123.50 | 119.75 | 0.115 | 0.046 | 0.272 | ||||
| extensor (Nm) | 2 | 101.67 | 90.00 | 120.25 | 122.75 | |||||||
| 4 | 107.33 | 94.67 | 104.50 | 127.75 | ||||||||
| 6 | 102.33 | 99.33 | 124.75 | 134.75 | ||||||||
| Right WR of | 0 | 91.67 | 37.00 | 100.00 | 95.00 | 0.147 | 0.146 | 0.002 | ||||
| flexor (Nm) | 2 | 85.33 | 78.33 | 93.50 | 101.50 | |||||||
| 4 | 87.00 | 78.67 | 97.00 | 108.00 | ||||||||
| 6 | 76.67 | 67.00 | 95.00 | 111.00 | ||||||||
| Left WR of | 0 | 86.33 | 54.67 | 106.75 | 102.00 | 0.173 | 0.069 | 0.019 | ||||
| flexor (Nm) | 2 | 84.67 | 68.67 | 96.75 | 97.00 | |||||||
| 4 | 72.67 | 70.67 | 91.00 | 102.50 | ||||||||
| 6 | 71.33 | 82.33 | 96.75 | 115.75 | ||||||||
All values are expressed as mean
4.Discussion
This study provides preliminary evidence that the HII group which received 80% intensity of 1MT improved Resistin levels, body weight and muscle mass, the circumferences of TSF and TTF, and the PT and WR of isokinetic moments compared with the other groups. However, it is important to note that the findings will need to be tested in larger studies as the sample size in the present study was limited.
The WB-EMS suit used in this study can provide electrical stimulation to wide areas where several muscle groups can be trained simultaneously through wearing a simple garment with electrical connectors [34]. This present study combined isometric training with WB-EMS, which used three impulse intensities. The use of WB-EMS has been reported as an effective complementary method to conventional exercise programs [5, 17, 18, 20]. Although the favorable effect of local EMS on neuromuscular parameters has been previously determined in athletes [5, 14, 15, 16, 17] and elderly subjects [18, 19, 20, 21], studies on the dose-response effect of WB-EMS on APK and body composition in healthy men with normal levels of fat are scarce. In fact, since the electrical current threshold is reported to be higher in obese subjects than in normal subjects [21], there may be some differences between obese men and normal men.
This study found that although the various impulse-intensities of WB-EMS showed improved tendencies in APK profiles, there was increased effectiveness when using high electrical impulse intensities in healthy men with normal levels of fat after 6 weeks. Visfatin and adiponectin of APK in the LII and MII groups fluctuated irregularly during the experimental period, however the Resistin of the HII group decreased regularly and sequentially from Week 4 to Week 6. The results of this study were similar with the results of other research studies that showed an increase in adiponectin and a decrease in Resistin due to exercise [23, 24, 25, 26, 27]. In other words, the high-intensity EMS stimulation applied in this study can be regarded as an exercise stimulus for the activation of lipid metabolism reported by other researchers [28, 29]. Previous researchers have reported that a higher level of physical activity is associated with improved lipoprotein profile and increased fat oxidation [29]. Considering the results of this study, the effects of WB-EMS performed for 20 minutes per session with high impulse intensity provided benefits similar to engaging in aerobic exercise. Specifically, the impulses from WB-EMS stimulated Type I and Type II muscle fibers simultaneously. Moreover, higher electrical impulses correlated to higher energy consumption. Therefore, WB-EMS set at high impulse intensity may affect APK if applied for long periods. Although the fat variables of LII and MII groups were not significantly different, body weight in the HII group significantly decreased from Week 2 to Week 6. In an 8-week study, the improvement on anthropometric measures was greater for the walking
In summary, WB-EMS significantly increases the effect of isolated endurance and resistance type exercise in terms of fitness and fat parameters. Furthermore, this study concluded that WB-EMS with isometric exercise may be an effective alternative to conventional exercise for increasing muscle strength and improving body composition. Also, a high degree of fat is associated with APK profile [32, 33] so if the biomarkers are changed by WB-EMS, fat-related indices will improve. The effects of the high impulse WB-EMS in this study were similar to the results of a research [35] published in endurance exercise training that showed increased lipid oxidation leading to positive effects on APK, inflammatory substances, and metabolic indicators as well as body composition in obese men. This study shared a similar opinion that electrical current thresholds are higher in obese than in non-obese subjects and that stimulation tolerance of obese subjects appears to diminish within one stimulation session [22]. In other words, high-intensity WB-EMS stimulation was less effective in subjects with high levels of fat, less muscle mass and thicker fat layers, while muscle-rich and thinner fat layers provided a greater reduction effect over a 6-week period. Similar to the results of that study, the present study observed significant decreases in the circumference of the right TSF and TTF in the HII group only. In addition, the circumference of the left TSF and TTF in the HII group significantly decreased from Week 2 to Week 6. In addition, this study confirmed that the PM of the left extensor and right flexor in the HII group were significantly higher compared with the other three groups at Week 6. Noteworthy, most of the variables mainly increased in the HII group while the variables in the other groups were high already at baseline and therefore they did not show significant differences. Similarly, the WR of the right and left flexor in the HII group were significantly higher than those of the other three groups at Week 6.
Banerjee et al. suggested that EMS is capable of eliciting a cardiovascular exercise response without loading the limbs or joints and inducing rapid, rhythmical contractions in the large leg muscles [36]. They demonstrated significant improvements in peak oxygen consumption, walking distance, and quadriceps strength, except for BMI after 6 weeks. These findings, along with the fact that the average baseline BMI was in the overweight range, suggest that the general physical fitness and body mass profile of the subjects in their study was consistent with that of a sedentary, untrained adult population. Moreover, the EMS device was attached only to specific parts of the body and the tolerance strength was only about 50%, decreasing any potential effect on BMI. In other words, the majority of the subjects in their study selected an impulse intensity that was consistent with the lower end of the training intensity zone [36]. This indicates that exercise intensity must be high enough to receive the effects of body composition and metabolism-related exercises [37, 38].
Although the design of this study has long been conceived and deemed to be in-depth, the lack of subjects suggests that it is somewhat difficult to generalize the results of this study. Therefore, future studies will lead to better research results when more research subjects are secured.
5.Conclusion
This study provides preliminary evidence that high-impulse intensity WB-EMS training for 6 weeks is appropriate to obtain the effect of conventional exercise training. Moreover, in order to increase effective muscular contraction, this study combined WB-EMS with isometric movements during the impulse phase while ensuring the effectiveness and safety of applying electrical stimulation on the human body [6, 39, 40]. The high electrical impulse of WB-EMS for 6 weeks can improve Resistin of APK, body composition, and isokinetic strength in normal healthy men.
Acknowledgments
This research was supported by Basic Science Research Program through the National Research Foundation of Korea (NRF) funded by the Ministry of Education (NRF-2017R1D1A1B03034766).
Conflict of interest
The author declares no conflicts of interest.
References
[1] | Porcari JP, McLean KP, Foster C, Kernozek T, Crenshaw B, Swenson C. Effects of electrical muscle stimulation on body composition, muscle strength, and physical appearance. J Strength Cond Res. (2002) ; 16: : 165-172. |
[2] | Kemmler W, Schliffka R, Mayhew JL, von Stengel S. Effects of whole-body electromyostimulation on resting metabolic rate, body composition, and maximum strength in postmenopausal women: The training and electroStimulation trial. J Strength Cond Res. (2010) ; 24: : 1880-1887. |
[3] | Lexell J, Taylor CC, Sjöström M. What is the cause of the ageing atrophy? Total Number, Size and Proportion of Different Fiber Types Studied in Whole Vastus Lateralis Muscle From 15-to 83-year-old Men. J Neurol Sci. (1988) ; 84: : 275-294. |
[4] | Enoka RM. Activation order of motor axons in electrically evoked contractions. Muscle Nerve. (2002) ; 25: : 763-764. |
[5] | Gondin J, Guette M, Ballay Y, Martin A. Electromyostimulation training effects on neural drive and muscle architecture. Med Sci Sports Exerc. (2005) ; 37: : 1291-1299. |
[6] | Jee YS. The efficacy and safety of whole-body electromyostimulation in applying to human body: Based from graded exercise test. J Exerc Rehabil. (2018) ; 14: : 49-57. |
[7] | Kemmler W, von Stengel S. Whole-body electromyostimulation as a means to impact muscle mass and abdominal body fat in lean, sedentary, older female adults: Subanalysis of the TEST-III trial. Clin Interv Aging. (2013) ; 8: : 1353-1364. |
[8] | Kemmler W, Teschler M, Weißenfels A, Bebenek M, Fröhlich M, Kohl M, von Stengel S. Effects of whole-body electromyostimulation versus high-intensity resistance exercise on body composition and strength: A randomized controlled study. Evid Based Complement Alternat Med. (2016) ; 9236809. |
[9] | von Stengel S, Bebenek M, Engelke K, Kemmler W. Whole-body electromyostimulation to fight osteopenia in elderly females: The randomized controlled training and electrostimulation trial (TEST-III). J Osteoporos. (2015) ; 643520. |
[10] | Gondin J, Cozzone PJ, Bendahan D. Is high-frequency neuromuscular electrical stimulation a suitable tool for muscle performance improvement in both healthy humans and athletes? Eur J Appl Physiol. (2011) ; 111: : 2473-2487. |
[11] | Lai HS, Domenico GD, Strauss GR. The effect of different electro-motor stimulation training intensities on strength improvement. Aust J Physiother. (1988) ; 34: : 151-164. |
[12] | Maffiuletti NA. Physiological and methodological considerations for the use of neuromuscular electrical stimulation. Eur J Appl Physiol. (2010) ; 110: : 223-234. |
[13] | Selkowitz DM. Improvement in isometric strength of the quadriceps femoris muscle after training with electrical stimulation. Phys Ther. (1985) ; 65: : 186-196. |
[14] | Babault N, Cometti G, Bernardin M, Pousson M, Chatard JC. Effects of electromyostimulation training on muscle strength and power of elite rugby players. J Strength Cond Res. (2007) ; 21: : 431-437. |
[15] | Brocherie F, Babault N, Cometti G, Maffiuletti N, Chatard JC. Electrostimulation training effects on the physical performance of ice hockey players. Med Sci Sports Exerc. (2005) ; 37: : 455-460. |
[16] | Malatesta D, Cattaneo F, Dugnani S, Maffiuletti NA. Effects of electromyostimulation training and volleyball practice on jumping ability. J Strength Cond Res. (2003) ; 17: : 573-579. |
[17] | Hortobágyi T, Scott K, Lambert J, Hamilton G, Tracy J. Cross-education of muscle strength is greater with stimulated than voluntary contractions. Motor Control. (1999) ; 3: : 205-219. |
[18] | Amiridis I, Arabatzi F, Violaris P, Stavropoulos E, Hatzitaki V. Static balance improvement in elderly after dorsiflexors electrostimulation training. Eur J Appl Physiol. (2005) ; 94: : 424-433. |
[19] | Paillard T, Lafont C, Costes-Salon MC, Dupui P. Comparison between three strength development methods on body composition in healthy elderly women. J Nutr Health Aging. (2003) ; 7: : 117-119. |
[20] | Paillard T, Lafont C, Soulat JM, Montoya R, Costes-Salon MC, Dupui P. Short-term effects of electrical stimulation superimposed on muscular voluntary contraction in postural control in elderly women. J Strength Cond Res. (2005) ; 19: : 640-646. |
[21] | Vivodtzev I, Pépin JL, Vottero G, Mayer V, Porsin B, Lévy P, Wuyam B. Improvement in quadriceps strength and dyspnea in daily tasks after 1 month of electrical stimulation in severely deconditioned and malnourished COPD. Chest. (2006) ; 129: : 1540-1548. |
[22] | Maffiuletti NA, Minetto MA, Farina D, Bottinelli R. Electrical stimulation for neuromuscular testing and training: State-of-the art and unresolved issues. Eur J Appl Physiol. (2011) ; 111: : 2391-2397. |
[23] | Choi KM, Kim JH, Cho GH, Baik SH, Park HS, Kim SM. Effect of exercise training on plasma visfatin and eotaxin levels. Eur J Endocrinol. (2007) ; 157: : 437-442. |
[24] | Haider DG, Schindler IC, Schaller G, Prager G, Wolzt M, Ludvik B. Increased plasma visfatin concentrations in morbidly obese subjects are reduced after gastric banding. J Clin Endocrinol Metab. (2006) ; 91: : 1578-1581. |
[25] | Moon B, Kwan JJ, Duddy N, Sweeney G, Begum N. Resistin inhibits glucose uptake in L6 cells independently of changes in insulin signaling and GLUT4 translocation. Am J Physiol Endocrinol Metab. (2003) ; 285: : 106-115. |
[26] | Prestes J, Shiguemoto G, Botero JP, Frollini A, Dias R, Leite R, Pereira G, Magosso R, Baldissera V, Cavaglieri C, Perez S. Effects of resistance training on resistin, leptin, cytokines, and muscle force in elderly post-menopausal woman. J Sports Sci. (2009) ; 27: : 1607-1615. |
[27] | Yang WS, Lee WJ, Funahashi T, Tanaka S, Matsuzawa Y, Chao CL, Chen CL, Tai TY, Chuang LM. Weight reduction increases plasma levels of an adipose-derived anti-inflammatory protein, adiponectin. J Clin Endocrinol Metab. (2001) ; 86: : 3815-3819. |
[28] | Kraus WE, Houmard JA, Duscha BD, Knetzger KJ, Wharton MB, McCartney JS, Bales CW, Henes S, Samsa GP, Otvos JD, Kulkarni KR, Slentz CA. Effects of the amount and intensity of exercise on plasma lipoproteins. N Engl J Med. (2002) ; 347: : 1483-1492. |
[29] | Schrauwen P, van Aggel-Leijssen DP, Hul G, Wagenmakers AJ, Vidal H, Saris WH, van Baak MA. The effect of a 3-month low-intensity endurance training program on fat oxidation and acetyl-coA carboxylase-2 expression. Diabetes. (2002) ; 51: : 2220-2226. |
[30] | Anderson AG, Murphy MH, Murtagh E, Nevill A. An 8-week randomized controlled trial on the effects of brisk walking, and brisk walking with abdominal electrical muscle stimulation on anthropometric, body composition, and self-perception measures in sedentary adult women. Psychol Sport Exerc. (2006) ; 7: : 437-451. doi: 10.1016/j.psychsport.2006.04.003. |
[31] | Porcari JP, Miller J, Cornwell K, Foster C, Gibson M, McLean K, Kernozek T. The effects of neuromuscular electrical stimulation training on abdominal strength, endurance, and selected anthropometric measures. J Sports Sci Med. (2005) ; 4: : 66-75. |
[32] | Esposito K, Pontillo A, Di Palo C, Giugliano G, Masella M, Marfella R, Giugliano D. Effect of weight loss and lifestyle changes on vascular inflammatory markers in obese women. JAMA. (2003) ; 289: : 1799-1804. |
[33] | Pittas AG, Joseph NA, Greenberg AS. Adipocytokines and insulin resistance. J Clin Endocrinol Metab. (2004) ; 89: : 447-452. doi: 10.1210/jc.2003-031005. |
[34] | Song J, Schinow V. Correlation between friction and wear properties and electrical performance of silver coated electrical connectors. Wear. (2015) ; 330-331. 400-405. doi: 10.1016/j.wear.2015.02.026. |
[35] | Samjoo IA, Safdar A, Hamadeh MJ, Raha S, Tarnopolsky MA. The effect of endurance exercise on both skeletal muscle and systemic oxidative stress in previously sedentary obese men. Nutr Diabetes. (2013) ; 3: : e88. |
[36] | Banerjee P, Caulfield B, Crowe L, Clark A. Prolonged electrical muscle stimulation exercise improves strength and aerobic capacity in healthy sedentary adults. J Appl Physiol. (2005) ; 99: : 2307-2311. |
[37] | Garber CE, Blissmer B, Deschenes MR, Franklin BA, Lamonte MJ, Lee IM, Nieman DC, Swain DP. American college of sports medicine position stand. Quantity and Quality of Exercise for Developing and Maintaining Cardiorespiratory, Musculoskeletal, and Neuromotor Fitness in Apparently Healthy Adults: Guidance for Prescribing Exercise. Med Sci Sports Exerc. (2011) ; 30: : 1334-1359. |
[38] | Shankar K, Mihalko-Ward R, Rodell DE, Bucher A, Maloney FP. Methodologic and compliance issues in postcoronary bypass surgery subjects. Arch Phys Med Rehabil. (1990) ; 71: : 1074-1077. |
[39] | Doheny EP, Lowery MM, Fitzpatrick DP, O’Malley MJ. Effect of elbow joint angle on force-EMG relationships in human elbow flexor and extensor muscles. J Electromyogr Kinesiol. (2008) ; 18: : 760-770. |
[40] | Rostrup E, Slettom G, Seifert R, Bjørndal B, Berge RK, Nordrehaug JE. Effect of combined thermal and electrical muscle stimulation on cardiorespiratory fitness and adipose tissue in obese individuals. Eur J Prev Cardiol. (2014) ; 21: : 1292-1299. |
[41] | Filipovic A, Kleinöder H, Dörmann D, Mester J. Electromyostimulation – a systematic review of the influence of training regimens and stimulation parameters on effectiveness in electromyostimulation training of selected strength parameters. J Strength Cond Res. (2011) ; 25: : 3218-3238. |
[42] | Hortobágyi T, Maffiuletti NA. Neural adaptations to electrical stimulation strength training. Eur J Appl Physiol. (2011) ; 111: : 2439-2449. |
[43] | Kemmler W, Froehlich M, von Stengel S, Kleinoeder H. Whole-body electromyostimulation – the need for common sense! Rationale and guideline for a safe and effective training. Dtsch Z Sportmed. (2016) ; 67: : 218-221. |
[44] | Lam H, Qin YX. The effects of frequency-dependent dynamic muscle stimulation on inhibition of trabecular bone loss in a disuse model. Bone. (2008) ; 43: : 1093-1100. |
[45] | Pil-Byung C, Shin-Hwan Y, Il-Gyu K, Gwang-Suk H, Jae-Hyun Y, Han-Joon L, Sung-Eun K, Yong-Seok J. Effects of exercise program on appetite-regulating hormones, inflammatory mediators, lipid profiles, and body composition in healthy men. J Sports Med Phys Fitness. (2011) ; 51: : 654-663. |
[46] | Cha JY, Kim JH, Hong J, Choi YT, Kim MH, Cho JH, Ko IG, Jee YJ. A 12-week rehabilitation program improves body composition, pain sensation, and internal/external moments of baseball pitchers with shoulder impingement symptom. J Exerc Rehabil. (2014) ; 10: : 35-44. |
[47] | Kim MH, Choi YT, Jee YS, Eun D, Ko IG, Kim SE, Yi ES, Yoo J. Reducing the frequency of wearing high-heeled shoes and increasing ankle strength can prevent ankle injury in women. Int J Clin Pract. (2015) ; 69: : 909-910. |
[48] | Park JS, Oh HW, Park EK, Ko IG, Kim SE, Kim JD, Jin JJ, Jee YS. Effects of rehabilitation program on functional scores and isokinetic moments of knee medial plica-operated patients. Isokinet Exerc Sci. (2013) ; 21: : 19-28. |
[49] | Bily W, Trimmel L, Mödlin M, Kaider A, Kern H. Training program and additional electric muscle stimulation for patellofemoral pain syndrome: A pilot study. Arch Phys Med Rehabil. (2008) ; 89: : 1230-1236. |
[50] | Kraemer WJ, Ratamess NA. Fundamentals of resistance training: Progression and exercise prescription. Med Sci Sports Exerc. (2004) ; 36: : 674-688. |
[51] | Levinger I, Goodman C, Hare DL, Jerums G, Toia D, Selig S. The reliability of the 1 RM strength test for untrained middle-aged individuals. J Sci Med Sport. (2009) ; 12: : 310-316. |
[52] | Brenner DJ, Doll R, Goodhead DT, Hall EJ, Land CE, Little JB, Lubin JH, Preston DL, Preston RJ, Puskin JS, Ron E, Sachs RK, Samet JM, Setlow RB, Zaider M. Cancer risks attributable to low doses of ionizing radiation: Assessing what we really know. Proc Natl Acad Sci USA. (2003) ; 100: : 13761-13766. |
[53] | Smith-Bindman R. Is computed tomography safe? N Engl J Med. (2010) ; 363: : 1-4. |


