
Towards data warehouse from open data: Case of COVID-19
Abstract
Since December 2019, we have detected the appearance of a new virus called COVID-19, which has spread, throughout the world. Everyone today, has given major importance to this new virus. Although we have little knowledge of the disease, doctors and specialists make decisions every day that have a significant impact on public health. There are many and various open data in this context, which are scattered and distributed. For this, we need to capitalize all the information in a data warehouse. For that, in this paper, we propose an approach to create a data warehouse from open data specifically from COVID-19 data. We start with the identification of the relevant sources from the various open data. Then, we collect the pertinent data. After that, we identify the multidimensional concepts used to design the data warehouse schema related to COVID-19 data. Finally, we transform our data warehouse to logical model and create our NoSQL data warehouse with Talend Open Studio for Big Data (TOS_BD).
1.Introduction
The coronavirus 2019 is a pandemic of an emerging infectious disease, called COVID-19, caused by the new virus labeled SARS-CoV-2 [4]. The first case was reported in Wuhan, China, in December 2019, and the illness rapidly spread throughout China and other countries. The World Health Organization (WHO) first alerts the People’s Republic of China and its other member states, and then declares a public health emergency of international scope on January 30, 2020 [4]. As of 10 May 2020, there have been more than 4.10 million confirmed cases of COVID-19 in 187 countries/regions, with 282,719 deaths worldwide [12].
As COVID-19 rages across our planet, all eyes turn to a trusted source of data which is the John’s Hopkins11 COVID-19 Global Update. It highlights the critical need to have timely access to data and analytics in order to drive decision-making. In particular, extra-hospital care settings such as qualified nursing facilities, assisted or independent living facilities, life planning communities, home health care and palliative care agencies have seen significant impacts on their clinical operations due to COVID-19 [11].
The medical decision-makers must have access to clinical data and actionable information in order to plan and deliver quality care while being effective. Clinical health care data can be classified into two broad groups: structured and unstructured. Examples of unstructured data include text, images, or social media content. The data itself has some internal structure but cannot be easily pre-defined by data models or schema. Examples could be radiology images or nurses’ progress notes. Nurses’ progress notes could be considered semi-structured or unstructured. In fact, with COVID-19, it is important to understand the content of those progress notes in conjunction with structured data, like vitals, that may not tell the entire story [11].
By leveraging data warehousing technique and investing it in the right applications, healthcare professionals and researchers can uncover valuable information to improve the clinical trial process and reduce time to trial drug development [5]. Today, data warehousing has become strategically important in helping these healthcare specialists in the decision making process. Decision-making should be based on facts, especially in the health sector. Leveraging data warehousing enabled accurate decision making. Healthcare organizations can now measure, interpret and analyze patient data collected from various sources with great ease [5]. Therefore, data warehousing has an important role in the combating COVID-19.
When we closely followed the COVID-19 pandemic, we were probably bombarded with many statistics. These may be difficult to understand, misleading or too high-level to understand its meaning. This means that full understanding of the true impact of COVID-19 is often left to “experts” for the following reasons:
• The data presented are always pre-aggregated and summarized. While it is easy to answer preconceived questions, such as “getting cases up or down,” it is difficult to answer new questions or to correlate difficult questions together.
• Data is partitioned and disconnected. It is easy to see a specific set of statistics (for example, new cases, deaths or tests), but it is very difficult to see (with the data) the impact that new prevented measures have had on the volume cases.
• All tabular data with few visuals. Many multimedia sites allow you to sort and rotate, but few offer the ability to view, spot trends and outliers and really ask and answer your own questions.
What is remarkable is that combining all of the COVID-19 data in a data warehouse can answer the above mentioned questions. This article discusses a new approach to create a data warehouse from open data related to COVID-19 in order to help the medical decision-makers to improve the clinical trial process, reduce time to trial drug development and follow the evolution of COVID-19. The proposed approach is composed of two main phases: the design phase and the ETL phase.
The remainder of this paper is organized as follows. Section 2 presents some works of the literature reviews. Section 3 overviews the different stages of our approach for the design and the creation of a data warehouse from COVID-19 open data. Section 4 exposes the identification of the most relevant sources. Section 5 presents a short description about collected data. Section 6 presents the design of the data warehouse schema for COVID-19. Section 7 exhibits the transformation of the multidimensional schema to a logical model (document-oriented). Section 8 presents the ETL phase. Finally, we conclude the paper and give some future research directions in Section 9.
2.Related works
In recent years, the use of NoSQL systems to store and operate massive databases (DBs) is in continued increasing. The authors in [14] discussed the possibilities and the benefits of using document-oriented NoSQL database to create the data warehouses. They described the processes and implementation aspects of building data warehouses using NoSQL data stores.
Moreover, the authors in [3] presented a study about BDW, which focuses on the works that treat the difference between the relational databases and the NoSQL databases, the creating data warehouse under NoSQL databases, the big ETL and the NoSQL based ETL process.
Furthermore, the authors in [2] proposed a method to design the data warehouse schema from NoSQL databases. This method treats the extraction of schemas from document-oriented databases as an example of a NoSQL database. This extraction is performed based on the MapReduce paradigm. Then, the definition of the structure identification graph from the extracted diagrams. This will help the designer to identify multidimensional concepts for each pattern extracted in order to design the overall scheme of the data warehouse.
In [6], the authors implemented a data warehouse using open data from various sources. The data supposed to provide various answers and offer decision-making adapted to the general public. The goal is to find open government data and analyze the data to create a business model while meeting the requirements of the data warehouse.
Since December 2019, we have seen the appearance of the COVID-19 virus which involves a massive data and information. In order to understand coronavirus disease, it is important to collect and store data in an appropriate and efficient format. The traditional RDBMS may not be the most efficient choice for the clinical and ever-changing data associated with COVID patients due to its very rigid nature. The authors in [15] used a primary dataset acquired from COVID-19 patients as a premise to describe the inefficiencies of the RDBMS and they further proposed two new unstructured databases, the NoSQL and XML databases. The authors highlight the advantage of using NoSQL for storing COVID-19 data such as: scalability, flexibility, high functionality, security, retrieval of archived data.
The rapid need to find a cure and a vaccine for COVID-19 disease means researchers need to store increasingly large and diverse types of information; for physicians who follow patients, record symptoms and reactions to treatments. For this, the authors in [7] opens the way for the use of NoSQL databases to store and protect information from patients COVID-19, removing existing barriers to their adoption. They developed and presented a comprehensive solution to the critical security issues common to all types of NoSQL DBMS using the proposal of an algorithm that would help hospitals and medical and scientific authorities to choose the most suitable type for store patient information.
The authors in [10] proposed a storage framework able of handling both the SQL and NOSQL databases for COVID-19 datasets named COVID-QF in order to address and manage the issues caused by the spread of this virus worldwide clearly by reducing processing times. COVID-QF consists of three layers: the data collection layer, the storage layer and the request processing layer.
However, the authors in [1] proposed an approach for building a data warehouse from the Italian COVID-19 data. In this approach, the authors presented the design and development of COVID-Warehouse, a data warehouse that models, integrates and stores the COVID-19 data. These data are available daily by the Italien Protezione Civil Department and several pollution and climate data.
In [13], the authors explained how a data warehouse facilitates decision making in the medical field. Despite the challenges, the authors described that an open data warehouse for COVID-19 is essential in preparing for future pandemics and worth the effort involved.
The authors in [16] provided a snapshot of how the publishing landscape has evolved in the first six months of 2020 (between January 1 and June 30, 2020) in response to the global pandemic Covid-19 and discussed the risks associated with the speed of publications.
In [9], the authors proposed a novel approach that combines the Semantic Web Services (SWS) and the Big Data characteristics in order to extract a significant information from multiple data sources which can be an Enterprise Data Warehouse/Data Mart, or a SQL, key-value database, document, graph, or column database, that can be exploitable for generating real-time statistics and reports.
The COVID data being dynamic and ever-changing enhances the complexities of a traditional database system [15]. The speed, cost, and potential, like NoSQL, finally capture data that are unstructured and semi-structured too.
Table 1 highlights a summary of the literature review based on four criteria.
• C1-Create a Data Warehouse. This criterion is relative to the create of the data warehouse.
• C2-NoSQL Databases: indicates the use of the NoSQL databases in the Input (as data sources) or in the Output (to Load data).
• C3-Open Data: use the COVID-19 data.
• C4-Query Processing Layer.
Table 1
Summary of the literature review
| Paper | C1 | C2 | C3 | C4 |
|---|---|---|---|---|
| Oditis et al., 2018 | Yes | Data sources | Yes | No |
| Bouaziz et al., 2019 | Yes | Data sources | No | No |
| ElDahshan et al., 2020 | No | Storage | Yes | No |
| Khashan et al., 2020 | No | Storage | Yes | Yes |
| Agapito et al., 2020 | Yes | – | Yes | No |
| Mattingly et al., 2020 | Yes | – | Yes | No |
| Kachaoui et al., 2020 | No | – | Yes | No |
| Priya et al., 2021 | No | Storage | Yes | No |
| Teixeira da Silva et al., 2021 | No | – | Yes | No |
| Our proposed approach | Yes | Data sources | Yes | No |
| and storage |
It should be noted that the mentioned studies used the unstructured databases (NoSQL data) at the source level of the data warehouse such as [14, 2] or at the storage level, such as [10, 7, 15]. Our proposal is to create a data warehouse through various COVID-19 data (structured and unstructured). For this, we will use unstructured data as a source and also at the Storage level of the data warehouse.
3.DW from open data: Case of COVID-19
In this paper, we propose a new approach to create a data warehouse from open data. This approach is composed of two main phases: (i) The design phase and (ii) the ETL phase as depicted in Fig. 1.
Figure 1.
Overview of our approach.
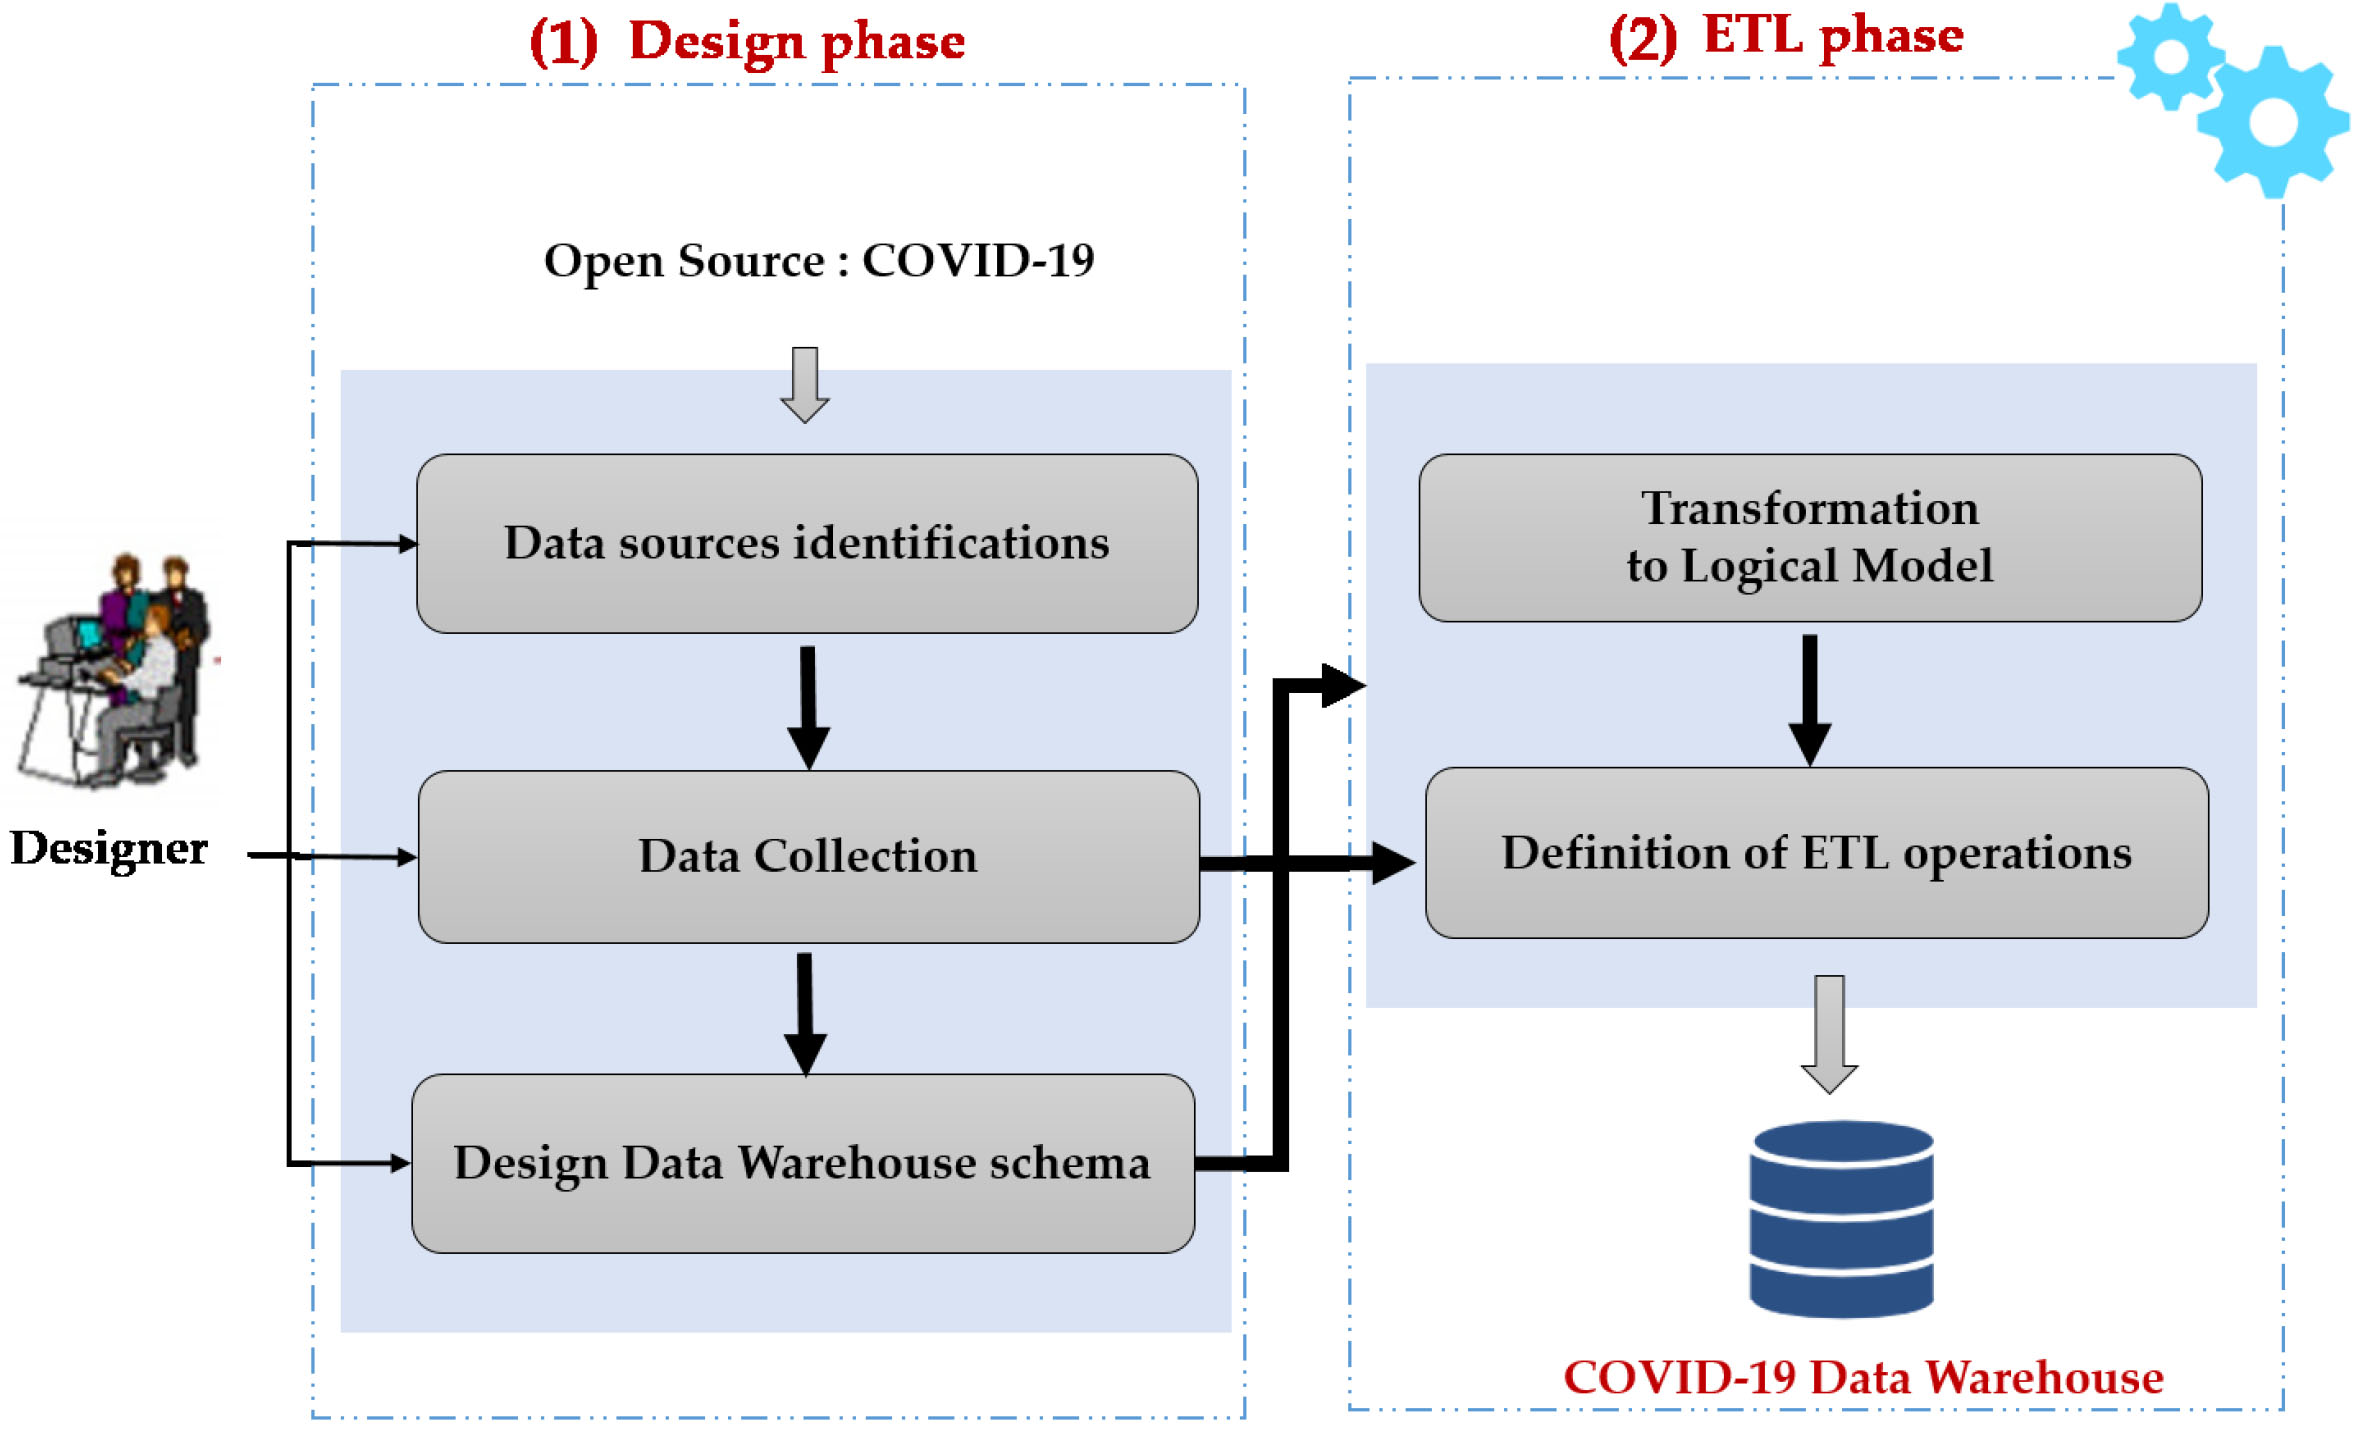
The first phase is composed of three main steps: Data source identification, Data collection and Design Data warehouse Schema. In fact, we start by identifying the open data sources related to the COVID-19 epidemic. After that, we move to collect relevant and useful data for the design of the COVID-19 data warehouse. Then, we terminate by the identification of multidimensional concepts from collected data. It consists in determining: facts, measures, dimensions and hierarchies to model the data warehouse schema. During these steps, the implication of the medical decision-maker with the designer is mandatory.
The second phase describes the transformation to the logical NoSQL model used to create the data warehouse and details the different ETL operations.
4.Data source identification
Any Public Health country mission’s is to improve and protect the health of populations. During the health crisis linked to the COVID-19 epidemic, Public Health is responsible for monitoring and understanding the dynamics of the epidemic, anticipating the different scenarios and implementing actions to prevent and limit the transmission of this virus on the national territory. For that, many data are posted on the web to follow-up the coronavirus epidemic. This data are scattered and distributed over several sites. For this, we need to identify all available sources on the web for a specific country.
Notes that, each country publishes a set of data which is different from other country. So, we searched for the country that publishes the maximum of information about the COVID-19. We found the public Health France platform since it provides several open sources and more detailed data in comparison with other country.
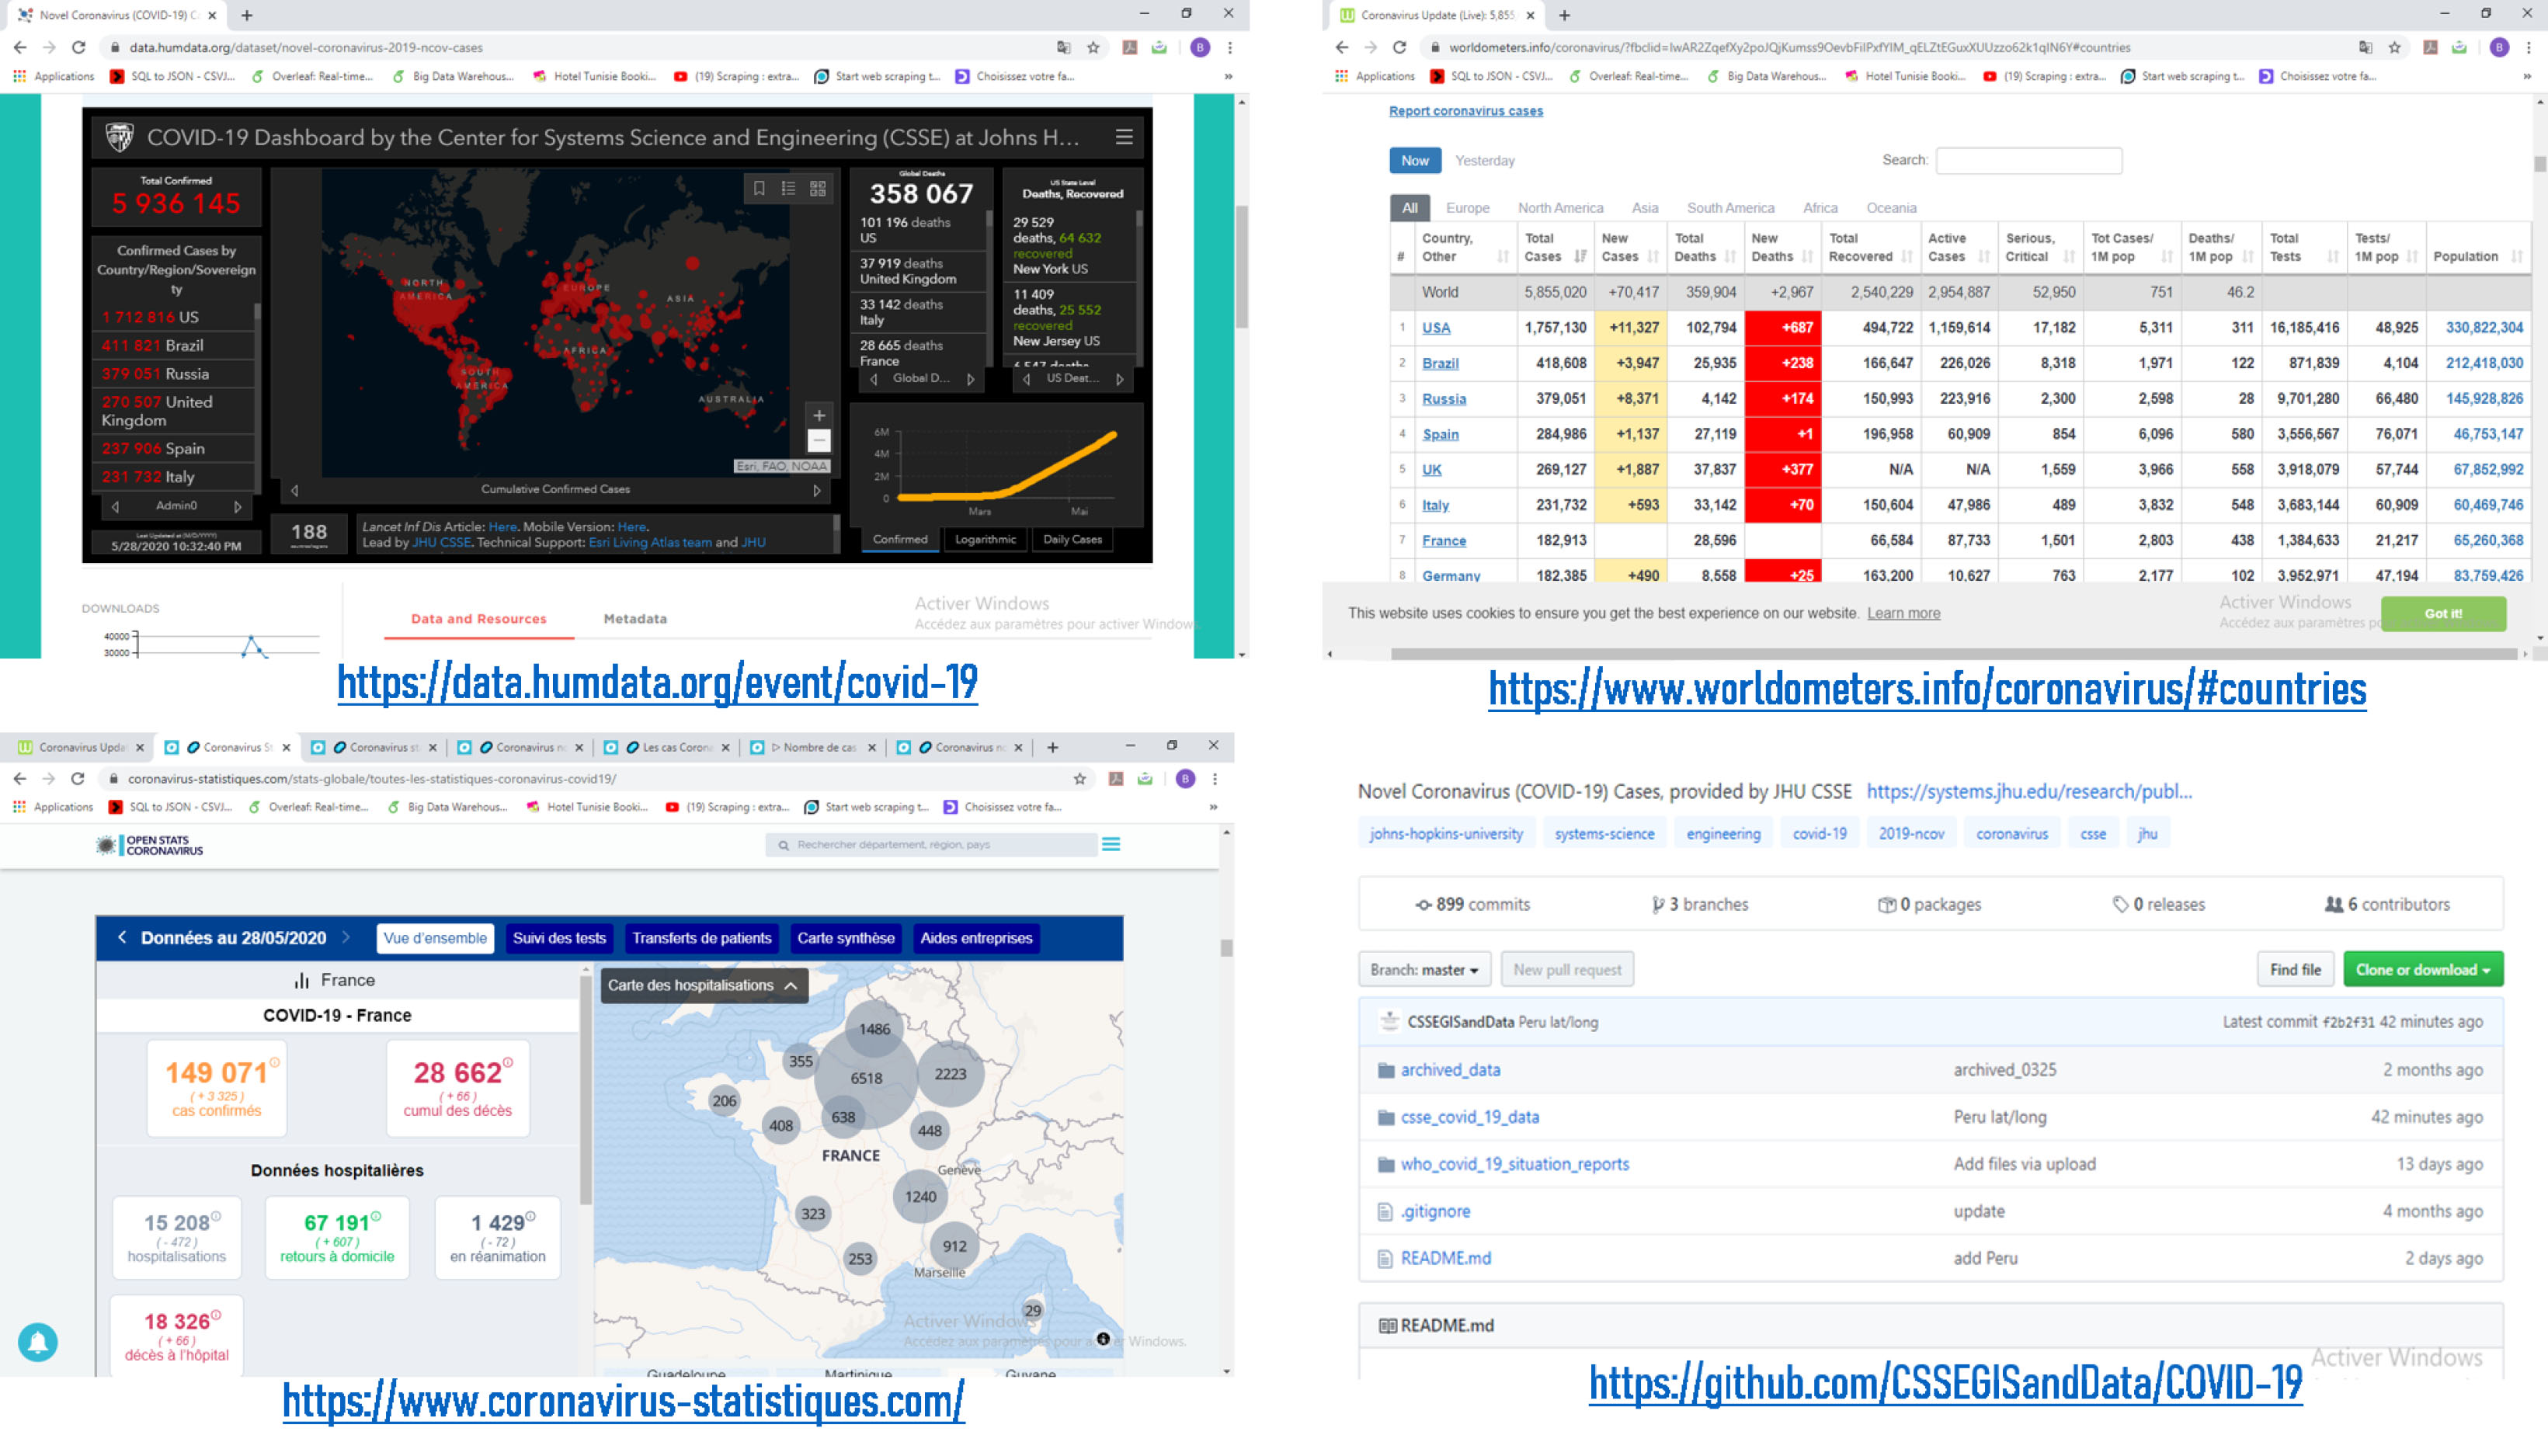
So, we identify the general information on the global COVID-19 pandemic from the open platform for Public Health France as viewed in data.gouv.fr.
Figure 2 shows several data sources that we used to collect all of the data related to the COVID-19 epidemic in order to create our data warehouse.
Figure 2.
COVID-19 data links in France.
5.Data collection: Sources descriptions
Data collection is an essential step in the creation of our data warehouse. During the data collection, we extract all relevant data from available data sources. In this section, we detail four sources: Data related to the COVID-19 epidemic, Hospital data relating to the COVID-19 epidemic, Data from COVID-19 screening tests, Data from SOS doctors and hospital emergencies.
5.1Source1: Data related to the COVID-19 epidemic
The first source used to create our data warehouse is the data collected from an open platform.22 It contains data about confirmed cases, death cases, Total Recovered, Serious Critical, Hospital data, Number of tests. Figure 3 presents an excerpt from the data collected to the COVID-19 epidemic in France.
Figure 3.
Excerpt of the data source COVID-19 epidemic in France.
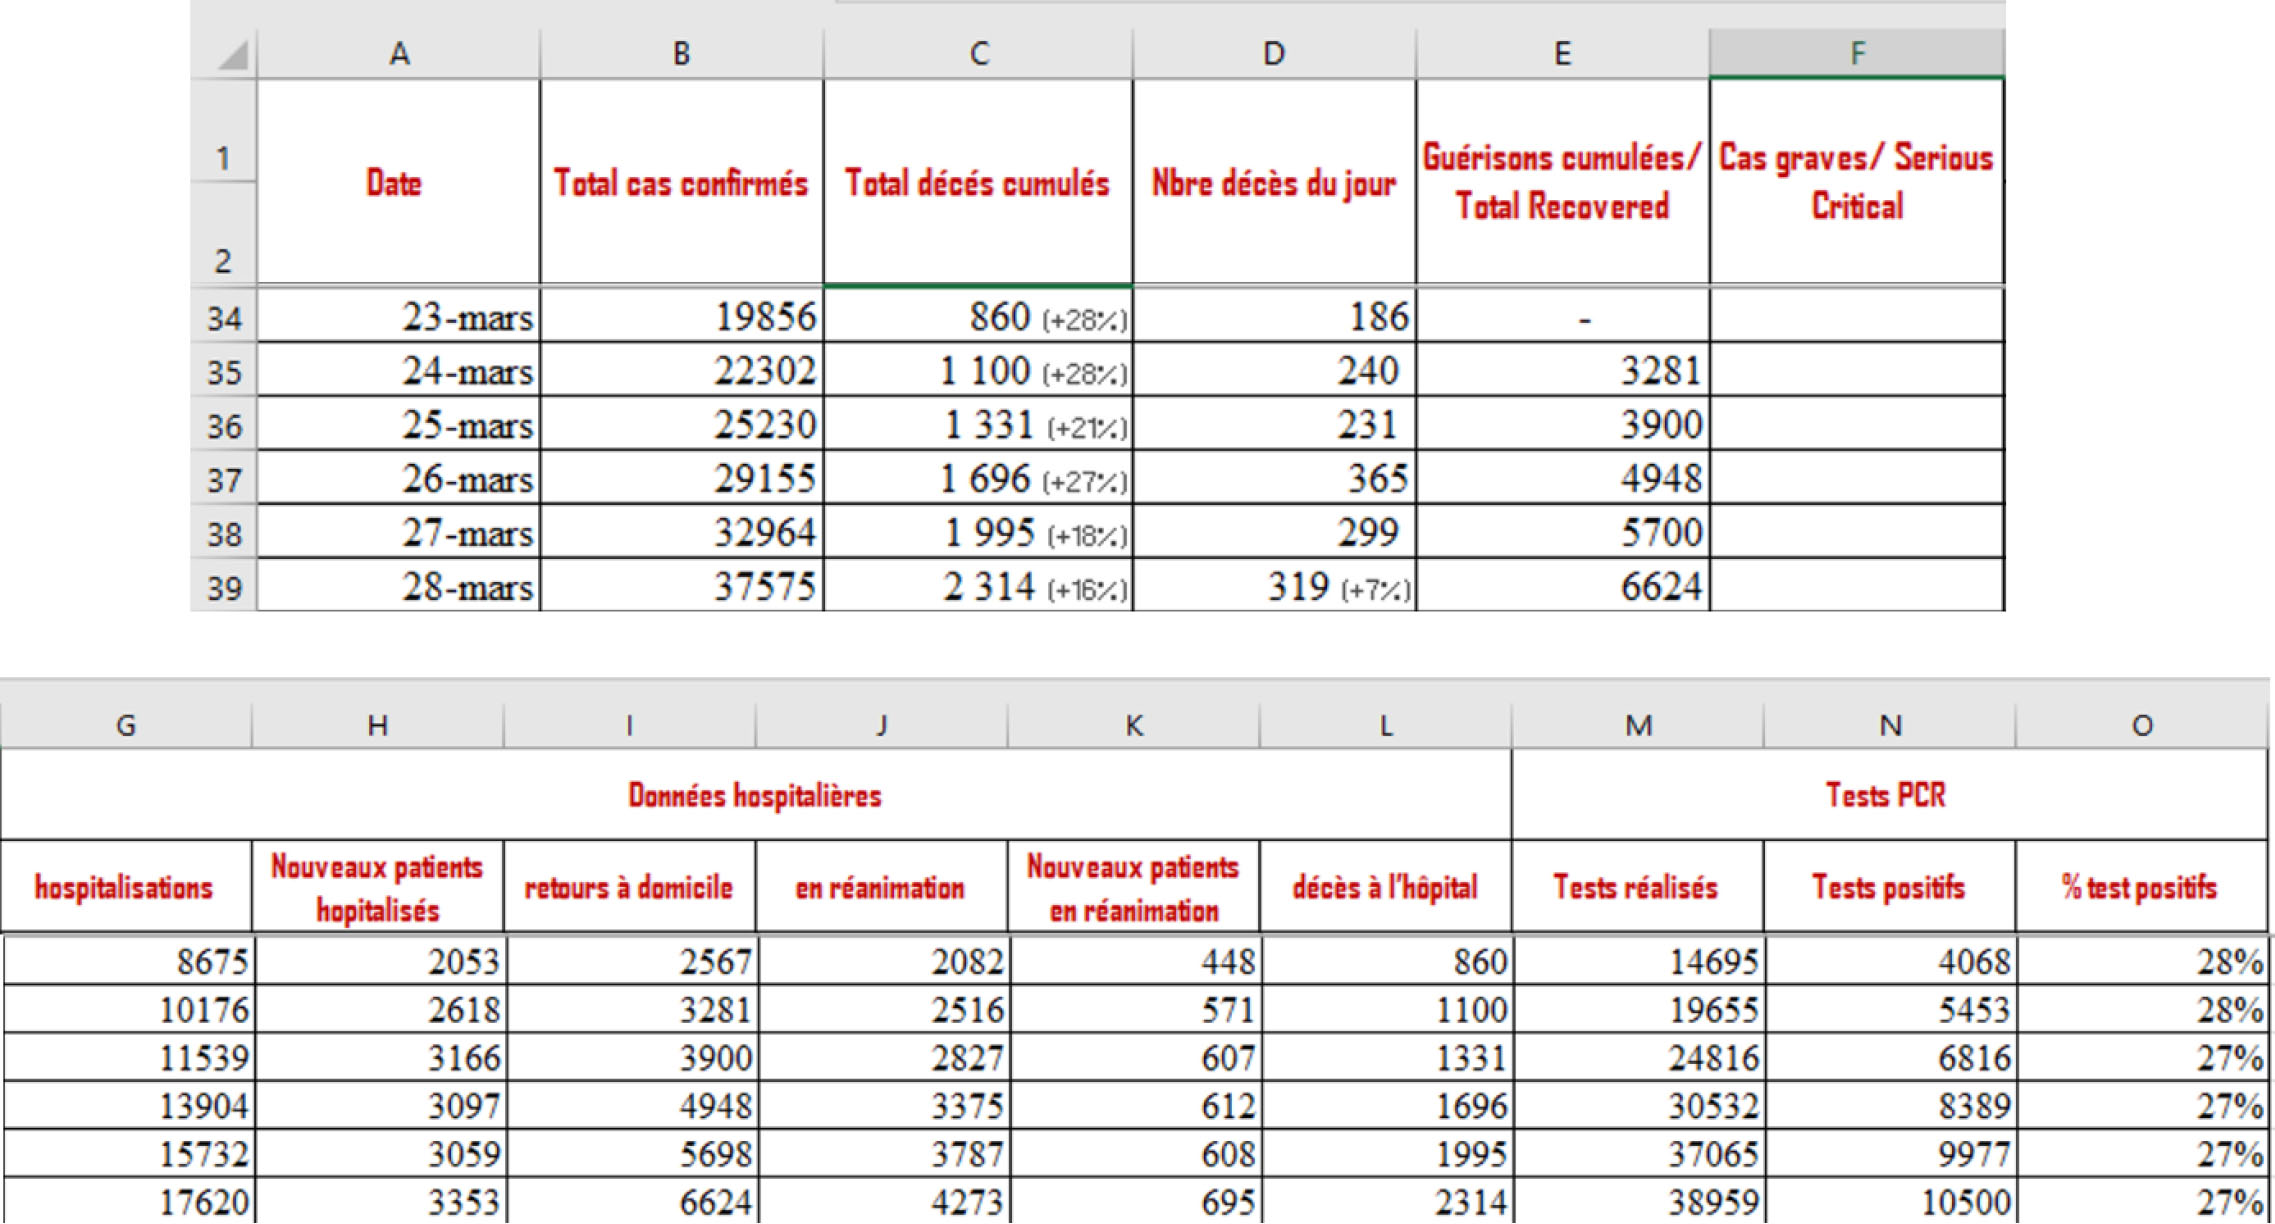
Figure 4.
Excerpt from hospital data relating to the COVID-19 epidemic.
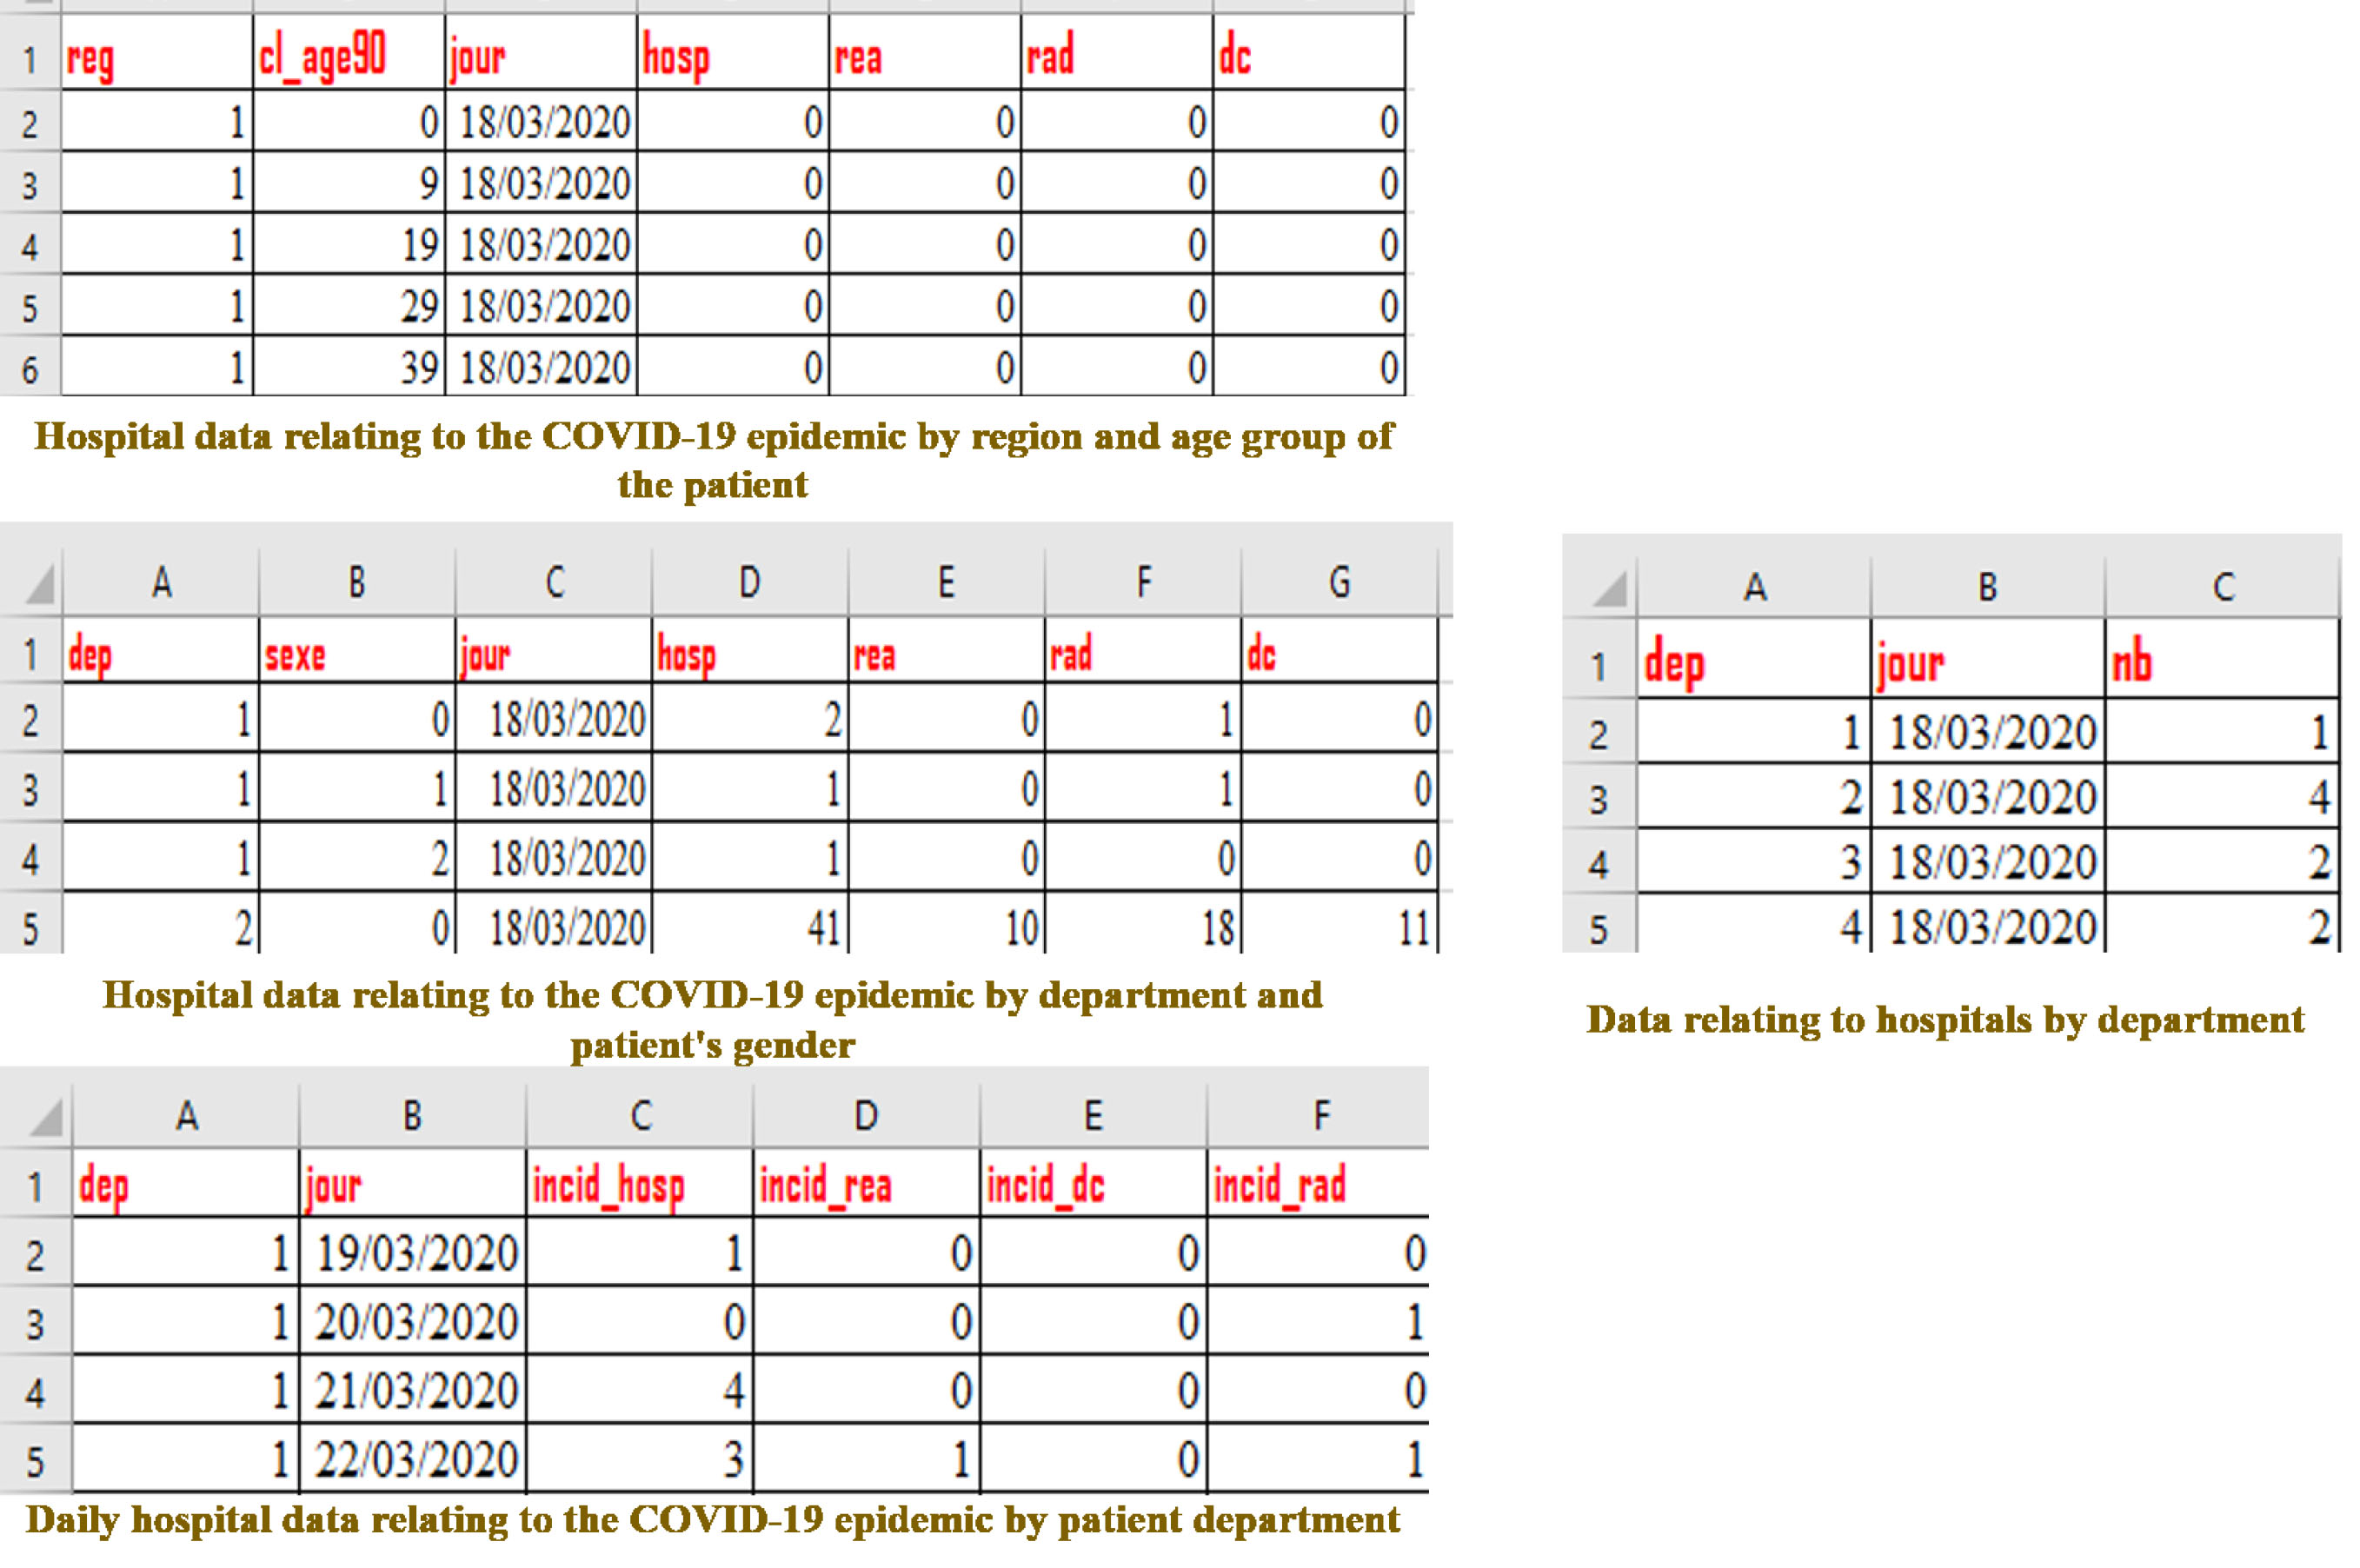
Figure 5.
Excerpt from the list of french departments and their respective region.
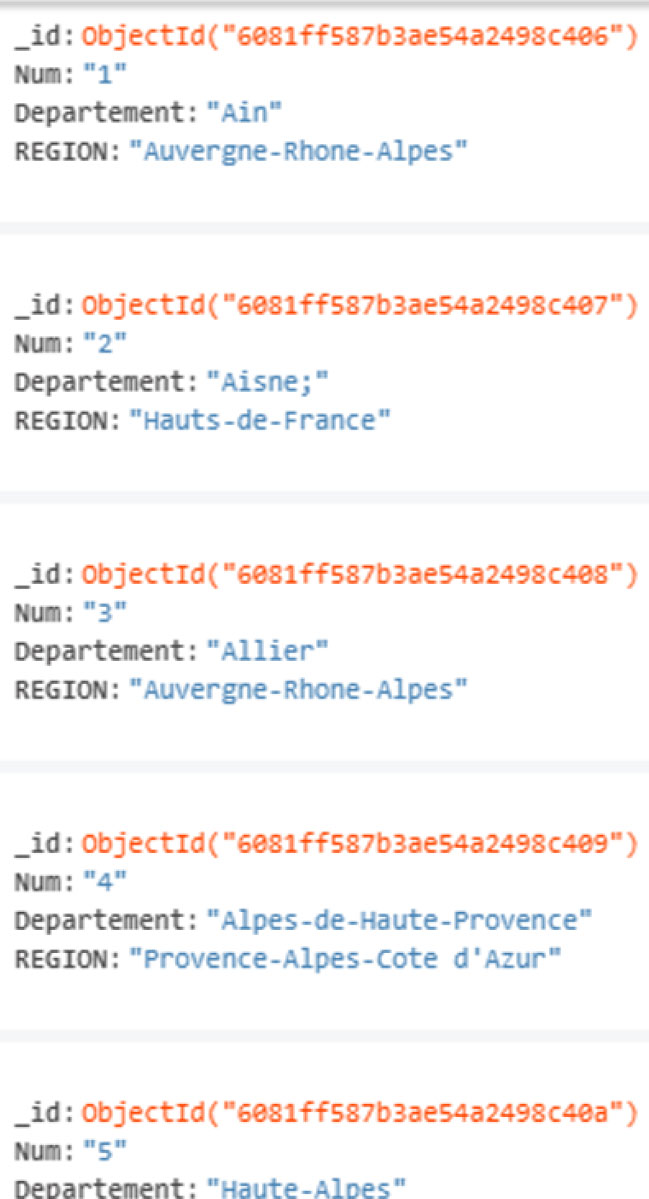
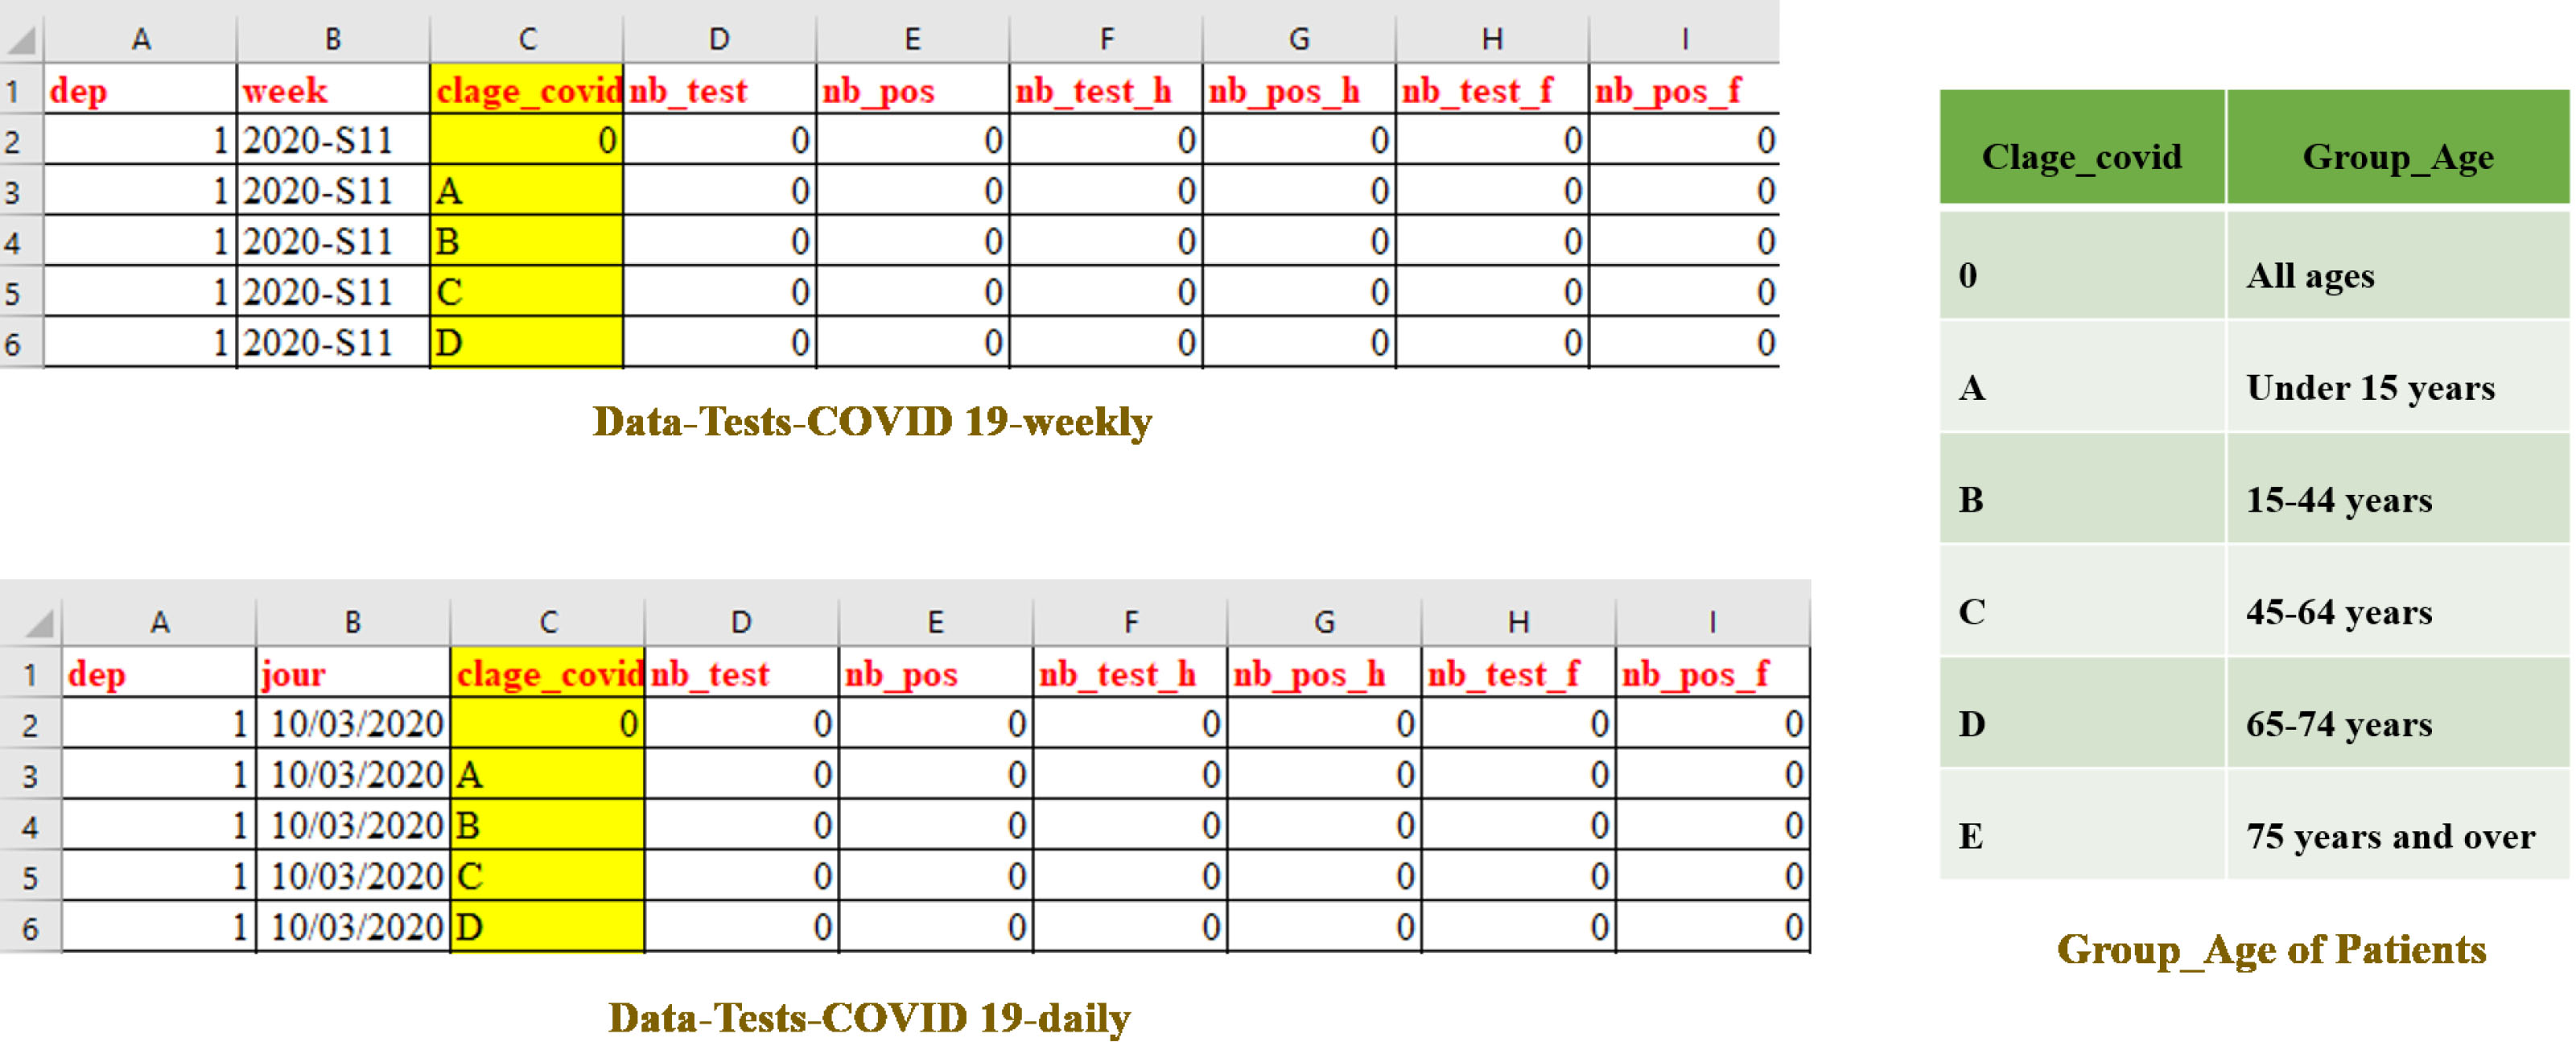
Figure 6.
Excerpt from a daily and a weekly data file relating to the COVID-19 epidemic.
5.2Source2: Hospital data relating to the COVID-19 epidemic
The second source used is hospital data.33 It provides information on the hospital situation concerning the COVID-19 epidemic:
Figure 4 shows an excerpt from the hospital data relating to the COVID-19 epidemic. Figure 5 shows an excerpt from the list of french departments and their region. This source is of NoSQL type and more precisely, it is registered under the MongoDB model.
5.3Source3: Data for COVID-19 screening tests
This dataset provides information on the number of COVID-19 screening tests44 performed by city laboratories, by department (dep) and by Age group of patients (clage_covid). It provides also:
Figure 6 shows an excerpt from a daily data file and an excerpt from a weekly data file for COVID-19 screening tests.
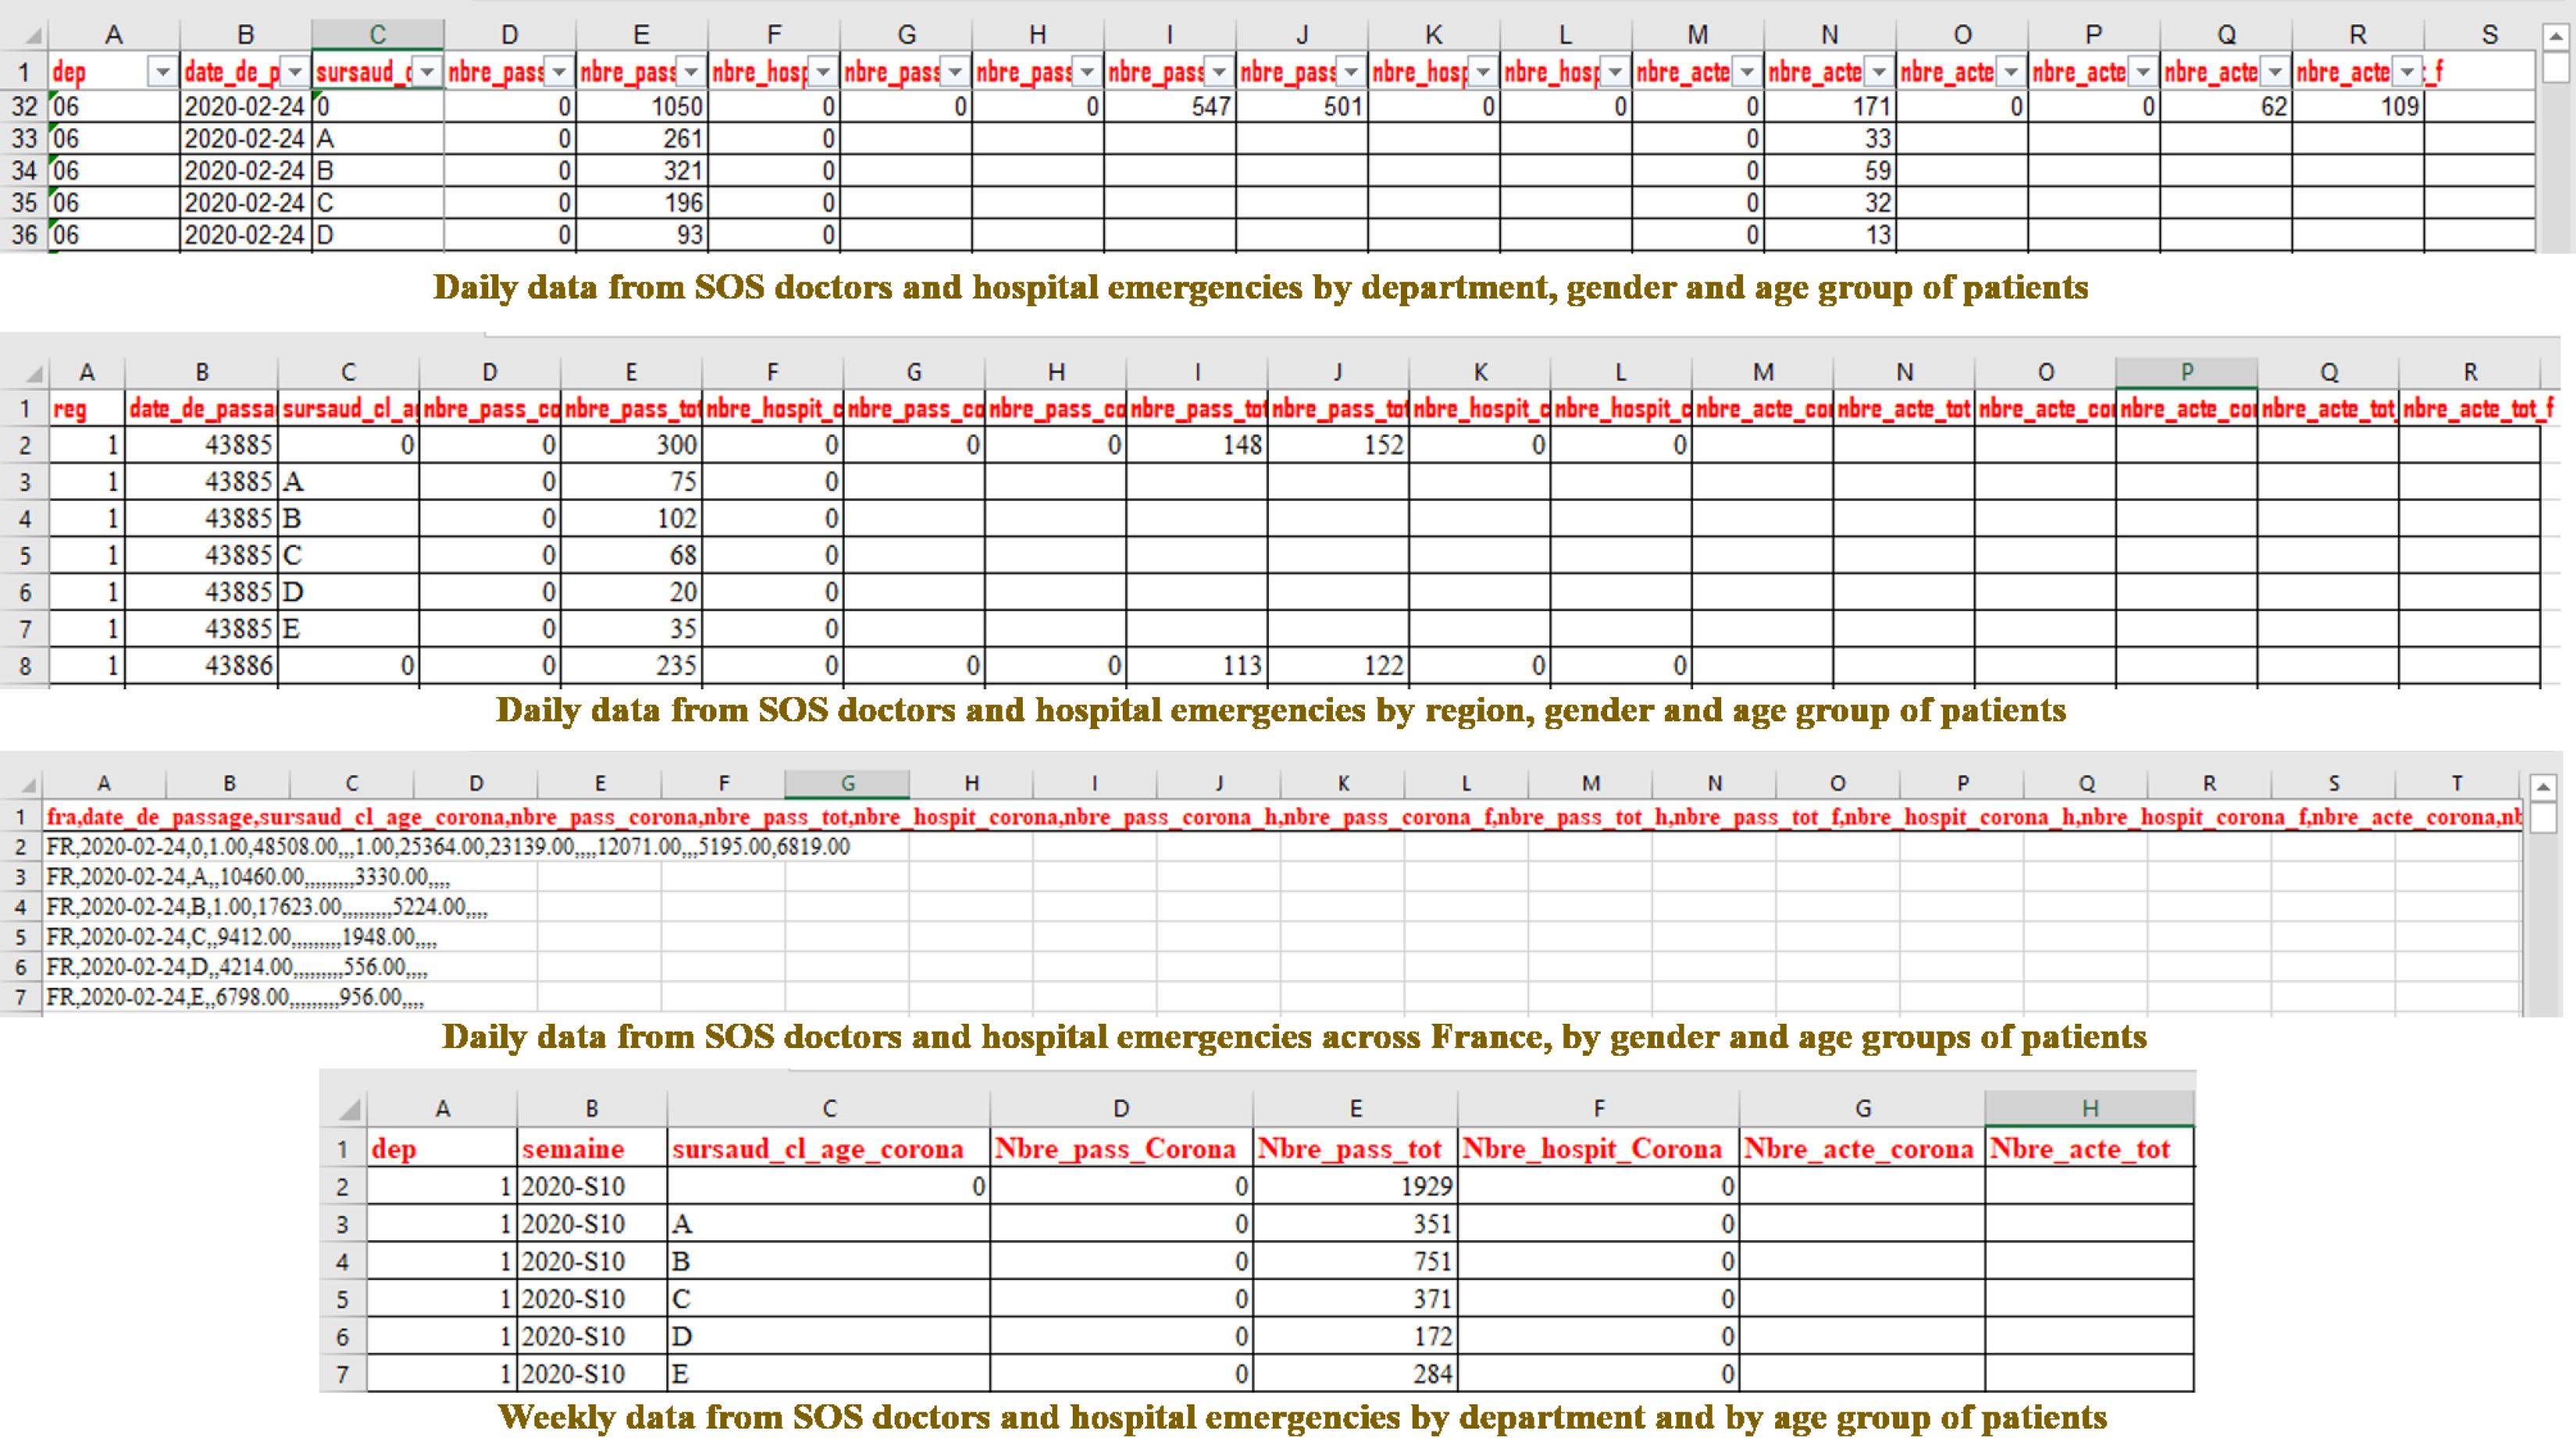
5.4Source4: Data from SOS doctors and hospital emergencies
The last source used is about SOS doctors and hospital emergencies.55 In this source, the given data contain:
Figure 7 shows an excerpt from a daily and a weekly data from SOS doctors and hospital emergencies.
Table 2
COVID-19 measures
| Attributes name | Measures name | Data source | Description |
|---|---|---|---|
| Total cumulative deaths | Nb_Death | Source1 | The total number of cumulative deaths |
| Total confirmed cases | Nb_Cases | Source1 | The total number of cumulative cases confirmed |
| Total Recovered | Nb_Recovered | Source1 | The total number of recovered people |
| Serious cases | Nb_SC | Source1 | The number of Serious cases |
| Returned home | Nb_RaD | Source2 | The Total amount of patient that returned home |
| Source1 | |||
| Tests performed | Nb_Tests | Source3 | The total number of tests performed |
| Source1 | |||
| Test positive | Nb_Pos_Tests | Source3 | The number of positive tests compared to the number of tests performed |
| Source1 | |||
| Total cases | Nb_Act | Source3 | The number of acts performed |
| Test performed | Source4 | ||
| Nbre_acte_tot |
Figure 7.
Excerpt data from SOS doctors and hospital emergencies.
In the data warehousing process, we need to consolidate the different representations of the data and eliminate duplicate information in order to design the schema of the data warehouse. This step is detailed in the following section.
6.Data warehouse schema design
In this section, we propose the design of the DW schema based on a set of rules. These rules are used to identify the multidimensional concepts precisely of facts, measures, dimensions and hierarchies. This phase is realized by the designer and the decision-maker.
6.1Determination of fact and measures
An analyzed subject represented by the concept of fact. Each fact characterized by one or more measure representing the indicators analyzed. The fact to be analyzed describes the evolution of the coronavirus epidemic (confirmed, deaths, recovered, etc.). The following is two rules for identifying the fact and measures.
The data retrieved from COVID-19 allows us to obtain the following measures: Number of deaths, Number of cases, Number of Patients Recovered, Number of Serious cases, Number of RCD, Number of Tests performed, Number of Positive Tests and Number of Acts. We represent Fact-COVID-19 as well as these measures in Fig. 8.
Table 2 presents the name of the attribute in our database (column 1), the name of the determined measure (column 2), used data source (column 3) and its description (column 4).
6.2Determination of dimensions
The extraction of dimensions is based on a type of object called basic object (OB), which completes the comprehension of the event representing the fact. A basic object answers the questions: “who”, “when”, “how” and “where” of an object represents a fact. Each OB defines an axis of analysis, which may interest the decision maker. It provides additional details on a transaction object (Fact). Each object answering one of these questions is a potential dimension of the fact. In our case, the objects that answer these questions on the theme of COVID-19 are represented in Table 3. Based on these questions, we obtain six dimensions for COVID-19 which are: Patient, Geographical, Hospitalization, Tests, date and Staff. For each determined dimension, we detail in the following subsections its parameters.
Figure 8.
Fact COVID-19.
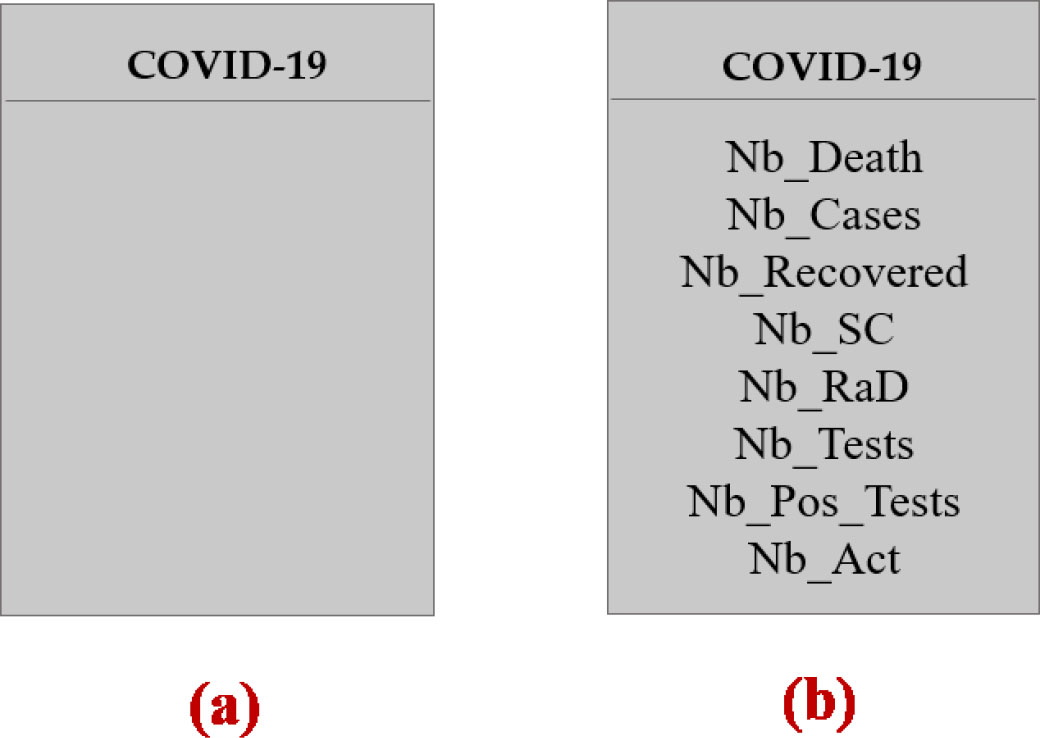
Table 3
Determination of dimensions from COVID-19
| Questions | Basic object |
|---|---|
| Who is suspected of COVID-19? | Patient |
| Where does the patient live? | Geographical |
| How to treat COVID-19? | Hospitalization tests |
| When COVID-19 detected? | Date |
| Who is responsible for the treatment of | Staff |
| COVID-19? |
Table 4
Attributes of patient dimensions
| Attributes name | Description | Type |
|---|---|---|
| Id_Patient | The id of the patient | Identifier |
| Type_Pat | Patient type which indicates whether the patient has COVID or a normal disease | Level 2 parameter |
| Gender | Patient gender (female or male) | Level 2 parameter |
| Age_Group | Age group of infected patients | Level 2 parameter |
| Age_Class | Age class of infected patients | Level 2 parameter |
| Notif_Date | Case notification date | Level 2 parameter |
Table 5
Attributes of geographical dimensions
| Attributes name | Description | Type |
|---|---|---|
| Dep_Num | The number of the department | Identifier |
| Desig_Dep | The designation of the department | Weak attribute |
| Region | The number of the region | Level 2 parameter |
| Desig_Region | The designation of the region | Weak attribute |
| Country | The country | Level 3 parameter |
Table 6
Attributes of date dimensions
| Attributes name | Description | Type |
|---|---|---|
| Id_Date | The id of the date | Identifier |
| Day | Day of the date | Level 2 parameter |
| Month | Month of the date | Level 3 parameter |
| Trimester | Number of the quarter of the date | Level 4 parameter |
| Week | Week number of date | Level 4 parameter |
| Semester | Number of the semester of the date | Level 5 parameter |
| Year | Year of date | Level 6 parameter |
Table 7
Attributes of hospitalization dimensions
| Attributes name | Description | Type |
|---|---|---|
| Hosp_Id | The id of the hospitalization | Identifier |
| Hosp_Type | The hospitalization type i.e. normal hospitalization, at home or in intensive care | Level 2 parameter |
| Service | The service of the hospitalization | Level 2 parameter |
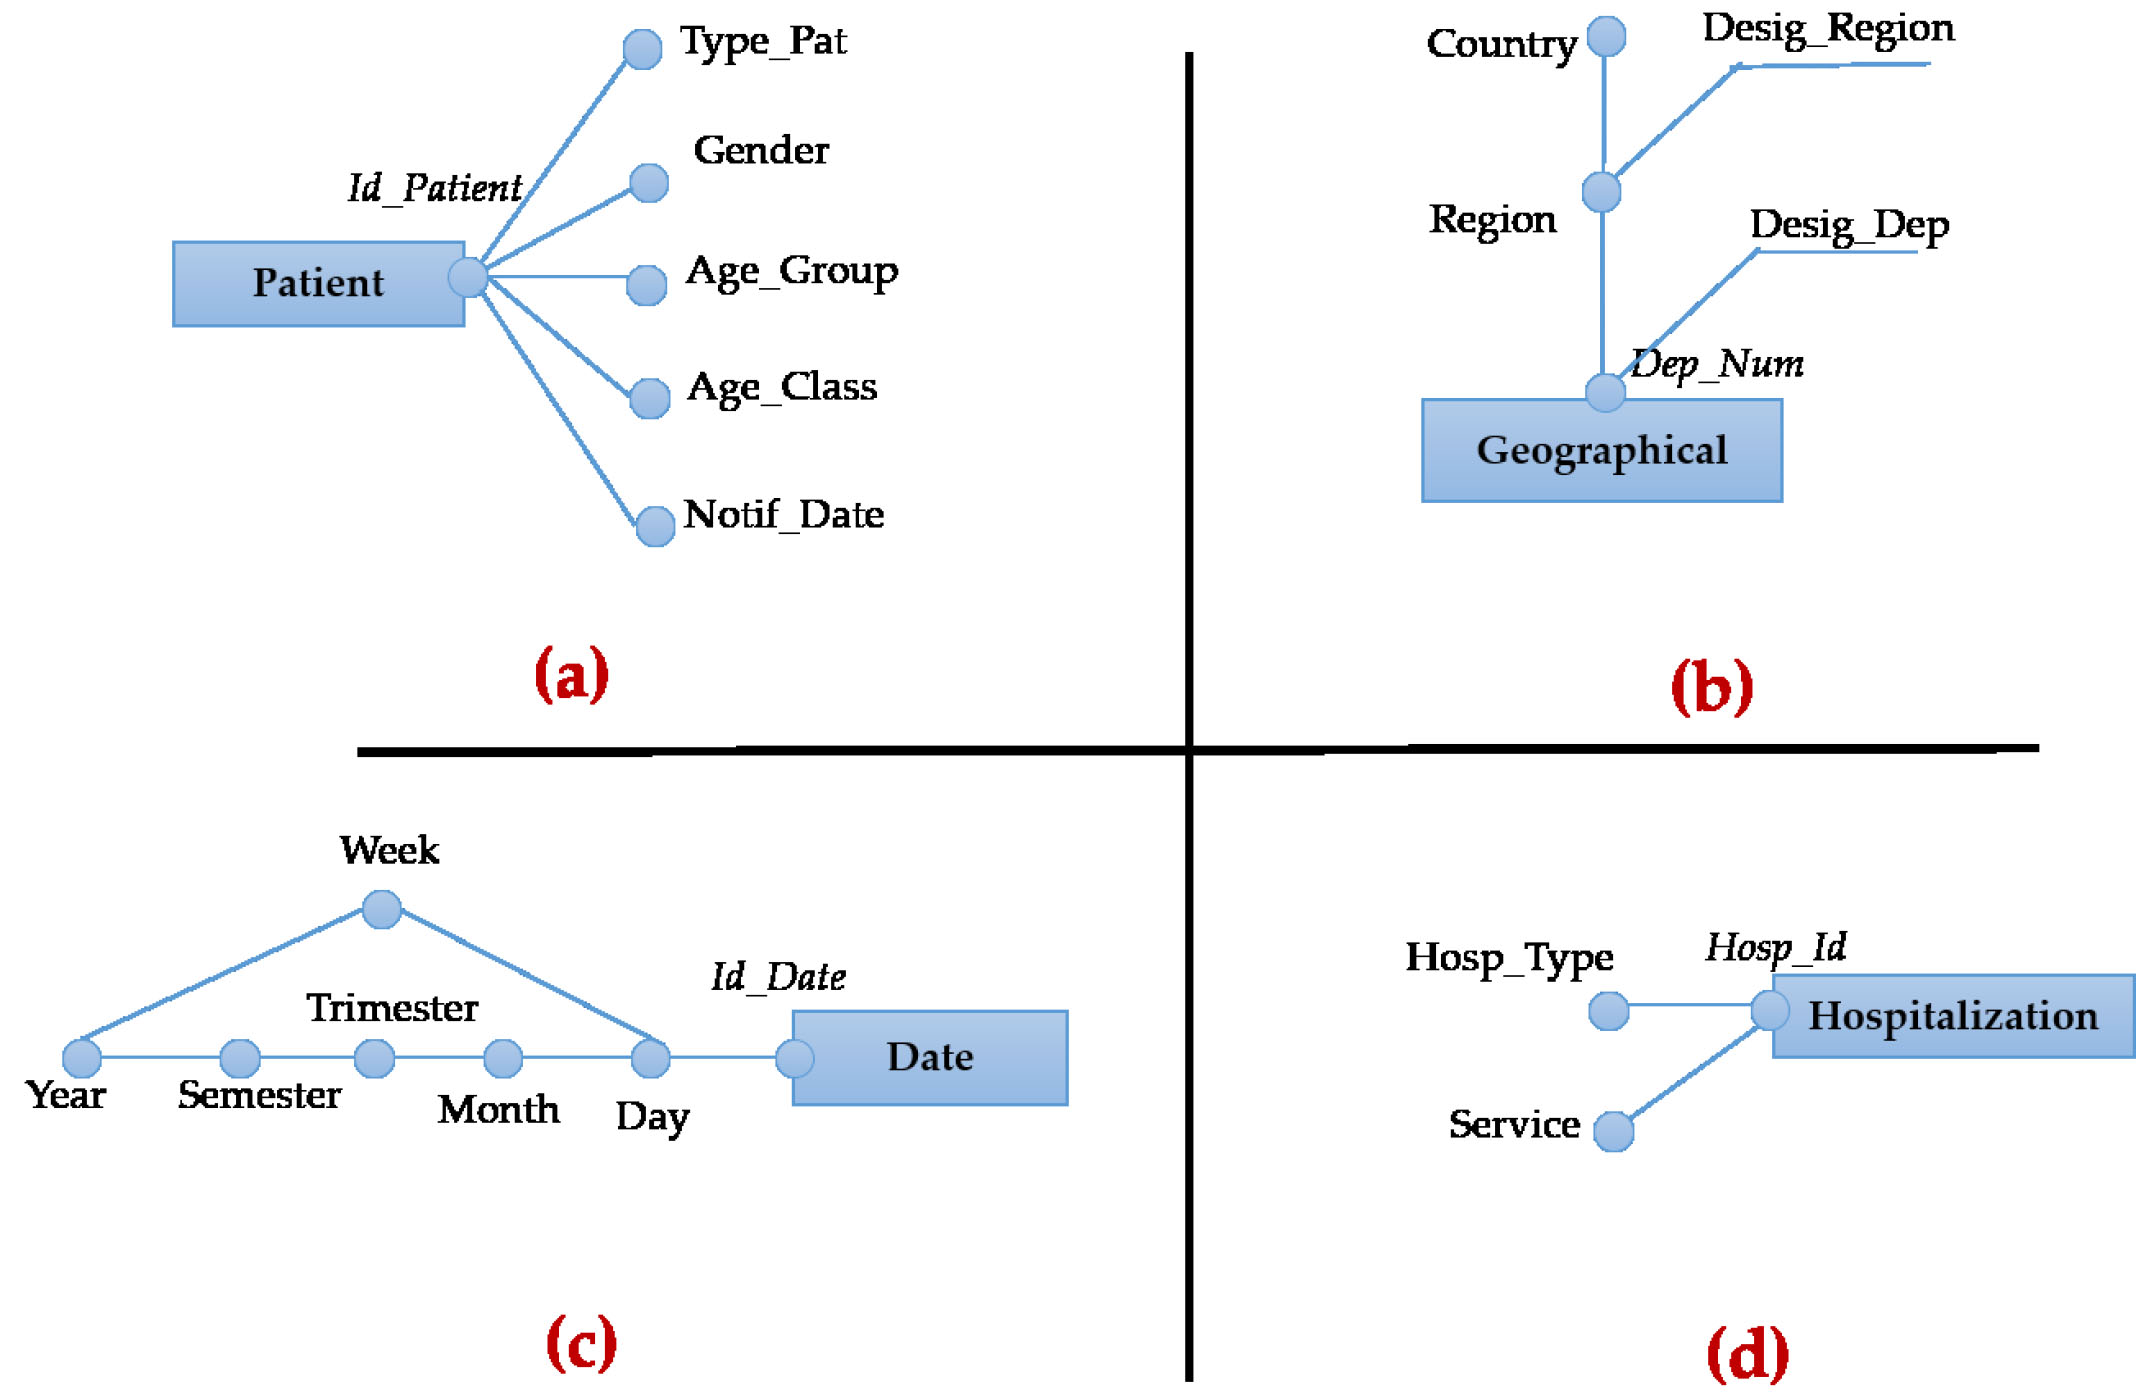
Figure 9.
Some dimensions of our COVID-19 data warehouse.
Each attribute not chosen as a measure can be a parameter for a dimension specially the categorical attributes.
Figure 10.
Data warehouse COVID-19 schema.
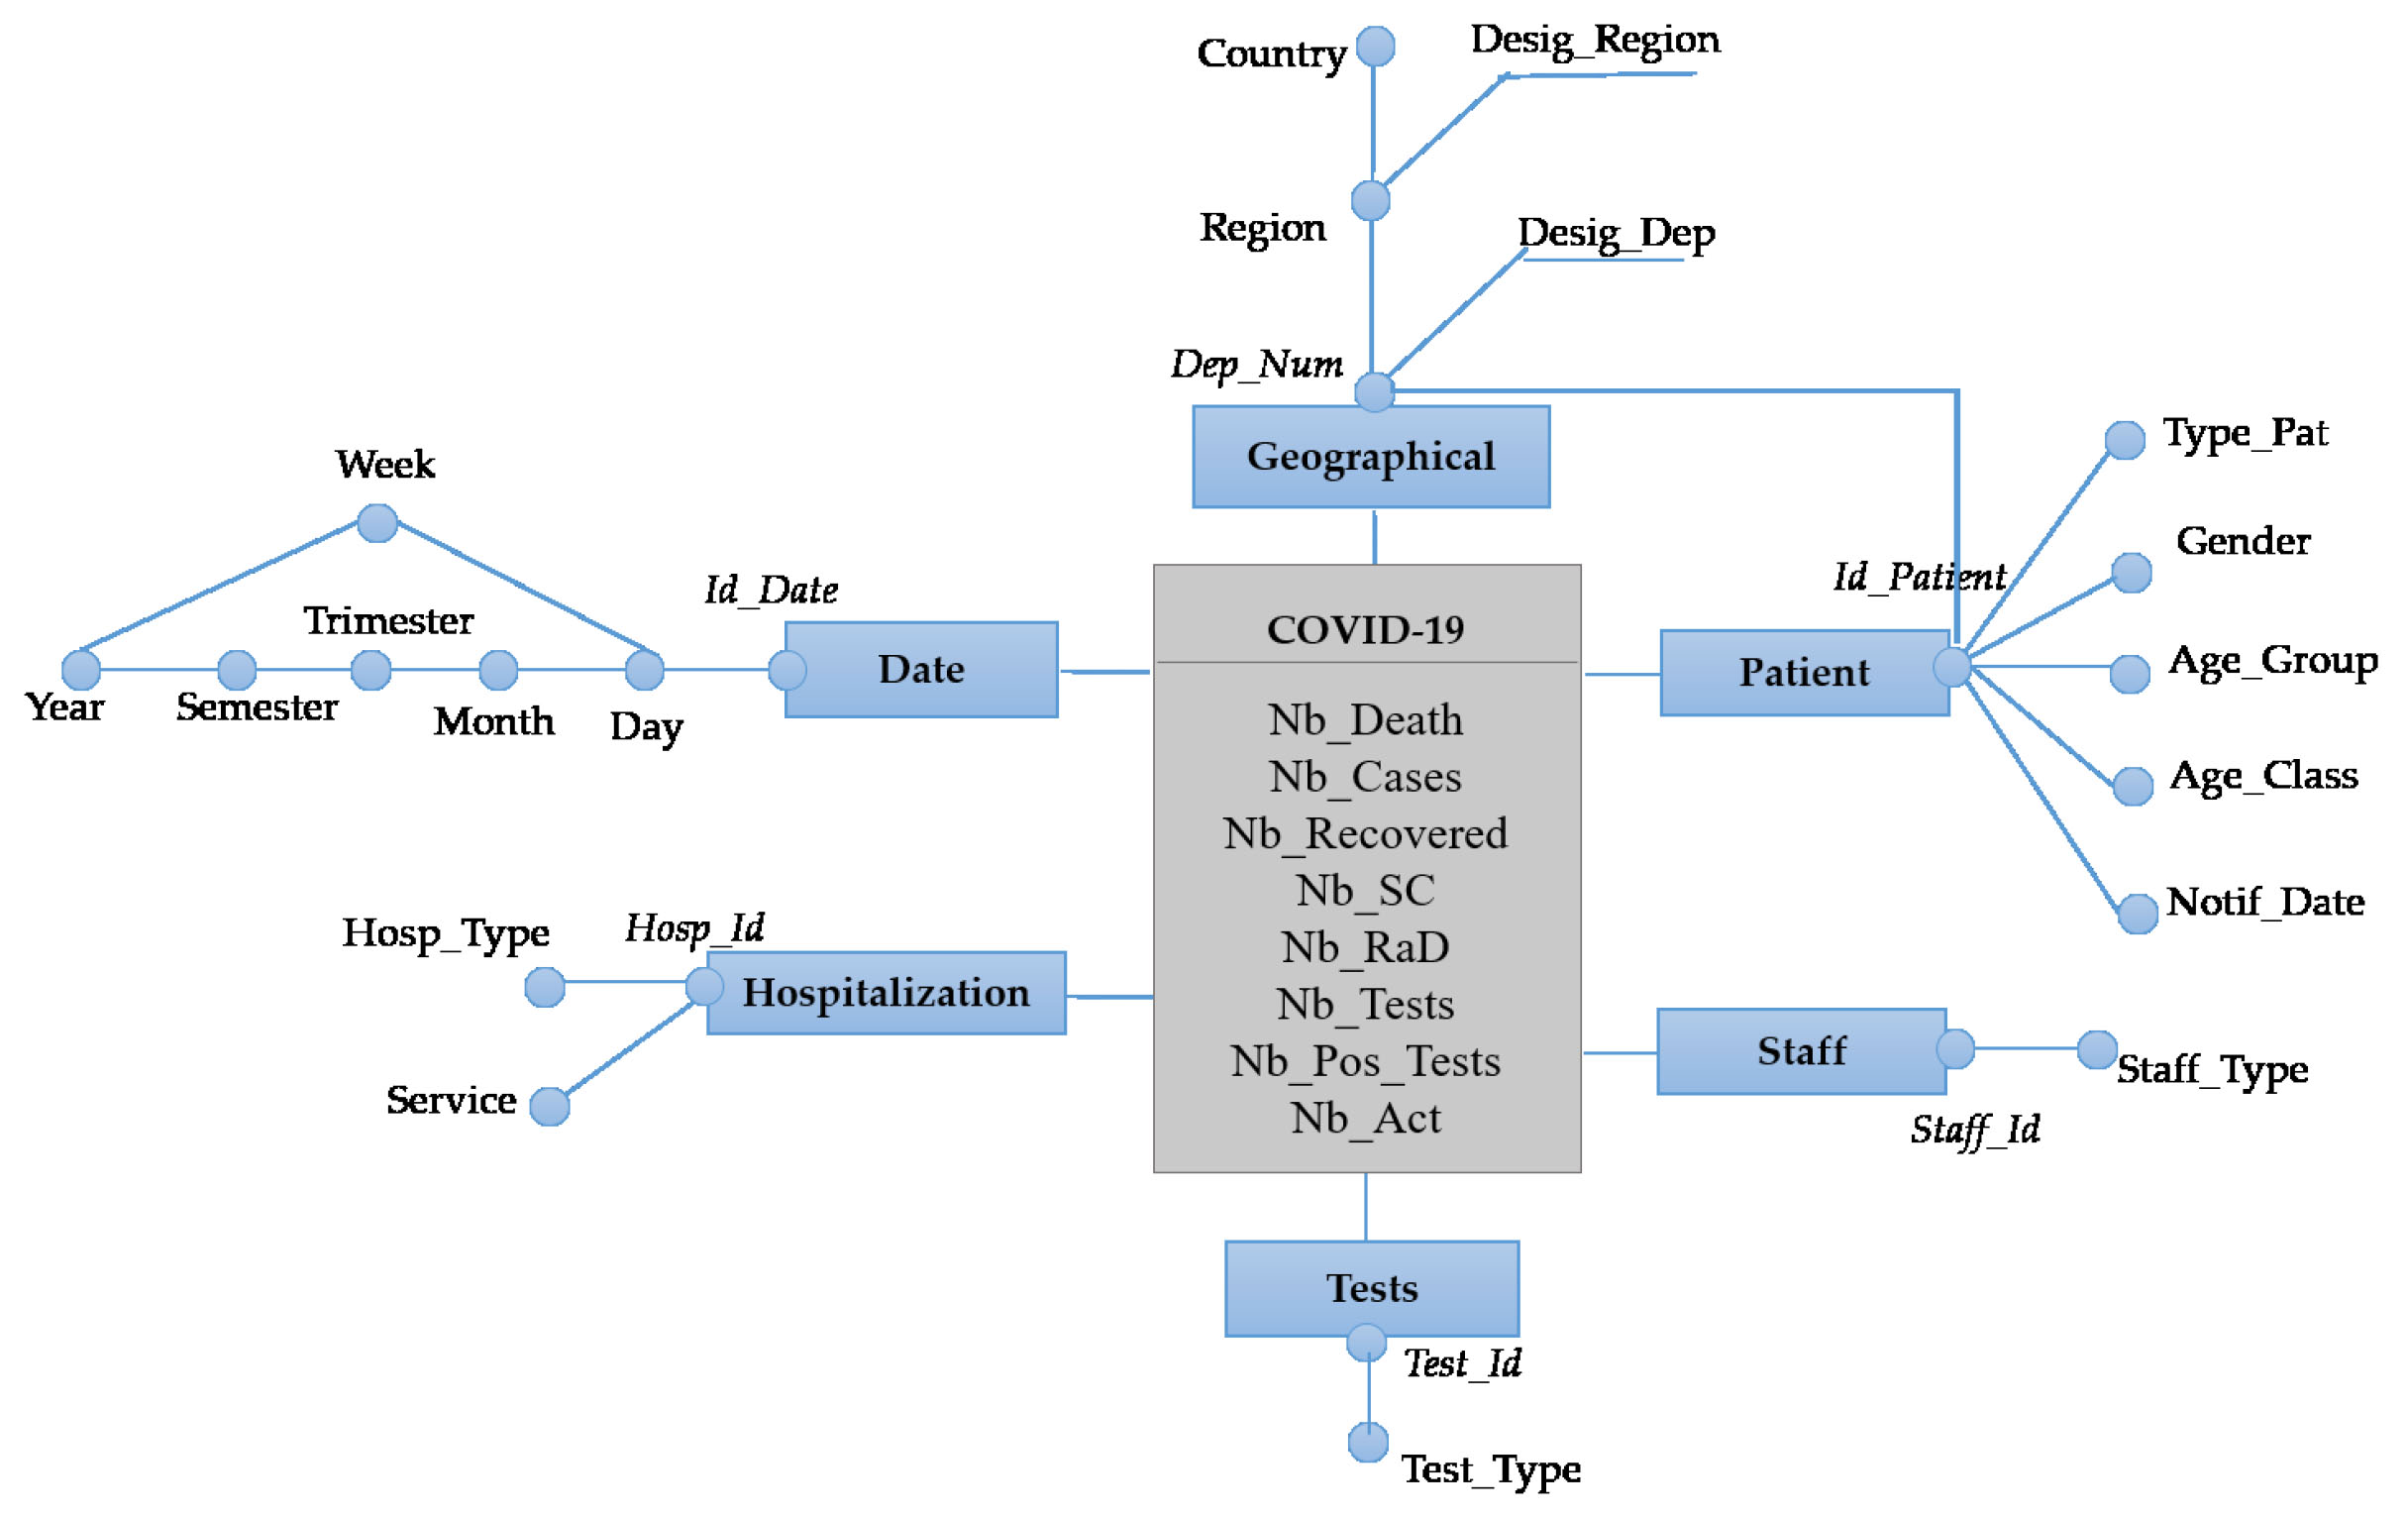
Figure 11.
Transformation of the data warehouse schema to a document-oriented model.
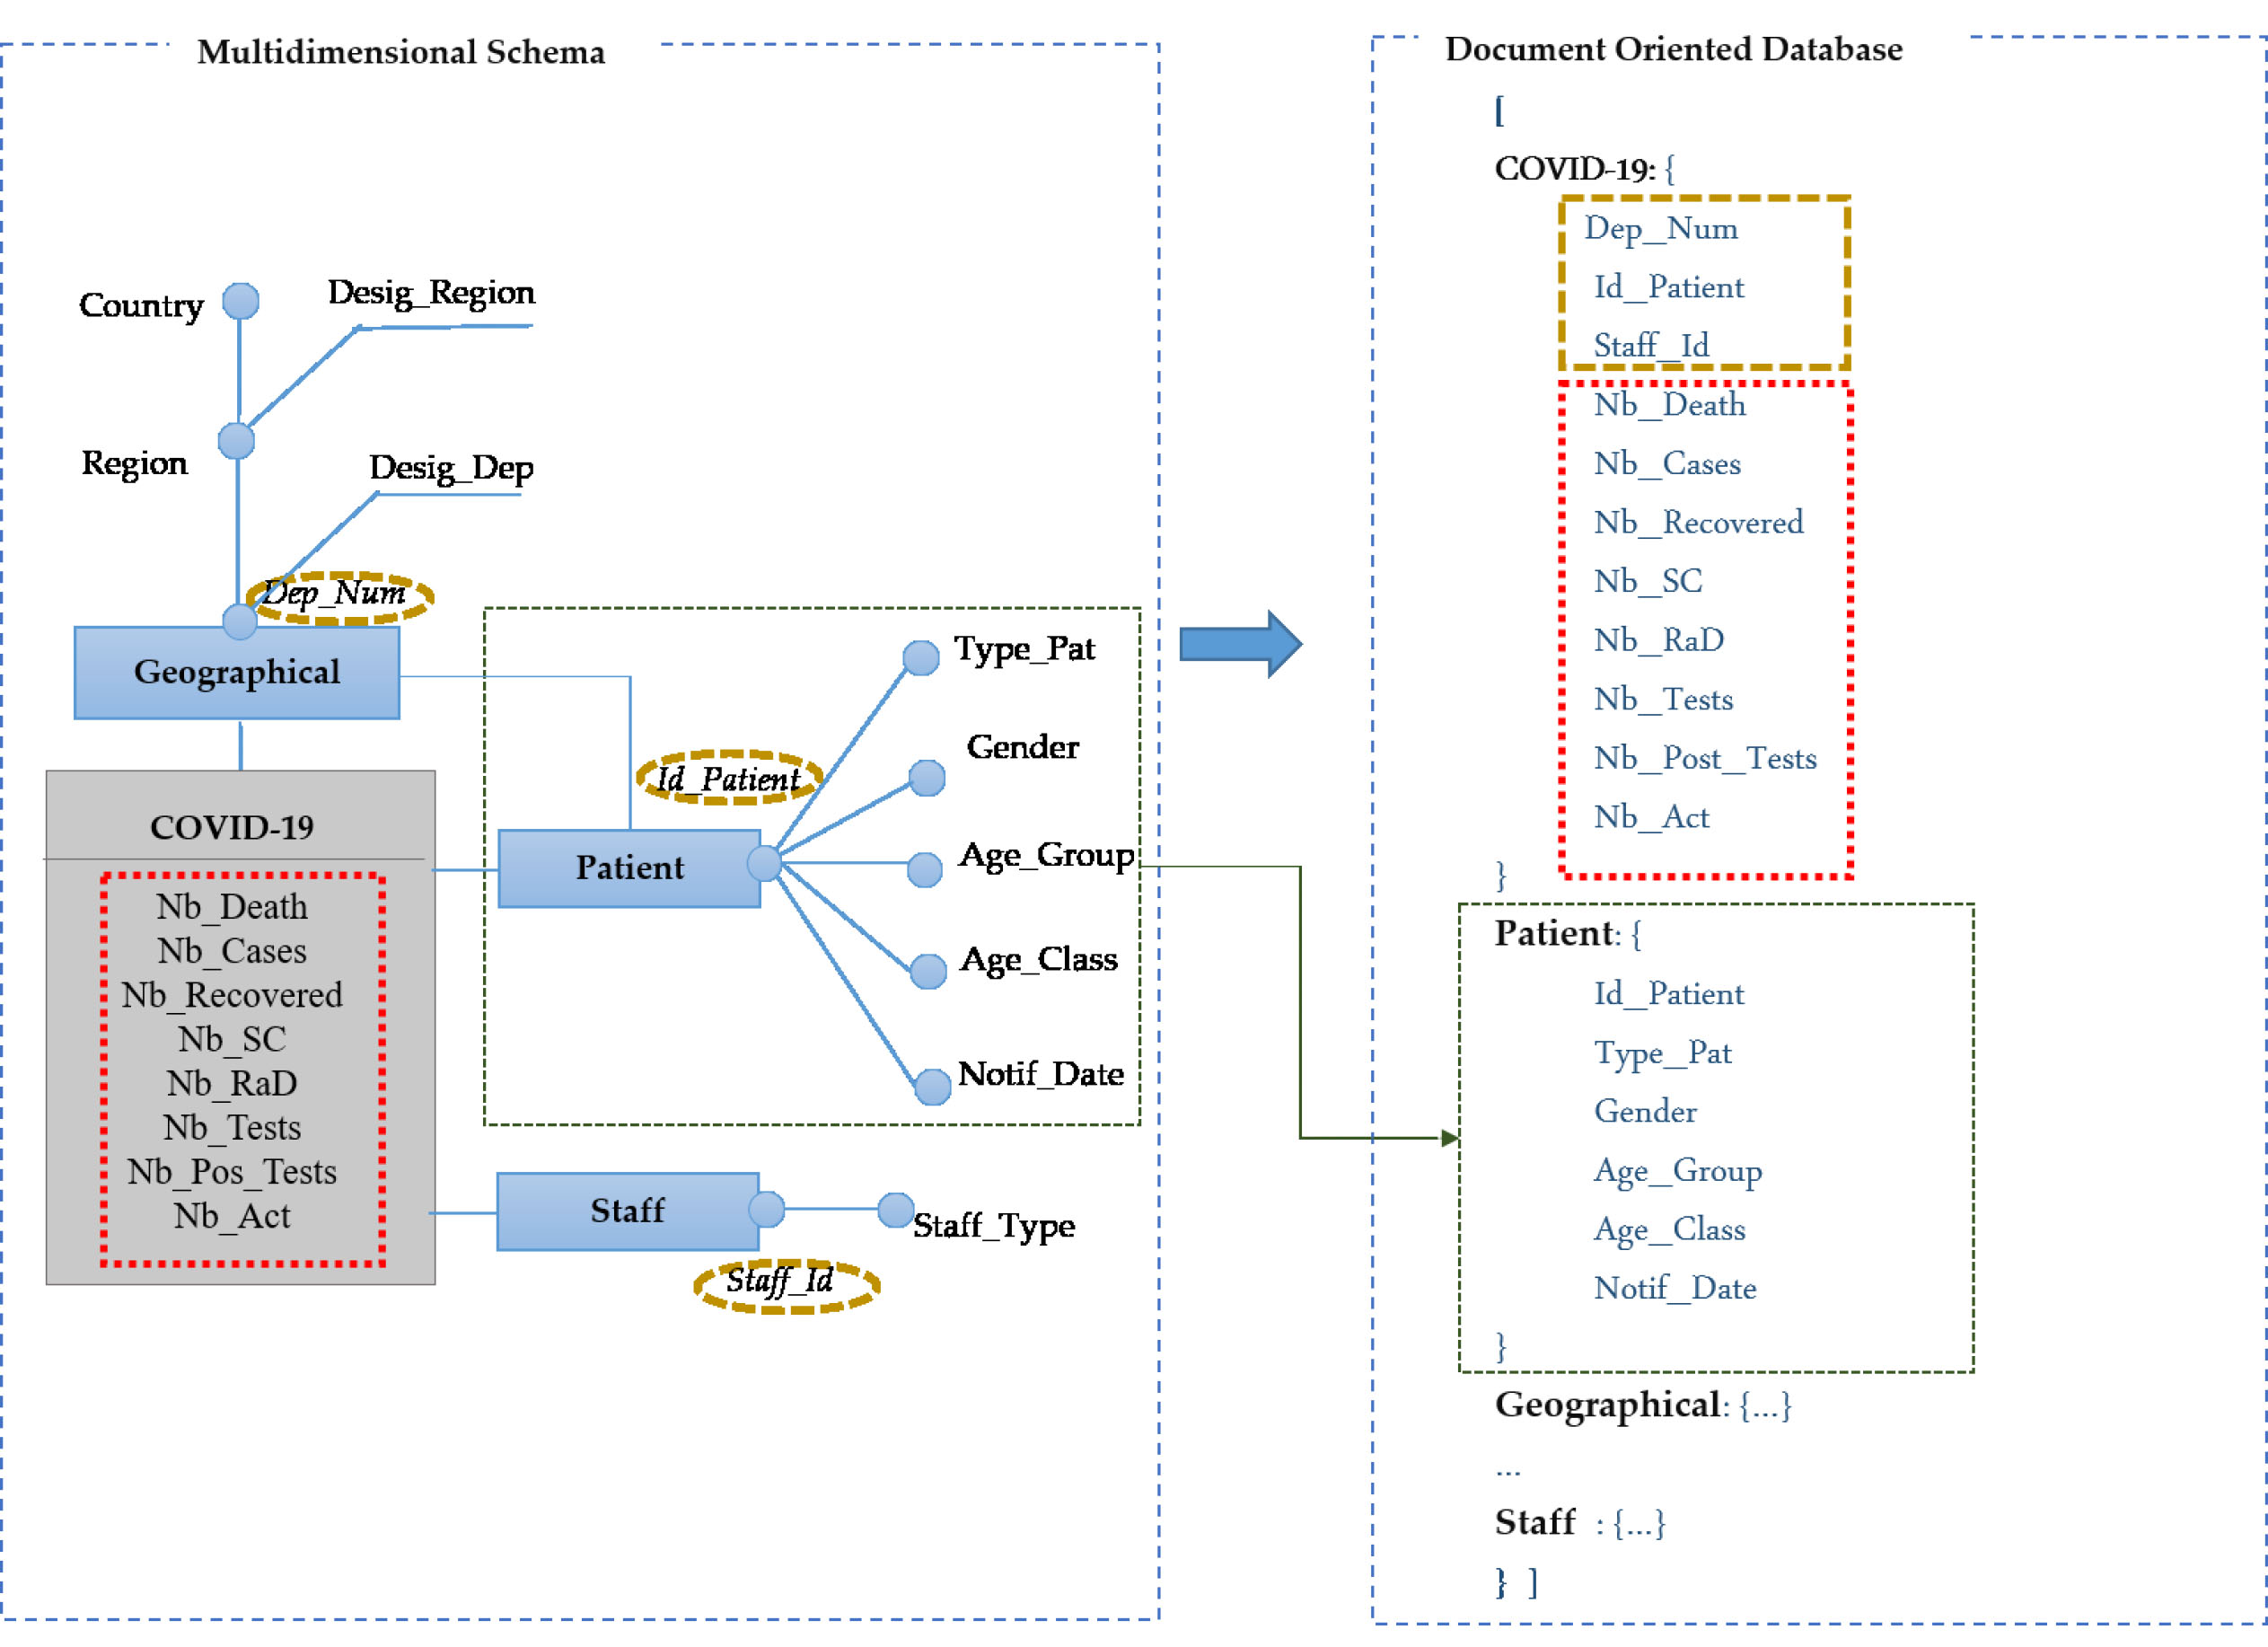
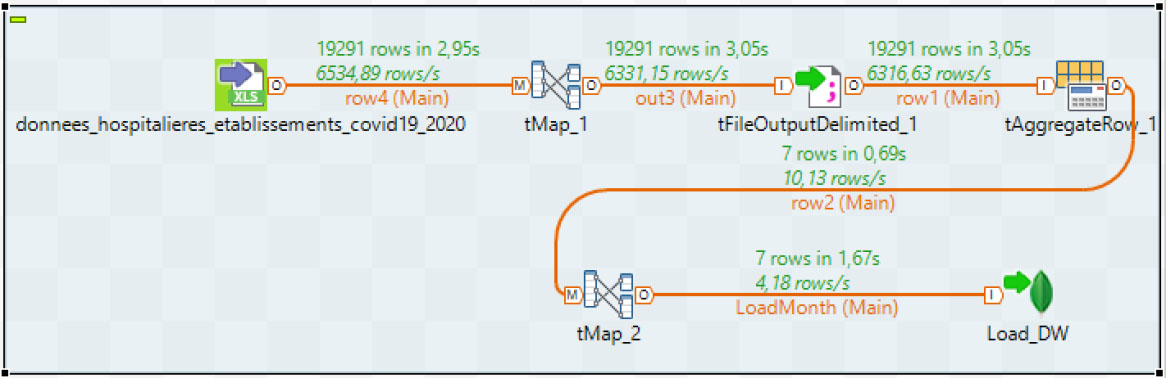
Figure 12.
Job to calculate the measures NB_cases for each date.
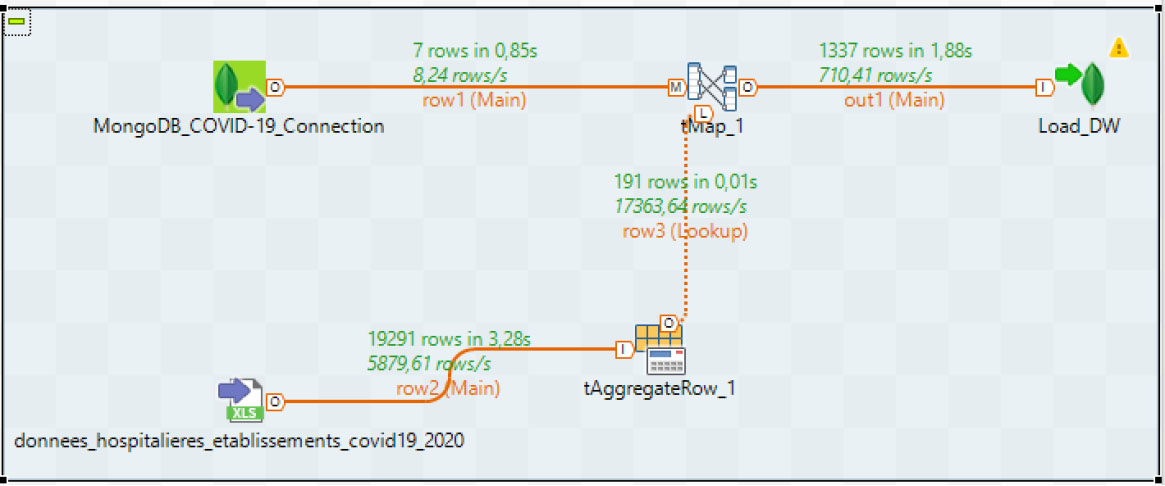
Figure 13.
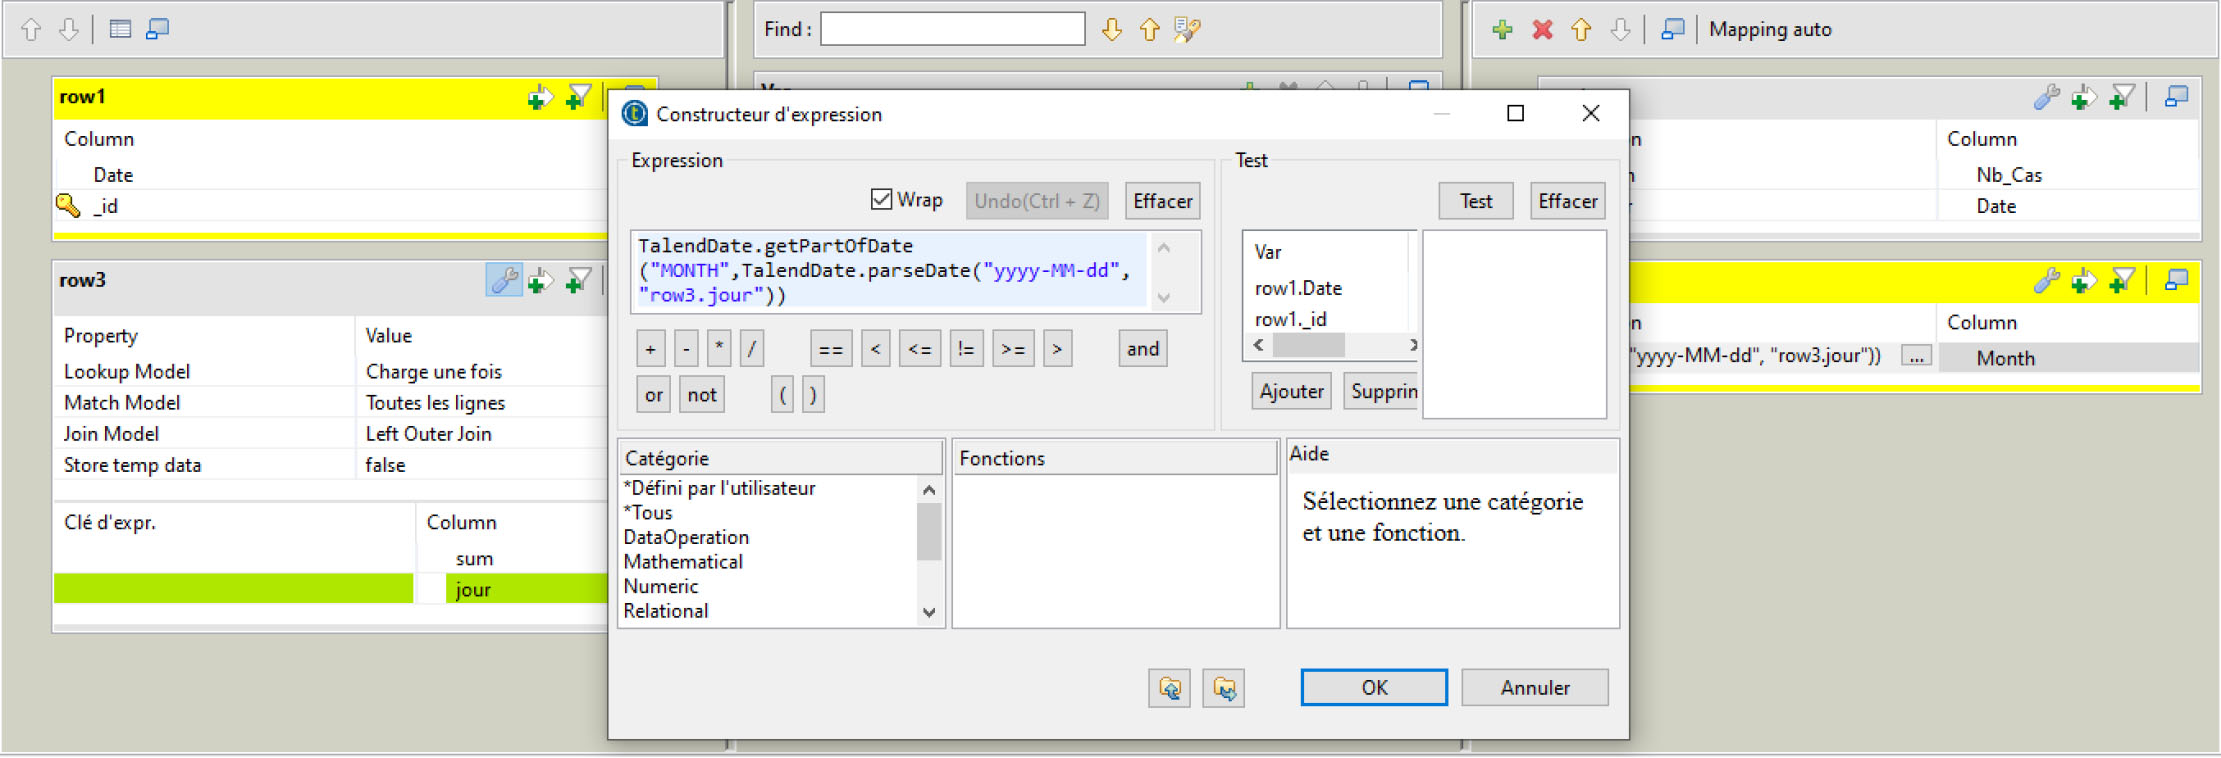
Expression which determines the Month.
6.2.1Determination patient dimension parameters
The patient information is given from Source2 (sexe and cl_age90) and Source3 (nb_test, nb_pos_test and clage_covid).
The Patient dimension is described by all of the information relating to a patient. So, we obtain five hierarchies (h-Type_Pat, h-Gender, h-Age_Group, h-Age_Class, h-Notif_Date). In fact, each attribute (other than identifier) represents a parameter in dimension. It should be noted that all hierarchies of the same dimension share the identifier as well as its weak attributes. Table 3 illustrates the set of attributes making up the Patient dimension (column 1), the description of each attribute (column 2) and the type of each attribute (column 3). The categorization of the concepts presented in the third column of Table 4 allows us to define the different hierarchy. Figure 9a illustrates the Patient dimension according to the DFM formalism [8].
6.2.2Determination geographical dimension parameters
All geographic information is disseminated from Source2. This information is: dep, reg, Numéro, Département, Région.
This dimension has three parameters (Dep_Num Region, Country) forming a single hierarchy and two weak attributes (Design_Dep, Design_Region). This hierarchy is also related to the Patient dimension. Table 5 illustrates the set of attributes making up the Geographical dimension. Figure 9b illustrates the Geographical dimension according to the DFM formalism [8].
6.2.3Determination date dimension parameters
The date is an information that is saved in each record of the data source. The date dimension is a mandatory dimension for analysis and interrogation. The definition of the granularity of the date dimension is based on the need of decision makers, i.e. according to which granularity leads its analyses. Table 6 shows all the set of attributes composing the date dimension. In our example, the analyses are done by Day, Month, Week, Quarter, Semester and Year. Figure 9c illustrates the date dimension according to the DFM formalism [8].
6.2.4Determination hospitalization dimension parameters
The Hospitalization information is saved in Source1 and Source2. From Source1, we used all fields of hospital data and from Source2 we use the following fields: hosp, rea, rad, incid_hosp, incid_rea, incid_rad.
The Hospitalization dimension has two hierarchies (h-Hosp_Type and h-Service). These two hierarchies have the same identifier (Hosp_Id). Table 7 illustrates the set of attributes making up the Hospitalization dimension. Figure 9d illustrates the Hospitalization dimension according to the DFM formalism [8].
6.3Data warehouse schema: Case of COVID-19
From the previous steps, we obtain the resulting data store schema (see Fig. 10). The structure of this schema is a graph centered on the concept of fact (COVID-19), which includes all the measures. The fact is related to the dimensions, each of them contain a node, which represents the identifier, and the other nodes designate the parameters, which make up the dimension.
With the designed data warehouse, many analysis are possible. Such as the correlation of many questions and the impact of the treatment on the volume of cases.
7.Transformation to logical model
The transformation from conceptual model to logical model starts by choosing the type of DBMS storage. In our case, we are oriented to NoSQL systems specially document-oriented databases since they are very flexible and can handle very large amounts of data and offer horizontal scalability.
For the implementation of a document-oriented NoSQL data warehouse, we choose MongoDB. Our choice is justified by the richness of its query language and its aggregation engine. Once the NoSQL DBMS has been successfully installed, it becomes possible to define the logical schema of the different data warehouse.
Knowing that, the transformation of multidimensional concepts to a document-oriented database are as follows:
• The data warehouse schema is transformed into a collection C.
• Each fact is transformed into a document
• Each measure is transformed into an attribute in
• Each dimension is transformed into a document in C.
Figure 11 depict the application of the proposed transformation.
Figure 14.
Job to calculate the measures NB_cases for each Month.
8.ETL process
We have chosen Talend Open Source for Big Data (TOS_BD) for the creation of our NoSQL DW. This tool allows as to extract data from large and heterogeneous data sources and integrate them into NoSQL DBMS. TOS_BD is based on the creation of a “job” to maintain the execution of the data process. The user can apply the various components of the palette to build the work on the design side and view the generated code. A Job is a graphical design, of one or more component connected together such as tFileInputDelimited (donnees_hospitalieres_etablisements_covid19_2020, ect.), tMap, tAggregateRow and tMongoDBput (Load DW). For example, Fig. 12 shows the calculation of the NB_cases measure by the date of the different establishments in France.
Figure 13 shows the expression used when calculating the cases for each month. Figure 14 shows the loading of the Nb_Cases measure of the month.
9.Conclusion
In the context of the health crisis linked to the COVID-19 pandemic and with the digital revolution at work in the health sector, we propose in this paper a new approach for creating a data warehouse from COVID-19 sources in order to allow the analysis of all consolidated and enriched health data, whatever the context – care or research. Our proposal consists of two phases: DW design and ETL phase. We have detailed in this paper the different stages of the DW design phase: Data source identification, Data collection and Design data warehouse Schema. These steps are intended to model the COVID-19 data warehouse. After that, we transform our data warehouse to the logical model. Finally, the ETL phase is realised under TOS_BD in order to create document oriented data warehouse. Future work includes the use of other transformation for the same NoSQL databases. This will make it possible to elaborate a rigorous comparison between the result of these different transformations and the same approach will be tested with others COVID-19 bases.
Notes
References
[1] | G. Agapito, C. Zucco and M. Cannataro, Covid-warehouse: A data warehouse of italian covid-19, pollution, and climate data, International Journal of Environmental Research and Public Health 17: (15) ((2020) ). |
[2] | S. Bouaziz, A. Nabli and F. Gargouri, Design a data warehouse schema from document-oriented database, in: 23rd International Conference on Knowledge-Based and Intelligent Information & Engineering Systems, Vol. 159, (2019) , pp. 221–230. |
[3] | S. Bouaziz, A. Nabli and F. Gargouri, Nosql big data warehouse: review and comparison, in: 20th International Conference on Intelligent Systems Design and Applications, December 12–15, (2020) . |
[4] | P. Castro, A. Matos, W. Heron, F. Lopes and G. Tonni, Covid19 and pregnancy: An overview, Revista Brasileira de Ginecologia e Obstetrícia/RBGO Gynecology and Obstetrics, 06 (2020) . |
[5] | A. Choudhury, Data warehousing and data mining are the latest data weapons to combat covid-19, April 07, (2020) . |
[6] | J. Ciganek, Design and implementation of open-data data warehouse, in: 6th International Conference on Advanced Control Circuits and Systems (ACCS) & 5th International Conference on New Paradigms in Electronics information Technology (PEIT), (2019) , pp. 185–190. |
[7] | K.A. ElDahshan, A.A. AlHabshy and G.E. Abutaleb, Data in the time of covid-19: A general methodology to select and secure a nosql dbms for medical data, PeerJ Computer Science 6: (Sep (2020) ), e297. |
[8] | M. Golfarelli, D. Maio and S. Rizzi, The dimensional fact model: A conceptual model for data warehouses, International Journal of Cooperative Information Systems 7: (06 (1998) ), 215–247. |
[9] | J. Kachaoui, J. Larioui and A. Belangour, Towards an ontology proposal model in data lake for real-time covid-19 cases prevention, International Journal of Online and Biomedical Engineering (iJOE) 16: (08 (2020) ), 123. |
[10] | E. Khashan, A. Eldesouky, M. Fadel and S. Elghamrawy, A big data based framework for executing complex query over covid-19 datasets (covid-qf), 05 (2020) . |
[11] | B. Krishna, Impact of covid-19 on data warehouse architecture (2020), matrixcare. |
[12] | L. Lin and Z. Hou, Combat covid-19 with artificial intelligence and big data, Journal of travel medicine, 05 (2020) . |
[13] | W.A. Mattingly, Considerations for a covid-19 research data warehouse in the time of covid, The University of Louisville Journal of Respiratory Infections 4: ((2020) ). |
[14] | I. Oditis, Z. Bicevska, J. Bicevskis and G. Karnitis, Implementation of nosql-based data warehouses, Baltic Journal of Modern Computing 6: (01 (2018) ). |
[15] | S. Priya, A. Rajasi, D. Shreya, K. Swapnil and B. Kiran, Covid-19 database management: A non-relational approach (nosql and xml), Intelligent Data Communication Technologies and Internet of Things (40) ((2021) ). |
[16] | J. Teixeira da Silva, P. Tsigaris and A. Erfanmanesh, Publishing volumes in major databases related to covid-19, Scientometrics 126: (01 (2021) ), 831–842. |


