
COVID-19 detection using cough sound analysis and deep learning algorithms
Abstract
Reliable and rapid non-invasive testing has become essential for COVID-19 diagnosis and tracking statistics. Recent studies motivate the use of modern machine learning (ML) and deep learning (DL) tools that utilize features of coughing sounds for COVID-19 diagnosis. In this paper, we describe system designs that we developed for COVID-19 cough detection with the long-term objective of embedding them in a testing device. More specifically, we use log-mel spectrogram features extracted from the coughing audio signal and design a series of customized deep learning algorithms to develop fast and automated diagnosis tools for COVID-19 detection. We first explore the use of a deep neural network with fully connected layers. Additionally, we investigate prospects of efficient implementation by examining the impact on the detection performance by pruning the fully connected neural network based on the Lottery Ticket Hypothesis (LTH) optimization process. In general, pruned neural networks have been shown to provide similar performance gains to that of unpruned networks with reduced computational complexity in a variety of signal processing applications. Finally, we investigate the use of convolutional neural network architectures and in particular the VGG-13 architecture which we tune specifically for this application. Our results show that a unique ensembling of the VGG-13 architecture trained using a combination of binary cross entropy and focal losses with data augmentation significantly outperforms the fully connected networks and other recently proposed baselines on the DiCOVA 2021 COVID-19 cough audio dataset. Our customized VGG-13 model achieves an average validation AUROC of 82.23% and a test AUROC of 78.3% at a sensitivity of 80.49%.
1.Introduction
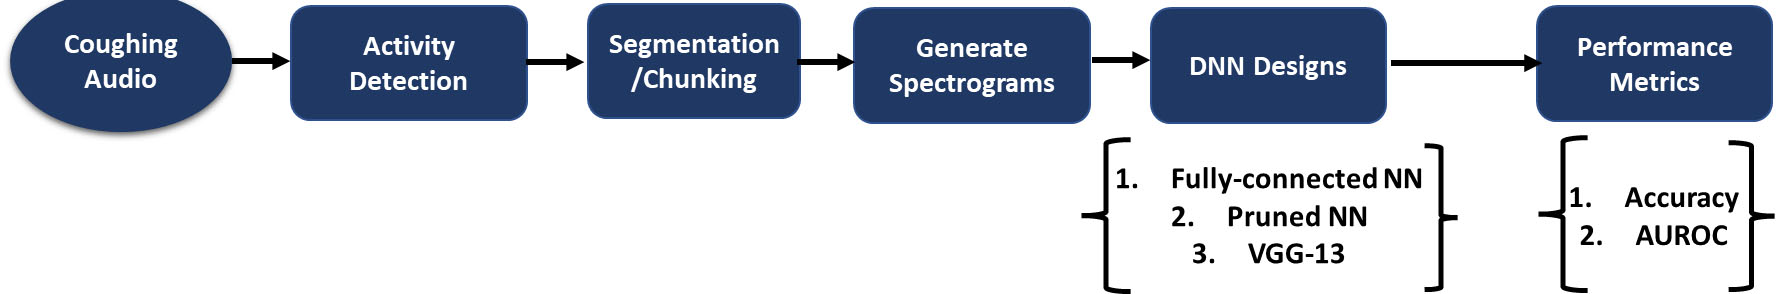
Figure 1.
A block diagram depicting an overview of the system used for COVID-19 detection using cough samples. The system uses a unique combination of cross entropy and focal loss functions which yield improved performance with COVID-19 audio.
With the outbreak of the COVID-19 pandemic caused by the coronavirus SARS-CoV-2, the severity of the infection and the associated fatality rates around the world are increasing at an alarming rate [1]. Although reverse transcriptase-polymerase chain reaction (RT-PCR) testing is generally adopted, coughing sounds have been found to reveal useful signatures pertaining to COVID-19 which can be used to facilitate rapid, noninvasive, and reliable screening methodologies [2]. Consequently, spectral and waveform signatures from coughing patterns associated with the disease are being considered as biomarkers for prognosis. In this context, there are several initiatives towards enabling open research on COVID-19 detection from coughing sounds. For example, the authors of [3] curated the Coswara dataset consisting of cough samples collected from subjects who either tested positive or negative for COVID-19. Similarly, the COUGHVID dataset described in [4] is comprised of crowd-sourced cough samples collected from COVID-19 positive and negative patients across a wide range of demographic backgrounds. These efforts naturally pave way to the development of diagnosis tools powered by machine learning (ML) and deep learning (DL) for detecting COVID-19 from cough sounds. Although ML has been extensively applied for a variety of speech and audio processing applications [5, 6, 7, 8, 9, 10, 11, 12], there have been new studies [13, 14, 15, 16, 17, 18, 19, 20, 21, 22, 23, 24, 25] that specifically address audio analysis for COVID-19. Applications of these studies range from implementation of COVID-19 audio detection software for individual use to widespread pandemic monitoring across communities and cities. The authors of [18] gathered audio samples of coughing and breathing through the “COVID-19 Sounds” app and demonstrated the feasibility of using ML based tools for COVID-19 diagnosis. In [23], it was shown that biomarkers originally developed for Alzheimer’s disease characterization could be repurposed for designing COVID-19 detectors. Similarly, the authors of [24] identified a novel set of biomarkers from coughs of COVID-19 patients and utilized deep neural networks to design predictive models. The majority of these studies utilize deep neural networks (DNNs) for classification in lieu of conventional ML algorithms owing to the need for accurately characterizing the complex decision boundaries between spectral signatures of COVID-19 positive and negative subjects.
Given the complex nature of coughing audio spectral signatures, there is a need to systematically develop architectural designs [29] that can effectively leverage the audio features for accurate detection (Fig. 1). To this end, in this paper, we describe DL system designs that we developed to classify cough samples from the DiCOVA 2021 dataset [3] into two categories, namely: healthy (COVID-19 negative) and unhealthy (COVID-19 positive). We begin by investigating the use of a DNN with fully connected layers for cough detection. With an intent to import such DNN models for COVID-19 cough detection on mobile and edge-devices, we prune the neural network based on the Lottery Ticket Hypothesis (LTH) [28] optimization process. Pruned neural networks have been explored for various applications in energy, signal, and image processing [26, 27, 28] and have shown to provide similar performance gains with unpruned networks yet yield computationally efficient implementations. Finally, we investigate the impact of convolutional neural network (CNNs) architectures, in particular VGG-13 [30] for detection. Interestingly, based on extensive empirical analyses, we find that a unique ensembling of the VGG-13 architecture trained using a combination of binary cross entropy and focal losses [39] with minority class oversampling (COVID-19 positive) and data augmentation (addition of samples from an auxiliary dataset) significantly outperforms the fully connected networks and other recently proposed baselines on the DiCOVA 2021 COVID-19 cough audio dataset. Our proposed convolutional model achieves an average validation AUROC of 82.23% and a test AUROC of 78.3% at a sensitivity of 80.49% evidencing the efficacy of the proposed approach for COVID-19 cough detection.
The rest of the paper is organized as follows: We first describe the related work in this area of research in Section 3 followed by pre-processing and feature extraction strategies adopted in our work in Section 4. We then describe in detail the design methodologies adopted beginning from a general fully connected DNN (Section 5), pruned networks based on LTH (Section 6) followed by the proposed, customized VGG-13 architecture for cough detection (Section 7). We also describe our approaches to handle imbalanced data by a) using up-sampling, b) modifying the loss function and c) employing ensemble strategies. We discuss our findings and inferences in Section 8, and we close with concluding remarks in Section 9.
2.Related work
Diagnosis of COVID-19 by cough sound analysis is plausible due to the fact that the coughing patterns are reflective of the physical alterations to the lungs and diaphragm [32, 33] which are predominantly targeted by the virus. As a result, there have been several efforts [2, 3, 4, 18, 22, 34, 35, 36] for detecting signatures of COVID-19 from cough samples using ML tools. Brown et al. [18] used ML based algorithms to distinguish between healthy and COVID-19 cough sounds using crowdsourced data. The authors gathered data using their own “COVID-19 Sounds” web and Android app where 141 COVID-19 samples and 350 healthy samples were selected for training. Classical audio features including root mean square energy (RMSE), mel-frequency cepstral coefficients (MFCCs) and spectral centroids were used for training logistic regression/support vector machines (SVMs) classifier models. The authors report an average AUROC metric of 80% for the different tasks reported in their study. Subsequent to this effort, the Coswara project [3] compiled a crowdsourced dataset containing a variety of sounds including sustained phonations, counting, coughs and breathing patterns. Also, multiple types of coughs and breathing sounds were collected from the users. The Coswara project was one of the first publicly available COVID-19 audio datasets and remains unique in its wide variety of sounds collected. Utilizing classical features such as MFCCs [37, 38], spectral centroid and mean square energy to train a random forest classifier for the sound classification task, the authors report a test accuracy of 66%. More recently, Imran et al. [2] developed tools that utilize CNNs trained with mel spectrograms for cough detection followed by model ensembling to determine whether or not the sample belonged to a COVID-19 patient. In this study, the authors gathered cough samples from patients diagnosed with COVID-19, bronchitis, and pertussis. 48 COVID-19, 102 bronchitis, 131 pertussis, and 76 healthy samples were used in order to train their algorithm. The algorithm consisted of three separate classifiers, namely, a deep learning-based multi class classifier, classical ML based multi class classifier, and deep learning-based binary class classifier. The authors report accuracies of 93.56%, 94.06%, and 88.89% for these classifiers, respectively. They also developed an app, “AI4COVID-19”, in order to allow users to interface with their AI-based COVID-19 detection algorithm. A recent study [27] by MIT’s Open Voice Team has further validated the practicality of detecting COVID-19 using cough samples powered by deep neural networks and have reported significantly higher sensitivity and specificity metrics. Their model was trained and verified using 2,600 COVID-19 positive audio samples and 2,600 COVID-19 negative audio samples. The authors extract MFCC features which are then passed through a CNN architecture built upon the designs in [39, 40]. At a sensitivity of 98.5% and a specificity of 94.2%, the authors achieved and AUROC metric of 97%. Similarly, the authors from the Virufy consortium [41] have employed an ensemble of three neural networks trained on mel-spectrograms of cough audio to perform the detection. The algorithm is reported to predict COVID-19 infection with an AUROC of 77.1% which further motivates the use of deep neural network models for carefully discriminating between the types of cough sounds. In our previous work [22], we use an ensemble of four deep models namely CNNs, Recurrent Neural Networks (RNNs), Gated CNNs (GCNNs), Gated Convolutional Recurrent (GCRNNs) for COVID-19 cough detection on the DiCOVA 2021 dataset. However, the average validation accuracy obtained using the stacked approach was only 65%. In this paper however, we find that in addition to model ensembling or fusion strategies, the careful choice of loss functions and meaningful data augmentations was critical in improving the overall generalization performance (improved accuracies and AUROC scores on the validation folds and the blind test dataset) of the VGG-13 convolutional architecture under limited data scenarios.
3.Pre-processing and feature extraction
3.1Description of the DiCOVA dataset
The DiCOVA Challenge [46] was designed to find scientific and engineering insights on COVID-19 by analyzing acoustic cues gathered from COVID-19 positive and non-COVID-19 individuals. The goal is to use cough sound recordings from COVID-19 and non-COVID-19 individuals for the task of COVID-19 detection. The train dataset contains a total of
3.2Silence removal and downsampling
We first perform silence removal on the given cough audio files. If the duration of silence was greater than 500 ms, we split the audio wave file at that corresponding instance. Similarly, if the amplitude of the wave files was less than
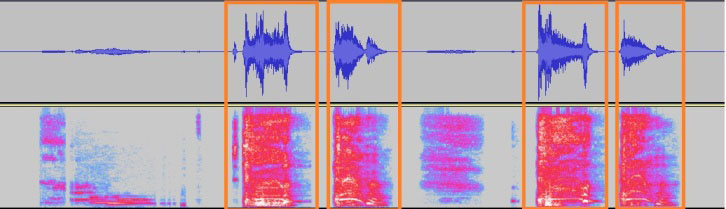
Figure 2.
A sample audio file split into 1 s segments with silence removed. The corresponding spectrograms are passed to the neural network.
3.3Feature extraction
We transform the pre-processed wave files into the spectral logmel scale. Log-mel features are a popular choice for classification using neural networks as they benefit from the additional information such as rich temporal and spectral structure of the original signal. These wave files are chunked into excerpts of duration
Table 1
Parameters used to obtain the log-mel spectrogram
| Parameter | Configuration |
|---|---|
| Sample rate | 32000 Hz |
| Window size | 512 |
| Hop size | 256 |
| Mel bands | 64 |
3.4Experimentation with additional features
Prior to choosing the log-mel spectrogram, we investigated the use of classical features [42] such as the frame level MFCCs with the delta and delta-delta co-efficients, RMS energy, Spectral Centroid (SC), Spectral Roll-off (SR), Spectral-Bandwidth (SB) and the Zero-Crossing Rate (ZCR) in classifying the cough sounds as either belonging to a COVID-19 positive or a healthy patient. In particular, we concatenated these statistical features and utilized an XGBoost [58] model to perform the classification. However, we found that despite using sophisticated model selection strategies, namely 5-fold cross validation and hyperparameter tuning, the generalization even to the validation data was not sufficient. We found that the model predicted almost all of the COVID-19 positive samples as belonging to the healthy class. We also observed that the other classification metrics (AUROC, Specificity) was found to be 55% and 40% respectively which naturally motivated the choice for a more powerful feature extractor. We observed similar performances with the use of a feed-forward neural network when trained with these features. Studies in [31] show that the log-mel spectrograms outperform traditional representations such as MFCCs for deep neural network architectures. In the following section we describe the use of a fully connected neural network for COVID-19 cough detection where the NN is trained using the log-mel spectrograms.
Figure 3.
A figure depicting a pruned neural network using the Lottery Ticket Hypothesis.
4.Detectors based on fully connected neural networks
In this paper, we consider the COVID-19 cough detection as a supervised learning task. For the fully connected neural network, consider a dataset
(1)
(2)
where
(3)
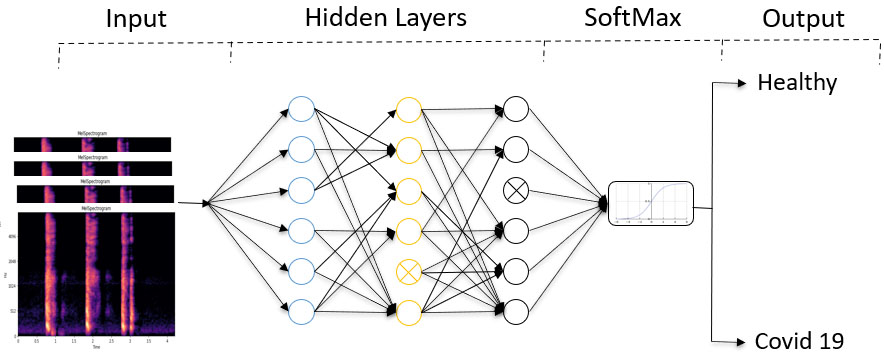
Weights of each neuron are trained/updated using a scaled gradient backpropagation algorithm. Each layer is assigned a tanh (hyperbolic tangent) activation function. From our experiments, we find that the tanh activation function provided the best accuracy. The output layer uses the SoftMax activation function to categorize the type of cough in the given dataset. We utilize the given train and validation splits of the DiCOVA dataset to train and evaluate the model. Using a fully connected neural network, we observed an average accuracy of
5.Pruned neural networks using lottery ticket hypothesis
Pruned NNs on embedded hardware significantly provides computational efficiencies and reduce memory requirements with only with slight reduction in accuracy in comparison with the unpruned networks. A popular strategy to prune NN is based upon the Lottery Ticket Hypothesis [28]. It is based upon the idea that a randomly initialized, dense network contains a subnetwork initialized such that when trained in isolation it can match the test accuracy of the original network after training for at most the same number of iterations. Consider a fully connected NN with N neurons in each layer initialized by weight matrices
• Randomly initialize a neural network
• Train the network for
• Prune
• Reset the weights of the remaining portion of the network to their values in
• Let
For the network pruning experiments, we consider NNs with four hidden layers each with N
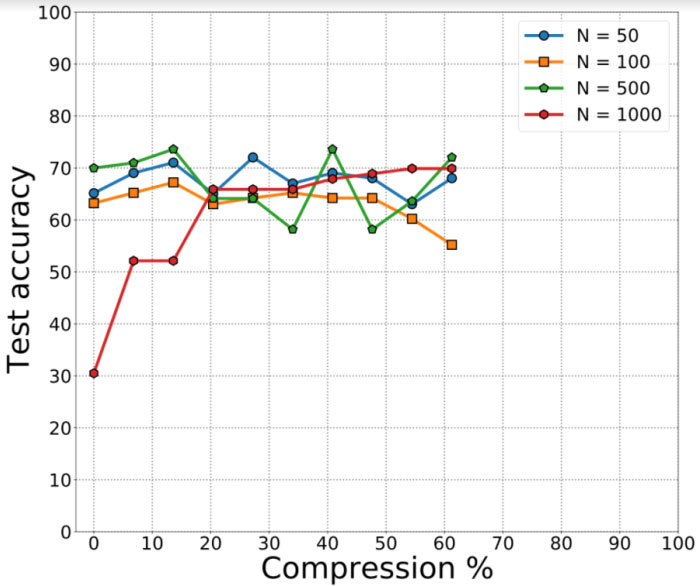
Figure 4.
Results depicting pruned neural networks for covid audio classification. The pruning across the dataset degrades the performance of the classification task.
6.Customizing the VGG-13 architecture
We utilize a VGG-13 [30] architecture to train and evaluate performance over the different training and validation splits in the DiCOVA 21 challenge dataset. The VGG architecture has been successfully used for image recognition and audio classification audio classification applications [59, 60]. VGG-13 consists of multiple convolutional blocks followed by a fully connected network to make the final predictions. Each convolutional block consists of two convolutional layers followed by a max pooling layer that halves each of the spatial dimensions. Every convolution layer is followed by a ReLU activation function and batch normalization [43] which is a form of regularization to tackle internal covariate shifts. After the convolutional blocks, the resulting feature maps are averaged pooled and fed as inputs to a feed forward neural network. Finally, a SoftMax layer is used to generate the predictions. The size of the spectrogram that is used as input to the VGG network is 128
Figure 5.
The overview of the model used for COVID-19 detection using VGG-13. Each VGG-13 model is trained with combined cross entropy loss and focal loss. The final results are obtained after integrating the two models.
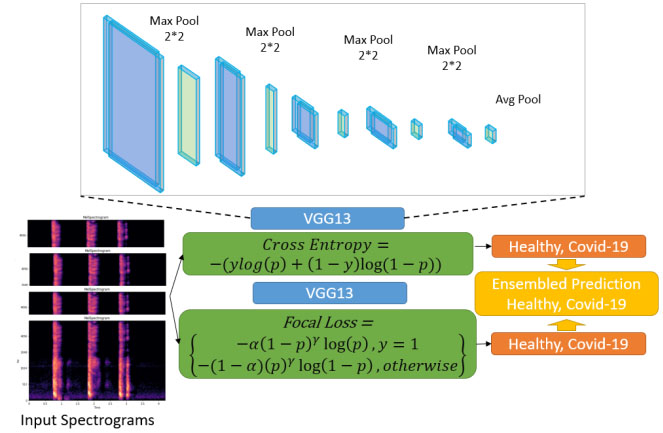
Due to the imbalance in the DiCOVA dataset across the healthy and COVID-19 positive classes, through extensive empirical studies, we find model ensembling and data augmentation strategies to improve model generalization. The term ensembling here implies the use of the best two models for each loss function. We then obtain the output by averaging the probability scores from each model. In this work, we ensemble two models for our predictions. To train the first model, we use the DiCOVA dataset and augment with the COVID-19 positive samples from the COUGHVID dataset [4] and up-sample the training data to maintain data balance. We use a cross entropy loss to train this model. To train the second model, we perform data augmentation similar to that of the first model except up-sampling and use focal loss [44]. These methods are described in more detail below.
6.1Data augmentation
Since the DiCOVA 2021 dataset has only 50 COVID-19 positive samples per validation fold, we augment it with the COUGHVID dataset to train the network. We use 400 COVID-19 positive samples from the COUGHVID dataset for network training. To avoid overfitting during training, we utilize an additional data augmentation strategy. We use the audio mix-up [45] method to achieve the same. Mix-up randomly mixes a pair of inputs and their corresponding outputs. Consider a pair of inputs
(4)
(5)
Mixup operates on the fly by randomly mixing a pair of inputs and their associated target values. The output of Eqs (4) and (5) were used to train the network rather than the original inputs. The parameter
6.2Loss functions
We train two models based on two different loss function choices. One model is trained using the cross-entropy loss while the second model is trained using the focal loss. We ensemble these two models to generate the probabilities on the validation and test datasets.
6.2.1Cross entropy loss
To address data imbalance, we augment the COUGHVID dataset and up sample the training data for each training fold. We balance the number of samples in both classes in the training data through up sampling. The up-sampled training data is used to train the VGG-13 model using the cross-entropy loss. The binary cross entropy loss is given as:
(6)
where
6.2.2Focal loss
Focal loss is used to address the class imbalance problem [39]. Two modulation hyper-parameters
(7)
The parameters alpha and beta were finalized through extensive experimentation using grid search. Grid-search was used to determine the optimal hyperparameters of a model which results in the most ‘accurate’ predictions. Focal loss applies a modulating term to the cross-entropy loss in order to focus learning on hard negative examples. It is a dynamically scaled cross entropy loss, where the scaling factor decays to zero as confidence in the correct class increases. Intuitively, this scaling factor can automatically down-weight the contribution of easy examples during training and rapidly focus the model on hard examples. We introduced the focal loss in training to address the issue of data imbalance in the given dataset.
6.2.3Ensembling
We use the two models trained with the loss functions above. We use the predictions from the individual models on the five validation folds and on the test dataset. We finally obtain the prediction probabilities for all validation/test samples by averaging the predictions from the two models. We describe the results in detail below in Section 8.
7.Results
7.1Benchmarking different design strategies
For the fully connected neural networks, we obtain an average validation accuracy of 65% on the 5 folds provided. In case of the pruned neural networks for cough detection, we observe a similar classification accuracy of 64.3%. We find that smaller networks achieve greater compression of about 60% for a drop in accuracy by 7%. We then explored more sophisticated convolutional neural network architectures such as the VGG-13. We first discuss the results obtained from VGG-13 models before and after ensembling. For the first model, which was trained using the DiCOVA dataset augmented with COUGHVID data for each of the five folds with cross-entropy loss, we obtain an average AUROC of 84.02% on the five folds. The test AUROC was found to be 73.48%. For the second model, which followed a similar augmentation strategy as the first model except up sampling and focal loss, we find an average validation AUROC of 72.01% on the five folds. The test AUROC was found to be 73.44%. We summarize these results in Table 2. Since the individual models reported low AUROC scores on the test dataset, we predict the probability scores on the best of the two models. i.e., to obtain an improved AUROC score, we select and ensemble the two best models for each loss function and from each fold and predict on the corresponding validation fold to obtain the ensembled AUROC. Following such an ensembling strategy, we notice that the average validation AUROC increases to 82.23% (as observed from Fig. 6) on the validation folds while the AUROC on the blind test dataset was found to be 78.3%.
Table 2
AUROC for each individual fold of the validation dataset with combined cross entropy loss and focal loss with highest specificity for each fold
| Validation fold | AUROC under cross entropy (%) | AUROC under focal loss (%) |
|---|---|---|
| 1 | 80.71 | 70.27 |
| 2 | 89.88 | 68.76 |
| 3 | 87.12 | 77.78 |
| 4 | 73.59 | 70.52 |
| 5 | 94.92 | 72.93 |
Table 3
A table comparing the validation AUROCs of the methods used for COVID-19 audio detection in the DiCOVA 2021 challenge
| Method | AUROC |
|---|---|
| Light gradient boosting [47] | 67.28 |
| SVM and LSTM [48] | 94.31 |
| Random forest and SVM [49] | 73.29 |
| Logistic regression and random forest [50] | 73.41 |
| Autoregressive predictive coding [51] | 76.45 |
| Autoencoder [52] | 47.28 |
| SVM [53] | 71.7 |
| Resnet18 [54] | 61.9 |
| VGG-13 (our method) | 82.23 |
Figure 6.
Average validation AUROC curve on the five folds. We observed that our proposed approach yielded an AUROC score of 82.28%.
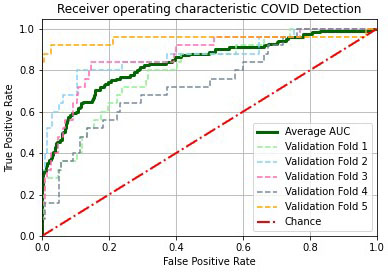
Figure 7.
The average validation confusion matrix consolidated from the five folds at sensitivity of 80%. The specificity on the validation data was found to be 77.88%.
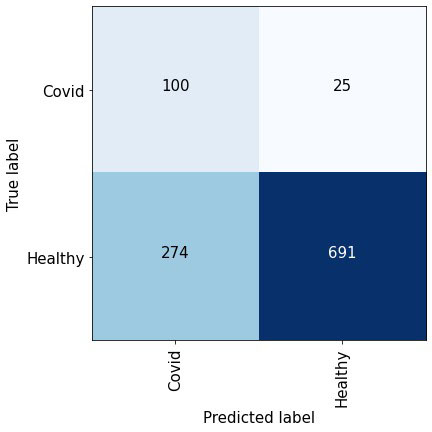
Figure 7 depicts the confusion matrix obtained at a sensitivity of 80% which implies that 80% of the positive class is correctly detected. We obtain the validation scores from each fold and report the overall performance. We can observe that at such a high sensitivity, the number of false negatives is significantly less than the total number of true negatives which is indicative of the detection performance.
7.2Comparison with methods from the Interspeech DiCOVA 2021 challenge
We also entered our modified VGG-13 classifier into the “Diagnosing COVID-19 Using Acoustics” (DiCOVA) 2021 challenge [46], a special session of Interspeech 2021. Participants were tasked with a COVID-19 audio classification task involving a blind test set of 233 audio samples. Our team placed eleventh out of 85 teams in the Track-1 challenge. Here, we describe methodologies and results for a number of the participants. All AUROC values given are for performance on the 5-fold cross validation. Team PANACEA [47] developed a method using Teager energy operator cepstral coefficients (TECCs) and a light gradient boosting machine (LightGBM) to achieve an AUROC of 69.80%. In [48], a method is developed using support vector machines (SVMs) and long short-term memory (LSTM) networks in order to achieve and AUROC of 94.31%. In [49], Random Forests, and SVMs are used in conjunction with the ComParE 2016 feature set. An AUROC of 73.29% was attained using this method. The study described in [50] demonstrated the use of logistic regression, random forests, and multilayer perceptrons to obtain an AUC value of 73.41%. In [51], autoregressive predictive coding (APC) is used in addition to an LSTM to achieve an AUC value of 76.45%. The algorithm described in [52] only achieved an AUC of 47.28% but uses a unique encoder-decoder methodology for COVID-19 cough classification. In [53], the authors describe the use of a weighted SVM and the use of audio features such as super-vectors, formants, harmonics and MFCCs to attain an AUROC of 71.7%. In [54], the authors use a Resnet18 model for classification and evaluate performance of their algorithm between samples from male and female participants. This algorithm achieved an AUC of 61.90%. The study described in [55] reported an AUROC of about 73.4% using handcrafted features and an SVM classifier. In [56], the authors use an SVM classifier with high-dimensional acoustic features, as well as a CNN with log-Mel spectrograms. These models are fused in order to achieve an AUROC of 81%. Our approach can perform COVID-19 detection with an average AUROC of 82.23%. We identify COVID-19 samples with an accuracy of 80% and a false positive rate of 17%.
8.Conclusions
In this paper, we described system designs that was adopted for the DiCOVA 2021 dataset. We first explored the use of fully connected and pruned neural networks for COVID-19 cough detection. For the fully connected neural networks, we obtain an average validation accuracy of 65% on the 5 folds provided. In order to reduce complexity, we also explore the use of pruned neural networks. Using simulations, we demonstrate that the test accuracy of a network pruned by 50% (a significant reduction of weights) reduces only by 5%. The pruned network is represented by half the number of parameters compared to the fully connected neural network. We then explored the use of convolutional architectures namely the VGG-13 for detection. In particular, we utilized a modified VGG-13 neural network with combined cross entropy and focal loss, operating on the log-mel spectrogram to learn to discriminate between the spectral signatures of coughs from a finite set of COVID-19 positive and healthy patients. We improved the overall generalization performance by: (i) performing data-augmentation using the COVID-19 positive cough sounds from the crowd sourced COUGHVID dataset; and (ii) using ensembles of two VGG-13 models, wherein the former was trained using the cross-entropy loss and the latter was trained using the focal loss. With these key modifications to the predictive modeling pipeline, our approach achieved high validation AUROCs (82.23%) and blind test AUROCs (78.3%), thereby encouraging the potential use of such models to support rapid diagnosis in clinical settings. With additional tuning of features and integrated loss functions, we anticipate further improvements on our results.
Acknowledgments
This work was funded by the REU supplement NSF NCSS/SenSIP I/UCRC Award number 1540040. We would also like to thank the authors in [57] for their insightful suggestions on model development.
References
[1] | “Johns hopkins university, coronavirus resource center,” https://coronavirus.jhu.edu., accessed: 2021-01-21. |
[2] | Imran A, Posokhova I, Qureshi HN, Masood U, Riaz MS, Ali K, John CN, Hussain MI, Nabeel M. AI4COVID-19: AI enabled preliminary diagnosis for COVID-19 from cough samples via an app. Informatics in Medicine Unlocked. (2020) Jan 1; 20: : 100378. |
[3] | Sharma N, Krishnan P, Kumar R, Ramoji S, Chetupalli SR, Ghosh PK, Ganapathy S. Coswara – A Database of Breathing, Cough, and Voice Sounds for COVID-19 Diagnosis. arXiv preprint arXiv:2005.10548. (2020) May 21. |
[4] | Orlandic L, Teijeiro T, Atienza D. The COUGHVID crowdsourcing dataset, a corpus for the study of large-scale cough analysis algorithms. Scientific Data. (2021) Jun 23; 8: (1): 1-0. |
[5] | Shanthamallu US, Spanias A, Tepedelenlioglu C, Stanley M. A brief survey of machine learning methods and their sensor and IoT applications. In 2017 8th International Conference on Information, Intelligence, Systems & Applications (IISA). IEEE. (2017) Aug 27, pp. 1-8. |
[6] | Spanias AS. Speech coding: A tutorial review. Proceedings of the IEEE. (1994) Oct; 82: (10): 1541-82. |
[7] | Wichern G, Xue J, Thornburg H, Mechtley B, Spanias A. Segmentation, indexing, and retrieval for environmental and natural sounds. IEEE Transactions on Audio, Speech, and Language Processing. (2010) Feb 8; 18: (3): 688-707. |
[8] | Loizou PC, Spanias AS. High-performance alphabet recognition. IEEE Transactions on Speech and Audio Processing. (1996) Nov; 4: (6): 430-45. |
[9] | Shanthamallu US, Rao S, Dixit A, Narayanaswamy VS, Fan J, Spanias A. Introducing machine learning in undergraduate DSP classes. InICASSP 2019–2019 IEEE International Conference on Acoustics, Speech and Signal Processing (ICASSP). IEEE. (2019) May 12, pp. 7655-7659. |
[10] | Yang CH, Qi J, Chen SY, Chen PY, Siniscalchi SM, Ma X, Lee CH. Decentralizing feature extraction with quantum convolutional neural network for automatic speech recognition. In ICASSP 2021–2021 IEEE International Conference on Acoustics, Speech and Signal Processing (ICASSP). IEEE. (2021) Jun 6, pp. 6523-6527. |
[11] | Ahmadi S, Spanias AS. Cepstrum-based pitch detection using a new statistical V/UV classification algorithm. IEEE Transactions on Speech and Audio Processing. (1999) May; 7: (3): 333-8. |
[12] | Uehara G, Spanias A, Clark W. Quantum information processing algorithms with emphasis on machine learning. International Conference on Information, Intelligence, Systems & Applications (IISA). IEEE. July (2021) . |
[13] | Coppock H, Gaskell A, Tzirakis P, Baird A, Jones L, Schuller B. End-to-end convolutional neural network enables COVID-19 detection from breath and cough audio: A pilot study. BMJ Innovations. (2021) Apr 1; 7: (2). |
[14] | Deshpande G, Schuller B. An overview on audio, signal, speech, & language processing for covid-19. arXiv preprint arXiv:2005.08579. (2020) May 18. |
[15] | Chu HY, Englund JA, Starita LM, Famulare M, Brandstetter E, Nickerson DA, Rieder MJ, Adler A, Lacombe K, Kim AE, Graham C. Early detection of Covid-19 through a citywide pandemic surveillance platform. New England Journal of Medicine. (2020) Jul 9; 383: (2): 185-7. |
[16] | Qian K, Schmitt M, Zheng H, Koike T, Han J, Liu J, Ji W, Duan J, Song M, Yang Z, Ren Z. Computer Audition for Fighting the SARS-CoV-2 Corona Crisis-Introducing the Multi-task Speech Corpus for COVID-19. IEEE Internet of Things Journal. (2021) Mar 22. |
[17] | Deshmukh S, Al Ismail M, Singh R. Interpreting glottal flow dynamics for detecting COVID-19 from voice. InICASSP 2021–2021 IEEE International Conference on Acoustics, Speech and Signal Processing (ICASSP). IEEE. (2021) Jun 6, pp. 1055-1059. |
[18] | Han J, Brown C, Chauhan J, Grammenos A, Hasthanasombat A, Spathis D, Xia T, Cicuta P, Mascolo C. Exploring Automatic COVID-19 Diagnosis via voice and symptoms from Crowdsourced Data. InICASSP 2021–2021 IEEE International Conference on Acoustics, Speech and Signal Processing (ICASSP). IEEE. (2021) Jun 6, pp. 8328-8332. |
[19] | Rodriguez CR, Angeles D, Chafloque R, Kaseng F, Pandey B. Deep Learning Audio Spectrograms Processing to the Early COVID-19 Detection. In 2020 12th International Conference on Computational Intelligence and Communication Networks (CICN). IEEE. (2020) Sep 25, pp. 429-434. |
[20] | Berisha V, Wisler A, Hero AO, Spanias A. Empirically estimable classification bounds based on a nonparametric divergence measure. IEEE Transactions on Signal Processing. (2015) Sep 10; 64: (3): 580-91. |
[21] | Kushwaha S, Bahl S, Bagha AK, Kulwinder Singh P, Javaid M, Haleem A, Singh RP. Significant applications of machine learning for COVID-19 pandemic. Journal of Industrial Integration and Management. (2020) . |
[22] | Esposito M, Rao S, Narayanaswamy S, Spanias A. Covid-19 detection using audio spectral features and machine learning. Asilomar Conference on Circuits, Systems and Computers. IEEE. Oct (2021) . |
[23] | Laguarta J, Hueto F, Subirana B. COVID-19 artificial intelligence diagnosis using only cough recordings. IEEE Open Journal of Engineering in Medicine and Biology. (2020) Sep 29; 1: : 275-81. |
[24] | Quatieri TF, Talkar T, Palmer JS. A framework for biomarkers of COVID-19 based on coordination of speech-production subsystems. IEEE Open Journal of Engineering in Medicine and Biology. (2020) May 29; 1: : 203-6. |
[25] | Rao S, Narayanswamy V, Esposito M, Thiagarajan J, Spanias A. Deep Learning with hyper-parameter tuning for COVID-19 Cough Detection, IEEE IISA, (2021) July. |
[26] | Rao S, Muniraju G, Tepedelenlioglu C, Srinivasan D, Tamizhmani G, Spanias A. Dropout and Pruned Neural Networks for Fault Classification in Photovoltaic Arrays. IEEE Access. (2021) Aug 30. |
[27] | Rao S, Katoch S, Narayanaswamy V, Muniraju G, Tepedelenlioglu C, Spanias A, Turaga P, Ayyanar R, Srinivasan D. Machine learning for solar array monitoring, optimization, and control. Synthesis Lectures on Power Electronics. (2020) Aug 31; 7: (1): 1-91. |
[28] | Frankle J, Carbin M. The lottery ticket hypothesis: Finding sparse, trainable neural networks. ICLR., (2019) May. |
[29] | Narayanaswamy VS, Katoch S, Thiagarajan JJ, Song H, Spanias A. Audio Source Separation via Multi-Scale Learning with Dilated Dense U-Nets. arXiv preprint arXiv:1904.04161. (2019) Apr 8. |
[30] | Simonyan K, Zisserman A. Very deep convolutional networks for large-scale image recognition. arXiv preprint arXiv:1409. 1556. (2014) Sep 4. |
[31] | Huzaifah M. Comparison of time-frequency representations for environmental sound classification using convolutional neural networks. arXiv preprint arXiv:1706.07156. (2017) Jun 22. |
[32] | Han R, Huang L, Jiang H, Dong J, Peng H, Zhang D. Early clinical and CT manifestations of coronavirus disease 2019 (COVID-19) pneumonia. American Journal of Roentgenology. (2020) Aug; 215: (2): 338-43. |
[33] | WHO, “Clinical management of severe acute respiratory infection (sari) when covid-19 disease is suspected: interim guidance, 13 march 2020,” World Health Organization, Tech. Rep., (2020) . |
[34] | Maghded HS, Ghafoor KZ, Sadiq AS, Curran K, Rawat DB, Rabie K. A novel AI-enabled framework to diagnose coronavirus COVID-19 using smartphone embedded sensors: design study. In 2020 IEEE 21st International Conference on Information Reuse and Integration for Data Science (IRI). IEEE. (2020) Aug 11, pp. 180-187. |
[35] | Han J, Qian K, Song M, Yang Z, Ren Z, Liu S, Liu J, Zheng H, Ji W, Koike T, Li X. An early study on intelligent analysis of speech under COVID-19: Severity, sleep quality, fatigue, and anxiety. arXiv preprint arXiv:2005.00096. (2020) Apr 30. |
[36] | Faezipour M, Abuzneid A. Smartphone-based self-testing of COVID-19 using breathing sounds. Telemedicine and e-Health. (2020) Oct 1; 26: (10): 1202-5. |
[37] | Davis S, Mermelstein P. Comparison of parametric representations for monosyllabic word recognition in continuously spoken sentences. IEEE Transactions on Acoustics, Speech, and Signal Processing. (1980) Aug; 28: (4): 357-66. |
[38] | Narayanaswamy VS, Thiagarajan JJ, Song H, Spanias A. Designing an effective metric learning pipeline for speaker diarization. InICASSP 2019–2019 IEEE International Conference on Acoustics, Speech and Signal Processing (ICASSP). IEEE. (2019) May 12, pp. 5806-5810. |
[39] | Laguarta J, Hueto F, Rajasekaran P, Sarma S, Subirana B. Longitudinal speech biomarkers for automated alzheimer’s detection. |
[40] | He K, Zhang X, Ren S, Sun J. Deep residual learning for image recognition. In Proceedings of the IEEE Conference on Computer Vision and Pattern Recognition. (2016) , pp. 770-778. |
[41] | Chaudhari G, Jiang X, Fakhry A, Han A, Xiao J, Shen S, Khanzada A. Virufy: Global applicability of crowdsourced and clinical datasets for AI detection of COVID-19 from cough. arXiv preprint arXiv:2011.13320. (2020) Nov 26. |
[42] | Spanias A, Painter T, Atti V. Audio signal processing and coding. John Wiley & Sons; (2006) Sep 11. |
[43] | Ioffe S, Szegedy C. Batch normalization: Accelerating deep network training by reducing internal covariate shift. InInternational Conference on Machine Learning. PMLR. (2015) Jun 1, pp. 448-456. |
[44] | Lin TY, Goyal P, Girshick R, He K, Dollár P. Focal loss for dense object detection. In Proceedings of the IEEE International Conference on Computer Vision. (2017) , pp. 2980-2988. |
[45] | Zhang H, Cisse M, Dauphin YN, Lopez-Paz D. mixup: Beyond empirical risk minimization. arXiv preprint arXiv:1710.09412. (2017) Oct 25. |
[46] | Muguli A, Pinto LRN, Sharma N, Krishnan P, Ghosh PK, Kumar R, Bhat S, Chetupalli SR, Ganapathy S, Ramoji S, Nanda V. DiCOVA Challenge: Dataset, Task, and Baseline System for COVID-19 Diagnosis Using Acoustics. Proc. Interspeech (2021) . |
[47] | Kamble MR, Gonzalez-Lopez JA, Grau T, Espin JM, Cascioli L, Huang Y, Gomez-Alanis A, Patino J, Font R, Peinado AM, Gomez AM. PANACEA cough sound-based diagnosis of COVID-19 for the DiCOVA 2021 Challenge. Interspeech (2021) . |
[48] | Karas V, Schuller BW. Recognising Covid-19 from Coughing Using Ensembles of SVMs and LSTMs with Handcrafted and Deep Audio Features. Proc. Interspeech 2021. (2021) : 911-5. |
[49] | Södergren I, Nodeh MP, Chhipa PC, Nikolaidou GK, Kovács G. Detecting COVID-19 from audio recording of coughs using Random Forests and Support Vector Machines. Proc. Interspeech 2021. (2021) : 916-20. |
[50] | Das RK, Madhavi M, Li H. Diagnosis of COVID-19 using Auditory Acoustic Cues. Proc. Interspeech 2021. (2021) : 921-5. |
[51] | Harvill J, Wani YR, Hasegawa-Johnson M, Ahuja N, Beiser D, Chestek D. Classification of COVID-19 from Cough Using Autoregressive Predictive Coding Pretraining and Spectral Data Augmentation. Proc. Interspeech 2021. (2021) : 926-30. |
[52] | Deshpande G, Schuller BW. The DiCOVA 2021 Challenge – An Encoder-Decoder Approach for COVID-19 Recognition from Coughing Audio. Proc. Interspeech 2021. (2021) : 931-5. |
[53] | Ritwik KV, Kalluri SB, Vijayasenan D. COVID-19 Detection from Spectral features on the DiCOVA Dataset. Proc. Interspeech 2021. (2021) : 936-40. |
[54] | Mallol-Ragolta A, Cuesta H, Gómez E, Schuller BW. Cough-Based COVID-19 Detection with Contextual Attention Convolutional Neural Networks and Gender Information. Proc. Interspeech 2021. 2021: : 941-5. |
[55] | Bhosale S, Tiwari U, Chakraborty R, Kopparapu SK. Contrastive Learning of Cough Descriptors for Automatic COVID-19 Preliminary Diagnosis. Proc. Interspeech 2021. 2021: : 946-50. |
[56] | Avila F, Poorjam AH, Mittal D, Dognin C, Muguli A, Kumar R, Chetupalli SR, Ganapathy S, Singh M. Investigating Feature Selection and Explainability for COVID-19 Diagnostics from Cough Sounds. Proc. Interspeech 2021. 2021: : 951-5. |
[57] | Iqbal T, Kong Q, Plumbley MD, Wang W. General-purpose audio tagging from noisy labels using convolutional neural networks. In Proceedings of the Detection and Classification of Acoustic Scenes and Events 2018 Workshop (DCASE2018). (2018) , pp. 212-216. Tampere University of Technology. |
[58] | Chen T, Guestrin C. Xgboost: A scalable tree boosting system. In Proceedings of the 22nd Acm Sigkdd International Conference on Knowledge Discovery and Data Mining. (2016) Aug 13, pp. 785-794. |
[59] | Simonyan K, Zisserman A. Very deep convolutional networks for large-scale image recognition. arXiv preprint arXiv:1409. 1556. (2014) Sep 4. |
[60] | Iqbal T, Kong Q, Plumbley M, Wang W. Stacked convolutional neural networks for general-purpose audio tagging. DCASE2018 Challenge. (2018) Sep. |


