
Taking comfort in decisions: Implications in a pandemic
Abstract
A pandemic affects both individuals and groups in various ways, requiring that consequential decisions be satisfactory to multiple constituencies. The ultimate objective is to foster a balanced decision-making environment where, while each constituency might not obtain its optimal outcome, the outcomes are aligned and, in some measure, good enough overall. To determine the value of alternatives, we use the Comfort Decision Model, utilizing attitudinal measures. Sensitivity of the resulting decision is demonstrated and a measure of satisfaction to the implemented alternative is proposed.

1.Introduction
Knowledge management involves collecting, storing, disseminating and using information to manage knowledge and help make decisions [1, 2]. Often the terms “data”, “information”, and “knowledge” are viewed hierarchically, where data consists of the building blocks of facts, information being how those facts are assigned, integrated, and contextualized into meaning, and knowledge the result of using those meanings to better understand the world and to make decisions.
Regardless of what field one examines, data is ubiquitous. Data is generated and used by government agencies, business organizations, cities and states, and even via devices like smart watches and fitness trackers, by individuals. Data not only is associated with historically “measurable” attributes, but also new attributes whose measurement is enabled by new technologies [3]. For example, consider marketing and advertising. Years ago, publishers and advertisers might have been able to quantify the number of newspaper and magazine readers and even understand their demographic mix, but today, websites can monitor how long viewers spend on a page, where the viewer came from, where he or she goes next, and what items on the page catch the viewer’s fancy. More data is collected in much more granular fashion that ever before.
Technology enabled capabilities create new challenges that address the three questions involving how knowledge is managed: How is data collected, stored and disseminated? How does data achieve meaning as it is integrated into information? How is information used to create knowledge, used to navigate the world, and used make decisions?
A key domain where knowledge management has changed the landscape of how practitioners do their job is health care and public health [4, 5]. Starting with the base unit of the patient, many ongoing measurements can be collected, all in service of answering the question, “How healthy is he or she?” Collecting data on attributes like blood pressure and pulse rates has been done for years [6], but advances in medical technology have enabled measuring building on the old measured attributes and measuring new attributes with a precision unthinkable even the recent past [7]. While collecting, processing, storing, and disseminating data and information for one person is challenging, doing this for large populations is even more so. Knowledge management systems are needed to make all phases of this endeavor happen.
The scope of academic research and publications in the area of knowledge management in health care decision modelling is enormous. Two macro categories may be defined as concerning Medical Issues and Management Practices. Medical Issues decision-making concerns topics such as conducting clinical trials [8, 9], modeling the transmission of infectious disease [10, 11, 12] and developing predictive simulation models used to predict the outcomes on patient intervention strategies [13, 14]. These papers illustrate medical decision modelling and concern strategies that directly affect individuals in societal or hospital settings.
The second macro area involves modelling Management Practices, which includes decision models used in government level programs such as the Medicaid system in the United States [15] or home health services [16]; large health systems such as managing conglomerates of hospitals formed in health care mergers and resource allocation between hospitals [17, 18, 19]; sundry management issues arising in hospitals, and day-to-day decision modeling at a micro level such as scheduling personnel [20, 21], managing intensive care units [22, 23] disaster preparedness [24] and allocating resources in the Covid-19 pandemic [25, 26]. At the intersection of these two categories is the issue of modeling technologies which can be medically oriented or management oriented [27] and decision modeling methodologies.
Clearly the application of knowledge management and decision-making technologies is broad, both as measured by the domains where the decision-making technologies and methodologies are applied, and also by the technologies and the methodologies themselves. The effectiveness of a specific technology or decision methodology often is situational, depending on the facts concerning the environment in question. Appropriateness depends the availability of technological and other resources, information availability, and the proclivities on the decision makers for among other things, a propensity to accepting and managing risk. Regarding risk, a decision maker might be a pessimist and somewhat risk averse, which might mean that one set of decision evaluative alternatives would be appropriate. Another decision maker might be an optimist which would mean that she might use another set of evaluative alternatives. The Comfort Criteria which we will discuss below, would be appropriate for this second optimistic decision maker.
The recent Covid-19 global pandemic has illustrated the benefits and challenges facing knowledge management and the process of making evidence-based decisions. Populations are aggregates of individuals and pandemics affect the health of populations as the contagion spreads from one person to many. As such, a pandemic’s effects range from the micro to the macro, from one person’s evolving state of health, to states of health in local communities, the nation, and the world.
Pandemics also are multidimensional because the contagion affects people and communities in many ways. While the core involves how the contagion affects a person’s health and then, the health of those around him, there also are effects along other dimensions. Examples include the economic, educational, political, and social dimensions. These dimensional effects also are interrelated, e.g., a contagion’s political effect involves closing schools, or its economic effect impacts the emotional well-being of displaced workers. We live in a multi-dimensional universe and effects along one dimension affect many others.
Because of these interrelationships, knowledge management and decision making in a pandemic not only involves looking along one dimension, or in one domain, but many others as well. A decision never is just a medical or public health decision, but depending on its nature also becomes, in effect, and economic, social, or even psychological decision too. It is natural that individuals associated with each domain, public health related and otherwise, and often with the best of intensions, think of their domain’s needs first while placing the needs of others in the background. Physicians first think about health. Business owners first think about their business. Parents first think about the health and education of their children.
Because a pandemic affects many domains, for decisions to be effective and equitable, we posit that they in some manner must be acceptable or satisfactory to multiple constituencies or stakeholders. Using advanced methods and decision tools can help. These methods and tools involve collecting, verifying, framing, and presenting information that is accessible to, and understood by, all parties. In addition, these methods and tools also must help integrate information across disciplinary domains. Doing this will result in better or at least more informed decisions to enable decision makers at all levels of the process, from an individual citizen to a head of state, make better decisions.
2.Specific issues related to pandemics
In this section we review five issues that are related to knowledge management and decision making in pandemic environments. While each issue also affects non-pandemic environments, the pandemic environment itself, and the ongoing crises and often chaos associated with it, exacerbates the immediacy of each issue and impacts how knowledge management systems function [28]. Five issues are:
1) Data and information may be structurally incomplete, constantly changing, and inconsistently defined
In a pandemic environment, understanding what people often refer to as “the data” requires examining each domain that the pandemic affects. There are many domains and for the purposes of this paper, we will narrow the discussion to five: Medical and Public health; economic; educational, social, and individual.
For example, in the medical and public health domain, data such as health status, test results, hospitalization rates, ICU usage, and deaths by various age and demographic groupings, are arguably the most well-defined. Yet even here using the United Stated as an example, different localities and states often define and report data differently. For example, for a two stage vaccine one state may count shots for the same person as two administrations whereas another may define it as one. These differences cause problems in data aggregation, analysis, and eventually in decision making.
Dynamic environments across all domains compound these problems. Changing environmental conditions affect how trends are reported, understood, and later, interpreted. Not only does medically-related data fall prey to this problem, but the problem also affects other domains as well. For example, in the economic domains (e.g., job losses at restaurants and factories, spending and other measures of economic activity), the educational domains (e.g., students attending classes remotely, students without Wi-Fi links, test scores), and the social domains (e.g., estimates regarding mask wearing and proclivity to get vaccines.)
2) Each constituency interprets and weighs information differently, leading to decisions that it might prefer, but which are inimical to others
As citizens, we all belong to many domains. Often however, one domain supersedes others. A public health official, may be a restaurant patron and a parent of a small child, but as a public health official, she will use her professional knowledge to make pandemic-related decisions from her professional frame of reference, even if she considers the decisions’ impact along other dimensions. The same is true with a business owner, or an employee with a small child taking Zoom classes from home. In each case, all domains may be considered, but one domain may predominate, and frame the decision maker’s perspective more than others.
Even when the base data available to each domain is the same and agreed upon as well-defined and accurate, how people aggregate and interpret that data may lead to different conclusions and different decisions. This may be true regarding domains such as public health vs. small businesses and also even different branches of government, ranging from the national to state to local. The result is different interpretations of the efficacy and desirability of policies such as mask wearing, economic shut-downs, who receives vaccines and when, social distancing, and the level of governmental guidelines and penalties associated with following public health guidelines.
While differences in how data is interpreted and disseminated may partially cause conflicts, decisions regarding how open society should be more often arise from fundamental differences in the world-views to the affected constituencies. These world-views may be parochial – e.g., a small business owner about to lose her life’s investment may not appreciate taking a broader perspective regarding public health measures, as would a parent of primary school children taking online classes with intermittent Wi-Fi and substandard online teaching. From an individual’s perspective, when forced to act against their own interests when encountering a long and enduring pandemic, economic, social, or political decisions that go against stated public health measures often make sense, even when they subvert the effectiveness of those measures from a public health viewpoint. This is especially true when individuals perceive that self-sacrifices are not equitably distributed [29]. For an individual decision maker, rebellious acts may optimize their perceived “local” objectives, even when taken in a broader perspective, their real objectives would have them decide otherwise.
3) Bogus or distorted information can affect individual and institutional decisions
Bogus information is information that is wrong, either deliberately constructed from whole cloth, or misinterpreted from a kernel of accuracy. In a pandemic environment, examples of fabricated information are claims that vaccines contain computer chips that change a person’s DNA, or that the number of deaths are orders of magnitude smaller, or even zero. Often scientifically impossible and observationally absurd, charges like this nonetheless are believed by many, and influence individual decisions how to behave and whether or not to seek vaccines.
Unlike bogus information, distorted information is based on data that is true but, depending on how it is presented or viewed, may change decision making behavior. At one extreme, a parent of a young, healthy child may equate the effects of a child’s contracting the Covid 19 virus with those of an unhealthy senior citizen contracting the contagion, when the outcomes are quite different [30]. The result might be needless precautions that may affect socialization and educational opportunities. At the other extreme a senior citizen with various co-morbidity factors might use a probability of hospitalization relevant for the overall population to apply to herself, thus underestimating her risk. The result here might be behaviors that all but ensure contracting the virus and likely hospitalization.
Even the same number might be framed differently. A 99.5% Covid recovery rate can be used to justify decisions for maskless, non-social distancing behavior by partying college students, and also – when applied to a population of 330 million as in the U.S. – lead to a forecast of 1.65 million fatalities. Information leading to measures that, from a public health perspective, are justified may be viewed as draconian by others, who then process the same underlying data and decide to ignore or violate controlling measures.
Given this perceived information asymmetry, one constituency may frame information to benefit it and disadvantage others (e.g., using a low death rate to support an argument to skimp on medical devices like masks, or encourage no constraints in bars, indoor dining, or large gatherings). Conversely, high numerical death forecasts, especially in one age group, may be used to support limits in other age groups or localities, even at different times. For example, high death rates in nursing homes early in a pandemic implicitly created fears leading to decisions to keep schools closed even until later in the pandemic when data indicated that young children were relatively safe.
4) For each governmental level and each constituency, many decision makers exist, with the decisions of one affecting the decision environment of another
Each level of government has many disciplinary constituencies. For example, in the United States federal, state, and local governmental units exist, and within each are advocates in the areas of medicine, public health, economics, commerce, social institutions, education, and politics. While countries with more top-down control can enunciate and more easily implement policies, countries with more governmental, disciplinary, and individual discretion may encounter “disharmony.” By this we mean, the recommendations by one jurisdiction may not be followed by another below it in the governmental hierarchy, or ultimately, even by individual citizens. This dissonance increases as the pandemic persists and people become perturbed at making ongoing sacrifices. The recommendations of one disciplinary unit in a jurisdiction may not be followed by other units, even in the same jurisdiction. For example, a state governor may require mask wearing and a city mayor may ignore the recommendation – of vice versa.
Figure 1 illustrates this dynamic for a given level of government, with the Medical/Public Health constituency at the center and other main constituencies surrounding it. While the public health constituency communicates policies from its perspective, the other constituencies receive these messages and, based on individual and governmental behavior and regulations, may amend the recommendations and act differently. This, in turn, may affect the progression of the contagion itself and change recommendations which creates a temporally evolving situation. Figure 1 represents one of four ‘slices’ or levels: The national, state, local, and individual. For each slice, Figure 1’s relationships are relevant, albeit achieving different levels of importance.
Figure 1.
Constituencies engaged in the decision process.
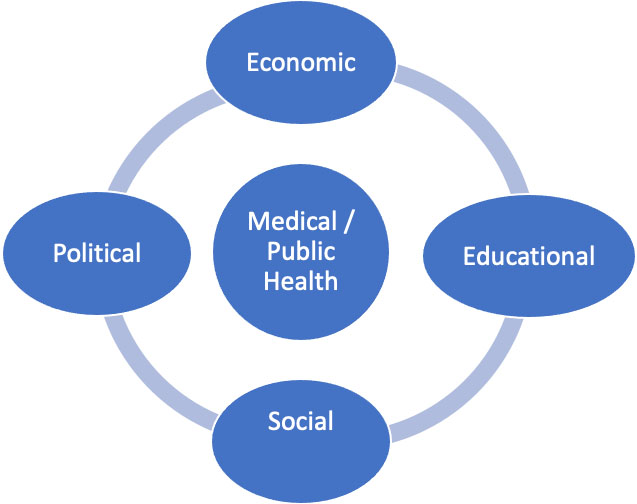
Individuals comprise the lowest hierarchical level, yet their behavior taken in aggregate drives all of the others. In some cases, individuals have little discretion – e.g., if restaurants are closed, people cannot dine indoors. But regardless of how higher-level decisions affect them, people (and lower levels of government) can choose to follow or ignore public health guidelines. Their decisions affect the overall health of the larger community: A business owner may choose to open her business circumventing local regulations; a locality may define regulations that conflict with its state’s; a state may ignore directions enunciated by the federal government.
Nothing is illegal here, given the decision rights of political entities at each level. However legal it is, when many entities make decisions with conflicting outcomes, the resulting disharmony creates a confusion and suboptimal environment for all concerned. Examples include rules for mask wearing, gym and beauty salon openings, attending sporting events, and attending social gatherings. Beyond confusion, legally conflicting decisions causes resentment and leads to circumventing the regulatory and governmental chain of command, creating a “wild west” environment where anything goes.
5) Constituencies often are pitted against each other in “zero-sum” type conflicts
A fundamental conflict underlying many decisions made in a pandemic concerns the tension between public health and other constituencies such as businesses (where public health decisions impact economic activity and jobs), education (where public health decisions affect a child’s educations and social development), and social institutions (where public health-based restrictions may affect religious organizations and family gatherings). While the conflicts need not be zero sum, often they are perceived to be so. Compounding the conflict is the ongoing nature of pandemics, where sacrifices – made by one constituency for another – rather than having a defined end, go on and on and become open-ended. A restaurant may be willing to close for a few weeks or even a month, but when one month extends to six and twelve months with no end in sight, the owner reconsiders and decisions change. The same is true for schools where students, especially those in elementary grades, may encounter negative effects regarding not only their education in online environment, but also impediments to their social and emotional growth. These repercussions often are more serious than the repercussions of a young child contracting the contagion with minimal adverse effects.
In perceived zero-sum environments each constituency often seeks to optimize its own returns, while downplaying others. Taken to the extreme, public health measures are recommended that discount economic impacts or educational impacts on children. While public health decision makers may point to the long run, and provide evidence where short term sacrifices will result in better long-term performance, information as disseminated and interpreted may belie these assertions. Or conversely, businesses may open and ignore the longer-term impact on the health of others who might catch the contagion – from the business owners perspective other’s suffering is unrelated to his customers or his business. Figure 2 seeks to capture this decision environment.
Figure 2.
Domains and the decision environment.
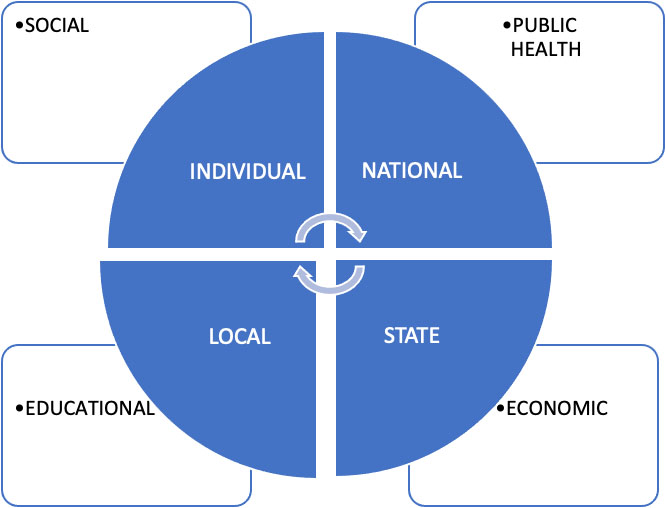
The inside circle contains four levels, from the national to the individual. The actions of each affect the others in a cyclical manner, and eventually individual decisions in aggregate affect amended government policies. While arguably each level contains all domains (or constituencies) portrayed, public health measures often are articulated and disseminated from the national level on down, often through recommendations of government agencies. These may or may not be followed by other levels but they are received and acted on. States also have public health agencies, but being closer to economic activity in the state, they may be more concerned with businesses and commerce. Localities are concerned with this as well, but here education often is paramount as schools (in the United States) are a local responsibility and parent interactions with government occurs at the local level. Finally, individuals are most aligned with social interactions with friends, family, and other institutions like schools, churches, and voluntary organizations.
The ultimate objective is to foster a harmonious decision-making environment where, while each constituency might not obtain its optimal outcome, the outcomes are aligned and, in some measure, good enough and satisfactory overall.
3.Implications informing decision modeling
The above discussion suggests that selecting a decision alternative in a pandemic environment is complicated because a pandemic environment by definition is unique and provides the decision maker with little information. Herbert Simon [31, 32] posits a theory of bounded rationality, where he discusses decision making when decision makers cannot always make mathematically optimal decisions, but rather must choose among decision alternatives while bounded by the restrictions of their own cognitive limits, and also limits imposed on them by their decision environment. One outcome of this is Simon’s idea of satisficing, i.e., making decisions that while not optimal, are good enough.
The decision problem as we frame it is not one of satisficing, but rather decision making under uncertainty. Here, the decision maker is still rational and seeks to make the best decision, in an environment where the probabilities governing the outcomes of the various possible states of nature are unknown. Because of this uncertainty and the unavailability of probability estimates, methods using expected returns are inappropriate. In this case the “bound” for the decision maker is the uncertainty surrounding the state of nature probabilities, i.e., the decision maker has no idea what the probability of occurrence of the various states of nature will be.
For decision making under uncertainty, various evaluation criteria exist for framing the problem and choosing the alternatives. These depend on the level of optimism and pessimism of the decisionmaker, or as we discuss here, his level of bias. For example, one commonly used method is to frame the decision using a regret criterion, where for each decision alternative, the payoffs for each state of nature are judged relative to the best possible payoff for that state of nature. This may be thought of as a glass half empty approach, because the outcomes are always found wanting when judged against the best.
While the regret criterion is appropriate for a pessimist, what about the non-pessimist, or the optimist? Here, we present an alternate method, which may be a more realistic approach, using what we call a comfort approach, where the payoffs are based on the difference between the actual payoff and the worst possible payoff for that state of nature. This may be thought of as a glass half full approach, and still falls within the broad purview of Simon’s bounded rationality concept.
For decision making in a pandemic, each constituency (or domain) makes decisions that affect itself and others. Some key issues that inform decisions and how they are made in pandemics are:
• Decisions made by one constituency affect others, and have unintended consequences.
Public health decisions affect small business, social institutions, and education. And, decisions in these areas, in turn, affect public health. Points of view often are incongruent, and grow more so as time passes and the contagion period grows longer. As time passes, more data accrues, more information is reported and interpreted in credible and not-so-credible ways, which flood the official and social media. Intended consequences often miss the mark and unintended consequences appear that are more problematic. Public health decisions regarding societal lockdowns may lead to devastating results for business owners and parents of school age children, well beyond those that are forecast. Individuals, evaluating their own risks and refusing to follow prescribed public health and governmental guidelines, may make decisions that taken in aggregate, lengthen and exacerbate the effects of the contagion. The result: More hospitalizations and deaths, more businesses shuttered, and a contagion that lasts longer than necessary.
Decisions that seem to be impartial, also may incorporate a decision maker’s biases or beliefs regarding the evolution of the contagion. Decisions also may incorporate the decision maker’s degree of optimism or pessimism in unintended ways. Temporally, this means at one stage of the contagion (for example, at the beginning), where the decision maker should be pessimistic, he may be overly optimistic, and at another (for example, near the end when herd immunity is being approached) where he should be optimistic, he may be overly pessimistic [33].
• Changing degrees of optimism and pessimism also affect how government and the medical establishment perceives risk.
Perceptions of risk also may differ along disciplinary lines, and be influenced by what a decision is about, and what is a person’s job. A public health official may be risk averse regarding veering from established public health good practices, but risk seeking regarding possible economic dislocation, since he may optimistically assume that government assistance will save those hurt economically. Here, medical risks may be weighed more heavily than economic risks. Conversely, a restaurant owner may be risk averse in closing her restaurant, but optimistically willing to take a chance the she, her employees and even customers will muddle through, even if catching the contagion. Here, economic risks receive heavier weights.
Perspectives for decision makers may be “glass half empty” or “glass half full” or even both depending on what kind of decision the decision maker is considering and what constituency the decision is affecting [34].
• A decision maker’s frame of reference may inform whether or not they employ the precautionary principle.
A public health official when confronted with uncertainty and the possibility of severe contagion, may opt for shutting down all economic activity for as long as it takes to reduce the caseload to an acceptable, medically defined level. For example, many Asian countries applied this principle, which opts for adapting precautionary measures when evidence is uncertain, whereas other countries like the United Kingdom and the United States initially were more open [35]. At lower levels, a parent primarily concerned about educational and emotional well-being, may want schools to remain open, intuitively concluding that the forecast educational harm done by school closures outweighs any possible medical risk to students and teachers from the contagion. A governor with a public health perspective in one state may, based on incomplete knowledge about the evolution of the contagion, interpret that knowledge and opt for a societal shut-down approach to avoid possible contagion spread, while another governor with a laissez faire economic perspective based on similar incomplete knowledge, may opt for opening up the sate to avoid possible economic dislocation.
• Rather than thinking in extremes pitting one constituency and/or one or more governmental levels against another, other possible solutions that satisfy all constituencies may exist.
In the language of mathematical optimization, feasible solutions – perhaps not optimal for any one group – may be “good enough” for all groups. A challenge is to find these solutions, or at least examine ways to develop decision alternatives to think about solving problems in this way.
One direction to pursue is to expand a decision maker’s frame of reference, allowing him to look at decisions through more than one lens. For example, a pessimist rather than just adopting a glass “half empty” approach, may also view a decision from a “glass half full” perspective. Rather than compare outcomes to the “perfect” and always fall short, outcomes may be compared to what “unsatisfactorily might have been.” Suddenly, a bad outcome may look much better and more acceptable.
The next section discusses methodologies that can be used to make choices in this manner. Using these methods can reveal decision alternatives that meld the preferences of all constituencies to arrive at choices that better satisfy all parties’ underlying needs.
4.Decision modeling
A decision model affords analytical rigor to an unstructured problem, providing the capability to appraise alternatives which integrate the decision maker’s disposition [36]. In a decision problem,
The decision maker uses the
A decision maker may also use the criterion of regret, where regret is the difference between the payoff obtained given a chosen alternative and the best payoff that could have been obtained for that state of nature. We let
Using the regret criterion in decision making implies a sense of reflecting on what is foregone by not having made the optimal decision. This is a glass half-empty mind-set, or a measure of opportunity loss for not having received the best payoff. A complementary approach, the Comfort Decision Model [38], is based on not on what is absent relative to the best case, but on what is achieved relative to the worst case. This approach implies a glass half-full outlook. Comfort reflects a sense of gratitude, while regret that of a sense of entitlement.
Comfort is defined as the difference between the payoff received by selecting alternative
In a more general case, the aggregation can take on different forms rather than only the minimum,
In decision making under uncertainty, information regarding the probabilities of the states-of-nature is not available. The aggregation, or summary measure, of the payoffs, regrets, or comforts for a decision alternative across the states-of-nature is based on the disposition of the decision maker. The summarization, or aggregation, can be completed by means of the ordered weighted aggregation (OWA) operator [39]:
An OWA operator of dimension
The OWA operator supplies a summary measure of its arguments and provides a unifying approach to the choice of an alternative under uncertainty [40]. We define the OWA weighting vector as
Within context of comfort decision-making, we calculate the effective comfort for alternative
We define
Using the OWA operator, we aggregate the comfort values across the states-of-nature in determining the preferred alternative. Sensitivity analysis of the preferred alternative to the disposition, or bias, of the decision maker is a key feature of the Comfort Decision Model. The OWA weights can be obtained using a function
Decision makers combine analysis and intuition, filtering events through their own judgment [42]. Within decision making under uncertainty, with the absence of probabilistic estimates, decision makers rely on their own disposition (i.e. attitude or bias). The Bias of a weight generating function f is defined as:
We note that
A useful type of weight generating function is
It can easily be shown that for weight generating function,
A decision maker may wish to consider the original payoff values,
Because larger payoffs are better, payoff values are placed in descending order in the OWA aggregation to keep a smaller value for Bias representing a more optimistic attitude. Here
A decision maker may wish to consider regret as a measure of satisfaction in evaluating the alternatives. The methodology enumerated in the Comfort Decision Model can be used to accomplish this by replacing regret for comfort. Here since smaller regret is better, regret values are placed in ascending order in the OWA aggregation to keep a smaller value for Bias representing a more optimistic attitude. In the framework of regret decision-making we can calculate the effective regret for alternative
Here
5.Example
For the following example, to illustrate and relate the general mathematical methodology that we present to pandemic-specific decisions, we can think of the alternatives as vaccination strategies and the states of nature as variants of a virus. The payoff table consists of returns (in this case, fictitious values for the sake of illustrating the methodology) if a specific vaccination strategy is chosen and a specific state of nature occurs. For example, four decision alternatives and five possible states of nature could be as follows:
A1 – Mandatory vaccinations for all ages over 12; no masking or proof of vaccination requirement A2 – Mandatory vaccinations for all ages over 12; with masking and proof of vaccination requirement A3 – Recommended vaccinations for all citizens over 12; mandatory for health workers; recommended masking A4 – Recommended vaccinations for all adults over 18, but no mandates or any kind S1 – Virus Variant 1 S2 – Virus Variant 2 S3 – Virus Variant 3 S4 – Virus Variant 4 S5 – Virus Variant 5
Table 1 summarizes a decision problem containing alternatives,
Table 1
Payoff table
| S1 | S2 | S3 | S4 | S5 | |
|---|---|---|---|---|---|
| A1 | 100 | 75 | 65 | 10 | 110 |
| A2 | 40 | 75 | 10 | 20 | |
| A3 | 60 | 30 | 100 | 95 | 80 |
| A4 | 70 | 85 | 35 | 45 |
We find,
Using
Table 2
Comfort table
| S1 | S2 | S3 | S4 | S5 | |
|---|---|---|---|---|---|
| A1 | 60 | 45 | 55 | 50 | 90 |
| A2 | 0 | 45 | 0 | 0 | 0 |
| A3 | 20 | 0 | 90 | 135 | 60 |
| A4 | 30 | 55 | 25 | 10 | 25 |
Here, we demonstrate the application of the Comfort Decision Model with a sampling of illustrative calculations. In determining the effective comforts,
In this aggregation,
Table 3
Comfort criterion decisions
| Bias | 0.00 | 0.10 | 0.20 | 0.30 | 0.40 | 0.50 | 0.60 | 0.70 | 0.80 | 0.90 | 1.00 |
|---|---|---|---|---|---|---|---|---|---|---|---|
| Alternative | Effective comfort | ||||||||||
| A1 | 90.0 | 84.2 | 78.2 | 72.0 | 65.8 | 60.0 | 54.8 | 50.8 | 47.9 | 45.7 | 45.0 |
| A2 | 45.0 | 37.6 | 30.1 | 22.6 | 15.4 | 9.0 | 4.0 | 1.1 | 0.1 | 0.0 | 0.0 |
| A3 | 135.0 | 122.0 | 108.1 | 93.1 | 77.4 | 61.0 | 44.5 | 28.6 | 14.2 | 3.1 | 0.0 |
| A4 | 55.0 | 50.1 | 44.9 | 39.6 | 34.2 | 29.0 | 24.2 | 20.1 | 16.3 | 12.0 | 10.0 |
| Maximum | 135.0 | 122.0 | 108.1 | 93.1 | 77.4 | 61.0 | 54.8 | 50.8 | 47.9 | 45.7 | 45.0 |
| Preferred decision | A3 | A3 | A3 | A3 | A3 | A3 | A1 | A1 | A1 | A1 | A1 |
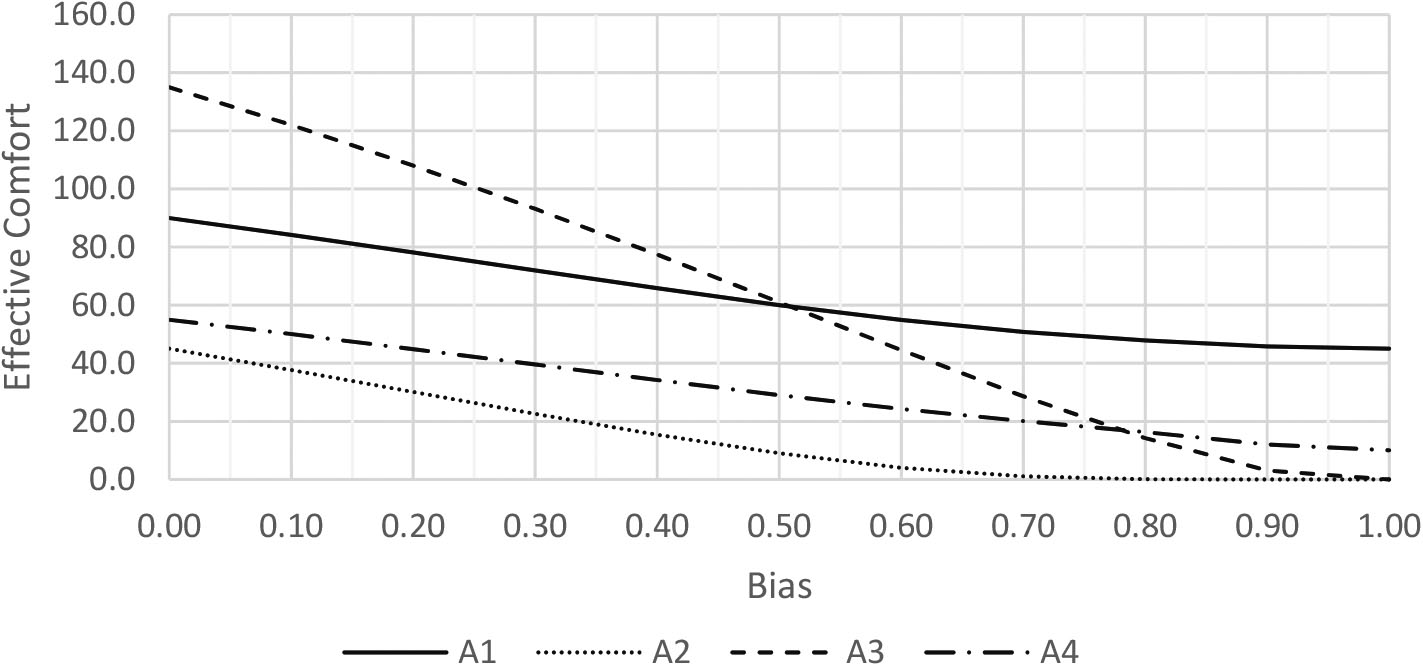
Figure 3.
Effective comfort vs Bias.
We show the calculations here for Bias
We calculate the OWA weights using:
For alternative
We find
Therefore, the Comfort values in descending order are:
Finally, the effective comfort for
We calculate the effective comfort
Figure 3 graphically displays the effective comfort as a function of Bias for each alternative.
In a situation such as the current pandemic, authorities may implement decisions that are not necessarily the preferred decisions of all constituents or stakeholders. As a measure of satisfaction to a stakeholder regarding an imposed decision, we can calculate the Comfort Attainment Percentage. We define the Comfort Attainment Percentage as
Table 4
Comfort attainment
| Bias | 0.00 | 0.10 | 0.20 | 0.30 | 0.40 | 0.50 | 0.60 | 0.70 | 0.80 | 0.90 | 1.00 |
|---|---|---|---|---|---|---|---|---|---|---|---|
| Implemented decision | Comfort attainment percentage | ||||||||||
| A1 | 67% | 69% | 72% | 77% | 85% | 98% | 100% | 100% | 100% | 100% | 100% |
| A2 | 33% | 31% | 28% | 24% | 20% | 15% | 7% | 2% | 0% | 0% | 0% |
| A3 | 100% | 100% | 100% | 100% | 100% | 100% | 81% | 56% | 30% | 7% | 0% |
| A4 | 41% | 41% | 42% | 42% | 44% | 48% | 44% | 40% | 34% | 26% | 22% |
| Preferred decision | A3 | A3 | A3 | A3 | A3 | A3 | A1 | A1 | A1 | A1 | A1 |
Table 5
Preferred alternatives using various criteria
| Bias | 0.0 | 0.1 | 0.2 | 0.3 | 0.4 | 0.5 | 0.6 | 0.7 | 0.8 | 0.9 | 1.0 |
|---|---|---|---|---|---|---|---|---|---|---|---|
| Payoff | A1 | A1 | A1 | A1 | A1 | A3 | A3 | A3 | A3 | A3 | A3 |
| Regret | A1 | A1 | A1 | A1 | A3 | A3 | A3 | A3 | A3 | A3 | A3 |
| Comfort | A3 | A3 | A3 | A3 | A3 | A3 | A1 | A1 | A1 | A1 | A1 |
Applying the methodology of the Comfort Decision Model described above, using Payoffs,
Using various criteria, the preferred alternatives depend on the Bias level of the stakeholder and the criteria being considered.
• Using Payoff: A1 is preferred for Bias
• Using Regret: A1 is preferred for Bias
• Using Comfort: A3 is preferred for Bias
• Considering Payoff, Regret and Comfort simultaneously, A3 is preferred for 0.46
Attainment of satisfaction, relative to an imposed decision, can also be determined using the criteria of payoff and regret, just as illustrated for comfort in Table 4. This is easily accomplished using the suggested method, and would be provide additional insight to support the decision process.
6.Conclusion
The recent pandemic has illustrated the benefits and challenges facing knowledge management and the process of making evidence-based decisions. We present issues that are related to knowledge management and decision making in pandemic and non-pandemic environments. The pandemic environment intensifies the urgency of each issue and impacts how knowledge management systems function. Decision methodologies, properly utilized, can reveal alternatives that better satisfy various constituencies’ essential needs. Comfort is a particularly useful criteria in the current environment and is defined as the difference between the payoff received by an implemented strategy and the worst payoff that could have been received. The Comfort Decision Model determines aggregation values utilizing attitudinal measures that provide insight to how satisfactory outcomes are aligned to constituents.
References
[1] | Alavi M, Leidner D. Review: Knowledge management and knowledge management systems: Conceptual foundations and research issues. MIS Quarterly. (2001) ; 25: (1): 107–136. |
[2] | Serenko A, Bontis N. The intellectual core and impact of the knowledge management academic discipline. Journal of Knowledge Management. (2013) ; 17: (1): 137–155. |
[3] | El Badawy T, Marwan R, Magdy HM. The impact of emerging technologies on knowledge management in organizations. International Business Research. (2015) ; 8: (5): 111. |
[4] | Revere D, Turner AM, Madhavan A, Rambo N, Bugni PF, Kimball A, Fuller SS. Understanding the information needs of public health practitioners: A literature review to inform design of an interactive digital knowledge management system. J Biomed Inform. (2007) ; 40: (4): 410–21. doi: 10.1016/j.jbi.2006.12.008. Epub 2007 Jan 11. PMID: 17324632. |
[5] | Kothari A, Hovanec N, Hastie R, et al. Lessons from the business sector for successful knowledge management in health care: A systematic review. BMC Health Serv Res. (2011) ; 11: : 173. |
[6] | Saklayen MG, Deshpande NV. Timeline of history of hypertension treatment. Frontiers in Cardiovascular Medicine. (2016) ; 3: : 3. doi: 10.3389/fcvm.2016.00003. |
[7] | Dash S, Shakyawar SK, Sharma M, et al. Big data in healthcare: Management, analysis and future prospects. J Big Data. (2019) ; 6: : 54. doi: 10.1186/s40537-019-0217-0. |
[8] | Weinstein MC. Recent developments in decision-analytic modelling for economic evaluation. PharmacoEconomics. (2006) ; 24: (11): 1043–1053. |
[9] | Kimko H, Berry S, O’Kelly M, Mehrotra N, Hutmacher M, Sethuraman V. Use of statistical and pharmacokinetic-pharmacodynamic modeling and simulation to improve decision-making: A section summary report of the trends and innovations in clinical trial statistics conference. Journal of Biopharmaceutical Statistics. (2017) ; 27: (3): 554–567. |
[10] | Thompson KM. Modeling and managing the risks of measles and rubella: A global perspective, part II. Risk Analysis: An International Journal. (2017) ; 37: (6): 1041–1051. |
[11] | Viera KM, et al. A pandemic risk perception scale. Risk Analysis: An International Journal. (2021) ; 42: (1). |
[12] | Lee S, Golinski M, Chowell G. Modeling optimal age-specific vaccination strategies against pandemic influenza. Bull Math Biol. (2012) ; 74: : 958–980. |
[13] | Crema M, Verbano C. Simulation modelling and lean management in healthcare: First evidences and research agenda. Total Quality Management & Business Excellence. (2021) ; 32: (3/4): 448–466. |
[14] | Azcarate C, Esparza L, Mallor F. The problem of the last bed: contextualization and a new simulation framework for analyzing physician decisions. Omega. (2020) ; 96. |
[15] | Kitchener M, Beynon M, Harrington C. Explaining the diffusion of medicaid home care waiver programs using VPRS decision rules. Health Care Management Science. (2004) ; 7: (3): 237–244. |
[16] | Jung K, Feldman R. Public reporting and market area exit decisions by home health agencies. Medicare & Medicaid Research Review. (2012) ; 2: (4): E1–E18. |
[17] | Darabi N, Hosseinichimeh N. System dynamics modeling in health and medicine: A systematic literature review. System Dynamics Review. (2020) ; 36: (1): 29–73. |
[18] | Melnick GA, Shen YC, Wu VY. The increased concentration of health plan markets can benefit consumers through lower hospital prices. Health Affairs. (2011) ; 30: (9): 1728–1733. |
[19] | McPake B, Hanson K, Adam C. Two-tier charging strategies in public hospitals: Implications for intra-hospital resource allocation and equity of access to hospital services. Journal of Health Economics. (2007) ; 26: (3): 447–462. |
[20] | Meskens N, Duvivier D, Hanset A. Multi-objective operating room scheduling considering desiderata of the surgical team. Decision Support Systems. (2013) ; 55: (2): 650–659. |
[21] | Ganguly S, Lawrence S, Prather M. Emergency department staff planning to improve patient care and reduce costs. Decision Sciences. (2014) ; 45: (1): 115–145. |
[22] | Bai J, Fügener A, Schoenfelder J, Brunner JO. Operations research in intensive care unit management: A literature review. Health Care Management Science. (2018) ; 21: (1): 1–24. |
[23] | Bai J, Fügener A, Gönsch J, Brunner JO, Blobner M. Managing admission and discharge processes in intensive care units. Health Care Management Science. (2021) ; 24: (4): 666–685. |
[24] | Santos JR, Herrera LC, Yu KD, Pagsuyoin SA, Tan RR. State of the art in risk analysis of workforce criticality influencing disaster preparedness for interdependent systems. Risk Analysis: An International Journal. (2014) ; 34: (6): 1056–1068. |
[25] | Melman GJ, Parlikad AK, Cameron EA. Balancing scarce hospital resources during the COVID-19 pandemic using discrete-event simulation. Health Care Management Science. (2021) ; 24: (2): 356–374. |
[26] | Apornak A. Human resources allocation in the hospital emergency department during covid-19 pandemic. International Journal of Healthcare Management. (2021) ; 14: (1): 264–270. |
[27] | Federici C, Torbica A. Expanding the role of early health economic modelling in evaluation of health technologies: Comment on ‘problems and promises of health technologies: The role of early health economic modeling’. International Journal of Health Policy & Management. (2021) ; 10: (2): 102–105. |
[28] | Jennex M, Raman M. Knowledge management in support of crisis response. Int. J. of Information Systems for Crisis Response and Management. (2009) ; 1: (3): 69–83. |
[29] | Sachdeva S, Iliev R, Ekhtiari H, Dehghani M. The role of self-sacrifice in moral dilemmas. Plos One. (2015) . doi: 10.1371/journal.pone.0127409. |
[30] | CDC, Center for Disease Control and Prevention. Hospitalization and death by age group. (2021) [cited 2021 March 15]. https://www.cdc.gov/coronavirus/2019-ncov/covid-data/investigations-discovery/hospitalization-death-by-age.html. |
[31] | Simon HA. Models of bounded rationality: empirically grounded economic reason. (1997) ; 3. MIT press. |
[32] | Simon HA. Bounded rationality in social science: today and tomorrow. Mind & Society. (2000) ; 1: : 25–39. |
[33] | Klein E. How America’s covid-19 nightmare ends. NY Times. (2021) [cited 2021 March 15]. https://www.nytimes.com/2021/03/12/opinion/ezra-klein-podcast-ashish-jha.html. |
[34] | Miller HE, Engemann KJ. Exploiting risk using a comfort-based approach. In: Safety Risk Management: Integrating Economic and Safety Perspectives (ed. Engemann and Abrahamsen) Berlin, Boston: De Gruyter Oldenbourg, (2020) : 1–18. |
[35] | Eyres H. How coronavirus has led to the return of the precautionary principle. New Statesman. (2020) [cited 2021 March 15]. https://www.newstatesman.com/international/2020/04/how-coronavirus-has-led-return-precautionary-principle. |
[36] | Engemann KJ, Miller HE. Risk strategy and attitude sensitivity. Cybernetics and Systems. (2015) ; 46: (3): 188–206. |
[37] | Yager RR. Generalized regret based decision making. Engineering Applications of Artificial Intelligence. (2017) ; 65: : 400–405. |
[38] | Engemann KJ, Yager RR. Comfort decision modeling. International Journal of Uncertainty, Fuzziness and Knowledge-Based Systems. (2018) ; 26: (Suppl. 1): 141–163. |
[39] | Yager RR. On ordered weighted averaging aggregation operators in multicriteria decision making. IEEE Transactions on Systems, Man and Cybernetics. (1988) ; 18: : 183–190. |
[40] | Engemann KJ, Miller HE, Yager RR. Decision making with belief structures: An application in risk management. International Journal of Uncertainty, Fuzziness, and Knowledge-Based Systems. (1996) ; 4: (1): 1–25. |
[41] | Yager RR. Quantifier guided aggregation using OWA operators. International Journal of Intelligent Systems. (1996) ; 11: : 49–73. |
[42] | Engemann KJ, Miller HE, Yager RR. Decision making with attitudinal based expected values. International Journal of Technology, Policy and Management. (2004) ; 4: (4): 353–365. |
[43] | Miller HE, Engemann KJ. The precautionary principle and unintended consequences. Kybernetes. (2019) ; 48: (2): 265–286. |


