
Research on community evolution based on node influence and multi-attribute fusion
Abstract
For the problem of low discrimination accuracy of evolutionary events in dynamic social networks, a community evolution model (EMNI) based on node influence and multi-attribute fusion is proposed. Firstly, the topological structure information of nodes is obtained by random walk and local clustering coefficient, and the influence of nodes is evaluated according to the topological structure of nodes. Secondly, in order to improve the accuracy of discriminating community similarity, a community similarity discrimination method based on multi-attribute fusion is proposed. The model EMNI combined the characteristics of community stability and community difference, and redefined seven evolutionary events. Finally, the effectiveness of the EMNI model in identifying community evolution events is verified on different data sets. The experimental results show that the EMNI model is better than GED, PECT and SGCI, which is able to identify more evolutionary events and the distribution of events is also more balanced.
1.Introduction
The community evolution refers to changes such as the merging, splitting and forming of virtual communities in social networks. The events that may occur over time in virtual communities in the network will lead to dynamic evolution of the structure of virtual communities [1]. Therefore, how to effectively improve the accuracy of identifying community evolution events and evolution paths is of great value to the application of implied group structure analysis and public opinion early warning in social networks. For example, in a disease transmission network, by identifying and tracking multiple affected communities and analyzing the characteristics of communities with high prevalence, trends in disease transmission can be effectively predicted and epidemic prevention and control preparations can be made in advance. In the E-commerce platform network, through the evolution trend of community structure between online buyers and commodities to predict the buyers of different commodities to purchase degree, to achieve the purpose of formulating the corresponding supply strategy. In the rumor information transmission network, the social influence brought by rumor transmission can be reduced by analyzing the propagation rules of topics, predicting the spreading trend of topics and taking effective measures in time.
As an important problem in dynamic social network analysis, the relevant methods of community evolution can be divided into three categories: community evolution analysis algorithm based on point coincidence degree, edge coincidence degree and core node. Among them, the idea based on point coincidence degree is to cut the dynamic network into a series of static time slice networks, use the community detection algorithm to identify the community structure in the time slice network, and distinguish the evolutionary events between communities in the adjacent time slice [2, 3]. The idea of edge coincidence degree is that the influence of edges on the internal topology of communities is considered. Firstly, the network community structure of different time slices is found by using relevant methods, and then the evolutionary relationship is determined by searching the maximum edge coincidence degree between communities at different time points on the time axis [4, 5]. The idea of the core node is to discover the core node of the community by detecting the continuous and stable connection between nodes, and at the same time track the evolution path of the community structure with the incremental calculation method [6, 7, 8].
Although the above research has achieved a good application effect, there are still the following problems that make the low accuracy of similar community identification results:
(1) The discriminant method based on similarity is to compare communities at the macro level of the overall community structure, ignoring the internal structure characteristics of communities;
(2) The influence of the fusion of network topology and node attributes on the recognition results is ignored.
In order to solve the above problems, the similarity between communities from the perspective of the internal topology is evaluated, the obtained community topology with the calculation process of node influence is combined, and the similarity between communities from the two aspects of community stability and community difference is judged. Therefore, an evolution model EMNI based on node influence is proposed in this paper. The model can effectively improve the accuracy of identifying community evolution events and provide a basis for the subsequent research on community structure evolution prediction. The contributions of this paper are as follows:
(1) Taking dynamic complex network as the research object, a community similarity measurement formula based on node influence and multi-attribute fusion is defined. Combining the traditional community evolution event detection algorithm and similarity measurement definition, an improved community event detection model EMNI is proposed. The identification methods of seven community evolution events: Forming, Dissolving, Growing, Shrinking, Splitting, Merging and Continuing are redefined to improve community evolution events accuracy that are more consistent with real network conditions.
(2) According to the characteristics that community evolution is the change of community structure, a node influence calculation method based on network topology structure is proposed, and the similarity between communities is measured by integrating multiple attributes. The method has the characteristics of considering both the community stability and the community difference in the process of community similarity measurement.
(3) It is verified that the EMNI model improve the accuracy of identifying community evolution events on different data sets. Compared with other community evolution models, it can detect more balanced community evolution events and has better ability of community evolution detection.
2.Related works
In recent years, with the in-depth research on community evolution, similarity determination, as the main method of community evolution identification, has obtained different research results. Yu et al. [9] based on community similarity, introduced community activity parameters and discriminated evolutionary events by combining similarity and activity. Yang et al. [10] analyzed the similarity between communities by Jaccard coefficient, and studied the evolutionary characteristics of users in social networks by analyzing the characteristics of individuals newly added to communities. Chen et al. [11] proposed a community detection algorithm based on dynamic mechanism, which defined the similarity between nodes and clustered them into different evolutionary communities according to the evolution of node states over time. Nie et al. [12] studied the relationship between the stability of network structure and dimension during the evolution of emergencies, obtained the implied time features in the network according to the Jaccard correlation dimension, and verified the relationship between phase changes of emergencies and Jaccard distance matrix. Kaveh et al. [13] proposed a new mapping based community evolution identification method ICEM and tracking the different transformation characteristics of communities over time. This method maps each node to a
In the evolution of community structure, the characteristics of key nodes can influence the evolution events. Therefore, many scholars have combined the characteristics of core nodes with similarity determination to study community evolution. Dhouiou et al. [14] determined the category of evolutionary events by defining and analyzing the changes of core nodes. Karan et al. [15] described the evolution process of community topological structure based on the intensity and frequency of interaction between nodes and the degree of overlap between different communities. Wang et al. [16] proposed a dynamic overlapping community evolution recognition algorithm based on topological potential field, and tracked community evolution events based on changes of core nodes in the topological potential field. Yang et al. [17] judged the differences between communities according to the core vertex set, and studied the types of community evolution from two aspects of similarity and difference. Feng et al. [18] proposed a community similarity discrimination method combining deep learning with core nodes to study community evolution and prediction.
In order to improve the accuracy of identifying community evolution events, many scholars proposed the method of constructing community evolution framework or evolution model for different applications. Zhang et al. [19] proposed an improved event framework, defined various evolutionary events based on the framework, studied the community structure and community evolutionary events on prediction models of different evolutionary events, and achieved good results in advertising recommendation and public opinion guidance. Narimene et al. [20] divided the dynamic network into a series of time frames and discussed how to select an appropriate network segmentation scale to improve the accuracy of evolutionary prediction. Experiments with the proposed framework on Facebook and Higgs Twitter datasets verify the role of network fragmentation events in predicting community evolution. Yu et al. [21] converted the three tasks of sequential community detection, evolution analysis and link prediction into a unified framework and extracted the evolution pattern, and an evolution model framework based on orthogonal nonnegative matrix factorization was proposed to analyze and predict the time-varying structure of dynamic networks from local and global perspectives. Experiments on real and artificial networks verify the advantages of the proposed framework in dynamic network analysis tasks. Ye et al. [22] introduced the balanced label propagation algorithm (BLPA) to solve the problems of fragmented topic evolution and insufficient network evolution in specific DBLP data sets, and extracted mobile author nodes and corresponding community topics, as well as mobile author node topics based on community discovery. Using the research method of vertical theme distribution and horizontal theme evolution, the interactive mechanism and law of theme evolution and structure evolution were analyzed. Qiao et al. [23] proposed an evolutionary analysis framework based on strong and weak events for the lack of consideration of “weak events” occurring in small communities in community evolution events. The framework proposed the constraints of “weak contraction”, “weak expansion”, “weak merge” and “weak split”, and verified the feasibility of the framework. Yu et al. [24] proposed an evolutionary Bayesian non-negative matrix decomposition model (EvoBNMF) to analyze the community structure with evolutionary characteristics. By introducing evolutionary behavior, the model quantified the transition intensity of the community between adjacent snapshots and verified the performance advantages of the method in sequential community detection. Etienne et al. [25] analyzed the shortcomings of modeling and forecasting methods for critical events, designed a sliding window analysis method based on the historical information of community changes, and proposed a model to simulate the evolution of community structure by using autoregressive mode. In addition, by analyzing the structural characteristics, network scale and temporal characteristics of social networks, and combining with the historical information of community evolution events, a framework based on supervised learning was proposed to identify and track evolution events, which can effectively improve the accuracy of community evolution prediction [26, 27].
In conclusion, the existing research method based on similarity or evolutionary framework which ignored the study of community evolution from the micro level, therefore, “structural characteristics combined with node properties”, that is, mining global characteristics and local characteristics of community structure, and integrating the core node attributes to study the community evolution is proposed in this paper, to improve recognition accuracy of evolutionary events.
3.Community similarity discrimination method based on multi-attribute fusion
To analyze the evolution of the community of the dynamic network, an appropriate time window according to the data interval and the collection duration is selected, and the time slice processing for the dynamic network is cut. Then, for each time slice, Louvain [28]community discovery algorithm and the similarity comparison strategy to compare the similarity of adjacent time slice communities are adopted. Finally, the evolutionary events are identified by event detection algorithm.
A dynamic network is considered as a collection of a series of static networks, which is divided into static networks according to time slices, so the dynamic network is expressed as
3.1Node influence attribute calculation
The Jaccard coefficient is widely adopted to evaluate the similarity of two communities. The Jaccard coefficient neglects the network topology, so the accuracy of the identified evolution event results is poor. Therefore, the node influence attribute calculation is proposed based on node topological structure, is shown in Eq. (1).
(1)
Where
3.2Evaluate community similarity based on incorporating multi-attribute indicators
The similarity between communities is evaluated from the two aspects of community stability and difference. The community stability is described as the proportion of nodes shared by two communities, the formula of community stability is shown in Eq. (2).
(2)
The community difference is the change degree of node influence of both communities. The community difference degree is shown in Eq. (3).
(3)
Where
The similarity calculation combines the stability and difference of the community. When the stability of two communities greater than or equal to the threshold
(4)
Because community evolution is to research the evolution law of community structure, the node influence attribute can fully calculate the nodes influence through the topological structure information of nodes, the similarity discrimination integrates the stability and difference of the community. Therefore, the community evolution based on multi-attribute fusion and nodes influence attribute can identify evolutionary events more accurately.
3.3Algorithm description
The similarity between communities on adjacent time slices is evaluated according to community stability and difference, the pseudo-code is described in Algorithm 1.
[h] Community Similarity Assessment [1] Input: Community structure
4.Community evolution model EMNI
4.1 Redefine community evolution events
Seven evolution events are used to describe the evolutionary relationship of communities between adjacent time slices. Due to changes in the actual small proportion in the community will not affect the community, the node change degree is defined, that is, when the proportion of community nodes increasing or decreasing can be ignored, the community is considered to remain unchanged. When the percentage of community nodes increasing or decreasing exceeds a certain value, the community is considered to have changed. The node change degree is shown in Eq. (5).
(5)
The community evolution model EMNI redefines seven evolutionary events: Continuing, Growing, Shrinking, Splitting, Merging, Dissolving and Forming.
1. Continuing
For community
(6)
2. Growing
For community
(7)
3. Shrinking
For community
(8)
[b] : Evolution Model Based on Nodal Influence and Multi-attribute Fusion[1] Input: Community structure
4. Splitting
For community
(9)
5. Merging
For multiple communities
(10)
6. Dissolving
For community
(11)
7. Forming
For community
(12)
4.2Algorithm description
Based on the community similarity discrimination method of multi-attribute fusion, the specific process of EMNI model implementation is proposed, and the pseudo-code is described in Algorithm 2.
5.Experimental results and analysis
The three experimental data sets are selected, and the social network graph formed by the experimental data sets is used to conduct experiments on the EMNI model. The effects of EMNI model on identifying various evolutionary events in different data sets are discussed. In order to verify the validity of the EMNI model, which is compared with three representative community evolution algorithms. The open source real dynamic network datasets are as follows:
(1) Hepth data comes from Arxiv, and the data set covers a total of 27770 papers and 352,807 papers in reference relationship. Each node in the data set represents a paper, and each edge represents the reference relationship between two papers. Three years of Hepth data are selected and divided into 12 consecutive time snapshots in a 3-month time window.
(2) The Enron email data set is a 32-month email communication record of Enron employees. Each node represents an employee’s email address, and each edge represents an email communication between two employees. The data of 12 months are selected and divided into 12 continuous time snapshots with one month as a time window. The specific information of the data set used in the experiment is shown in Table 1.
(3) Bitcoin data is a trust network for Bitcoin transactions, designed to prevent fraud and high-risk transactions. Each node in the data set represents a user, and each edge represents a trust score between users. According to the time of trust level evaluation, the data set is divided into 30 time slices with three month as a time window, and there is one month’s data overlap between adjacent time slice data.
In order to reduce the influence of noise and ensure the validity of identification results of community evolution. The community with less than 3 nodes was deleted.
Table 1
Experimental data information
| Data set | Total number of nodes | Total number of edges | Time period length |
|---|---|---|---|
| Hepth | 10550 | 74896 | 36 months |
| Enron | 30725 | 156764 | 12 months |
| Bitcon | 3775 | 35512 | 61 months |
5.1Community division results
The time window division of dynamic network data requires community discovery of each time slice network. The community division results of Hepth, Enron and Bitcon datasets are as Fig. 1.
Figure 1.
Community division results.
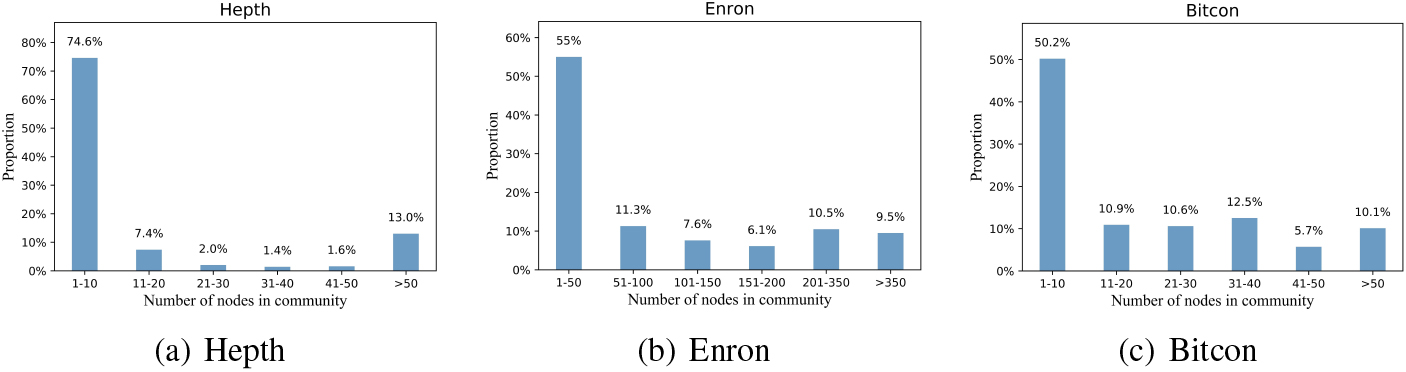
As can be seen from the results of community division, most communities in Hepth data set are small communities with less than 10 nodes, accounting for 74.6%, while communities with more than 50 nodes account for 13%, which is a representative small community data set. In Enron’s data set, 55% of communities have 1–50 nodes, 33.5% have 51–350 nodes, and 9.5% have more than 350 nodes, which represent large community datasets. The number of community scale of the Bitcoin data set is between the Hepth data set and the Enron data set. It can be seen from Figure 1, the data sets selected have different scales and different node distribution characteristics, which can better verify the evolution characteristics in different data sets.
5.2Classification results of community evolution
In EMNI evolution model, the parameter
5.2.1Hepth data set
Set the value range of parameter
Figure 2.
The influence of parameters
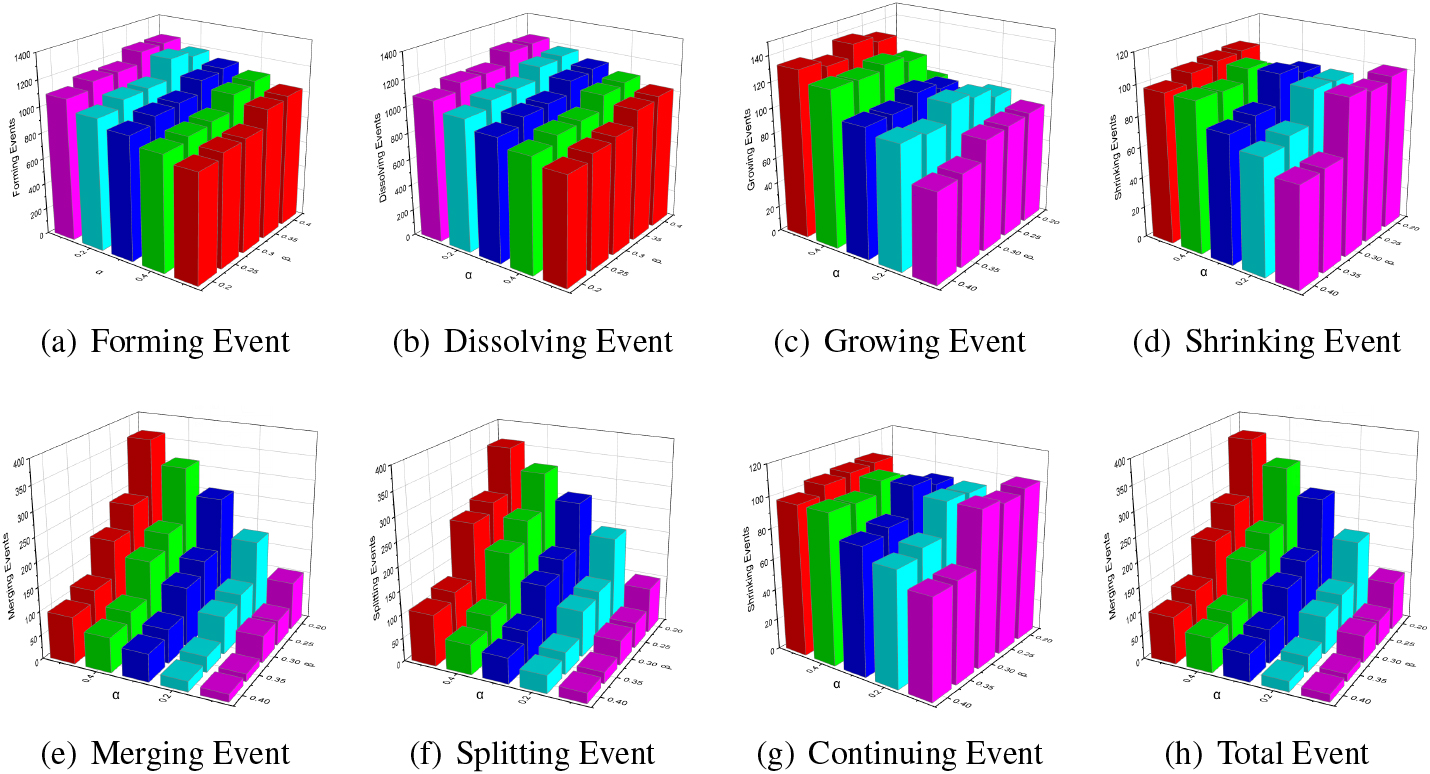
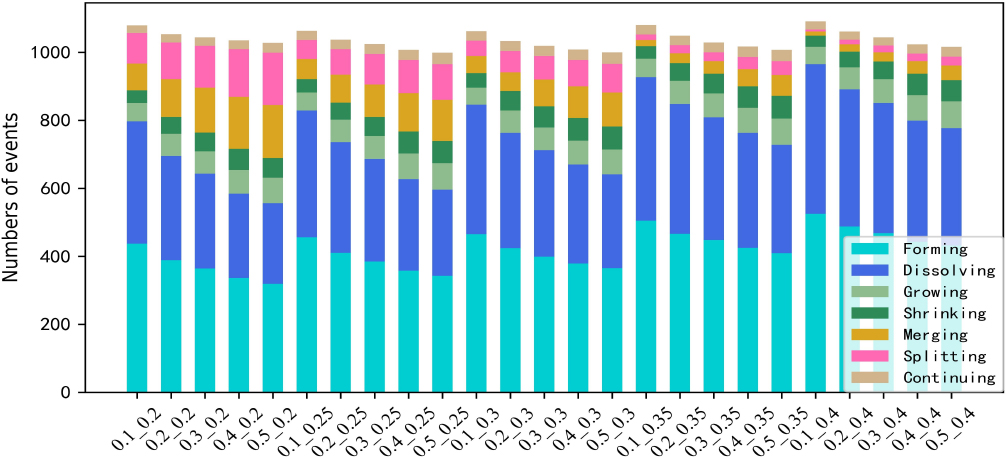
Figure 3.
Stack diagram of event effects of different parameters.
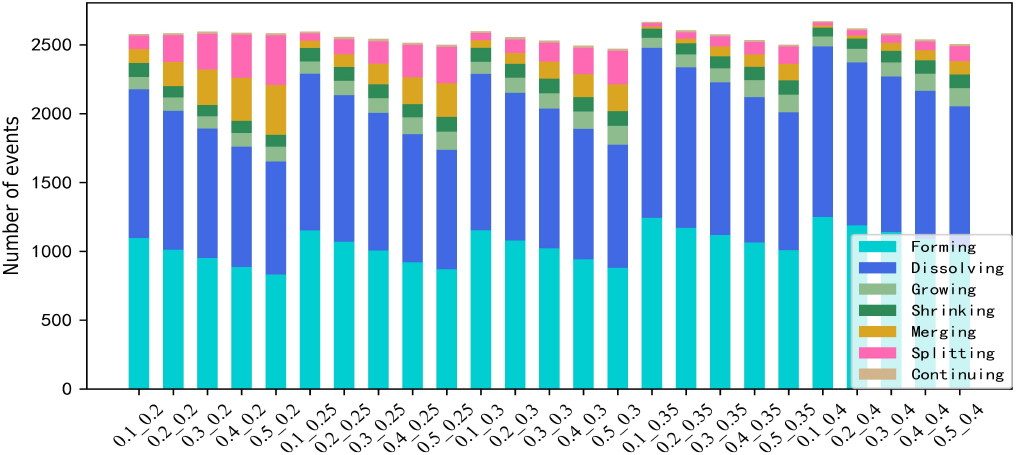
The number of evolutionary events in different parameter values is shown in Table 2. As the increases of parameter
Table 2
Number of evolution events under different parameter values
|
|
| Forming | Dissolving | Growing | Shrinking | Merging | Splitting | Continuing | Total |
|---|---|---|---|---|---|---|---|---|---|
| 0.1 | 0.2 | 1096 | 1081 | 90 | 101 | 101 | 97 | 13 | 2579 |
| 0.2 | 0.2 | 1012 | 1009 | 97 | 82 | 176 | 194 | 15 | 2585 |
| 0.3 | 0.2 | 951 | 941 | 89 | 83 | 256 | 260 | 17 | 2597 |
| 0.4 | 0.2 | 886 | 875 | 98 | 89 | 312 | 314 | 15 | 2589 |
| 0.5 | 0.2 | 832 | 820 | 108 | 86 | 363 | 360 | 16 | 2585 |
| 0.1 | 0.25 | 1152 | 1138 | 89 | 98 | 53 | 54 | 13 | 2597 |
| 0.2 | 0.25 | 1070 | 1064 | 105 | 100 | 93 | 108 | 18 | 2558 |
| 0.3 | 0.25 | 1006 | 1000 | 106 | 101 | 150 | 163 | 18 | 2544 |
| 0.4 | 0.25 | 920 | 931 | 122 | 96 | 196 | 235 | 15 | 2515 |
| 0.5 | 0.25 | 870 | 867 | 133 | 107 | 245 | 263 | 16 | 2501 |
| 0.1 | 0.3 | 1153 | 1136 | 88 | 101 | 56 | 52 | 13 | 2599 |
| 0.2 | 0.3 | 1079 | 1073 | 109 | 101 | 79 | 98 | 18 | 2557 |
| 0.3 | 0.3 | 1022 | 1015 | 111 | 106 | 124 | 137 | 17 | 2532 |
| 0.4 | 0.3 | 942 | 947 | 127 | 105 | 165 | 192 | 17 | 2495 |
| 0.5 | 0.3 | 880 | 894 | 138 | 106 | 195 | 243 | 16 | 2472 |
| 0.1 | 0.35 | 1244 | 1234 | 73 | 66 | 16 | 24 | 10 | 2667 |
| 0.2 | 0.35 | 1171 | 1165 | 95 | 80 | 33 | 47 | 16 | 2607 |
| 0.3 | 0.35 | 1118 | 1109 | 103 | 87 | 71 | 74 | 15 | 2577 |
| 0.4 | 0.35 | 1064 | 1056 | 123 | 97 | 91 | 90 | 14 | 2535 |
| 0.5 | 0.35 | 1008 | 1002 | 128 | 104 | 120 | 125 | 14 | 2501 |
| 0.1 | 0.4 | 1250 | 1239 | 71 | 65 | 16 | 22 | 9 | 2672 |
| 0.2 | 0.4 | 1189 | 1184 | 98 | 75 | 22 | 38 | 14 | 2620 |
| 0.3 | 0.4 | 1140 | 1130 | 103 | 83 | 58 | 55 | 15 | 2584 |
| 0.4 | 0.4 | 1090 | 1076 | 124 | 98 | 73 | 64 | 15 | 2540 |
| 0.5 | 0.4 | 1029 | 1024 | 133 | 98 | 98 | 109 | 15 | 2506 |
In order to verify the effect of identifying evolutionary events, the evolutionary event classification results obtained by EMNI model are compared with GED [29], PCET [30] and SGCI [31] models, and the parameters used in the comparison model are determined according to the optimal parameters given in the original experiment. The balanced of event distribution and the number of identified communities are used to compare and analyze different models. The experimental results are shown in Table 3.
Table 3
Comparison of evolution results of Hepth data set
| Model | Forming | Dissolving | Growing | Shrinking | Merging | Splitting | Continuing | Total |
|---|---|---|---|---|---|---|---|---|
| EMNI | 880 | 894 | 138 | 106 | 195 | 243 | 16 | 2472 |
| GED | 854 | 848 | 93 | 21 | 10 | 4 | 1 | 1831 |
| PCET | – | 1126 | 129 | 75 | 52 | 36 | 38 | 1456 |
| SGCI | – | 90 | 64 | 33 | 119 | 110 | 6 | 422 |
In terms of the number of communities identified, compared with the other three models, EMNI can identify more evolutionary events, 26%, 41% and 83% more than GED, PECT and SGCI models, respectively. In particular, it is superior to other models in the identification of Growing, Shrinking, Merging, Splitting and Continuing events. The reason is that ENMI model, when discriminating the similarity between communities, combines the internal structure characteristics of communities with the attribute characteristics of nodes from the micro level, and obtains more node structure information through DeepWalk.
In terms of the balanced of event distribution, different combinations of evolutionary events are randomly selected to verify their distribution equilibrium, and the optimal distribution equilibrium of various combinations of evolutionary events is discussed for comparison by many experiments. As can be seen from Table 3, the PECT model and SGCI model do not define Forming events, and the proportion of Continuing events identified in the continuous time slice is small in the four models. In additional, the SGSI model only identifies stable communities, that is, only the communities that appear continuously in more than three time slices are analyzed, the Dissolving events identified are far smaller than other models. Taking four combinations of Growing, Shrinking, Merging and Splitting for example, the proportion distribution among the identified evolutionary events is shown in Fig. 4.
Table 4
Number of evolution events under different parameter values
|
|
| Forming | Dissolving | Growing | Shrinking | Merging | Splitting | Continuing | Total |
|---|---|---|---|---|---|---|---|---|---|
| 0.5 | 0.2 | 319 | 237 | 75 | 58 | 156 | 154 | 29 | 1028 |
| 0.5 | 0.25 | 343 | 253 | 78 | 65 | 121 | 105 | 34 | 999 |
| 0.5 | 0.3 | 365 | 276 | 73 | 68 | 100 | 84 | 34 | 1000 |
| 0.5 | 0.35 | 409 | 319 | 77 | 67 | 61 | 41 | 33 | 1007 |
| 0.5 | 0.4 | 432 | 345 | 79 | 62 | 43 | 26 | 29 | 1016 |
Figure 4.
The result of the event distribution.
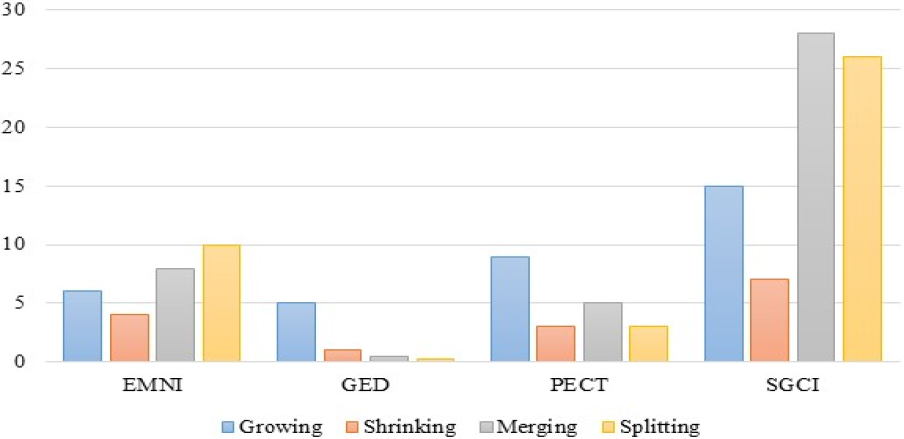
As can be seen from Fig. 4, GED model has poor performance in the identification effect of evolutionary events and the balanced of event distribution in networks with many small communities. PCET model has a good effect on the identification of Continuing events, but identify fewer Merging and Splitting events. The reason is that PCET model considers the community variability in the identification of Continuing events, but considers the number of the same nodes in the two communities in the identification of community similarity. The SGCI model is poor in identifying Dissolving events in communities with more instabilities in the data set. Compared with other models, EMNI model has obvious advantages in identifying the balanced distribution and the number of evolutionary events.
5.2.2Enron data set
In the Enron data set, the settings of parameters
Figure 5.
The influence of parameters
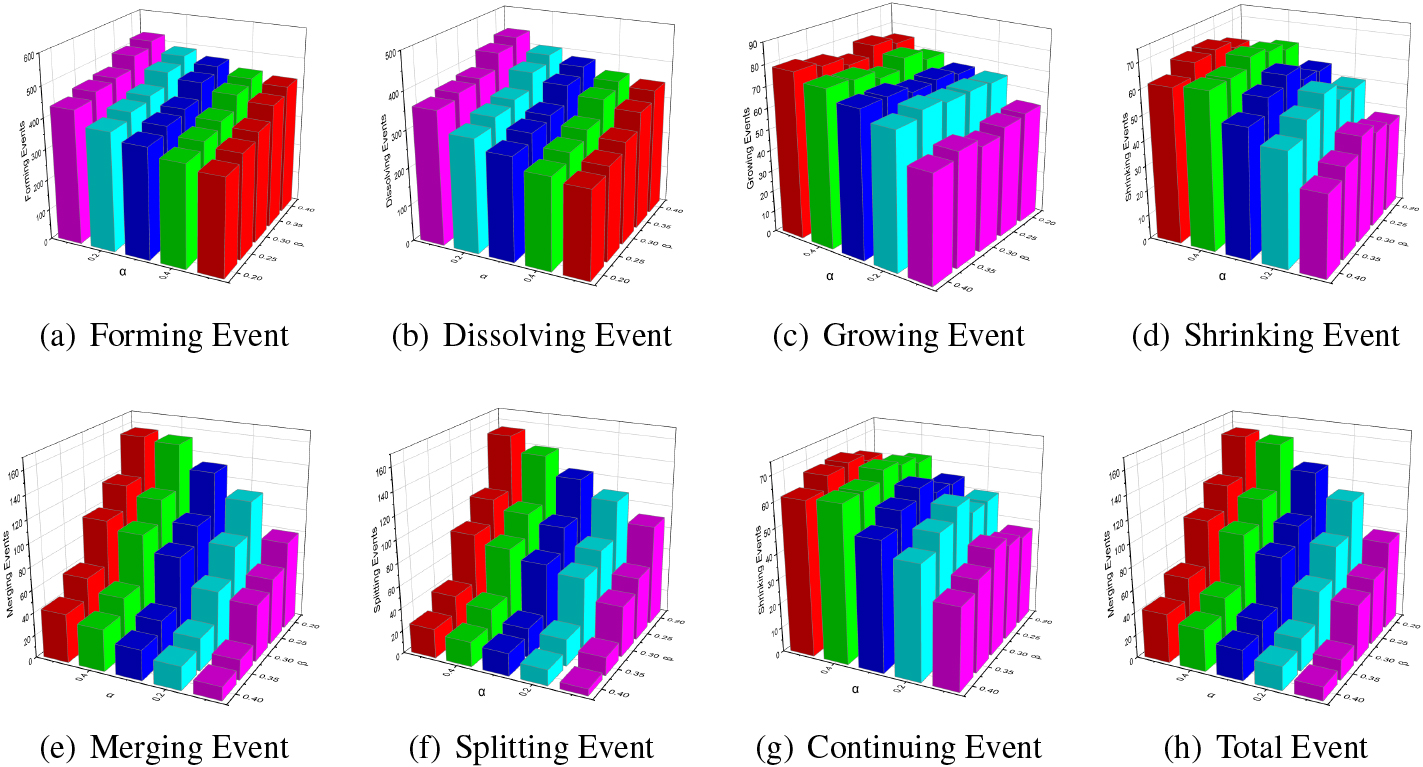
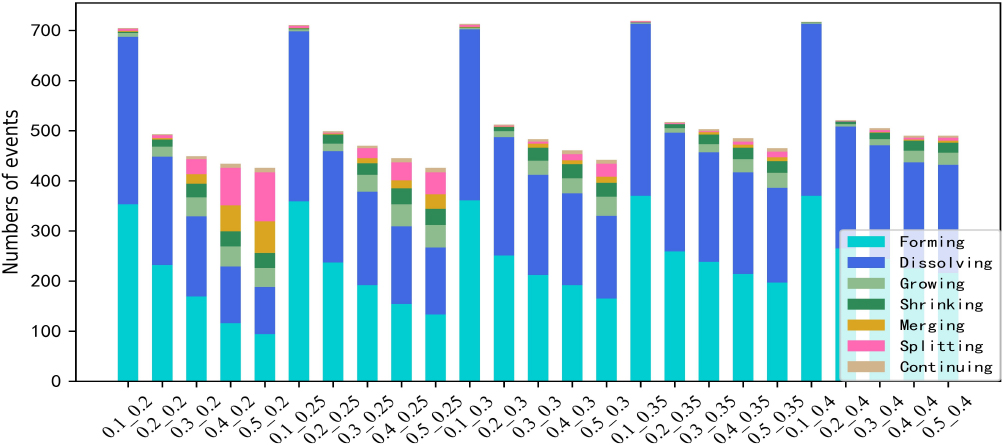
Figure 6.
Stack diagram of event effects of different parameters.
It can be seen from Table 5, the community evolution model EMNI recognizes more evolutionary events, and the distribution of the recognized events is relatively balanced. GED model has poor identification effect on Merging, Splitting and Continuing events. The performance of the PECT model on the Enron data set is similar to the Hepth data set. It can better identify other evolutionary events, but it is less effective in the recognition of Merging and Splitting events. The SGCI model is used to identify the stable communities lasting more than three time slices. It can be seen that the communities in the data set change rapidly, and more communities do not continue to exist in the dynamic network. There, SGCI model has the poor performance in identifying the balanced distribution and the number of evolutionary events.
Table 5
Comparison of evolution results of Enron data set
| Model | Forming | Dissolving | Growing | Shrinking | Merging | Splitting | Continuing | Total |
|---|---|---|---|---|---|---|---|---|
| EMNI | 365 | 276 | 73 | 68 | 100 | 84 | 34 | 1000 |
| GED | 345 | 259 | 51 | 42 | 4 | 2 | 15 | 718 |
| PCET | – | 325 | 97 | 65 | 22 | 24 | 50 | 583 |
| SGCI | – | 61 | 51 | 42 | 23 | 16 | 11 | 227 |
5.2.3Bitcon data set
In Bitcon data set, the value range of parameter
Table 6
Number of evolution events under different parameter values
|
|
| Forming | Dissolving | Growing | Shrinking | Merging | Splitting | Continuing | Total |
|---|---|---|---|---|---|---|---|---|---|
| 0.5 | 0.2 | 94 | 94 | 9 | 38 | 30 | 63 | 98 | 426 |
| 0.5 | 0.25 | 133 | 134 | 9 | 45 | 32 | 29 | 44 | 426 |
| 0.5 | 0.3 | 165 | 165 | 8 | 38 | 28 | 12 | 26 | 442 |
| 0.5 | 0.35 | 197 | 189 | 7 | 30 | 23 | 8 | 11 | 465 |
| 0.5 | 0.4 | 216 | 216 | 4 | 24 | 20 | 4 | 6 | 490 |
Figure 7.
The influence of parameters
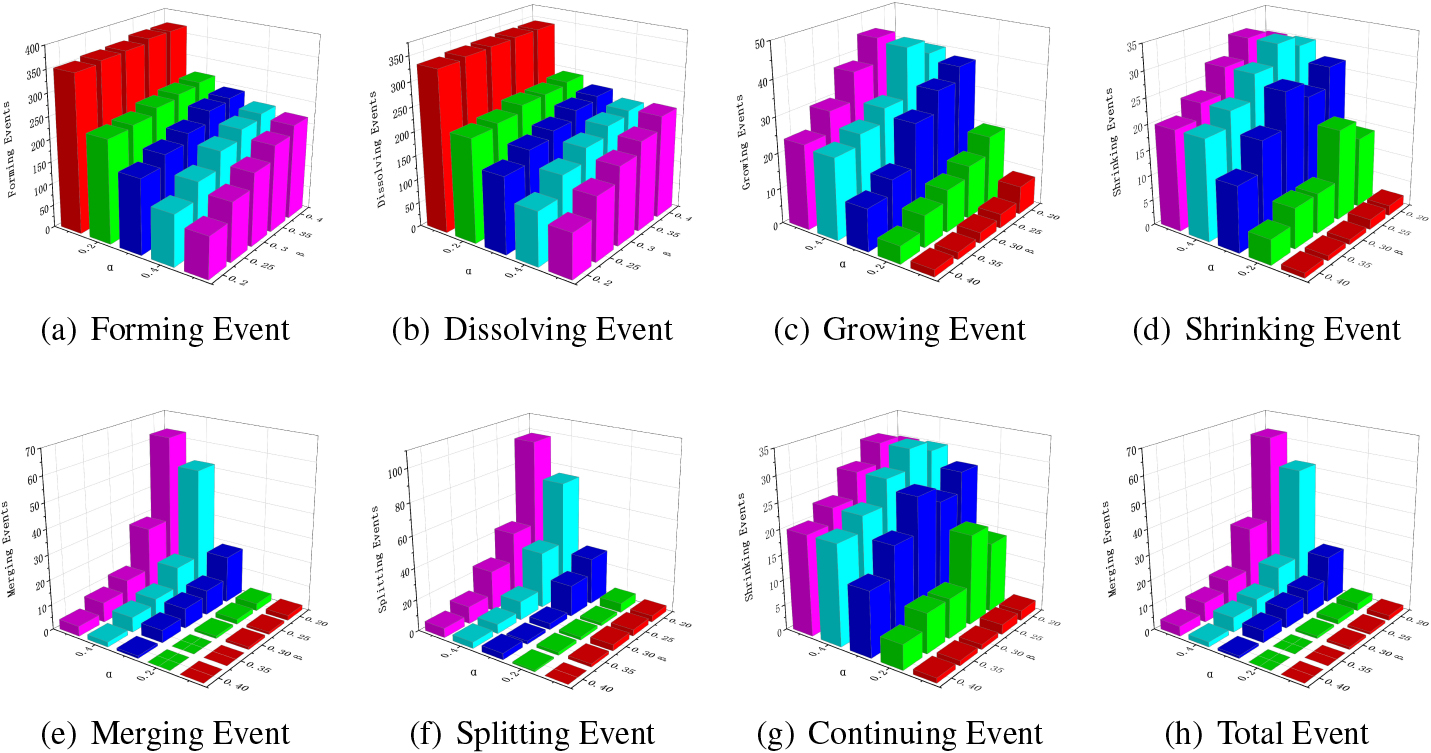
Table 7
Comparison of evolution results of Bitcon data set
| Model | Forming | Dissolving | Growing | Shrinking | Merging | Splitting | Continuing | Total |
|---|---|---|---|---|---|---|---|---|
| EMNI | 133 | 134 | 9 | 45 | 32 | 29 | 44 | 426 |
| GED | 190 | 192 | 21 | 15 | 0 | 2 | 5 | 425 |
| PCET | – | 223 | 49 | 31 | 16 | 23 | 30 | 372 |
| SGCI | – | 192 | 15 | 15 | 0 | 0 | 5 | 227 |
Figure 8.
Stack diagram of event effects of different parameters.
In summary, EMNI model has achieved good results in data sets with different data distributions and scale. The similarity discrimination method, which combines the internal structure of community with node attributes, improves the identification accuracy and the balance of event distribution of community evolution events.
6.Conclusion
In order to improve the identification accuracy of community evolutionary events, an evolutionary event detection model EMNI that combines node attribute information with community internal structure features is proposed in this paper. Firstly, the influence of nodes is evaluated based on topological structure of nodes, and the relationship between local clustering coefficient of nodes and influence of nodes is discussed. Secondly, the similarity between communities is calculated by multi-attribute fusion of community stability and difference, and the relationship between the threshold of stability and difference is analyzed, as well as the influence on the evolution process of communities. Finally, seven types of evolutionary events in the EMNI model are redefined and described based on the similarity discrimination formula between communities. Verification on real data sets shows that: (1) Compared with other models, ENMI model can improve the identification accuracy of community evolution events and the distribution balance of community evolution events, which accords with the results of real community evolution events; (2) The community evolution events identified by the threshold parameters of community stability and difference are different.
By setting the optimal threshold parameters reflecting the community structure and node attribute characteristics, the combination of multi-attribute fusion community internal structure and node characteristics can improve the accuracy of similarity determination between communities is verified from the micro level, and a basis for accurately identifying the evolution events between communities provided in this paper. Since community evolution events may occur in different dimensions and non-adjacent event slices, it is the future work to identify the evolution events occurring in communities between non-adjacent time slices, extract and analyze the characteristics of different dimensions in the process of community evolution, and predict the evolution trends.
Acknowledgments
This research was supported by National Natural Science Foundation of China (No. 62172352, No.61871465, No. 42002138), the Central Government Guides Local Science and Technology Development Fund Projects (Grant No. 226Z0102G, No. 226Z0305G), Natural Science Foundation of Hebei Province (Grant No. 2022203028).
References
[1] | B.X. Fang, J. Xu and J.H. Li, Online Social Network Analysis, Beijing: Publishing House of Electronics Industry, (2014) . |
[2] | K.K. Mohammadmosaferi and H. Naderi, AFIF: Automatically Finding Important Features in community evolution prediction for dynamic social networks, Computer Communications 176: (1) ((2021) ), 66–80. |
[3] | N. Ilhan and S.G. Oegueduecue, Feature identification for predicting community evolution in dynamic social networks, Engineering Applications of Artificial Intelligence 55: (10) ((2016) ), 202–218. |
[4] | J. Ge, L.L. Shi, L. Liu and H. Shi, Edge intelligence-enabled dynamic overlapping community discovery and evolution prediction in social media data streams, Concurrency and Computation: Practice and Experience, (2021) . |
[5] | N. Choudhury, F. Faisal and M. Khushi, Mining temporal evolution of knowledge graphs and genealogical features for literature-based discovery prediction, Journal of Informetrics 14: (3) ((2020) ), 101057. |
[6] | W. Li et al., Evolutionary community discovery in dynamic social networks via resistance distance, Expert Systems with Applications 171: ((2021) ), 114536. |
[7] | W. Zhao, J. Luo, T. Fan, Y. Ren and Y. Xia, Analyzing and visualizing scientific research collaboration network with core node evaluation and community detection based on network embedding, Pattern Recognition Letters 144: (10) ((2021) ), 54–60. |
[8] | Z. Wang et al., Tracking the evolution of overlapping communities in dynamic social networks, Knowledge-Based Systems 157: (10) ((2018) ), 81–97. |
[9] | H. Yu, L. Jin, B. Zhou, B. Xiao and X. Zeng, An event-based approach to overlapping community evolution by three-way decisions, in: IEEE International Conference on Big Data Analysis, (2017) , pp. 772–778. |
[10] | K. Yang, Q. Guo, S. Li, J. Han and J. Liu, Evolution properties of the community members for dynamic networks, Physics Letters A 381: (11) ((2017) ), 970–975. |
[11] | J. Chen, L.J. U, H. Wang and Z. Yan, Community mining in signed networks based on dynamic mechanism, IEEE Systems Journal 13: (1) ((2019) ), 447–455. |
[12] | C.X. Nie, Applying correlation dimension to the analysis of the evolution of network structure, Chaos Solitons & Fractals 123: ((2019) ), 294–303. |
[13] | K.K. Mohammadmosaferi and H. Naderi, Evolution of communities in dynamic social networks: An efficient map-based approach, Expert Systems with Applications 147: ((2020) ), 113221. |
[14] | Z. Dhouioui, R. Toujani and J. Akaichi, Tracking dynamic community evolution and events mobility in social networks, Encyclopedia of Social Network Analysis and Mining, (2018) , 3159–3170. |
[15] | R. Karan and B. Biswal, A model for evolution of overlapping community networks, Physica A Statistical Mechanics & Its Applications 474: ((2017) ), 380–390. |
[16] | Z.X. Wang, Z.C. Li, G. Yuan et al., Tracking the evolution of overlapping communities in dynamic social networks, Knowledge-Based Systems 157: ((2018) ), 81–97. |
[17] | S. Yang, L. Wang and Y. Liu, The Study of Community Evolution Classification Method Based on Similarity and Difference, in: 2020 Asia-Pacific Conference on Image Processing, Electronics and Computers (IPEC), (2020) , pp. 316–320. |
[18] | J. Feng and X. Gu, Based on Community Discovery and Community Similarity Research on Evolution of Deep Learning, in: Proceedings of the 2019 International Conference on Artificial Intelligence and Computer Science, (2019) , pp. 314–319. |
[19] | X.W. Zhang, H.D. ShenZhao, P.R. Zhao, Z. Zhang, M. Li and H.Y. Xu, Community evolution Prediction based on event Framework, Chinese Journal of Computers 40: (03) ((2017) ), 729–742. |
[20] | N. Dakiche et al., Sensitive Analysis of Timeframe Type and Size Impact on Community Evolution Prediction, in: 2018 IEEE International Conference on Fuzzy Systems (FUZZ-IEEE), (2018) , pp. 1–8. |
[21] | W. Yu, W. Wang, P. Jiao, H. Wu, Y. Sun and M. Tang, Modeling the local and global evolution pattern of community structures for dynamic networks analysis, IEEE Access 7: ((2019) ), 71350–71360. |
[22] | J. Ye et al., Research on Interaction Tracking between Community Discovery and theme Evolution Based on DBLP Scientific Research Cooperation Network, in: 2019 IEEE 4th International Conference on Big Data Analytics (ICBDA), (2019) , pp. 403–409. |
[23] | S. Qiao et al., Dynamic community evolution analysis framework for large-scale complex networks based on strong and weak events, IEEE Transactions on Systems, Man, and Cybernetics: Systems 51: (10) ((2021) ), 6229–6243. |
[24] | Y. Wei et al., Modeling Community Evolution Characteristics of Dynamic Networks with Evolutionary Bayesian Nonnegative Matrix Factorization, Complexity, (2021) , 1–13. |
[25] | E.G. Tajeuna, M. Bouguessa and S. Wang, Modeling and predicting community structure changes in time-evolving social networks, IEEE Transactions on Knowledge and Data Engineering 31: (6) ((2019) ), 1166–1180. |
[26] | Y. Tian, Analysis and prediction of community evolution in dynamic social Networks, Chongqing University of Posts and Telecommunications, (2017) . |
[27] | M.E.G. Pavlopoulou et al., Predicting the evolution of communities in social networks using structural and temporal features, in: 2017 12th International Workshop on Semantic and Social Media Adaptation and Personalization (SMAP), (2017) , pp. 40–45. |
[28] | V.D. Blondel et al., Fast unfolding of communities in large networks, Journal of Statistical Mechanics: Theory and Experiment (10) ((2008) ), 10008. |
[29] | P. Bródka, S. Saganowski and P. Kazienko, GED: The method for group evolution discovery in social networks, Social Network Analysis and Mining 3: (1) ((2013) ), 1–14. |
[30] | N. İlhan and Ş.G. Öğüdücü, Predicting community evolution based on time series modeling, in: 2015 IEEE/ACM International Conference on Advances in Social Networks Analysis and Mining (ASONAM), (2015) , pp. 1509–1516. |
[31] | B. Gliwa, A. Zygmunt and A. Byrski, Graphical analysis of social group dynamics, in: 2012 Fourth International Conference on Computational Aspects of Social Networks (CASoN), (2012) , pp. 41–46. |


