
Diagnosis of liver disease by computer- assisted imaging techniques: A literature review
Abstract
Diagnosis of liver disease using computer-aided detection (CAD) systems is one of the most efficient and cost-effective methods of medical image diagnosis. Accurate disease detection by using ultrasound images or other medical imaging modalities depends on the physician’s or doctor’s experience and skill. CAD systems have a critical role in helping experts make accurate and right-sized assessments. There are different types of CAD systems for diagnosing different diseases, and one of the applications is in liver disease diagnosis and detection by using intelligent algorithms to detect any abnormalities. Machine learning and deep learning algorithms and models play also a big role in this area. In this article, we tried to review the techniques which are utilized in different stages of CAD systems and pursue the methods used in preprocessing, extracting, and selecting features and classification. Also, different techniques are used to segment and analyze the liver ultrasound medical images, which is still a challenging approach to how to use these techniques and their technical and clinical effectiveness as a global approach.
1.Introduction
The liver is one of the body’s vital organs and plays many roles, such as detoxifying drugs, eliminating waste products caused by the destruction and renewal of red blood cells in bile, producing coagulation factors, storing glucose as glycogen, and regulating the metabolism of sugar and fat. Furthermore, the role of the liver in absorbing fat and protecting the body against microbes and food-borne poisons should not be ignored. Nowadays, liver disease is one of the main problems in the world that causes an increase in deaths, and it could be caused by or along with another disease too. For this reason, most related scientists and researchers try to overcome this problem [1].
Potentially, fatty liver disease (FLD), known as hepatic steatosis, is a liver disease in humans that has recently increased in many society as a result of the rise in obesity. Due to the destruction of liver cells, the importance of this disease is due to the fact that it can lead to advanced diseases and other serious issues [2]. Liver cirrhosis is a spectrum of mild liver disease in which there is an accumulation of liver cells in the liver cells, and it may lead to liver cell inflammation in a group of patients and degrade liver cells into chronic and irreversible diseases. NAFD (Non-Alcoholic Fatty Liver) is also a disease that varies from fatty liver to NASH (Non-Alcoholic Steato Hepatitis). In was reported in [3] that patients with non-alcoholic fatty liver disease, the most important causes of this disease were harmful habits (consumption of preservative foods and non-compliance with eating habits), stress (anxiety or depression), and lack of adequate mobility (lack of proper physical activity such as daily exercise) respectively. Fatty liver disease was first identified and introduced by Ludwig and his colleagues in 1980. It was observed that in a group of patients similar to those who consume alcohol, damage to the liver cells occurs. However, there was no history of alcohol in these patients. There was no evidence of another liver disease in these patients, but 90% of them were obese, 25% had increased blood lipids, and 25% had diabetes.
CAD as a diagnostic system can be used along with different medical imaging modalities, including US (Ultrasound), CT scan (Computer Tomography), MRI (Magnetic Resonance Imaging), mammography, and tomosynthesis, to diagnose symptoms and measurements accurately and, finally, make a great contribution to the images. However, the quality and accuracy of images and data depends on the type of device, the operator or expert who uses the images. Automatic data obtained by computer processing is diagnosed by the radiologist based on the heterogeneity in the liver, weak edges and low contrast, and its proximity to other digestive organs during the liver ultrasound imaging. Therefore, the accuracy of image recognition is efficient, and the time required for image comprehension is reduced using conventional techniques [4].
On the clinical side, ultrasound imaging of the liver is the most common diagnostic method that is non-invasive, relatively inexpensive, and accessible. In ultrasound imaging, the amount of echo parenchyma in the liver increases, and in more severe cases, the liver also enlarges. Accurate ultrasound imaging, in addition to the liver diagnosis, is divided into three mild, moderate, and severe grades, ranging from 1 to 3 [2]. With the accumulation of fat in the liver, its echogenicity and degree of gravity increase, so the intensity of infiltration of the fat in the liver varies. This condition is present in various hepatocellular diseases such as alcohol, obesity, and diabetes mellitus, long-term hunger, gastrointestinal passage, steroid use, increased internal steroids, medications, intravenous feeding, severe hepatitis, glycogen storage disease, and cystic fibrosis. Today’s, use of CAD has become a focal point for research in disease analysis [5]. In this review paper, we are going to study the techniques which are employed in diverse stages of CAD systems and track the methods and their performance used in preprocessing, extracting, and selecting features and classification.
2.Models and methods
To address CAD diagnosis in disease problem, we systematically compared different methods for every step of infection classification (i.e., preprocessing, feature extraction, feature selection, classifier). In this section, the main tools will be discussed.
2.1Image enhancement and denoising
Image enhancement is a method of improving the quality of an image. The main objective of image enhancement is to change the characteristics of an image to make it more suitable for the observer and to provide a better input for other automated image processing techniques. During this process, one or more characteristics of the image are modified. Moreover, the human visual system and the observer’s experience will introduce a great deal of subjectivity into the choice of image enhancement methods. In the first step, it is better to preprocess the initial acquisition to reduce noise in the images and obtain a high-quality image. At this stage, the speckle noise filter is firstly eliminated to increase the speed, accuracy, and segmentation of the image processing stages, and the effects of this noise cause vague and obscured visions in the images [6]. Speckle noise reduction techniques in ultrasound imaging is popular, so one can categorize the useful techniques into the following three groups which are intensely conversed in continue:
A. Filtering techniques
Image filtering is done to improve the quality of the image. For example, smoothing an image reduces noise, and blurred images can be rectified. There are broadly two types of algorithms: linear and non-linear. A linear filter is achieved through convolution and Fourier multiplication, whereas a non-linear filter cannot be achieved through any of these. Its output is not a linear function of its input; thus, its result varies in a non-intuitive manner. Here there are some filtering mode should be noted:
A.1 Linear filters
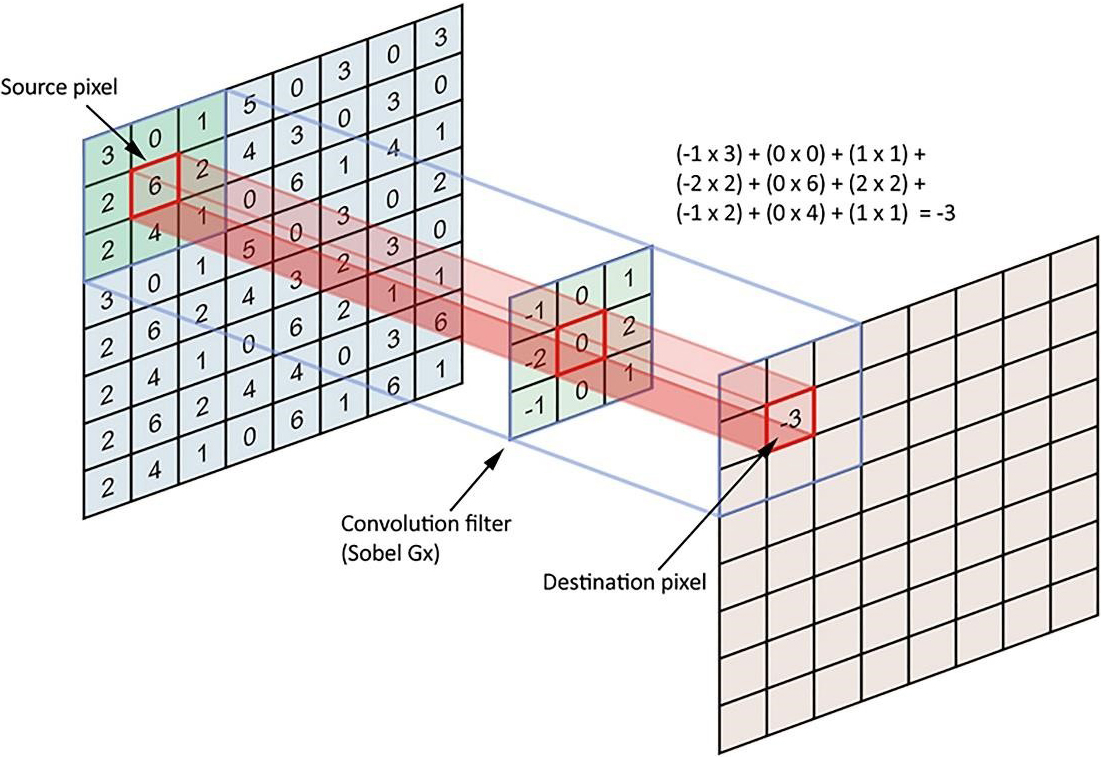
A linear type is also called spatial convolution. In linear filters, the neighboring pixels of specified weights are combined, normalized, and placed as a pixel value. To determine weights, a matrix, which is called the weight matrix (coefficients), the mask, the kernel, the window, the filter mask, etc., is used in this section. The nearest neighbor dimensions are marked with matrix measurements. For instance, to calculate the value of a central pixel in proportion to the specific weights of its eight neighborhoods, it is enough to define a three-to-three-dimensional matrix of weights, multiply the magnitude of the peer in each neighborhood, add the calculated figures together, and set the pixel value to the center. After all, in weighing a neighboring pixel, we get a new value for the target pixel, and this is called linear filtering (Fig. 1).
Figure 1.
Linear filtering processes.
A.2 Nonlinear filters
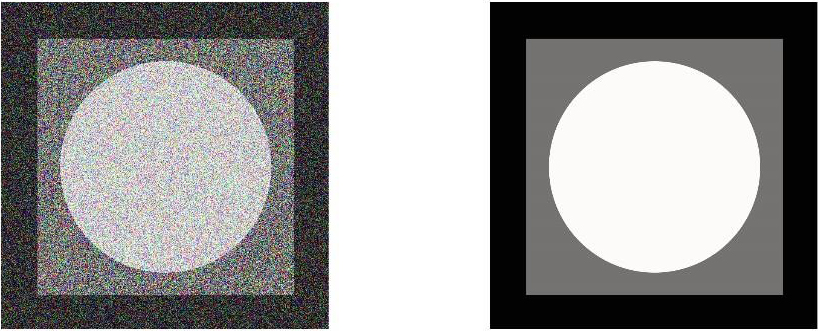
Other types of image processing filters are non-linear filters. In the case of linear filters, all pixels of the image are affected by the coefficients, so nonlinear filters can be used to avoid this problem. In this type, the value of a neighborhood pixel is considered based on a specific attribute, like the value of the central pixel. For example, the maximum neighborhood value can be considered as a central value. A variety of nonlinear filters can also be found in mid-air and fashion filters. The middle filter is a downstream filter that uses an m*n neighbor, and its method is to arrange all neighborhoods in ascending order and select the middle element of the ordered numbers to replace the central pixel. It should be noted that a low-pass filter can be used for the removal of salt and pepper noise. The figure below shows the image of the noise (Salt & Pepper noise), which has been upgraded using the mid-filter (Fig. 2).
Figure 2.
Salt & Pepper noise removing using the mid-filter.
Numerous denoising algorithms have been proposed in the literature. Notwithstanding the demonstrated success, all of these algorithms entail tedious manual parameterizations and prior knowledge in order to obtain the best results. As the distortion-free reference image is not available, typical image quality assessment (IQA) metrics such as the mean squared error (MSE) and peak signal to noise ratio (PSNR) cannot be used to assess the denoised image quality. No-reference IQA metrics that do not use the reference image are emerging. However, most of the existing metrics are built based on a computationally expensive training process that requires different mean opinion scores collected from human observers.
B. Wavelet domain techniques
The DWT (Discrete Wavelet Transforms) transforms the image into approximately subclasses of scale factors and a set of sub-sets of detail in different directions and resolution scales consisting of wavelet coefficients [11]. DWT provides a suitable basis for the separation of noise from an image. As wavelet transforms have good energy density, small coefficients are likely to represent noise, and large coefficients represent important visual characteristics. The coefficients representing the properties are maintained throughout the scaling and are placed in the clusters attached to the location of each subset. This feature makes the DWT more attractive for removing noise. Several wavelet-based noise cancellation techniques have been developed whose general approaches are as follows: (1) calculation of discrete wavelet transforms; (2) noise removal by changing the waveform coefficient; (3) applying the IDWT reverse wavelet transform to make a non-noised image. Techniques are grouped as follows:
(1) Wavelet shrinkage;
(2) Wavelet despeckling under Bayesian framework;
(3) Wavelet filtering and diffusion.
C. Combined method
In the combined method, image extraction techniques are used to produce multiple images of an area that are partially correlated or uncorrelated, and the mean of this process is a single image. In combination, image extraction techniques to produce multiple images of a region that is partially, or noncorrelation, are used to mean the process is a single image. There are two general explanations for the lack of correlation between individual images. While the converter is in different places, the spatial composition is obtained by generating each of the original images [9]. A three-dimensional space composition has been adapted to reduce noise in 3D ultrasound images [12]. Frequency mixing occurs when the converter operates at different frequencies [13]. The combined technique reduces noise due to the increased complexity of image recording and regenerating. The 3D space composition has been adapted to reduce noise in 3D ultrasound images. Mixing the frequencies occurs when the transducer acts at different frequencies. The combination technique reduces noise due to the complexity of image capture and reconstruction.
D. Machine learning-based techniques
CNN architectures are becoming quite useful in image denoising. Several techniques for CNN denoising have been enumerated. GAN is the most commonly used method for CNN image denoising. Several methods use the generator and the discriminator for extraction and clean image generation. Interestingly, some researchers combined the GAN method with the DCNN methods. The feedforward is what CNN and U-Net are using. The residual network is used severally by researchers. One reason for the high usage of the residual network could be its effectiveness and efficiency. Researchers are using the residual network to limit the number of convolutions in their network.
2.2Image segmentation
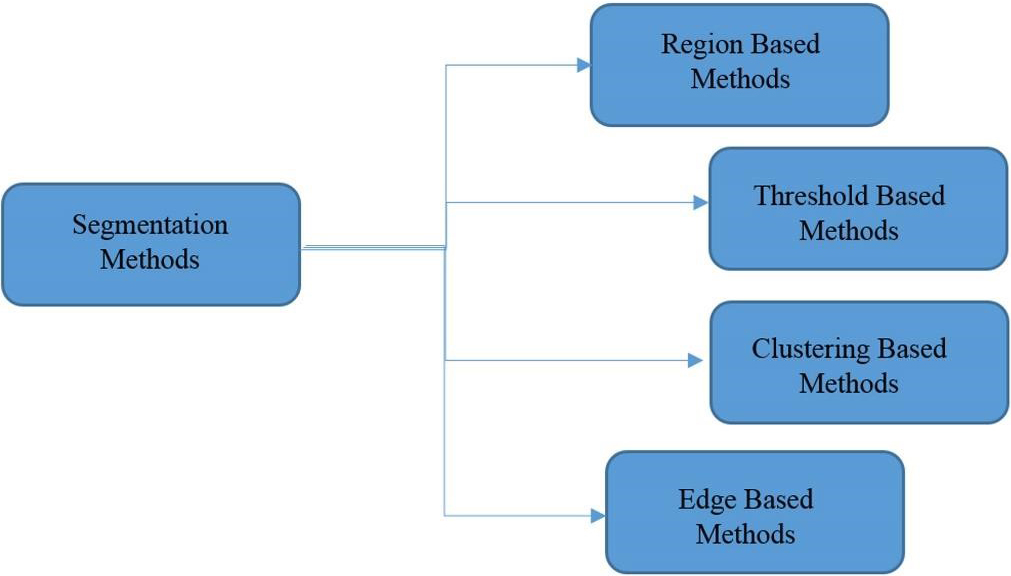
Image segmentation is the first and most critical phase of image analysis whose purpose is to extract information such as the edges, views, and identities of each area from the image by describing the obtained areas in an appropriate shape for computer processing. It prepares areas. The result of partitioning will have a significant impact on the accuracy of the evaluation of properties. Segmentation often describes the process of dividing the image into its main components and extracting parts of the objects of interest from them. There are several ways in which the segmentation of the image can be divided into two categories: (1) Histogram-based methods; (2) Clustering-based methods. Each of these categories has some subsets. In histogram-based methods, image partitioning is based on the distribution of pixels, and the main step in these methods is to find the threshold level suitable for applying to the image. In cluster-based methods, however, similarities and relationships between data are used to group them. In these methods, the data is grouped in such a way that the ones that fall within a section are the most similar types. Segmentation algorithms can be categorized according to different references, such as brightness threshold or domain segmentation, fuzzy methods, water scale method or transformation of water, genetic algorithms, and image segmentation with the help of the minimum spanning tree, graph-based methods, etc. Different methods of categorizing medical images are divided into four basic categories, as shown in Fig. 3 [14].
Figure 3.
Different methods of categorizing medical images.
2.3Feature extraction and selection
Feature extraction is one of the basic steps in CAD systems that is used as a single classification entry. Basically feature selection is an approach of selecting a most relevant subset features for developing a robust AI/machine learning model. In the feature selection process, redundant and/or irrelevant data is removed from the main database, hence performance of the diagnostics model may be improved. By feature selection process, computational burden on the machine will be reduced, hence computational efficiency is increased.
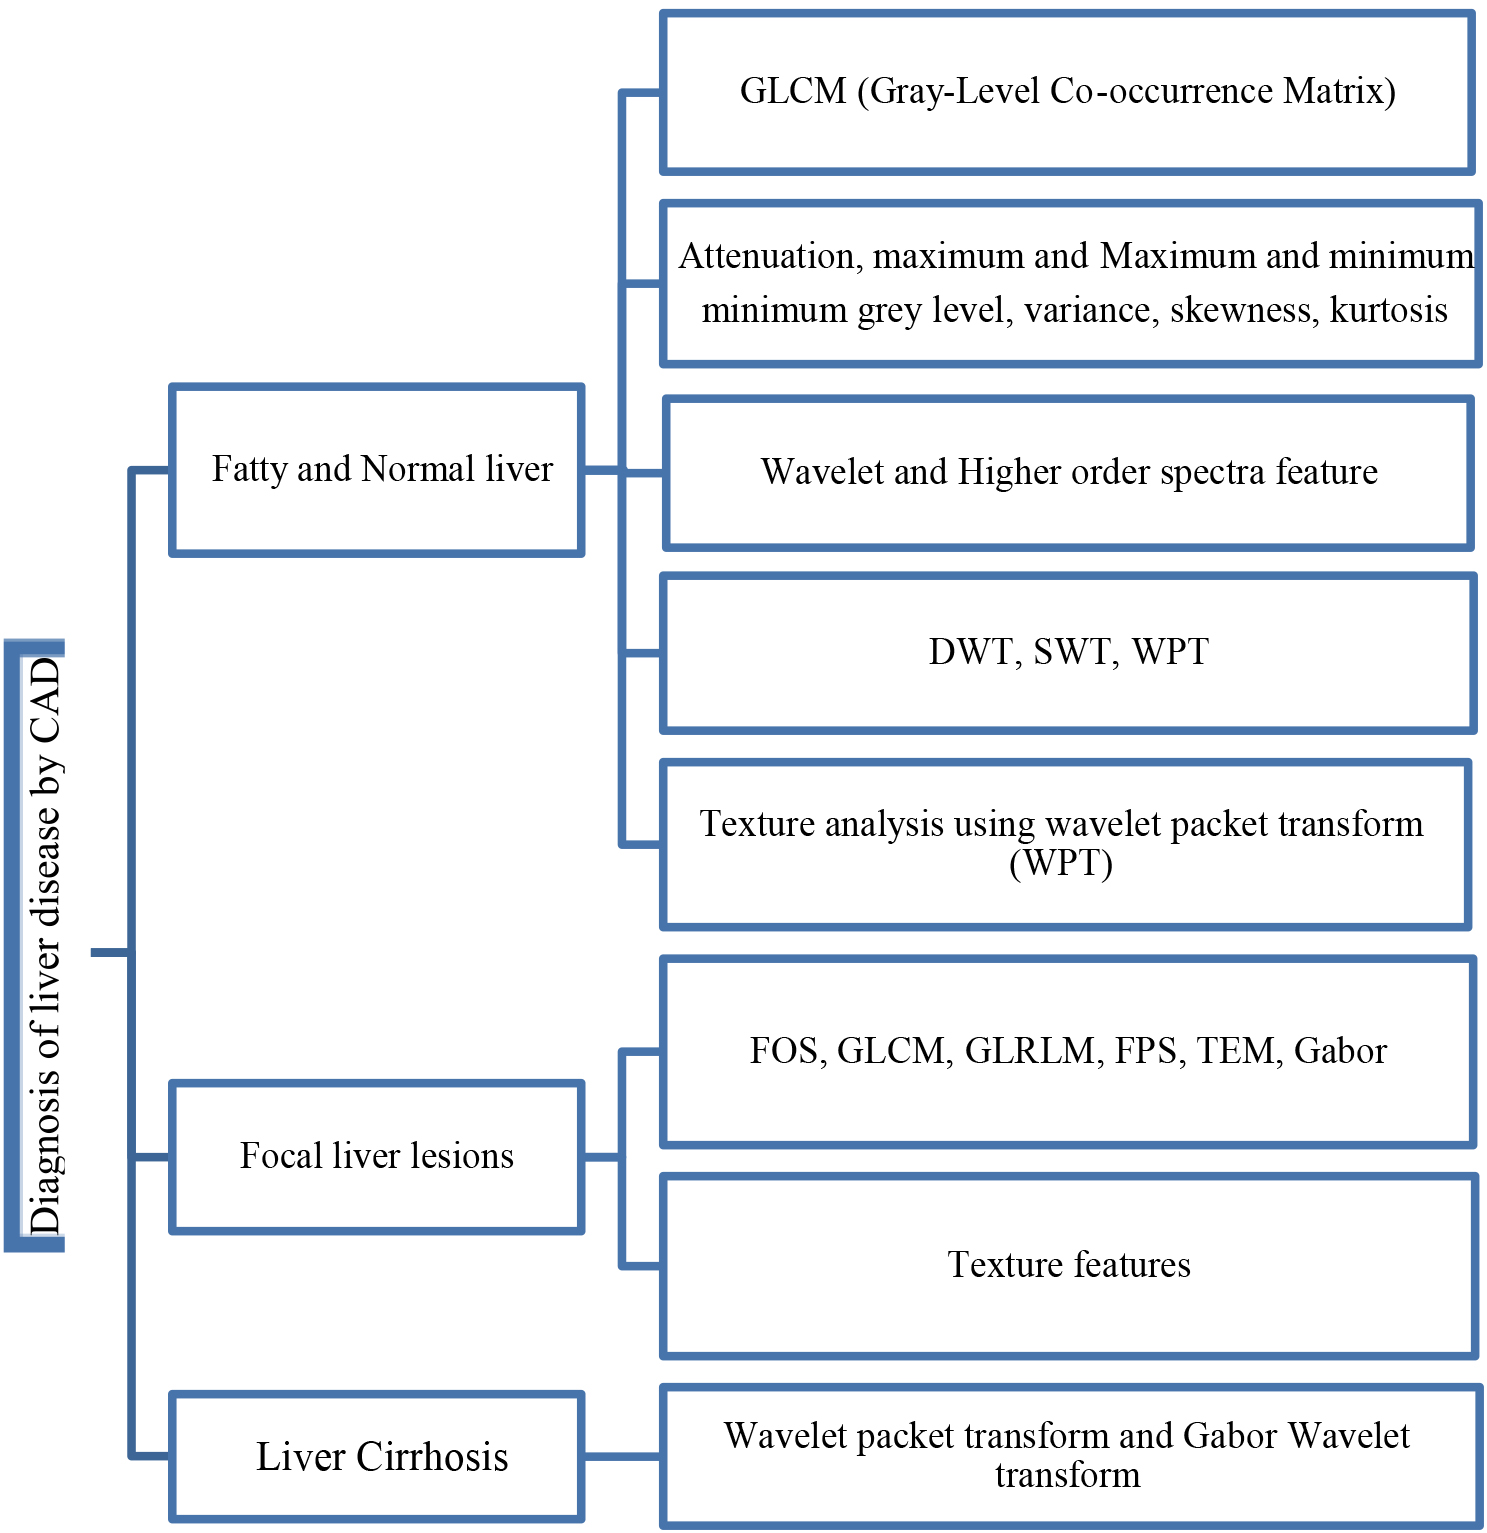
Generally, in future selection and extraction procedure four main steps should be involved as given: (1) subset generation; (2) evaluation of the subset; (3) procedure stopping criteria; and (4) validation. In step 1, sub-sets are selected based on search approach. Generally, approach depends on (1) search direction and (2) search methodology. Step 2 depends on several evaluation parameters such as distance, dependency, consistency, etc. In the step 3, stopping criteria depends on several other criteria (i.e., error is less than required/chosen, complete the search, etc.), and in step 4, the validation of selected attribute is performed using different advanced AI/ML algorithms. Since most liver ultrasound images are composed of irregular and scattered regions, tissue-based methods are the most suitable options for recognizing patterns of dispersion in medical images [14]. As depicted before in Fig. 1, the different features differ from a casestudey to another one in which will be discussed for different experiments in the next section. Figure 4 represents the main CAD diagnosis features that are used for various liver diseases. Three categories include: fatty and normal liver, focal liver lesions, and liver cirrhosis. In each group, different features can use for illness classification. Some of them are assigned to the specified problems in the literature, but there is no strict boundary between them.
Figure 4.
Feature map of the diagnosis of liver disease techniques.
2.4Classification
After extracting and selecting features, they are introduced into a category to classify images into lesions/non-lesions or benign/malignant classes. Most of the literature focuses on the categorization of malignant and benign lesions (usually referred to as the classification of lesions), and some articles focus on the classification of lesions and non-lesions (usually the diagnosis of injury), but only a few of them focus on both. Diagnosis of the lesion is necessary before the classification of lesions. After extracting and selecting features, they are introduced into a classification to categorize images into lesions/non-lesions or benign/malignant classes. Most texts refer to the classification of malignant and benign lesions (usually referred to as waste classifications), and some articles focus on the classification of lesions and non-lesions (usually damage detection), and only a few of them focus on both. The diagnosis of a lesion is necessary before the classification of lesions.
2.5Assessment method
Diagnostic accuracy refers to a test’s capacity to distinguish between the target condition and health. Diagnostic accuracy metrics such as sensitivity and specificity, predictive values, likelihood ratios, the area under the ROC curve, Youden’s index, and diagnostic odds ratio can all be used to quantify this discriminative capacity [15]. Different diagnostic accuracy measures are related to different parts of the diagnostic procedure: for example, some measures are used to examine the discriminative quality of the test, while others are used to analyze its predictive capacity. Assessing a diagnostic method (test) for liver disease, specific sensitivity and specificity have been used.
These parameters are mostly reported in the research papers and are based on the following conditions: True positive (TP): There is a disease, and the test is also positive. False positive (FP): There is no disease, but the test is positive. True negative (TN): There is no disease and the tests are also negative. False negative (FN): There is a disease, but the test is negative [16]. The sensitivity of a diagnostic test is the ability to accurately identify patients with the disease, and the feature of this method is the ability to correctly identify patients without the disease. Accuracy is the ability to classify patients with and without the disease (Table 1).
Sensitivity (True Positive Rate: TPR) relates to the likelihood of a positive test if the ailment is genuinely present. Specificity (True Negative Rate: TNR) refers to the likelihood of a negative test in the absence of the disease. Sensitivity is a measure of how effectively a test can identify genuine positives in a liver disease diagnostic test, whereas specificity is a measure of how well a test can identify true negatives. The sensitivity is defined by (TP/TP
Table 1
Terminology and derivations from a confusion matrix to study liver disease diagnosis
| Sensitivity, recall, hit rate, or true positive rate (TPR) |
|
|---|---|
| Specificity, selectivity or ture negative rate (TNR) |
|
| Accuracy (ACC) |
|
3.Discussion and related work
In recent years, many studies and efforts have been made regarding the use and effects of CAD diagnostic diagnostics systems in various medical imaging modalities to analyze liver diseases. In this section, we will look at the algorithms and methods proposed to create the best-performing diagnostic system. Firstly, in [17], a combined algorithm based on neural networks for the classification of ultrasound images of fatty liver affected patients is presented. The pre-trained convolutional neural networks of Inception-ResNetv2, GoogleNet, AlexNet, and ResNet101 are implemented to extract features from the images and after combining these resulted features, a support vector machine (SVM) algorithms provided to classify the liver images. For the proposed combined network, the area under the receiver operating characteristic curve (AUC) resulted in 0.999, which is a good result when compared to the other proposed algorithms. At [18], a CAD system was developed by Acharya et al. In which the GIST method for extracting the natural and abnormal liver properties of fatty liver in ultrasound imaging was presented following the MFA and Wilcoxon method. These features are categorized into DT, LDA, QDA, PNN, KNN, NBC, FS, and SVM to evaluate the classification function. It has been observed that the PNN classification has the highest 98% classification, 96% sensitivity, and 100% PPV for the 17 relevant attributes. It is worth noting that, from a clinical point of view, sensitivity is 96%, and 100% is the desired function for clinical needs.
In [11], a CAD system was developed by Acharya et al. in which the GIST method for extraction of normal and abnormal liver characteristics influenced by the fatty liver is presented in ultrasound medical imaging, following the MFA and Wilcoxon method. The author of this paper describes the “integration of information” as a vital tool in the design of a classification algorithm. The article shows two points below. First, the best tissue features for liver classification are identified. Second, using an integration of information, a new classification method is proposed, which is a linear combination of features with the ability to categorize the class. Finally, a new “DI” indicator has been proposed that can help radiologists classify the liver. The main advantage of the proposed method is that, despite its inherent simplicity, 95% accuracy is at 100% sensitivity, which is better than or at least comparable with existing classifications. In this study, seven different types of known models are used to extract texture characteristics from each ROI (Region of Interest). Output values are then removed from the property data set. To select the best features, linear separation analysis and PCC (Pearson Correlation Coefficient) are used. In the first step, very inseparable features are separated using the FDR (False Discovery Rate) separation approach. The other advantage of this method, despite its inherent simplicity, is its 95% accuracy at a sensitivity of 100%, which is better or at least comparable with existing classifications. In this study, seven different types of known models have been used to extract texture characteristics from each ROI. Then the output value of the property data set is deleted.
To select the best features, linear separation analysis and Pearson PCC correlation coefficient have been used. In the first step, the inseparable properties are accomplished using Fisher’s FDR separation method. After analyzing FDR, PCC analysis will be used to reduce features. The proposed classification is based on the diagnostic power of this property as well as its normalized weight. This classification uses only seven selected features based on FDR, that is, their power to distinguish between two classes. Because each attribute has a different FDR, its weight should be considered in the classification method. Consequently, in the proposed classification, the value of each attribute is weighed against its FDR. The proposed classification is based on the diagnostic power of this property as well as its normalized weight. This classification uses only seven selected features based on FDR, which means they have the power to distinguish between two classes. Given that each attribute has a different FDR, its weight should be considered in the classification method. Consequently, in the proposed classification, the value of each attribute is FDR. Hwang et al. [19] have used the First Order Statistics (FOS), Gray Level Co-occurrence Matrix (GLCM), Law’s texture features, and Echogenicity algorithms to extract features to improve the diagnostic accuracy by detecting a lesion area from one different area (Fig. 5).
![Flow chart of the proposed algorithm [19] for the classification of focal liver lesions.](https://content.iospress.com:443/media/ida/2022/26-4/ida-26-4-ida216379/ida-26-ida216379-g005.jpg)
In this study, a total of 42 histological characteristics were obtained based on first-order statistics, gray matrix, and law and echogenic values. Figure 6 provides a complete image of the processing algorithm used to estimate the characteristics of the composite of the original ultrasound image. The PCA is performed with the Varimax rotation to determine a set of desirable features. PCA can improve the accuracy of a classification model and reduce computational time. This method converts the feature vector by designing the main data along the line with more variance. Subsequently, due to the reduction of the variance of the mean square error to the desired value, it is possible to create an optimal channel for liver lesions to be categorized. Hwang et al. [19] used a two-layer FFNN feeder network with a sigmoid function for classification. FFNN is widely used as a classifier for waste and has a simple, but noise-resistant structure. The FFNN contains 29 neuronal inputs, 10 neurons, and 2 neurons. A total of 29 key features were selected by the PCA as a set of inputs for the FFNN. To reduce overfitting, a Bayesian Regulation Learning Algorithm was used for training. The efficacy of this study is 99.7 for Cyst vs. Hemangioma, 98.72 for Cyst vs. Malignant, and 96.13 for Hemangioma vs. Malignant.
In a study by Acharya et al. [20], the CT method was presented as an appropriate method for automatic diagnosis of normal liver, FLD, and cytotoxic liver by using tissue analysis from ultrasound images. 9 types of entropies, such as EBS, EPh, Ef, Ek, Emax, Er, ESh, Ev, and Ey are calculated in CT coefficients. The importance of CT is its ability to reduce noise without losing significant information in the image [21]. Additionally, it can extract low-intensity curves and components in image pixels. Entropy is a nonlinear property that shows the complexity of the data, and, in general, a high entropy value indicates more irregularities than vice versa. Moreover, the LDI was developed using two features to classify three classes. The main innovation of this proposed method is the ability to evaluate the inherent signatures in the images. HOS is a nonlinear method with a high signal-to-noise ratio that can extract the interaction from frequency components and phase pairs. Fuzzy entropy measures asymmetric signals of very irregular degrees and is not affected by noise. Renny’s entropy estimates the spectral complexity of the data using measurements. Therefore, the algorithm can categorize normal individuals, FLDS, and cirrhosis using ultrasound images by these notable nonlinear features. In the proposed method, the entropy features are used to detect normal FLD and cirrus images with a precision of 97.33% and a sensitivity of 96.00%, which uses only six attributes.
In the proposed method, entropy features are used to recognize natural images of FLD and cirrus with a precision of 97.33% and a sensitivity of 96.00%, which uses only six attributes. In this study, two methods of fiber combination have been proposed for the classification of the fatty, natural, and heterogeneous liver [21]. To achieve this goal, two algorithms are used as a combination of a single-level property and parallel combinations of two levels. Features used include wavelet packet transform, Gabor filters, completing a local binary pattern, and gray level co-occurrence matrix. In a one-level synchronization method, all the features are combined, and then using the PSO algorithm, a set of selected features for classification is used. The two-level fusion technique has two stages: firstly, most features of the detection of each feature space are selected and combined by the PSO, and then the optics properties of the combined mode are selected.
A new classification is proposed in a hierarchical state that has two stages: first, focal and diffuse liver images are sorted, and then normal and fat detection are carried out [21]. Experimental results show that the classification accuracy is slightly higher than the confidence coefficient, which is obtained without compilation techniques. They also reveal the efficiency of the hierarchical classification method. This shows that the various features include complementary and useful information that can be appropriately categorized. The new discussion of this study is that what features in any order (usability) can be more meaningful for more accurate results (Fig. 6). Based on the results of the experiments, the accuracy of the subclass classification is superior to that of each of them. Generally, in both the combined techniques and serial and parallel versions, the accuracy of the results is shown in Table 2.
Table 2
Both the combined techniques and the serial and parallel versions’ accuracy
| Proposed method [21] | Fusion1 | Fusion2 |
|---|---|---|
| Serial Fusion of WPT, Gabor, CLBP and GLCM | 98.86% | 100% |
| Parallel Fusion of WPT, Gabor, CLBP and GLCM | 97.72% | 98.86% |
![CAD system of [21].](https://content.iospress.com:443/media/ida/2022/26-4/ida-26-4-ida216379/ida-26-ida216379-g006.jpg)
A diagram of the CAD system is presented in Fig. 6 that can successfully extract the characteristics of sonication liver images for a machine-based learning system [22]. An online classification can identify a natural and an abnormal liver based on a trained set. The efficacy was classified by the ratio of the correct number of high-risk classified CAD to patients with real CAD. A combination of training, validation, and test ratios was implemented to select the desired feature. A total of eight combinations of training, validation, and test sequences were used to determine the FLD classification. Among these eight combinations, the best classification accuracy was 97.58% compared with training ratio 90, validation ratio 5, and test ratio 5.
Using CAD software for the detection of natural and abnormal images of the liver, an educational-based educational system has been created. To fill in the system, Leven Berg-Marquardt’s algorithm was used. This algorithm was selected based on the high degree of successful classification. The category of crucial systems includes medical diagnostic systems. The most significant characteristic of such systems is their ability to reproduce the outputs of their operations even when the input data varies. Simultaneously, all of the authors’ classifiers rely on training samples to produce their outputs. The use of neuro-fuzzy systems, in which the neural network’s capabilities are superimposed on a generic human experience, is one possible way out of this problem. The authors employed two types of triangle membership functions and a Gussy membership function for each of the three membership functions for each input and output in [23] to detect liver illness using fuzzy logic by gathering essential laboratory values. The results showed that with the right input parameters and the right number and type of membership functions, the developed fuzzy system can achieve 79.83 percent accuracy, and the adaptive neuro-fuzzy inference system can also help with liver disorders [24]. Hybridizing Adaptive Neuro-Fuzzy Inference System (ANFIS) with an optimization method like Particle Swarm (PSO) was introduced in [25] which combines the creation of an inference system with an optimization procedure that attempts to optimize the ANFIS hyper-parameters depending on the data set. The features of liver illnesses were obtained from the UCI Repository of Machine Learning Databases. There are seven of these distinguishing characteristics, and the sample size is 354. According to the findings of the experiments, ANFIS-PSO has a higher performance than regular FIS and ANFIS without the optimization phase.
An ANN can be considered as an applied graph of weight in which artificial neurons represent the connection between the neuron’s output and its input as nodes and straight edges between the nodes. Depending on the connection pattern, the ANN can be divided into two broad categories: the feed network and the feedback network. An ANN can automatically learn from prior experiences. Learning is a basic state of intelligence. This algorithm provides a numerical solution to minimize non-linear performance with a fast and stable synchronization and is used to introduce small and medium-sized issues in ANN. A review paper [26] focuses on the detection of osteoarthritis through three distinct methods. The first method involves characteristics extraction after the fifth classification implementation and the fusion classification (dual), whose performance using the number of evaluation features (much lower than the initial characteristics of 357) was obtained by the feature selection technique. According to the first set of data and two parameters, the accuracy and area under the AUC curve are evaluated. The results showed that the use of a large number of features is not directly related to the improvement of the additional performance in the classifications. The ANN classification describes the best performance with a precision of 0.77 and an AUC of 0.82 using the 12 features. On the other hand, classifiers, with a weighted vote combination, created a precision of 0.79 and an AUC of 0.884 for the top 18 features.
A similar method, whose results were very promising, was used for the second set of images. Thus, the best performance for a combination of 38 attributes with a precision of 0.89 and 0.93 AUC for SVM was calculated [27]. This demonstrates the importance of maintaining unstructured configuration parameters in visual texture analysis. It is important that the results of the evaluations are higher than those presented in the literature using similar classifications. Because of the feature selection program, the best features used in this work are as expected, for example, from 10 to 30. For the second data set, the best result was probably 38 years due to the overcharge. The second method for detecting osteosis activity was using the hepatoma-renal factor, which was based on the echogenic difference between liver parenchyma and renal cortex. This coefficient has been proven to be a good indicator of steatosis, so it is shown with the calculated AUC values of 0.94 and 0.92 for the first and second data sets. It has also been shown that the hepatorenal factor is not affected by the parameters of the ultrasound device during the acquisition of information. The third method for assessing steatosis was to calculate the attenuation coefficient. This approach resulted in an AUC of 0.74 and 0.83 for the first and second data sets, which is lower than that presented by the second method.
![AUC value for the three methods in [27].](https://content.iospress.com:443/media/ida/2022/26-4/ida-26-4-ida216379/ida-26-ida216379-g007.jpg)
Compared to the other three methods, it can be asserted that the third method produces the worst results. This method can be justified by the method used to compute it (line of pixels), which is definitely influenced by the inherent noise of ultrasound images. Also, the results allowed us to conclude that the function of an SVM classification is like that of the hepatorenal coefficient for the second data set. Considering ultrasound equipment as the most effective use in a patient’s scenario, it is obvious that the second method is less sensitive to the existence and variety of equipment based on the intensity of the pixels of the liver and kidney images. It should be noted that the methods provided are from medical images that have been previously selected and sorted by physicians. These methods showed that the automatic osteoarthritis assessment method could increase the results of the same with physicians and indicates that high levels of performance have been obtained.
We should emphasize in the classification method that the parameters for receiving images should be constant. This can be a severe limitation because physicians tend to adjust the parameters of the ultrasound device to enhance the image display, which can affect the classification function. As it was mentioned above, this limitation can be overcome by using the proposed hepatorenal coefficient approach because the two organs are related to a similar image. This method can create a limitation because physicians tend to have ultrasound device parameters set to increase the image display, which can affect the classification function. Of course, this limitation can be overcome by using the proposed correlation coefficient approach because the two organs in the same image are the same. Finally, it can be said that the proposed approaches, the classifications with a limited number of features, the hepatorenal coefficient, and the coefficient of obstruction can detect the status of the natural channels. In addition, these methods are innovative because of their many features, followed by a selective feature to identify related items that are not often found in similar tasks. Fusion (classification) was also tested with very good results. According to the proposed methods, classification with a limited number of features, coprotoral coefficient, and blocking coefficient can detect the status of natural channels. In addition, these methods are due to many innovative features, followed by a selective feature to identify related items that often do not exist in similar tasks. Fusion (classification) has also been tested with excellent results. In [16], the first part of the implementation was carried out to evaluate the effect of back-scan conversion. In this experiment, after the conversion of the back-scan into liver images, the focal region has been selected, and the optimal ROI is 64
In the first step, the implementation is carried out to evaluate the effect of the scan conversion. In this study, after turning the scans back into liver images, the focal area has been selected, and the optimal ROI is 64
The second experiment was to demonstrate the effectiveness of the hierarchical classification scheme. In this test, all the features of WPT and GLCM were tested at each stage and evaluated by selecting features, and the characteristics of each step were used based on the characteristics of the classes at that stage. In the first classification, the normal case is marked as Class 1, and other items are labeled as Class 2 fat [16]. Ultrasound images of the normal liver include liver vessels, biliary tract, and other abnormalities. However, fatty tissue is almost homogeneous with a different degree of echogenicity, which depends on the amount of fat. Therefore, the features used by WPT should be profitable since they have a good distinction between homogeneous and heterogeneous textures. Therefore, only the WPT features are used in the first step. Normal items are labeled Type I Fat, while others are labeled Type II Fat. Ultrasound images of the natural liver include liver vessels, biliary tract, and other disorders. However, fatty tissue with varying degrees of echo depends on the amount of homogeneous fat. Therefore, the features used by the WPT (wavelet packet transform) should be profitable since they have a good distinction between homogeneous and heterogeneous textures. So, in the first step, only WPT features are used (See Table 4).
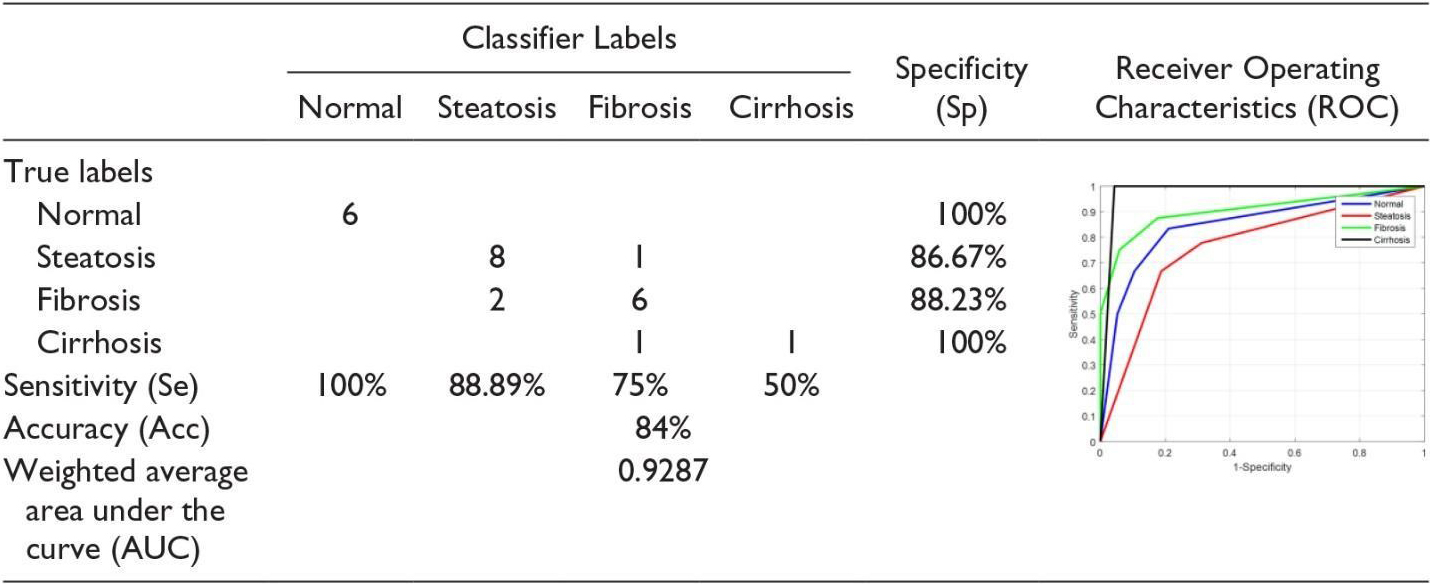
If the liver is first classified as fat, discriminating between steatosis and other fatty stages is done in the second phase. At this stage, both the features of the WPT and GLCM are used, because we want the various stages of the fatty liver to be different from a homogeneous echogenic. In addition, static hepatotoxic images may contain blood vessels. In the final stage, the classification of fibrosis and cirrhosis is performed using GLCM (Gray-Level Co-Occurrence Matrix) properties only, because these properties vary between homogeneous tissues and different levels of lightness. Confusion Matrix for Four Classes Using Back-Scan Conversion and a Hierarchical Classification Scheme (See Table 5). The results in the table above are based on hierarchical classification. According to this table, the proposed method is reliable and can be used in CAD systems for the diagnosis of various stages of the fatty liver based on ultrasound images. As shown in this table, the proposed method shows 100% Se for the detection of normal liver, steatosis, and cirrhosis of the liver. In addition, in the natural diagnosis of Sp, fibrosis, and cirrhosis of the liver are 100%.
Deep learning, as a subset of machine learning, consists of a neural network structure inspired by the human brain. In terms of feature selection and extraction, deep learning algorithms do not need to predefine features and do not necessarily require ROI (Region of Interest) to be placed complexly on images. Deep learning methods can learn the features and classify images and process them. This data-driven model makes it both more informative and practical [28]. At present, circular neural networks (CNNs) are one of the most popular methods of deep learning architecture in the field of medical image analysis. CNN typically does supervise learning by tagging data, while other non-monitoring learning methods do so through unsupervised data. CNN is made up of several layers and hidden layers, among which it can complete functions using the functions of collecting, extracting, and collecting. Fully connected layers can cause a high level before the final output results. Some studies have shown that deep learning methods have good results in processing and diagnostic work in computed tomography (CT), MRI classification, as well as ultrasound in diagnostic work. In medical imaging, achieving the right amount of data to teach deep learning models is an important challenge compared to natural imaging. When deep learning models are taught with limited medical data, the deep CNN tends to suffer too much, and convergence problems arise. Also, deep CNN training and implementation usually require a lot of computational resources. Using transfer learning, it is possible to use pre-trained CNN models (models that use natural image data sets or other sets of medical imaging) for classification [29].
Liang et al. suggest a method for describing focal lesions of the liver in ultrasound contrast images as a set of ROIs that have been modelled as potential variables in the discriminatory model. This model is obtained by repeating the optimal ROI position and optimizing the model parameters. Lee et al. suggest a faster FCR modified RCNN, which can detect the location of smaller or obscure cancerous areas by adding a spatial constraint layer at the end of CNN. Meng et al. used the VGGNet (Visual Geometry Group Network) architecture and a fully connected network based on transmission learning to predict liver fibrosis [30]. Similarly, Liu et al. provided a pre-trained CNN model that extracts liver capsule features from ultrasound images and extracts SVM for liver classification as normal or abnormal from CNN features [31]. Wu et al. taught a deep-belief network model on time-intensive curves extracted from ultrasound with increased contrast to classify focal hepatic lesions [32]. They showed that their method is better than the classic machine learning methods. Biswas et al. evaluated fatty liver disease from ultrasound images using deep learning and found it performed superior to machine learning approaches. Hassan and colleagues used a scattered autoencoder to access the liver ultrasound profile and used a softmax layer to diagnose and diagnose focal liver disease. They found that the deep learning method achieved an overall accuracy of 97.2% compared to the accuracy of several SVMs, KNN (K-nearest neighbour), and Bayes, which were 96.5%, 93.6%, and 95.2%, respectively. The proposed method could effectively extract liver capsules from Leo et al. Using a CNN model based on liver ultrasound images to accurately diagnose liver cirrhosis, although the diagnostic AUC could reach 0.968, Compared to the two types of histograms, the extraction method has low-level characteristics of directional slopes (HOG) and local binary pattern (LBP), whose average accuracy was 83.6% and 81.4%, respectively [33]. Better classification accuracy than 86.9%. The accuracy of most of reported methods are summarised in Table 6.
Table 6
CAD techniques results
| Authors | Year | Number of samples | Features | Classifier | Performance |
|---|---|---|---|---|---|
| Rivas et al. [34] | 2015 | 7 | GLCM | Binary logistic regression | 95.45% |
| Jitender et al. [35] | 2014 | 108 | FOS, GLCM, GLRLM, FPS, TEM, Gabor | Neural network ensemble | 88.7–95% |
| Nivedita et al. [36] | 2014 | 42 | GLCM | SOM and MLP | 81.5% |
| Singh et al. [11] | 2014 | 180 | Texture features | 95% | |
| Dan et al. [37] | 2013 | 120 | Maximum and minimum attenuation, | SVM | 87.78% |
| maximum and minimum grey level, variance, skewness, kurtosis | Random forest | 90.84% | |||
| Jitender et al. [38] | 2013 | 108 | FOS, GLCM, GLRLM, FPS, TEM, Gabor | SVM | 87.2% |
| Jitender et al. [38] | 2013 | 108 | FOS, GLCM, GLRLM, FPS, TEM, Gabor | BPNN | 87.7% |
| Jitender et al. [38] | 2013 | 31 | Wavelet packet transform and Gabor Wavelet transform | SVM | 98.3% |
| Acharya et al. [18] | 2012 | 100 | Wavelet and Higher order spectra feature | DT | 93.3% |
| Fayazul et al. [39] | 2012 | 88 | Wavelet packet transform | SVM | |
| Virmani et al. [38] | 2012 | 56 | DWT, SWT, WPT | SVM | 88.8 |
| Minhas et al. [22] | 2012 | 88 | Texture analysis using wavelet packet transform (WPT) | SVM | 95% |
| Acharya et al. [18] | 2012 | 58 | Texture, wavelet and HOS features | DT | 93.3% |
| Singh et al. [40] | 2012 | 30 | Texture analysis methods (SGLCM, SFM, TEM, FPS and fractals) | Fisher’s linear discriminative analysis | 92% |
| Ricardo et al. [20] | 2012 | 75 | Texture features | SVM | 93.54% |
| Andreia et al. [41] | 2012 | 177 | FOS, GLCM, LTE, FD | SVM | 79.77% |
| Haripriya et al. [33] | 2021 | 4763 | HOG, LBP | CNN | 83.6% |
| Meng et al. [30] | 2017 | 4096 | Visual Geometry | VGGNet | 97.9% |
| Liu et al. [31] | 2020 | 144 | liver capsule | pre-trained CNN | 95.1% |
| Wu et al. [32] | 2014 | 500 | contrast | deep-belief network | 97.2% |
4.Conclusion
Liver disease detection using CAD is one of the efficient techniques, but the presence of better organization of studies and the performance parameters to represent the results of the analysis of the proposed techniques are pointedly missing in most of the recent studies. Few benchmarked studies have been found in some of the papers as benchmarking makes a reader understand under which circumstances their experimental results or outcomes are better and useful for the future implementation and adoption of the work. image processing algorithms, especially in medical section, is one of the most important topics of the day. Unfortunately, the amount of data for research and evaluation on these systems is low and requires the revision and implementation of policies to gather and do more research in this field. Machine learning techniques and texture features are among the most popular methods to date. Therefore, there are many methods in the field of image processing that can be used to provide better analyzes of liver images.
Detection with ultrasound is quite normal in liver diseases and depends on the physician’s experience and skills. CAD systems are very helpful for doctors to improve the accuracy of diagnosing various diseases. In this paper, we described the techniques that are mostly used in the various stages of a CAD system, which involve extracting features, selecting features, and classifying them. Although many techniques are used to classify medical images, it is still a challenging issue to create a universally accepted approach that can be applied to all types of images and applications. We also summarized the CAD algorithms for the diagnosis of liver disease, which have been presented in many published papers, and evaluated the reported performance. These performance criteria show which CAD techniques in ultrasound images for liver disease can improve the accuracy, speed, and objectivity of diagnosis through operator dependence reduction.
References
[1] | L. Pimpin, H. Cortez-Pinto, F. Negro, E. Corbould, J.V. Lazarus, L. Webber, N. Sheron and E.H.S. Committee, Burden of liver disease in Europe: Epidemiology and analysis of risk factors to identify prevention policies, Journal of Hepatology 69: ((2018) ), 718–735. |
[2] | E.A.f.t.S.o.t. Liver, EASL Clinical Practice Guidelines: Management of alcohol-related liver disease, Journal of Hepatology 69: ((2018) ), 154–181. |
[3] | K.D. Shield, M. Rylett and J. Rehm, Public health successes and missed opportunities: Trends in alcohol consumption and attributable mortality in the WHO European Region, 1990–2014, World Health Organization, Regional Office for Europe, (2016) . |
[4] | S.M.H.M. Shelza, Automatic Diagnosis Systems Using Image Processing-A systematic Study. |
[5] | G. Litjens, O. Debats, J. Barentsz, N. Karssemeijer and H. Huisman, Computer-aided detection of prostate cancer in MRI, IEEE Transactions on Medical Imaging 33: ((2014) ), 1083–1092. |
[6] | S. Tang and S.-P. Chen, An effective data preprocessing mechanism of ultrasound image recognition, in: 2008 2nd International Conference on Bioinformatics and Biomedical Engineering, IEEE, (2008) , pp. 2708–2711. |
[7] | B. Desai, U. Kushwaha, S. Jha and M. NMIMS, Image filtering-techniques algorithms and applications, Applied GIS 7: ((2020) ), 970–975. |
[8] | M. Forouzanfar, H.A. Moghaddam and M. Dehghani, Speckle reduction in medical ultrasound images using a new multiscale bivariate Bayesian MMSE-based method, in: 2007 IEEE 15th Signal Processing and Communications Applications, IEEE, (2007) , pp. 1–4. |
[9] | D. Adam, S. Beilin-Nissan, Z. Friedman and V. Behar, The combined effect of spatial compounding and nonlinear filtering on the speckle reduction in ultrasound images, Ultrasonics 44: ((2006) ), 166–181. |
[10] | A.E. Ilesanmi and T.O. Ilesanmi, Methods for image denoising using convolutional neural network: A review, Complex & Intelligent Systems 7: ((2021) ), 2179–2198. |
[11] | M. Singh, S. Singh and S. Gupta, An information fusion based method for liver classification using texture analysis of ultrasound images, Information Fusion 19: ((2014) ), 91–96. |
[12] | R. Rohling, A. Gee and L. Berman, Three-dimensional spatial compounding of ultrasound images, Medical Image Analysis 1: ((1997) ), 177–193. |
[13] | P.F. Stetson, F.G. Sommer and A. Macovski, Lesion contrast enhancement in medical ultrasound imaging, IEEE Transactions on Medical Imaging 16: ((1997) ), 416–425. |
[14] | R. Susomboon, D. Raicu, J. Furst and T.B. Johnson, A co-occurrence texture semi-invariance to direction, distance, and patient size, in: Medical Imaging 2008: Image Processing, SPIE, (2008) , pp. 657–662. |
[15] | A.-M. Šimundić, Measures of diagnostic accuracy: Basic definitions, Ejifcc 19: ((2009) ), 203. |
[16] | M. Owjimehr, H. Danyali, M.S. Helfroush and A. Shakibafard, Staging of fatty liver diseases based on hierarchical classification and feature fusion for back-scan-converted ultrasound images, Ultrasonic Imaging 39: ((2017) ), 79–95. |
[17] | H. Zamanian, A. Mostaar, P. Azadeh and M. Ahmadi, Implementation of combinational deep learning algorithm for non-alcoholic fatty liver classification in ultrasound images, Journal of Biomedical Physics & Engineering 11: ((2021) ), 73. |
[18] | U.R. Acharya, H. Fujita, S. Bhat, U. Raghavendra, A. Gudigar, F. Molinari, A. Vijayananthan and K.H. Ng, Decision support system for fatty liver disease using GIST descriptors extracted from ultrasound images, Information Fusion 29: ((2016) ), 32–39. |
[19] | Y.N. Hwang, J.H. Lee, G.Y. Kim, Y.Y. Jiang and S.M. Kim, Classification of focal liver lesions on ultrasound images by extracting hybrid textural features and using an artificial neural network, Bio-medical Materials and Engineering 26: ((2015) ), S1599–S1611. |
[20] | U.R. Acharya, U. Raghavendra, H. Fujita, Y. Hagiwara, J.E. Koh, T.J. Hong, V.K. Sudarshan, A. Vijayananthan, C.H. Yeong and A. Gudigar, Automated characterization of fatty liver disease and cirrhosis using curvelet transform and entropy features extracted from ultrasound images, Computers in Biology and Medicine 79: ((2016) ), 250–258. |
[21] | A. Alivar, H. Danyali and M.S. Helfroush, Hierarchical classification of normal, fatty and heterogeneous liver diseases from ultrasound images using serial and parallel feature fusion, Biocybernetics and Biomedical Engineering 36: ((2016) ), 697–707. |
[22] | L. Saba, N. Dey, A.S. Ashour, S. Samanta, S.S. Nath, S. Chakraborty, J. Sanches, D. Kumar, R. Marinho and J.S. Suri, Automated stratification of liver disease in ultrasound: An online accurate feature classification paradigm, Computer Methods and Programs in Biomedicine 130: ((2016) ), 118–134. |
[23] | M.R. Farokhzad and L. Ebrahimi, A novel adaptive neuro fuzzy inference system for the diagnosis of liver disease, International Journal of Academic Research in Computer Engineering 1: ((2016) ), 61–66. |
[24] | P. Tavakkoli, D.M. Souran, S. Tavakkoli, M. Hatamian, A. Mehrabian and V.E. Balas, Classification of the liver disorders data using Multi-Layer adaptive Neuro-Fuzzy inference system, in: 2015 6th International Conference on Computing, Communication and Networking Technologies (ICCCNT), IEEE, (2015) , pp. 1–4. |
[25] | M. Rajabi, H. Sadeghizadeh, Z. Mola-Amini and N. Ahmadyrad, Hybrid adaptive neuro-fuzzy inference system for diagnosing the liver disorders, arXiv preprint arXiv:191012952, (2019) . |
[26] | J. Santos, J.S. Silva, A.A. Santos and P. Belo-Soares, Detection of pathologic liver using ultrasound images, Biomedical Signal Processing and Control 14: ((2014) ), 248–255. |
[27] | M. Nakajo, M. Jinguji, A. Tani, D. Hirahara, H. Nagano, K. Takumi and T. Yoshiura, Application of a machine learning approach to characterization of liver function using 99mTc-GSA SPECT/CT, Abdominal Radiology 46: ((2021) ), 3184–3192. |
[28] | T.M. Hassan, M. Elmogy and E.-S. Sallam, Diagnosis of focal liver diseases based on deep learning technique for ultrasound images, Arabian Journal for Science and Engineering 42: ((2017) ), 3127–3140. |
[29] | B. Schmauch, P. Herent, P. Jehanno, O. Dehaene, C. Saillard, C. Aubé, A. Luciani, N. Lassau and S. Jégou, Diagnosis of focal liver lesions from ultrasound using deep learning, Diagnostic and Interventional Imaging 100: ((2019) ), 227–233. |
[30] | D. Meng, L. Zhang, G. Cao, W. Cao, G. Zhang and B. Hu, Liver fibrosis classification based on transfer learning and FCNet for ultrasound images, Ieee Access 5: ((2017) ), 5804–5810. |
[31] | F. Liu, D. Liu, K. Wang, X. Xie, L. Su, M. Kuang, G. Huang, B. Peng, Y. Wang and M. Lin, Deep learning radiomics based on contrast-enhanced ultrasound might optimize curative treatments for very-early or early-stage hepatocellular carcinoma patients, Liver Cancer 9: ((2020) ), 397–413. |
[32] | K. Wu, X. Chen and M. Ding, Deep learning based classification of focal liver lesions with contrast-enhanced ultrasound, Optik 125: ((2014) ), 4057–4063. |
[33] | P. Haripriya and R. Porkodi, Parallel deep convolutional neural network for content based medical image retrieval, Journal of Ambient Intelligence and Humanized Computing 12: ((2021) ), 781–795. |
[34] | P.M. Lopez-Serrano, C.A. Lopez-Sanchez, R.A. Diaz-Varela, J.J. Corral-Rivas, R. Solis-Moreno, B. Vargas-Larreta and J.G. Alvarez-Gonzalez, Estimating biomass of mixed and uneven-aged forests using spectral data and a hybrid model combining regression trees and linear models, iForest-Biogeosciences and Forestry 9: ((2015) ), 226. |
[35] | M.Y. Jabarulla and H.-N. Lee, Computer aided diagnostic system for ultrasound liver images: A systematic review, Optik 140: ((2017) ), 1114–1126. |
[36] | M. Roy, Classification of ultrasonography images of human fatty and normal livers using GLCM textural features, in, vol, (2014) . |
[37] | D.M. Mihailescu, V. Gui, C.I. Toma, A. Popescu and I. Sporea, Computer aided diagnosis method for steatosis rating in ultrasound images using random forests, Medical Ultrasonography 15: ((2013) ), 184–190. |
[38] | J. Virmani, V. Kumar, N. Kalra and N. Khandelwal, SVM-based characterization of liver ultrasound images using wavelet packet texture descriptors, Journal of Digital Imaging 26: ((2013) ), 530–543. |
[39] | D. Sabih and M. Hussain, Automated classification of liver disorders using ultrasound images, Journal of Medical Systems 36: ((2012) ), 3163–3172. |
[40] | M. Singh, S. Singh and S. Gupta, A new quantitative metric for liver classification from ultrasound images, International Journal of Computer and Electrical Engineering 4: ((2012) ), 605. |
[41] | A. Andrade, J.S. Silva, J. Santos and P. Belo-Soares, Classifier approaches for liver steatosis using ultrasound images, Procedia Technology 5: ((2012) ), 763–770. |


