
Improvement of small objects detection in thermal images
Abstract
Thermal images are widely used for various applications such as safety, surveillance, and Advanced Driver Assistance Systems (ADAS). However, these images typically have low contrast, blurred aspect, and low resolution, making it difficult to detect distant and small-sized objects. To address these issues, this paper explores various preprocessing algorithms to improve the performance of already trained object detection networks. Specifically, mathematical morphology is used to favor the detection of small bright objects, while deblurring and super-resolution techniques are employed to enhance the image quality. The Logarithmic Image Processing (LIP) framework is chosen to perform mathematical morphology, as it is consistent with the Human Visual System. The efficacy of the proposed algorithms is evaluated on the FLIR dataset, with a sub-base focused on images containing distant objects. The mean Average-Precision (mAP) score is computed to objectively evaluate the results, showing a significant improvement in the detection of small objects in thermal images using CNNs such as YOLOv4 and EfficientDet.
1.Introduction
The main targeted application (ADAS) must remain reliable whatever the weather and lighting conditions, by day and by night, for tracking pedestrians and vehicles and estimating their trajectories. That is why thermal sensors are generally used, despite their low contrast, their blurred aspect, and their low resolution. Due to such drawbacks, small objects are often indiscernible, limiting the detection distance and thus the ADAS efficiency.
To improve the quality and therefore the relevance of image interpretation, the use of neural networks has gradually replaced the application of image processing tools. Nevertheless, it is legitimate to ask whether an image pre-processing step could improve the performance of such neural networks.
We will see in the next section “Related works” that previous papers, mainly dedicated to visual enhancements, proposed various pre-processing tools to improve the aspect quality of thermal images. In the present paper, we focus mainly on algorithms performing contrast enhancement, deblurring and super-resolution.
The originality of our strategy first lies in the choice of a specific framework to perform contrast enhancement: the LIP (Logarithmic Image Processing) framework, which presents several advantages: it is based on strong physical properties, its addition law of two images remains in the considered grey scale, which means that it results in a real image, without any truncation, contrary to a classical addition of two grey levels, and finally, it is consistent with Human Vision, which ensures that preprocessed images remain interpretable by the system as a human eye would do.
Another contribution of the present work is to study precisely what can bring each of the three considered approaches (contrast enhancement, deblurring, super resolution) for improving the detection of small objects in thermal images. Various combinations of these approaches have been tested to select the most efficient ones.
Concerning the experiments, we know that multiple databases exist for visible images, but only a few exist for thermal images. CNN are known to perform better with large databases. In our case, available thermal images are in much lesser quantities than visible images. To compare our results to existing ones obtained with CNN object detectors like YOLOv4 or EfficientDet, we have chosen to work with the classical dataset FLIR. More precisely, we have created a subset of FLIR, constituted of images containing small sized objects, namely pedestrians and cars.
2.Related works
Previous works, mainly dedicated to visual enhancements, proposed various pre-processing tools to improve the aspect quality of thermal images, like histogram equalization [1] or dynamic range expansion [2] with the aim of improving contrast in thermal images. Recently, methods using Mathematical Morphology and more precisely the Top-hat operators [3] permit to detect bright parts, or hot zones, of a thermal image. However, bright objects, like pedestrians, will appear with variable size, making the choice of the structuring elements critical for applying morphological operators. To overcome this, [4] and [5] designed a multi-scale version of the Top-Hat operation, using two structuring elements of same shape and different size. In a same way, [6] designed a ring structuring element to be used in a Top-Hat regularization to help the detection of small targets.
The low resolution of thermal images prevents precise measure and detection. Jones et al. [7] address this problem of low resolution in their studying of leaf temperature as an indicator of plant water deficit. The studied images are mostly remote sensing images, and the authors focus on the Mixed Pixels problem. Using another high-resolution sensor, we can estimate sub-pixels values by identifying the influence of the surroundings pixels. Considering the low resolution of thermal images and our own objective to precociously detect obstacles (ie. when they are distant, therefore small), we find ourselves in a similar situation, where the pixel size is not negligible compared to that of objects. In the case where the structure of the object seen is a priori known, [8] proposes an algorithm to precisely locate defects causing a difference in thermal conductivity. Convolutional Neural Networks (CNN) have also been tested for increasing thermal images resolution [9], which could improve measure and detection precision.
Another problem regarding thermal images concerns the small number of databases, unlike the case of visible images. This is the reason why some authors predict a thermal image from a visible image. Using a segmentation approach, Lile et al. [10] develop a method predicting a thermal image from a visible one, then comparing it to a real thermal image to detect defects based on the differences found. This situation can be connected to [11], in which a conditional-Generative Adversarial Network (c-GAN) is developed to generate synthetic SEM images. First, a Convolutional Neural Network is pre-trained on real images. Then the transfer-learned CNN is trained on synthetic SEM images and validated on real ones. This approach could be of interest to synthetize thermal images from visible images. We can also refer to [12], in which a pose transfer method is proposed to produce a new image of a target person in a novel pose. Such a result is valuable in several applications. In the paper, it is used for person reidentification. In our case, it could be used to expand the thermal images database.
Thermal images are often blurred, and CNN can be used to remove the blur or at least reduce it. [13] uses a pre-processing step to sharpen thermal images, assisting in the detection of defects in scenarios where temperature variation within the scene is minimal or extreme. [14] reviews multiple techniques to increase edge information in CNN based segmentation algorithms. The use of a multi-level attention Module (MAM) composed of two sub-modules: Context Aggregation Module (CAM) and Correlation Matrix Correction Module (CMCM) permits to enhance the object edge information across the different layers of the neural network. If the neural network used is based on an encoder-decoder structure, extracting contours in the third encoder layer and fusing them with the last feature map of the decoder increases the segmentation precision. The authors present a comparative survey of existing methods based on mIoU values. In a same way, Ammari et al. [15] aim at reconstructing small inclusions inside a homogeneous object. They apply a heat flux and locate the inclusions from boundary measurements of the temperature. The model is developed in a rigorous mathematical frame by computing an asymptotic expansion of the boundary perturbations.
In [16] and [17], a CNN object detector is used, based on the Single-Shot Detection, SSD [18], architecture to detect objects in thermal images. A set of pre-processing methods are proposed in [16], like Random Noise, Training images shuffle, Random Crop and Random Brightness shift, to improve detection accuracy while [17] applies a Dilation and a Deconvolution module to enhance feature maps resolution and enlarge the receptive field zone of the neural net backbone, increasing detection performance of their SSD based detector. At last, [19] shows that using a multi-scale approach as a data augmentation technique permits to improve up to 6% the detection performance of a multi-class boosting based object detector. We can also refer to [20], where the authors present the detection of four types of objects: pedestrian, vehicle, two-wheeler, and cattle.
At last Lu et al. [21] deal with intelligent compaction and more precisely with real-time roller path tracking and mapping in pavement compaction operations. The authors propose a thermal-based method to overcome the problems due to variable weather conditions. To drive the roller optimally, they estimate its motion during successive frames, based on pavement boundary and the optical flow technique. This paper will be valuable for the rest of our work, analyzing the video instead of working image by image, when our goal will be to estimate the motion intention of the detected pedestrians, bicycles, and cars.
3.Methods
3.1Recall on the LIP framework
The LIP framework was first introduced by Jourlin et al. [22, 23, 24], in the context of images acquired in transmission (cf. Annex 1). Let
(1)
(2)
The subtraction
(3)
It has been established that the laws
For 8-bits digitized images, M
Let us recall that the laws
To complement these benefits, we know that the consistency of the LIP model with the Human Visual System [25] extends its application field to images acquired in reflection, giving the opportunity to interpret such images as a human eye would do.
For the interested reader, Carré et al. [26] have shown that the LIP-addition (resp. subtraction) of a constant to an image (resp. from an image) perfectly simulates a decrease (resp. an increase) of the exposure time or of the source intensity. Concerning the scalar multiplicative law,
Many new tools have been introduced in the LIP framework, especially in link with the concept of contrast and associated metrics. Here we will limit ourselves to the Logarithmic Additive Contrast [24].
Given a grey level function
(4)
Due to the scale inversion,
(5)
Remark 1: The previous formula resembles the classic expression of Michelson’s contrast defined according to:
(6)
and:
(7)
Obviously, we can observe that the Michelson’s approach overestimates the contrast between two dark grey levels compared to two bright ones with the same difference. A similar effect can be seen with the LAC definition. More precisely an explicit link has been established in [24] between these two contrasts concepts.
Remark 2: If
3.2Mathematical morphology and Top-Hat LIP
Grey level Mathematical Morphology has been introduced and developed by the Fontainebleau School (Ecole des Mines, Paris) [27]. Given a grey level image
(8)
(9)
Then these two operators are combined to produce the opening
(10)
(11)
It is well-known that the difference
For thermal images, these peaks correspond to hot objects (pedestrians, cars…). According to the size of
Figure 1.
Illustration of the White Top-Hat. Top: stars picture, middle: difference between
![Illustration of the White Top-Hat. Top: stars picture, middle: difference between f and its opening: f-[(f⊖S)⊕S] with S disk of radius 3, bottom: 𝑊𝑇𝐻t(f) with t= 100.](https://content.iospress.com:443/media/ica/2023/30-4/ica-30-4-ica230715/ica-30-ica230715-g001.jpg)
When applying such a technique to real images, all the peaks are detected, the significant ones and those due to noise. To overcome this problem, the concept of White Top-Hat
(12)
The value of
In [4] and [5], the White Top-Hat transform is used with a rather empirical modification whose goal is to enhance the contrast of hot objects: the image
Figure 2.
Top: image
As shown in Fig. 2, the classical addition of
Note that the Logarithmic Additive Contrast permits to quantify the contrast gain generated by this approach: for each region
In the same way, we define the closing
Finally, we can summarize the Mathematical Morphological method by performing together the White and Black Top-Hats, which means that the initial image
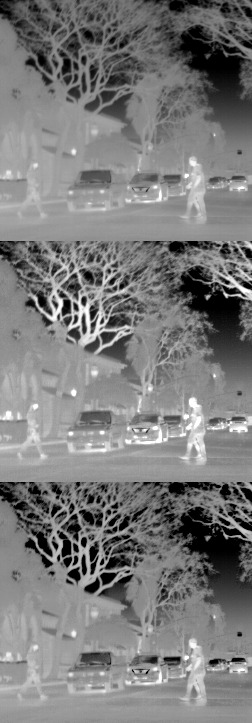
Figure 3.
Top-Hat transform with different diameters. Top: 3, middle: 7, bottom: 11.
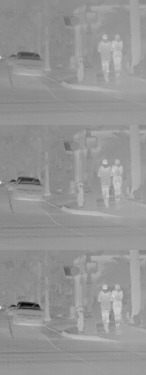
Figure 4.
Person detection for different values of diameter. Top: 3, middle: 7, bottom: 11.
Now let us consider the multiscale aspect of the problem. Depending on the structuring element radius used in the Top-Hat operators, different information peaks are extracted. The small objects we want to detect in the background of our thermal images have very different sizes according to the scene and to their position and distance from the sensor. It’s understandable that a given structuring element will favor one size of object. Thus, we compute multiple Top-Hat transforms with structuring elements of increasing size, the maximal radius being empirically chosen from detection performance and time constraints. Chaverot et al. [28] proposed a method consisting of executing the neural network object detector on all these Top-Hat transform iterations. The next step is to concatenate the obtained results. The selection of the best bounding-boxes is made with the Non-Maximal Suppression algorithm, NMS [29]. Figure 3 shows the result of the Top-Hat transform for different radii of the structuring element: we can observe that the dark regions like the car windshield become progressively darker while the bright ones (pedestrians) become brighter.
Figure 4 shows the different detections of increasing diameters of the Top-Hat transform structuring element.
3.3Deblurring
As already remarked, thermal images are systematically blurred, in the sense that they look like slightly misfocused images. From an optical point of view, it means that a single bright point is replaced by an Airy disk, whose central part can be approximated by a Gaussian.
During the digitizing step, if the Airy disk diameter is larger than the size of a pixel
In the literature [32], a resembling approach, commonly referred as the Unsharp Masking (UM) algorithm, consists of computing
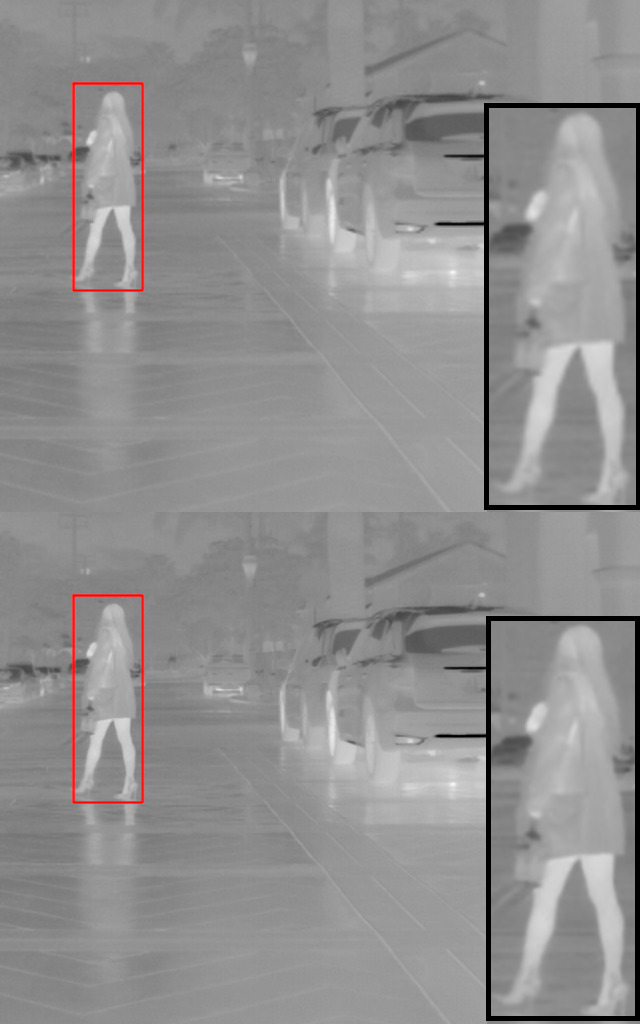
Figure 5.
Unsharp masking. Top: initial thermal image
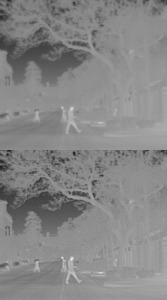
An example of such a deblurring is shown in Fig. 5 with
3.4Super resolution
In the case of an already trained network, modern CNN architecture permits to increase the input image resolution without having to retrain it. Increasing the network resolution has the advantage of detecting smaller targets, despite an increase of the processing time. Considering the same original dataset, in this approach, the input images require an upscale too. A bilinear or bicubic interpolation is usually used for this task. But in our situation, image Super Resolution (SR) appears particularly interesting.
SR algorithms aim at increasing images resolution while keeping precise and sharpened details in comparison of classical interpolation methods generating blur and approximated information (e.g. bicubic interpolation (BC)). Generally, SR methods provide an increase in resolution by a factor
Recently many deep learning-based SR methods have been developed and achieve new state-of-the-art performances. We can refer to the following reviews presenting recent SR works [33, 34, 35]. In our experiments we use the CARN model (CAscading Residual Network) [36], based on a residual network and implementing a cascading mechanism. This network proposes a satisfying image quality and is quite efficient in term of computational complexity thanks to its lightweight design.
In the learning phase, couples of low resolution and high resolution images are required. High resolution images correspond to the original images of the training dataset (with the native resolution). Low resolution images are obtained by reducing the images size by factors
Table 1
Image quality comparison between super resolution and bicubic interpolation
| FLIR-08901 | FLIR-08953 | FLIR-08960 | ||||
|---|---|---|---|---|---|---|
| PSNR | SSIM | PSNR | SSIM | PSNR | SSIM | |
| BC | 41.38 | 0.979 | 40.14 | 0.976 | 44.82 | 0.986 |
| SR | 43.61 | 0.983 | 42.2 | 0.981 | 46.41 | 0.988 |
Figure 6.
Super resolution applied on thermal images. Top: bicubic interpolation. Bottom: SR
A comparison between SR and bicubic upscaling is proposed in Table 1. On some images of the FLIR dataset, PSNR and SSIM metrics are evaluated between Ground Truth (GT) and upscaled images. GT images correspond to original FLIR images, the upscaled ones are obtained by downscaling the GT and then upscaling them by SR or bicubic interpolation. On every comparison, Super Resolution gets the best scores.
3.5Combined algorithms
We have also explored combinations of our previous proposed methods. We focused on combinations of SR with UM (Unsharp Masking) and SR with Multiscale Top-Hat transform. As the SR multiplies the number of pixels in each direction, we adapt the radius of the structuring element used in the Top-Hat transform and the neighboring region size of the Unsharp Masking to consider the novel targeted size. Typically, we double the size for a SR
The combination of UM and Multiscale Top-Hat transform has been tested, as the first one enhances the information peaks to be detected by the Top-Hat operations. However, such a combination yields poorer detection performance than using only one of the previous exposed methods and will not be further discussed in this paper.
4.Experiments
4.1Materials
4.1.1FLIR dataset and validation subset selection
The FLIR ADAS dataset [37] is a dataset of thermal images proposed by the FLIR company, a thermal image sensor manufacturer. This set is constituted of 10228 images with a resolution of 640
The FLIR ADAS dataset provides annotations for four classes: persons, cars, bicycles, and dogs. Table 2 presents the classes distribution.
Table 2
FLIR ADAS classes distribution along train and validation split
| Persons | Bicycles | Cars | Dogs | |
|---|---|---|---|---|
| Train | 13725 | 3297 | 36642 | 178 |
| Val. | 4955 | 441 | 5209 | 12 |
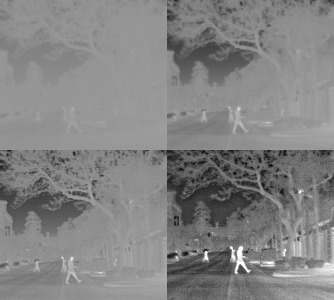
Figure 7.
Top left: 14 bits RAW image, top right: the proposed normalization, bottom left: the proposed normalization and unsharp masking, bottom right: FLIR enhanced image.
In this paper, due to the large unbalance between the classes, we decided to focus only on the two following classes: persons and cars.
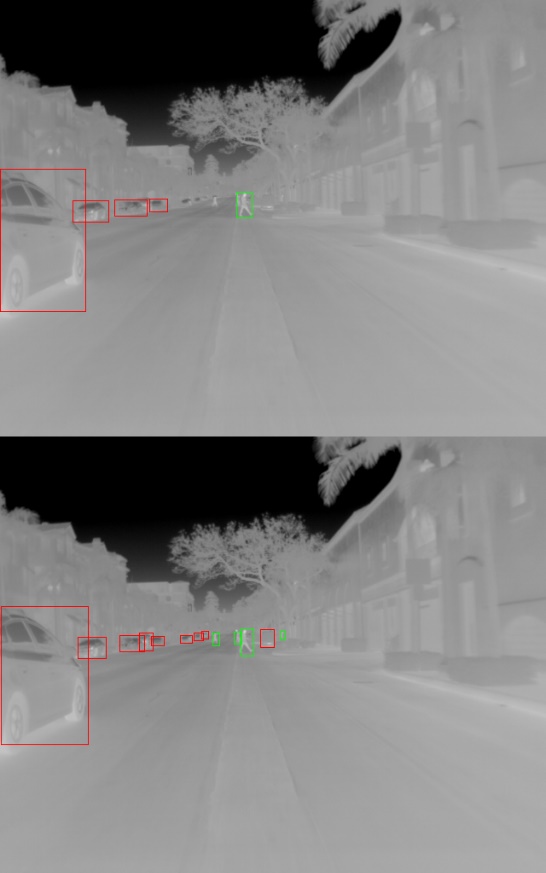
The FLIR ADAS dataset is not perfect. The annotations of small objects are not present. It can be explained by the difficulties to annotate them due to the poor quality of thermal images. To obtain accurate scores of detection performance, 693 images from the validation dataset were chosen and reannotated. One hundred of these images were chosen because of their interesting scene, with vehicles relatively far, and pedestrians crossing the street in the background. The rest of the images were randomly picked. Full list of images and annotations files are freely available on GitHub [38]. The selected validation images contain 5318 annotated persons and 3206 annotated cars. Figure 8 shows the difference between the original annotation and our novel annotation. Table 3 shows a comparison of the number of labeled objects before and after our reannotation. The number of small bounding boxes has doubled, while the count of boxes in other sizes remained relatively unchanged.
Table 3
Bounding boxes areas distribution along our selection
| Small | Medium | Large | Total | |
|---|---|---|---|---|
| Original | 2378 | 2577 | 538 | 5493 |
| Updated | 5669 | 2676 | 546 | 8891 |
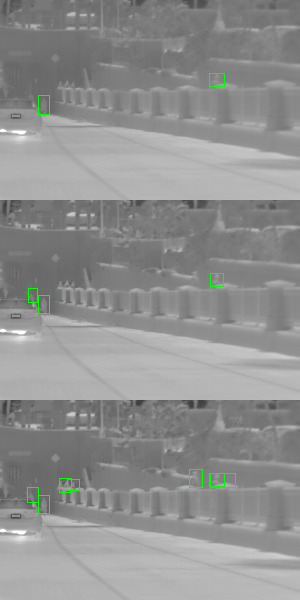
Figure 8.
Comparison between FLIR annotation (top) and the new one (bottom). Red boxes are labeled cars, Green boxes are labeled pedestrians.
4.1.2Fine tuned YOLOv4
YOLOv4 is an object detector proposed by Bochkovskiy et al. [39] leveraging multiple features to obtain the best trade-off between inference time and detection accuracy. The authors aim to design a detector suitable for systems production and optimizable for parallel computation. This detector is built with CSPDarknet53 [40] as backbone due to its state-of-the-art classification results on MSCOCO [41]. CSPDarknet53 is associated with a Spatial Pyramid pooling module, increasing the separation of significant features without reducing the processing speed. The path-net aggregation neck of the detector is PANet [42], shortening the information path between lower layers and topmost feature. At last, the detector head is the same as YOLOv3 [43], anchor based.
YOLOv4 also uses state-of-the-art training strategies and data augmentation methods, increasing detection performance and overall robustness.
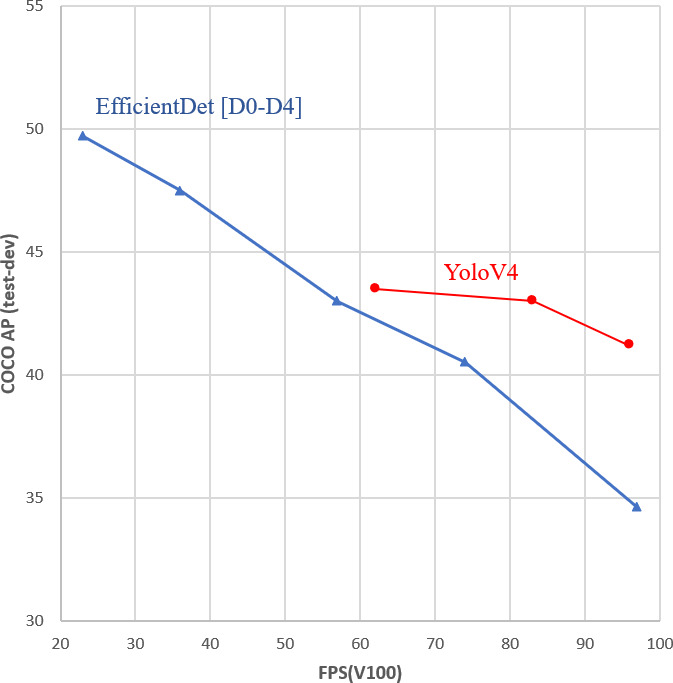
The network architecture is presented in Fig. 9 and a performance comparison chart given in [39] is shown in Fig. 10.
![YOLOv4 architecture [39].](https://content.iospress.com:443/media/ica/2023/30-4/ica-30-4-ica230715/ica-30-ica230715-g009.jpg)
Figure 10.
Performance comparison chart.
In our experiments, we use a fine-tuned YOLOv4 on the FLIR ADAS dataset [28].
The fine-tuning was made with the following parameters:
• Resolution: 640
• Optimizer: Stochastic Gradient Descent
• Learning Rate: 0.001
The optimizer and learning rate were selected in accordance with the original publication of the network.
The train and validation split provided by FLIR was kept. The mean Average-Precision, mAP, score was computed on the validation set at each epoch for a minimum of 60 epochs, the model obtained is the one with the best score along the training. This model has the state-of-the-art detection performance on the FLIR ADAS Dataset.
4.1.3Fine-tuned EfficientDet
EfficientDet [44] is a detector using the EfficientNet [45] architecture as backbone. EfficientNet was designed to improve efficiency and accuracy of CNN’s by using a compound scaling method to scale the network architecture and feature resolution. This allows to balance the trade-off between accuracy and efficiency. EfficientDet uses a weighted Bi-Directional Feature Pyramid Network, BiFPN, to fuse features from different scales and a Single Shot Detector, SSD, as its head, to predict the bounding boxes and class probabilities of the objects in a scene. As shown in the performance comparison chart depicted in Fig. 10, the deepened architecture of EfficientDet, like EfficientDet-D3 and EfficientDet-D4 outperforms YoloV4 on the MS COCO dataset, albeit with a significantly decreased inference speed.
We have fine-tuned the EfficientDet-D3 model, pre-trained on the MS COCO dataset. We used the following parameters:
• Resolution: 640
• Optimizer: AdamW [46]
• Learning Rate: 0.0002
As with the YoloV4 fine-tuning, we maintained the optimizer and learning rate used by the original authors, as well as the train validation split of the FLIR dataset. Unlike the previous architecture, our network required training with a square image size. To accommodate this requirement, we employed a resolution of 640
4.1.4CARN trained on thermal images
To train the CARN network on thermal images, we have followed the steps described by the authors in the original paper. We use a batch size of 64, a patch size of 64, the ADAM optimizer with a starting learning rate of 0.0001 which is halved every 4
4.2Experimental settings
For the YOLOv4-based network, the Unsharp Mask is computed using a Gaussian filter with a standard deviation
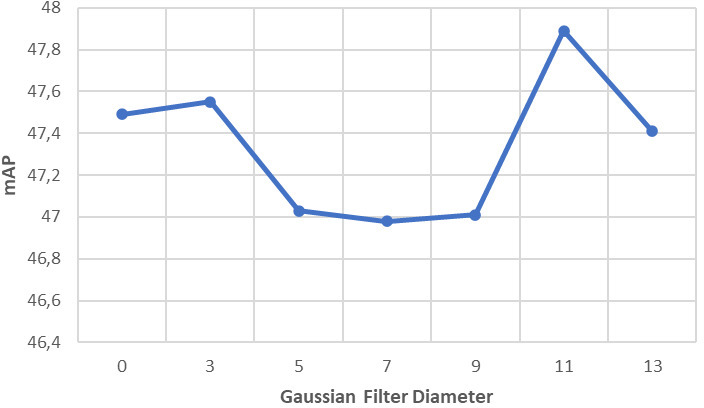
These diameters have been set thanks to a sensitivity analysis for the impact of the kernel diameter of the Gaussian filter. This analysis is presented in Figs 11 and 12, showcasing the effects of different diameters on the results.
Figure 11.
Sensitivity analysis: influence of the Gaussian filter diameter of the UM method with the YoloV4 fine-tuned model.
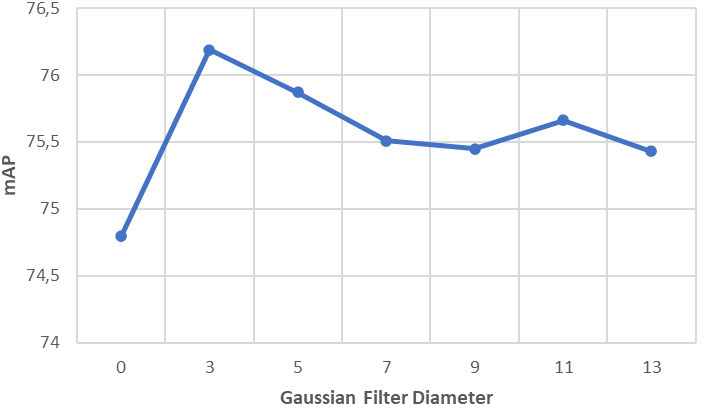
Figure 12.
Sensitivity analysis: influence of the Gaussian filter diameter of the UM method with the EfficentDet-D3 fine-tuned model.
When the Unsharp Mask is applied to the Super-Resolution (SR)
The Multiscale Top-Hat transform employs a circular structuring element with an odd diameter ranging from 3 to 13. When used in combination with the SR
Table 4
Detection performances of the different methods for the fine-tuned YoloV4
| AP | |||
|---|---|---|---|
| Methods | Person | Cars | mAP |
| Baseline | 68.23 | 81.37 | 74.80 |
| FLIR enhanced | 67.44 | 81.36 | 74.4 |
| MTH | 69.13 | 80.63 | 74.88 |
| MTH LIP | 69.42 | 81.24 | 75.33 |
| UM | 70.17 | 82.22 | 76.19 |
| SR | 72.98 | 84.79 | 78.89 |
| BC | 69.83 | 82.85 | 76.34 |
| SR | 74.54 | 85.62 | 80.08 |
| SR | 75.44 | 84.77 | 80.11 |
Table 5
Comparison of AP
| AP | |||
|---|---|---|---|
| Methods | Small | Medium | Large |
| Baseline | 57.74 | 91.79 | 92.55 |
| FLIR enhanced | 56.06 | 93.27 | 97.11 |
| MTH | 57.61 | 91.56 | 92.48 |
| MTH LIP | 58.21 | 91.45 | 93.06 |
| UM | 59.01 | 91.48 | 93.34 |
| SR | 67.73 | 90.08 | 73.78 |
| BC | 63.60 | 90.04 | 73.09 |
| SR | 70.23 | 88.87 | 72.22 |
| SR | 69.61 | 90.04 | 73.04 |
For the concatenation and selection of the best bounding boxes in the Multiscale Top-Hat method, a Non-Maximum Suppression algorithm [29], NMS, is applied with a threshold of 0.45. This threshold value is commonly used when inferring a detection network and helps eliminating redundant bounding boxes.
4.3Results and discussion
In our study, we present the results in Tables 4–7, which provide comparisons of Average Precision (AP) and mean Average Precision (mAP). The computation method for AP is defined in the MS COCO Dataset [41]. Specifically, we used the AP
Table 6
Detection performances of the different methods for the fine-tuned EfficientDet-D3
| AP | |||
|---|---|---|---|
| Methods | Person | Cars | mAP |
| Baseline | 35.52 | 59.46 | 47.49 |
| FLIR enhanced | 30.71 | 49.74 | 40.22 |
| MTH | 39.04 | 61.08 | 50.06 |
| MTH LIP | 39.03 | 61.05 | 50.04 |
| UM | 36.34 | 59.44 | 47.89 |
| SR | 45.37 | 72.04 | 58.71 |
| BC | 42.94 | 70.12 | 56.53 |
| SR | 45.31 | 71.89 | 58.60 |
| SR | 47.37 | 72.91 | 60.14 |
Table 7
Comparison of AP
| AP | |||
|---|---|---|---|
| Methods | Small | Medium | Large |
| Baseline | 24.10 | 76.65 | 86.02 |
| FLIR enhanced | 13.38 | 70.31 | 78.09 |
| MTH | 26.45 | 78.86 | 87.35 |
| MTH LIP | 26.20 | 78.97 | 87.76 |
| UM | 24.28 | 76.70 | 85.31 |
| SR | 44.12 | 77.00 | 60.21 |
| BC | 42.43 | 74.90 | 56.51 |
| SR | 43.86 | 75.89 | 57.63 |
| SR | 45.50 | 77.80 | 61.10 |
The baseline score is obtained with the fine-tuned model presented in [28] on our validation subset. The four presented methods are: MTH (Multiscale Top-Hat), MTH LIP, UM (Unsharp Masking deblurring), SR (Super Resolution). For a comparison purpose, we have included results obtained from two additional image variations. The first variation involves using images enhanced automatically by the FLIR algorithms (FLIR Enhanced). The second variation involves resizing the images by a factor of two using Bicubic Interpolation (BC).
For each considered detector, the LIP version of the MTH has outperformed the classical one. The UM and the SR
However, it is important to mention that when employing Bicubic interpolation or Super-Resolution methods, there is a decrease in the AP
This discrepancy suggests that while the BC and SR techniques impact the detection of larger objects, the overall detection performance, as measured by mAP, remains positive. It highlights the trade-off between enhancing small objects detection while potentially affecting the detection accuracy of larger objects when using these methods.
Table 8
Processing time and frames per second of the fine-tuned models (I9-10850k – RTX3090)
| Methods | Times (ms) | FPS |
|---|---|---|
| YoloV4 (640*512) | 10.98 | 98.32 |
| YoloV4 (1280*1024) | 43.16 | 23.17 |
| EfficientDet-D3 (640*640) | 24.50 | 40.82 |
| EfficientDet-D3 (1280*1280) | 87.40 | 11.44 |
Table 9
Processing time and frames per second of the different algorithms (I9-10850k – RTX3090)
| Methods | Time | FPS | FPS |
|---|---|---|---|
| (ms) | (Yolov4) | (EfficentDet-D3) | |
| UM | 0.19 | 89.53 | 40.50 |
| MTH | 4.67 | 67.39 | 34.28 |
| MTH LIP | 10.17 | 63.90 | 28.84 |
| BC2 | 0.51 | 22.90 | 11.38 |
| SR2 | 95.85 | 7.19 | 5.46 |
| SR2 | 96.6 | 7.16 | 5.43 |
| SR2 | 154.53 | 5.06 | 4.13 |
The SR
The following combinations have been tested: SR
In our experiments, using FLIR images as training dataset, the scores obtained by EfficientDet-D3 are globally lower than those obtained with YoloV4 while these networks show more similar performances on the COCO dataset. These performance differences can be explained by the dataset sizes (328,000 images in the COCO dataset vs 10,228 in the FLIR dataset) and the ability of YoloV4 to perform new augmentation techniques [39]. YoloV4 appears more adapted to reduced datasets.
The execution times of fine-tuned models and preprocessing algorithms are presented in Tables 8 and 9, respectively. Additionally, the frames per second (FPS) obtained with the full pipeline using YoloV4 or EfficientDet are also reported. These times were obtained using an Intel Core i9-10850k CPU and an NVIDIA RTX3090 GPU, with Python, PyTorch 1.8.2 and CUDA 10.2. The YoloV4 architecture is more parallelizable than the EfficientDet one, which explains the different inference times measured. The UM algorithm requires a very low execution cost, making it an attractive option. The MTH LIP is significantly slower than the original MTH, however, parallelizing the algorithm and implementing it in CUDA would accelerate it. Although the BC2 appears to be very effective, the increasing inference time of the neural network for a doubled resolution should not be ignored. In the end, the choice of the preprocessing will depend on the initial performance level of the network, the performance requirement, and the available processing time. In our case, network quantization can be a valuable technique to reduce network inference computation, as studied by Wu et al. [47]. By applying network quantization, we can decrease storage costs and reduce computation time associated with network inference.
It should be noted that the training of the EfficientDet detector was not optimized for the best performance, the purpose of this example is to show that our method can be applied to a trained detector and achieve better performances, even when the training is not carried out in the best possible manner.
Considering the scores presented in Tables 4 and 6, we notice that with both networks YoloV4 and EfficientDet-D3 our image pre-processing techniques provide a significant performance gain. With YoloV4, from our baseline of mAP 74.80, applying SR
These results demonstrate the ability of the proposed pre-processing techniques to improve the detection performance of an already trained network. Despite the performance gap between the two detectors, the results demonstrate the effectiveness of our proposed methods, and shows the generalization possibilities to other datasets and tasks.
5.Conclusion and perspectives
The objective of the present paper was to overcome the main drawbacks of thermal images and improve the detection of small objects. Three methods were studied, each addressing a specific problem: the Multiscale Top-Hat transform and its LIP version to detect objects far from the sensor and enhance their contrast with the neighboring background, the Unsharp Masking method to deblur thermal images, and the CARN network to enlarge the spatial resolution. The most efficient combinations of these techniques allowed for a significant gain compared to the baseline results. These techniques showed a real impact on performance without having to retrain a detection network, knowing that dataset acquisition and annotation are tedious tasks, especially in the case of thermal images.
For future work, we plan to study more precisely the following elements to open the way to real applications such as ADAS: better transformation of raw images into 8-bit ones and optimization of execution time, estimation of the obstacle trajectory and especially of the pedestrian intention, and optimal linking between the distance detection needed and the speed of the aided car.
Concerning the MTH approach, the multiscale technique could be replaced by an automated adaptation of the structuring element size in relation to local information. Finally, more fundamental subjects appear interesting to explore, particularly the benefit of the LIP framework application to thermal images, as demonstrated in [28] for the Top-Hat LIP version. For example, considering the vector space structure associated to the LIP operations, the concept of grey level interpolation opens the way to define a LIP Super Resolution algorithm.
Acknowledgments
The present paper is an extended version of a conference presented by Chaverot et al. [28]. We want to thank Prof Hojjat Adeli, Editor-in-Chief of the Journal Integrated Computer-Aided Engineering (ICAE), for giving us the opportunity to submit this novel version to ICAE.
We would also like to express our gratitude to the nine reviewers for their numerous wise remarks and suggestions.
Annex 1: Transmittance law and LIP addition
Such a law addresses images acquired in transmission i.e., when the observed object is located between the source and the sensor. Given an image
The addition of two images
(13)
This formula means that the probability, for a particle emitted by the source, to go through the “sum” of the obstacles
(14)
If we replace in Eq. (13) the transmittances by their values deducted from Eq. (14), we get the LIP addition of two images, as explained in Eq. (1).
References
[1] | Li S, Jin W, Li L, Li Y. An improved contrast enhancement algorithm for infrared images based on adaptive double plateaus histogram equalization. Infrared Physics & Technology. (2018) May; 90: : 164-174. |
[2] | Richards AA, Cromwell BK. Superframing: scene dynamic range expansion of infrared cameras. In: Proceedings SPIE of the European Symposium on Optics and Photonics for Defence and Security. London, UK: (2004) Dec. Vol. 5612; pp. 199-205. |
[3] | Talbot H, Evans C, Jones R. Complete ordering and multivariate mathematical morphology: Algorithms and applications. In: Proceedings of the International Symposium on Mathematical Morphology. (1998) June. pp. 27-34. |
[4] | Bai X, Zhou F, Xue B. Infrared image enhancement through contrast enhancement by using multiscale new top-hat transform. Infrared Physics & Technology. (2011) March; 54: (2): 61-69. |
[5] | Mello Román JC, Vázquez Noguera JL, Legal-Ayala H. Entropy and contrast enhancement of infrared thermal images using the multiscale top-hat transform. Entropy. (2019) ; 21: (3): 244. |
[6] | Zhu H, Liu S, Deng L, Li Y, Xiao F. Infrared small target detection via low-rank tensor completion with top-hat regularization. IEEE Transactions on Geoscience and Remote Sensing. (2019) ; 58: (2): 1004-1016. |
[7] | Jones HG, Sirault XRR. Scaling of thermal images at different spatial resolution: the mixed pixel problem. Agronomy. (2014) ; 4: (3): 380-396. |
[8] | Ammari H, Iakovleva E, Kang H, Kim K. Direct algorithms for thermal imaging of small inclusions. Multiscale Modeling & Simulation. (2005) ; 4: (4): 1116-1136. |
[9] | Choi Y, Kim N, Hwang S, Kweon IS. Thermal Image Enhancement using Convolutional Neural Network. In: IEEE/RSJ International Conference on Intelligent Robots and Systems (IROS). Daejeon (Korea): (2016) Oct 9-14. pp. 223-230. |
[10] | Lile C, Yiqun L. Anomaly detection in thermal images using deep neural networks. In: IEEE International Conference on Image Processing (ICIP). Beijing, China: (2017) September 17-20. pp. 2299-2303. |
[11] | Ieracitano C, Mammone N, Paviglianiti A, Morabito FC. A conditional generative adversarial network and transfer learning-oriented anomaly classification system for electrospun nanofibers. International Journal of Neural Systems. (2022) ; 32: (12): 2250054. |
[12] | Wu H, He F, Duan Y, Yan X. Perceptual metric-guided human image generation. Integrated Computer-Aided Engineering. (2022) ; 29: (2): 141-151. |
[13] | Sirca JR, Gene F, Adeli H. Infrared thermography for detecting defects in concrete structures. Journal of Civil Engineering and Management. (2018) ; 24: (7): 508-515. |
[14] | Kütük Z, Algan G. Semantic Segmentation for Thermal Images: A Comparative Survey. In: Proceedings of the Conference on Computer Vision and Pattern Recognition (IEEE/CVF). New Orleans, USA: (2022) June 21-24. pp. 286-295. |
[15] | Ammari H, Iakovleva E, Kang H, Kim K. Direct algorithms for thermal imaging of small inclusions. Multiscale Modeling & Simulation. (2015) ; 4: (4): 1116-1136. |
[16] | Ippalapally R, Mudumba SH, Adkay M, Nandi Vardhan HR. Object detection using thermal imaging. In: 2020 IEEE 17th India Council International Conference (INDICON). New Delhi, India: (2020) December 11-13. pp. 1-6. |
[17] | Zhang H, Hong X, Zhu L. Detecting small objects in thermal images using single-shot detector. Automatic Control and Computer Sciences. (2021) ; 55: (2): 202-211. |
[18] | Liu W, Anguelov D, Erhan D, Szegedy C, Reed S, Fu CY, Berg AC. Ssd: Single shot multibox detector. In: European Conference on Computer Vision (ECCV). Amsterdam, The Netherlands: Springer International Publishing; (2016) October 11-14. pp. 21-37. |
[19] | Buenaposada JM, Baumela L. Improving multi-class Boosting-based object detection. Integrated Computer-Aided Engineering. IOS Press. (2021) ; 28: (1): 81-96. |
[20] | Nath S, Mala C. Thermal image processing-based intelligent technique for object detection. Signal, Image and Video Processing. (2022) ; 16: (6): 1631-1639. |
[21] | Lu L, Dai F, Zaniewski JP. Automatic roller path tracking and mapping for pavement compaction using infrared thermography. Computer-Aided Civil and Infrastructure Engineering. (2021) ; 36: (11): 1416-1434. |
[22] | Jourlin M, Pinoli JC. A model for logarithmic image-processing. Journal of Microscopy. (1988) January; 149: : 21-35. |
[23] | Jourlin M, Pinoli JC. Logarithmic image processing: The mathematical and physical framework for the representation and processing of transmitted images. Advance in Imaging and Electron Physics. Academic Press. (2001) ; 115: : 129-196. |
[24] | Jourlin M. Logarithmic Image Processing: Theory and Applications. Academic Press. Advance in Imaging and Electron Physics. (2016) ; 195: : 259. |
[25] | Brailean J, Sullivan B, Chen C, Giger M. Evaluating the EM algorithm for image processing using a human visual fidelity criterion. In: International Conference on Acoustics, Speech, and Signal Processing. Ontario, Canada: (1991) April. Vol. 4; pp. 2957-2960. |
[26] | Carré M, Jourlin M. LIP operators: Simulating exposure variations to perform algorithms independent of lighting conditions. In: Proceedings of the International Conference on Multimedia Computing and Systems (ICMCS). Marrakech, Morocco: (2014) Apr 14-16. pp. 122-126. |
[27] | Serra J. Image Analysis and Mathematical Morphology, Vol. 1. New York, USA: Academic Press; (1982) . |
[28] | Chaverot M, Carré M, Jourlin M, Bensrhair A, Grisel R. Object Detection Improvement with Morphological Top-Hat and LIP (Logarithmic Image Processing) model applied to Thermal Images. In: 3rd International Conference on Advances in Signal Processing and Artificial Intelligence (ASPAI). Porto, Portugal: (2021) Nov 17-19. pp. 56-60. |
[29] | Neubeck A, Van Gool L. Efficient non-maximum suppression. In: 18th International Conference on Pattern Recognition (ICPR). (2006) August 3. pp. 850-855. |
[30] | Pratt WK. Digital Image Processing. New-York, USA: John Wiley; (1978) . |
[31] | Jourlin M. Rôle du Laplacien sous-jacent dans le rehaussement de frontière. Journal de microscopie et de spectroscopie électroniques. (1987) ; 12: (1): 89-93. |
[32] | Polesel A, Ramponi G, Mathews VJ. Image enhancement via adaptive unsharp masking. IEEE Transactions on Image Processing. (2000) March; 9: (3): 505-510. |
[33] | Yang W, Zhang X, Tian Y, Wang W, Xue JH, Liao Q. Deep Learning for Single Image Super-Resolution: A Brief Review. IEEE Transactions on Multimedia. (2019) December; 21: (12): 3106-3121. |
[34] | Anwar S, Khan S, Barnes N. A Deep Journey into Super-resolution: A Survey. ACM Computing Surveys. (2021) May; 53: (3): 1-34. |
[35] | Chen H, He X, Qing L, Wu Y, Ren C, Sheriff RE, Zhu C. Real-world single image super-resolution: A brief review. Information Fusion. (2022) ; 79: : 124-145. |
[36] | Ahn N, Kang B, Sohn KA. Fast, accurate, and lightweight super-resolution with cascading residual network. In: Proceedings of the European Conference on Computer Vision (ECCV). Munich, Germany: (2018) Sep 8-14. pp. 252-268. |
[37] | FLIR ADAS. Available from: https://www.flir.com/oem/adas/adasdatasetform/. |
[38] | Selected Validation file list and annotations. Available from: http://github.com/MaxenceChaverot/FLIR_ADAS_Val_Selected_Annotations. |
[39] | Bochkovskiy A, Wang CY, Liao HYM. YOLOv4: Optimal Speed and Accuracy of Object Detection. In arXiv e-prints. (2020) April; 1-17. |
[40] | Wang CY, Liao HYM, Wu YH, Che PY, Hsieh JW, Yeh IH. CSPNet: A new backbone that can enhance learning capability of CNN. In: Proceedings of the IEEE Conference on Computer Vision and Pattern Recognition Workshop (CVPR Workshop). Seattle, USA: (2020) June 14-19. pp. 390-391. |
[41] | Lin TY, Maire M, Belongie S, Hays J, Perona P, Ramanan D, Dollar P, Zitnick CL. Microsoft coco: Common objects in context. In: European Conference on Computer Vision (ECCV). Springer; (2014) ; pp. 740-755. |
[42] | Liu S, Qi L, Qin H, Shi J, Jia J. Path aggregation network for instance segmentation. In: Proceedings of the IEEE Conference on Computer Vision and Pattern Recognition (CVPR). Salt Lake City, USA: (2018) June 18-22. pp. 8759-8768. |
[43] | Redmon J, Farhadi A. YOLOv3: An incremental improvement. arXiv preprint:1804.02767. (2018) April; 1-6. |
[44] | Tan M, Pang R, Le QV. Efficientdet: Scalable and efficient object detection. In: Proceedings of the Conference on Computer Vision and Pattern Recognition (IEEE/CVF). (2020) June 13-19. pp. 10781-10790. |
[45] | Tan M, Le Q. Efficientnet: Rethinking model scaling for convolutional neural networks. In: International Conference on Machine Learning. PMLR; (2019) May. pp. 6105-6114. |
[46] | Loshchilov I, Hutter F. Decoupled weight decay regularization. In: International Conference on Learning Representations (ICLR). New Orleans, USA: (2019) May 6-9. |
[47] | Wu B, Waschneck B, Mayr CG. Convolutional Neural Networks Quantization with Double-Stage Squeeze-and-Threshold. International Journal of Neural Systems. (2022) ; 32: (12): p2250051. |


