
Connected system for monitoring electrical power transformers using thermal imaging
Abstract
The stable supply of electricity is essential for the industrial activity and economic development as well as for human welfare. For this reason, electrical system devices are equipped with monitoring systems that facilitate their management and ensure an uninterrupted operation. This is the case of electrical power transformers, which usually have monitoring systems that allow early detection of anomalies in order to prevent potential malfunctions. These monitoring systems typically make use of sensors that are in physical contact with the transformer devices and can therefore be affected by transformer problems.
In this work we demonstrate a monitoring system for electrical power transformers based on temperature measurements obtained by means of thermal cameras. Properly positioned, the cameras provide thermal data of the transformer, the incoming and outgoing lines and their surroundings. Subsequently, by appropriate image processing, it is possible to obtain temperature series to monitor the transformer operation. In addition, the system stores and processes thermal data in external equipment (placed in locations other than the transformers) and is equipped with a communications module that allows secure data transmission independent of the power grid. This aspect, along with the fact that there is no need to have physical contact with the transformer, make this approach safer and more reliable than standard approaches based on sensors. The proposed system has been evaluated in 14 stations belonging to the Spanish power grid, obtaining accurate and reliable temperature time series.
1.Introduction
Electrical power transformers used in contemporary medium and low voltage distribution networks are critical components of the electrical infrastructure in developed nations. For this reason they are one of the main concerns of the industry and the sector’s regulators. These transformers are intended to be working without interruption and this involves to be able to handle peaks demand and prevent that potential temporary changes in the transformer workload could result in unacceptable voltage levels or cause any damage to the hardware system. In order to accomplish this requirement, power transformation systems are equipped with a variety of sensors and technologies that allow real-time monitoring of the system’s behavior, so that a prompt action can be taken in the event that the values of phase, intensity, energy, etc. provided by a power transformer deviate from those expected [1]. In addition, in recent years, some changes in society are threatening the resilience of the power system, which emphasizes the relevance of these monitoring technologies [2].
On the one hand, the introduction of disruptive developments such as electric cars, which demands large amounts of energy in a short time [3, 4, 5, 6], or the increased use of renewable production sources (of an intermittent character in the majority of cases [7]) are making the power transformation management more complicated and challenging [8], requiring more sophisticated monitoring systems.
On the other hand, electric power systems are currently experiencing a digitization process, which involves the integration of technologies associated with computing, wireless communication, Internet of Things (IoT) devices and a multitude of applications aimed at facilitating real-time and seamless operations [9, 10, 11]. These advances have enabled the development of more efficient semi-autonomous systems with reasonable operating costs, but have also brought additional concerns, including cyber security concerns, that should be addressed [12].
The management of electricity networks must pay special attention to potential overloads [13, 14], as they are one of the major problem sources affecting power transformers, whose failures represent approximately 12% of the total [15]. Transformer failures, in addition, are particularly dangerous as they can cause fires which, taking into account the urban location of transformers, can result in serious economic and personal damages [16].
The malfunctions affecting power transformers depend to a large extent on the transformer design, with important differences depending on the type of primary insulation [17]. In addition, the presence of certain components that are not present in all transformers may cause failures to be concentrated in some elements or others. Thus, for example, in transformers equipped with On-Load Tap Changer (OLTC), the percentage of failures associated with bushings and terminals is 14%, while in transformers not equipped with OLTC the percentage of failures of these components is more than double (33.3%) [18].
During the last years, several authors [19, 20, 21] as well as different international organizations have published a number of reports analyzing the probability of failure of the components of a power transformer. One of these organizations, the International Council on Large Electric Systems (CIGRE) has divided the types of failures into 6 categories based on the component causing the failure: winding, tap changer, core, tank, bushing, auxiliary. The probability of failure for each is shown in Fig. 1 [22].
Figure 1.
Malfunction probability in different components of a power transformer.
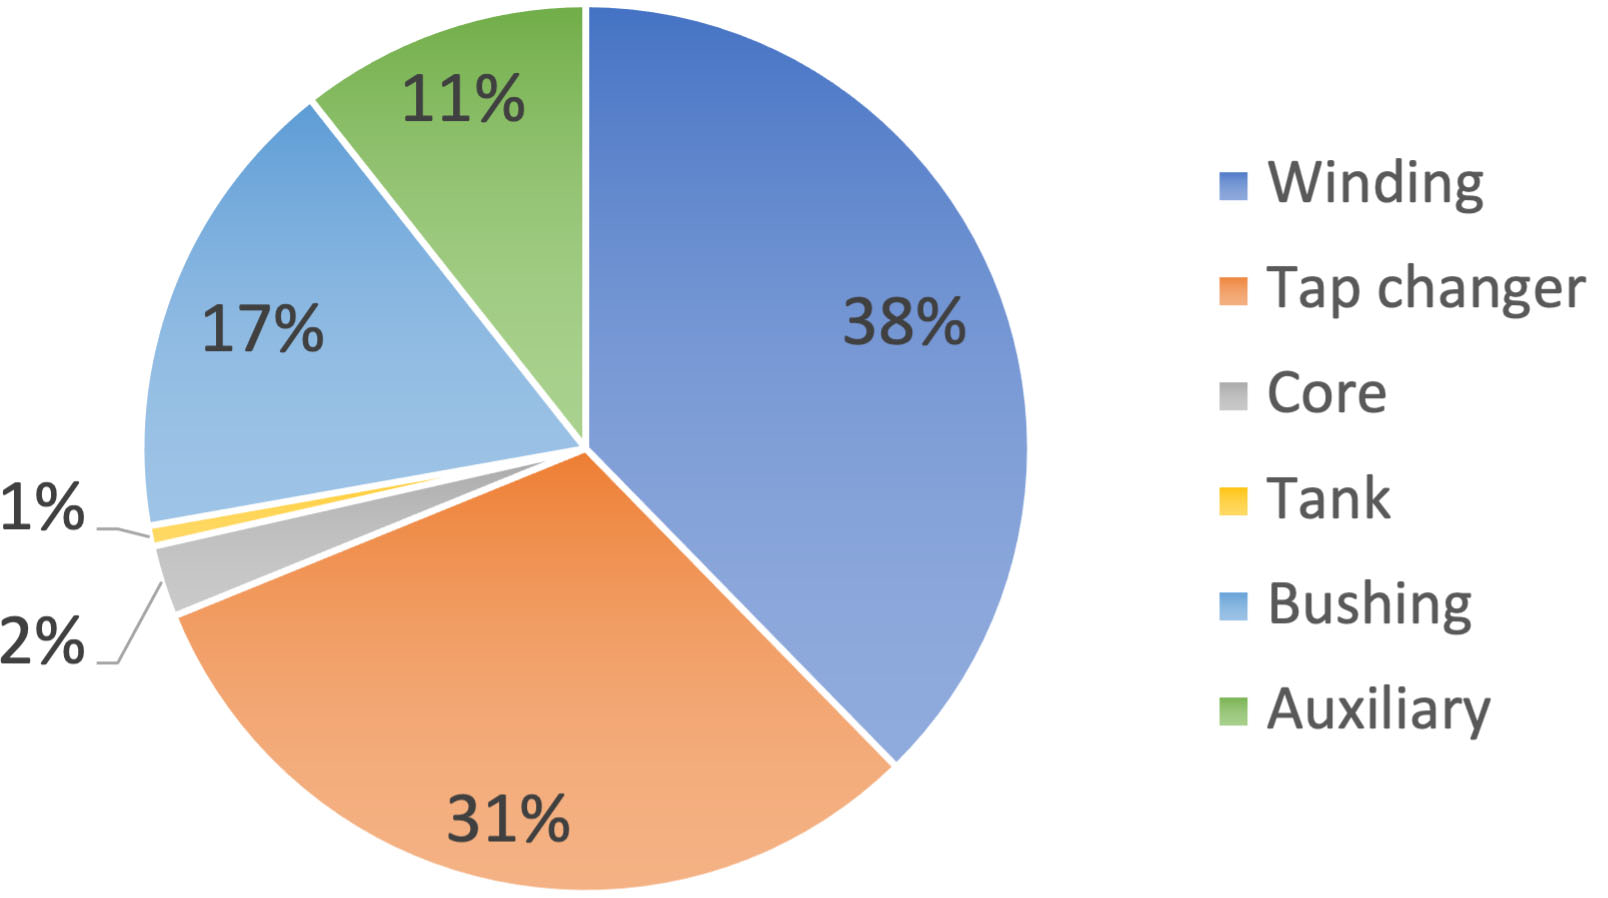
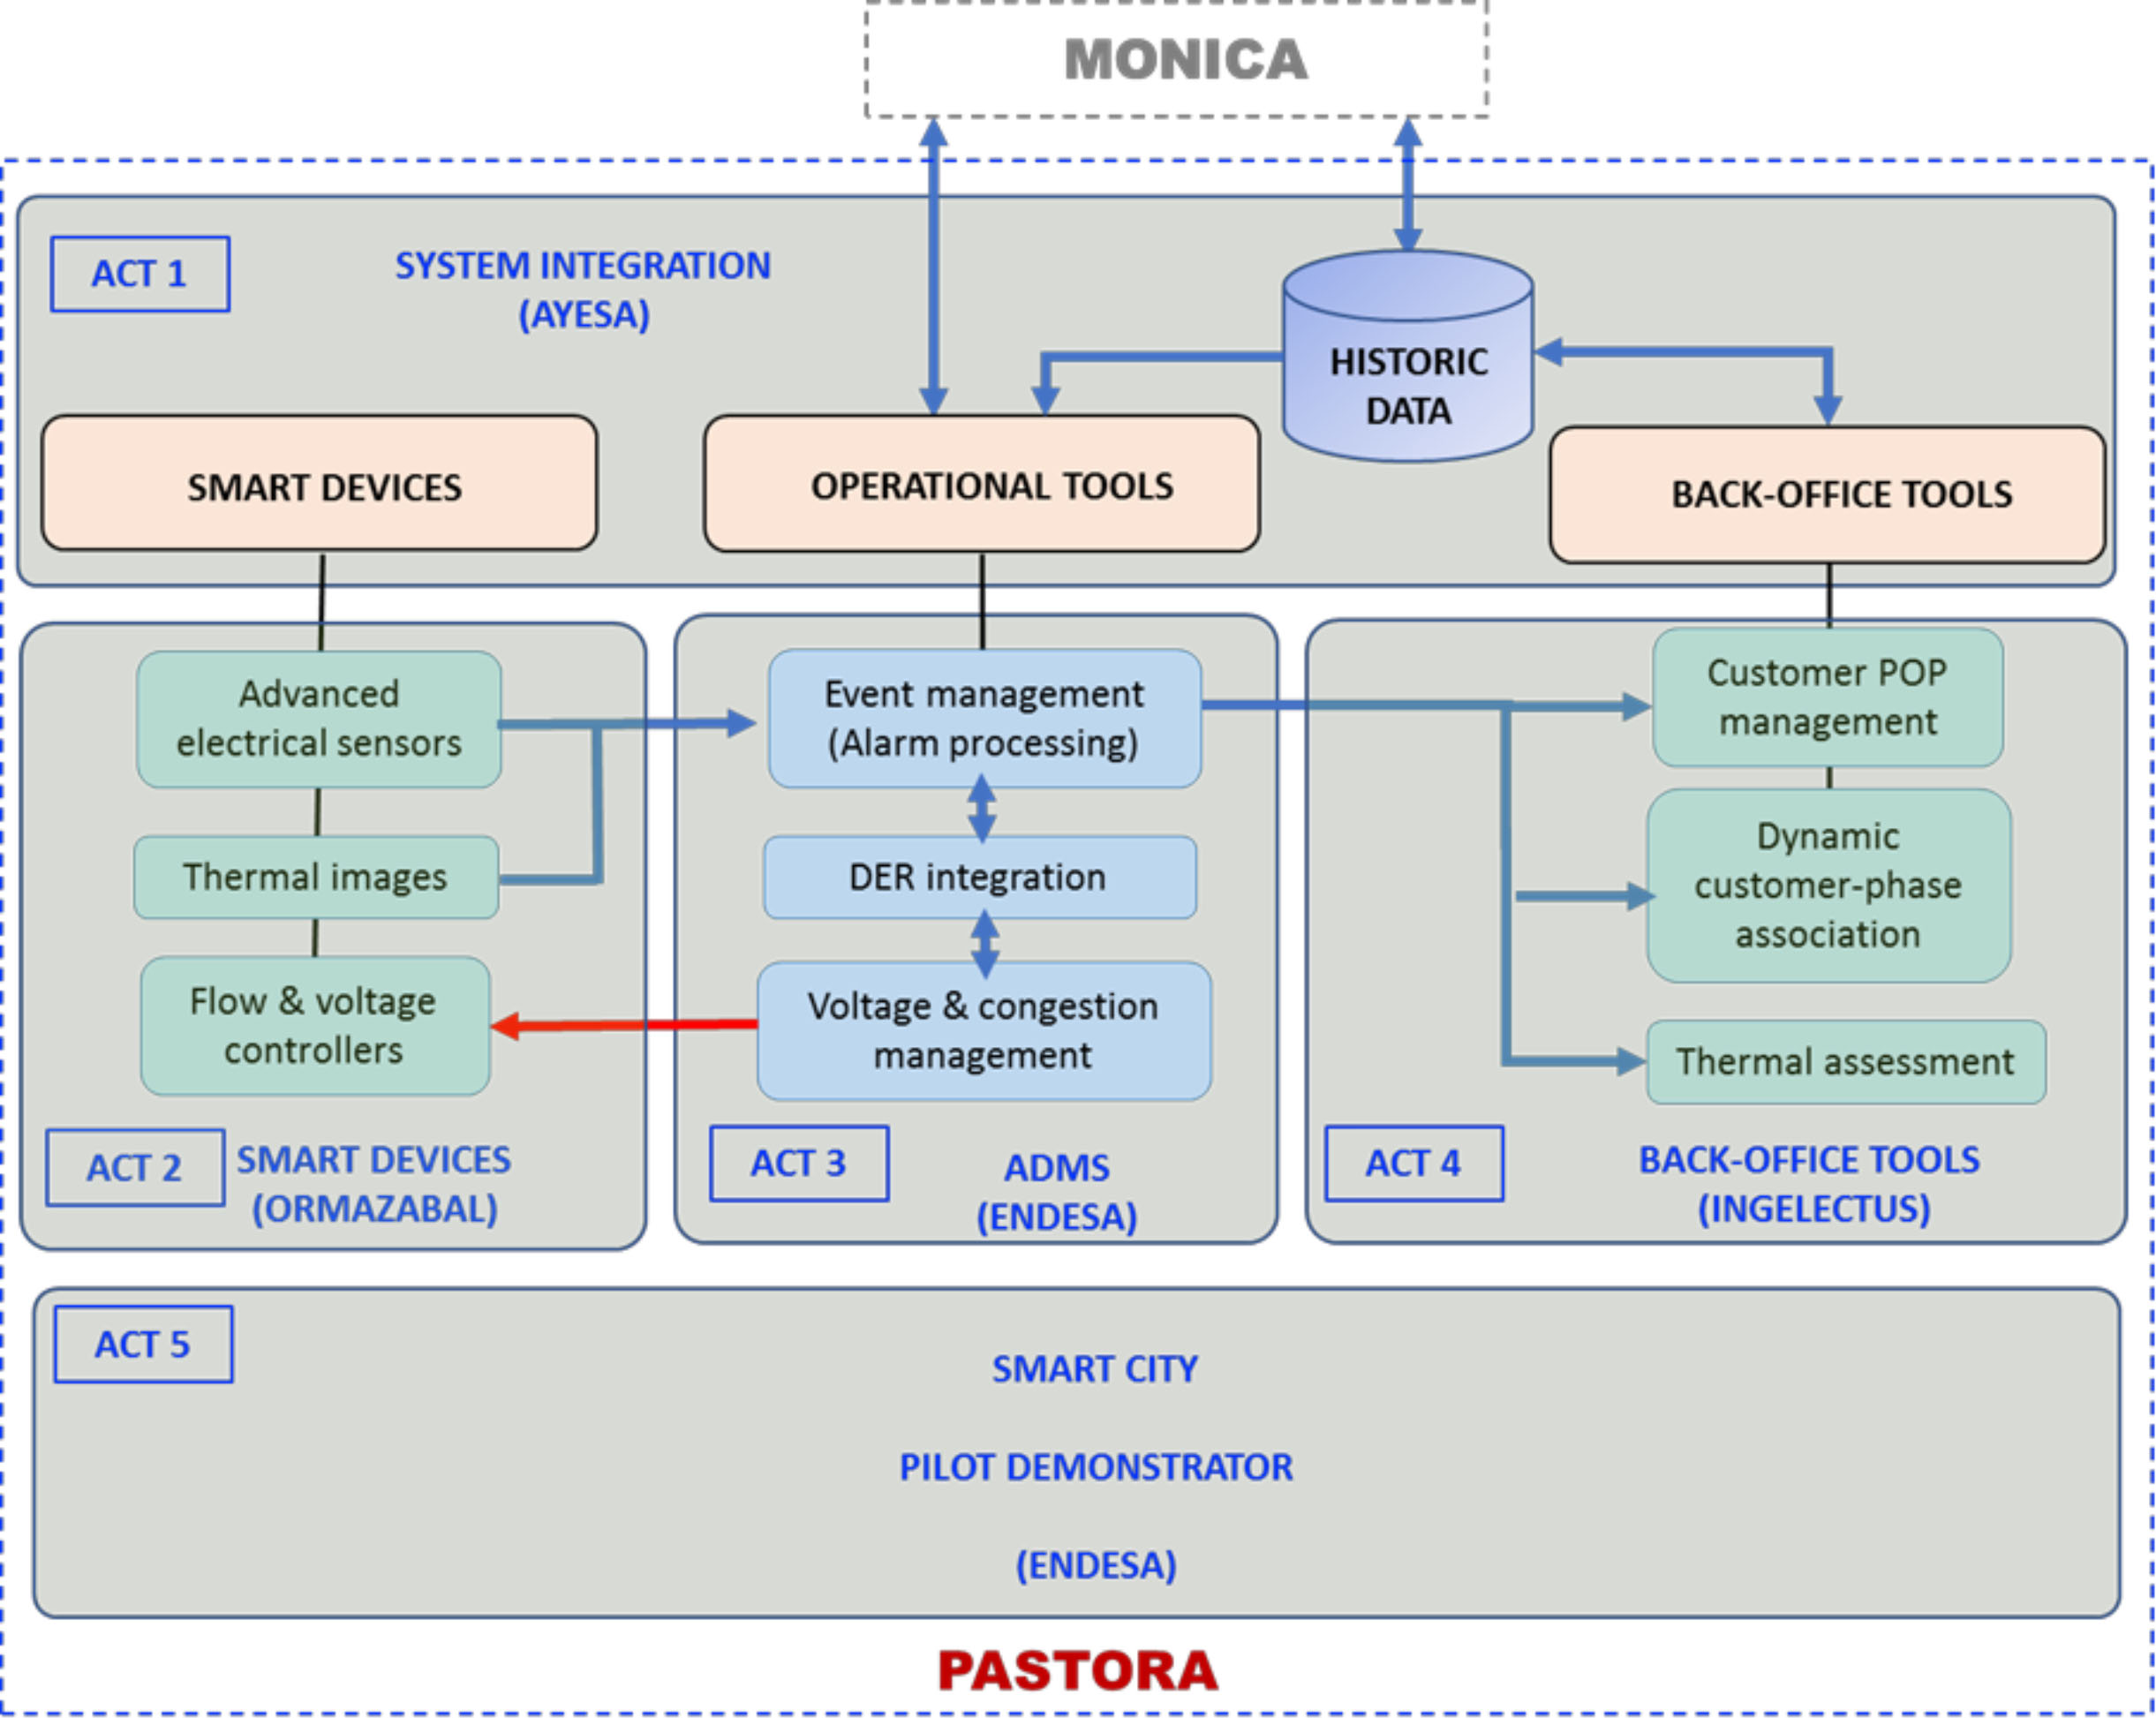
Figure 2.
PASTORA functional blocks and their relationship with the MONICA platform.
The reason for failures depends to a large extent on the component in which they have occurred. Thus, for example, tank failures can occur due to corrosion, which in turn is linked to environmental conditions (high humidity, solar radiation, etc.) and can cause fissures in the tank walls, resulting in leaks. To avoid these failures, in addition to proper maintenance of the installations, a number of measurements should be carried out on a regular basis. This includes dissolved gas analysis [23], insulation moisture analysis, and controlling the operation temperatures [24]. The measurement of both the transformer temperature and the room temperature is therefore part of standard protocols for monitoring power transformers [25, 26, 27]. These are relevant variables that should be measured accurately and uninterruptedly and can also be used to forecast other variables such as reactive power or intensity [28].
In conventional approaches, temperature measurement is usually carried out by sensors that are integrated into the transformer equipment and are, to some extent, part of the transformer system. In this regards, a variety of sensors is available, and their characteristics and principles of operation are highly dependent on the type of transformer whose temperatures are monitored. In Liquid-Immersed power transformers, the temperature of the liquid (usually oil of different natures) is used as a estimation of the transformer temperature. In such cases, contact probes are used to measure the liquid temperature. The temperature of the transformer winding is also usually measured by contact sensors. This approach is possibly the simplest and most straightforward, however, it has the disadvantage that it can be affected by potential transformer problems, thus losing its ability to predict transformer malfunctions [29].
In this manuscript we describe a system based on thermal imaging to monitor the room and transformer temperature of electrical power transformers. Thermal imaging or thermography is a mature technology that allows us to capture the invisible heat emitted by objects whose absolute temperature is above zero [30]. It has been successfully applied for monitoring purposes in many fields, as civil structures [31, 32], machinery inspection [33] or in the nuclear industry [34]. In addition, this technology has been recently proposed to correct temperature problems in electrical substations [35].
The proposed approach has been implemented and evaluated in 14 transformation centers belonging to the Spanish power grid [36]. The measures obtained with it were validated against the standard sensor-based reference scheme. Compared to the latter, the proposed approach offers some advantages. The most important of these is the fact that the system is completely independent of the power transformer, and without physical contact with it, so it is not affected by potential transformer failures (high temperature peaks or too frequent temperature fluctuations may damage the sensors). It is also a more scalable system, capable of monitoring not only the temperature of the transformer, but also of different transformer components independently, or of adjacent equipment. This would be possible by only modifying the thermal image processing algorithm, without hardware changes. Finally, the proposed system based on thermal cameras can be used as a security system capable of detecting the presence of living beings (animals or people) near the transformer, based on the temperature changes detected.
The contributions of this work are both technical and scientific. On the technical level, this is the first time (to our knowledge) that electrical variables and temperatures obtained from sensors and temperature data extracted from thermal images have been analyzed together. This study, in fact, is part of a pilot project to evaluate the usefulness of this system in order to subsequently extend it to the whole ENEL network in Europe. On the scientific level, this work includes an extension of the work presented in [37], in which Granger causality is used to characterize the state of the transformer and its evolution. In this work, information exogenous to the transformer (variables extracted from thermal images) was included, demonstrating the relationship between this information and other electrical variables.
This work is part of the PASTORA project11 (ref. EXP – 00111351/ITC-20181102), which is being developed by ENEL and other international companies as an extension of the MONICA project.22 Both projects aim to develop an advanced monitoring system for the distribution networks and the electrical transformation system that allows operators to perform real-time monitoring and preventive control of these assets. These objectives include the use of artificial intelligence to enable self-management between the downstream elements of the network and the medium voltage substations, through intelligent electronic devices and automated control centers. Figure 2 shows a functional diagram of the PASTORA project, as well as the main information flows between the different subsystems and the MONICA platform. It includes the 5 parts in which the project objectives are divided and the companies of the consortium in responsible for implementing each of them.
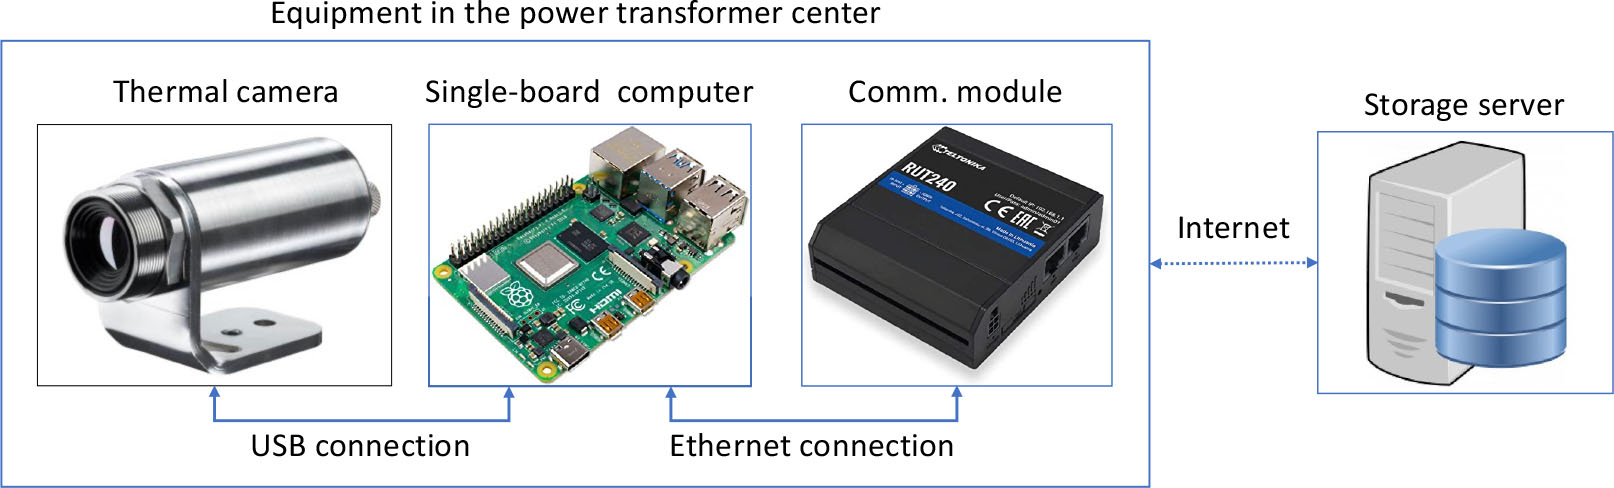
Figure 3.
Main devices required by the proposed monitoring system and connections among them.
The rest of the manuscript is organized as follows: Section 2 contains the details about the system implementation, including hardware description, communication protocol and image processing. Section 3 shows the comparison between the measures obtained by the proposed system and those obtained by the standard approach. Then, Section 4 discusses the advantages and limitations of each solution. Finally, Section 5 contains the conclusions and future work plans.
2.Material and methods
2.1System requirements
A temperature monitoring system for electrical transformers based on thermal imaging must satisfy the following minimum requirements:
• Uninterrupted operation. Since the electrical transformation system operates 24 hours a day, 365 days a year, the monitoring system must also be able to operate uninterruptedly.
• Acquisition frequency of at least one thermal image per minute. In order to provide a promptly respond to temperature changes, the acquisition system must be able to take at least one thermal image per minute.
• Coverage of an area of at least
• Secure external data storage. Thermal data and all information related to temperature control must be securely stored in a location external to the transformation system.
• Secure communications system. Communication for sending and storing data externally must be done in a secure and reliable manner.
• Tolerate operating temperatures above 40 degrees Celsius. Nevertheless, this value highly depends on the environment in which the system is installed, including both, the climatic conditions of the region and the size and ventilation of the room.
2.2Thermal-imaging-based system description
The monitoring system, designed and implemented to to meet the requirements specified in Section 2.1, was composed by several devices placed in different locations. The acquisition equipment (AE) is located next to the power transformer and composed by a thermal camera, single-board computer (SBC) and communication module. The storage and processing server (SPS) is located in a data center, away from the power transformer (see scheme in Fig. 3). Further details about the specification of these devices are given as follows:
• Thermal camera. A commercial model from Optris, the Xi 80, was selected. This model provides thermal images of
• Single-board computer. This device controls the thermal camera (which is connected via a USB port) and temporally stores the thermal images on a memory card, which works as a small buffer. In addition, it periodically submits the images stored on the memory card to the SPS using the communication module described bellow. This SBC is based on a Raspberry Pi 4 equipped with a 32 GB SD card.
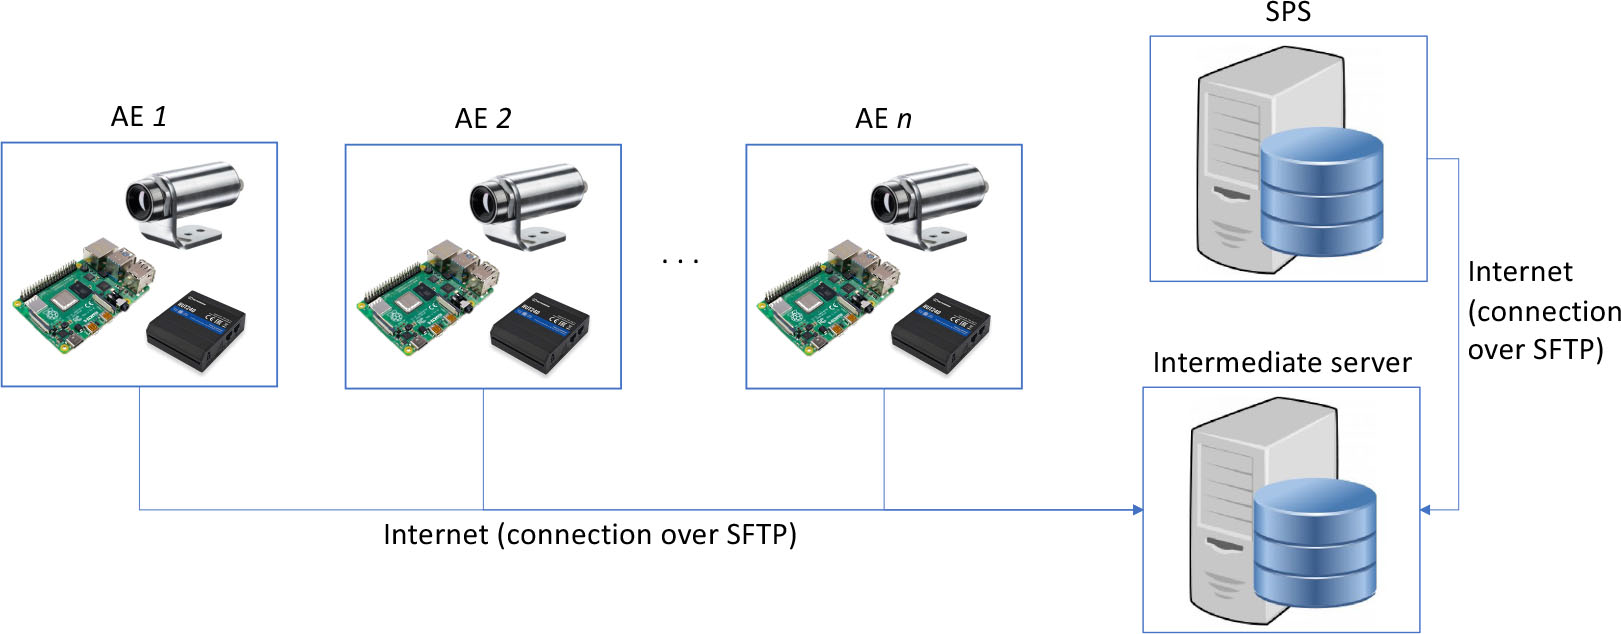
Figure 4.
Device scheme showing the integration of several AEs and communication between AEs and SPS by means of an intermediate server.
• Communication module. A Teltonika industrial cellular router (RUT240 model) was used to enable the SBC to access the storage server via Internet. This model can access to Internet using commercial mobile networks, by means of a SIM card of any carrier. This communication module is connected to the single-board computer through its Ethernet interface.
• Storage and processing server. This equipment is used to store and analyze the thermal data received from the AE located in power transformers (it can serve to several AEs located in different power transformers). Its main task is to convert thermal images into a series of values representing the room and transformer temperature, and storing them. Due to security concerns, the SPS is logically located behind an additional device that operates as intermediary, therefore in practice two servers are needed for this task. More details are given in Section 2.3.
It is worth noting that, if the temperature of several power transformer should be monitored, several AEs (one per power transformer) are required, but only one SPS.
This selection of components was carried out on the basis of both functional and economic criteria. First, a selection of components was made with those that met the required characteristics. Subsequently, the lowest cost component was selected from among those selected. Special attention was paid to the economic criteria since the system is intended to be an alternative the cheaper sensor-based monitoring system and, to that end, the price increase compared to the latter must not be excessive. In this regard, the most critical element of the system in terms of price was the thermal camera, which represented the majority of the hardware cost. Thus, an exhaustive search was carried out for this component and several quotations from the main manufacturers (including Infratec, Fluke, Flir and Optris) were collected. After analysis them, the Optris Xi 80 model was selected due to its cost, which was substantially lower than other proposals, while maintaining the main requirements in terms of resolution, frame rate and field of view.
2.3Logical control and security aspects
The logical control of the proposed monitoring system is carried out by three processes that are run in the SBC and the SPS using a structure focused on reliability and security (note that thermal data is transmitted via the Internet and special attention should be paid to the communication security). On the one hand, two processes running on the SBC are responsible for thermal data acquisition and temporal storage. The first one captures thermal images at a rate of one image per minute and stores them on the temporal storage of the SBC. The second one submits the thermal data acquired in last minutes to the SPS for processing and permanent storage. The destination of this submission is indeed an intermediate server that work as firewall for the SPS. Both, data acquisition and sending rates are parameterized, so they can be easily adapted to future requirements. On the other hand, a process running on the SPS periodically collects the thermal data that has been placed on the intermediate server. The connection scheme is shown in Fig. 4. This structure, with an intermediate server and two processes to move data between the temporary storage in the SBC and the SPS, allows the SBC to not have access to the SPS, which improves the security of the entire system by preventing the SPS from being accessed if the security of any AE is compromised.
2.4Image processing
Figure 5.
Thermal image (left) and visible image (right) of a power transformer currently serving a residential area in southern Spain. Note that both images were acquired with different cameras as thermal camera used in this work only provide thermal images.
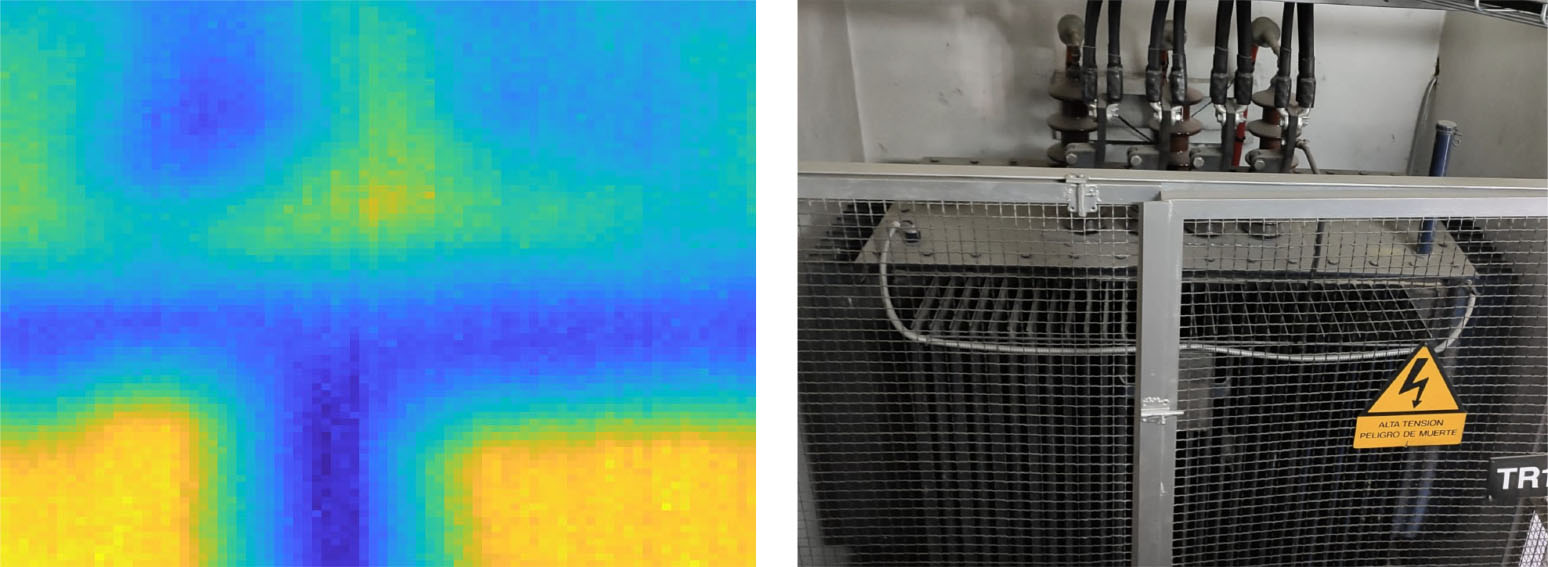
After storage in the SPS, the thermal images were processed to extract temperature information. Both, room and transformer temperatures, were estimated as the average temperature of pixels at specific locations in thermal images. Transformer temperature was obtained from pixels containing the surface of the power transformer while room temperature was obtained from the pixels of the fence that is part of the metallic structure that protect the power transformer. Figure 5 shows a thermal image (left) and its visible-range equivalent (right) of a power transformer currently serving a residential area in southern Spain. The blue T-shape region in the lower half correspond to the protection fence and was used to estimate the room temperature. The transformer temperature was estimated from the pixels containing the transformer surface, placed on lower left and right corners.
In order to efficiently process the time series of thermal data, the calculation of room and transformer temperatures was carried out into two phases. First, a reference made-up thermal image (representing temperatures independent of time) was segmented in order to obtain two masks, one for selecting pixels of the fence and other one for selecting pixels of the power transformer surface. Then, both masks were applied to all the images in the time series to extract the pixels of the fence and the pixels of the transformer surface separately and, from them, obtain the two target temperature series.
For the first phase, two segmentation approaches were evaluated. The first one carried out the process in 3 steps: i) downsampling by means of the SLIC superpixel method proposed by Achanta et al. [38], ii) requantization using several thresholds computed according to [39] and iii) separation of the regions of equal intensity by applying the Maximally Stable Extremal Regions algorithm [40]. The second approach used a Gaussian Mixture Model to model the image. Pixels belonging to each component (Gaussian) were treated as different regions and, finally, spatially separated regions of equal intensity are considered independently by applying the MSER algorithm. All these algorithms are briefly described below.
2.4.1SLIC superpixel method
Simple linear iterative clustering (SLIC) is a clustering method proposed by [38]. It is a variant of
• SLIC significantly reduces the number of calculations and complexity by limiting the search region to the size of a superpixel.
• It uses an adaptive distance measurement that combines spatial proximity and color, allowing both size and compactness of superpixels to be controlled.
The algorithm begins by establishing the center of
2.4.2The Otsu’s method
The Otsu’s method [39] is a non-parametric algorithm frequently used for threshold selection in image segmentation problems. Its main idea is to select the threshold that maximizes the separability of the resulting classes in gray levels [42].
The procedure uses the zeroth- and the first-order cumulative moments of the gray-level histogram and reduce the problem to an optimization problem that maximizes the class separability. Formally, in a problem with two classes the threshold,
(1)
where
2.4.3Maximally stable extremal regions algorithm
SLIC and Otsu’s methods allow us to group the pixels of an image according to their intensity level but do not take into account the distance between pixels. The Maximally Stable Extremal Regions Algorithm (MSER) algorithm [40] includes this information in the segmentation procedure thus, areas of the image whose pixels have similar intensity levels but are not connected (are separated by pixels with different intensity levels) are considered different regions.
The algorithm was designed to address the stereo problem in image analysis, i.e. the problem of establishing the correspondence between several images of the same scene taken from different viewpoints, but it can be used for other image analyses as tracking color objects [43] or detecting regions based on color [44].
The general idea of MSER can be explained as follows: Let us imagine a grayscale image as a 3D structure in which each point has a height corresponding to its intensity level. If we drop a fluid on a point, it will spread out, occupying a wider and wider area with the points (pixels) that have less height (intensity). If this process is done simultaneously at different points, regions will appear and as the fluid level rises, they will be connected to each other. The process ends when the stability criterion is reached, which is continuously checked as the fluid falls.
2.5Gaussian mixture models
Gaussian mixture models (GMMs) are probabilistic models that allow the identification of subpopulations within the same heterogeneous population [45]. They use the density estimation of the data set to define subsets and thus delimit several groups. GMM algorithms suppose that the data,
(2)
where
GMM parameters can be accurately estimated using an iterative Expectation-Maximization (EM) approach. This algorithm starts by initializing the
• For each of the samples in our data set, the posterior probability of belonging to each component (Gaussian) is calculated.
• Using the maximum likelihood, component means, covariance matrices, and mixing ratios are computed. Posterior probabilities of component membership calculated in the previous step are used as weights.
2.6Background on Wiener-Granger causality
Wiener-Granger causality (a.k.a. G-causality) is a statistical test intended to analyze the relationship between two time series. Originally introduced by Wiener [46] and subsequently adapted to the analysis of economic studies by Granger [47], G-causality allows us to determine weather a time series can be used to forecast another time series or, more precisely, weather a time series
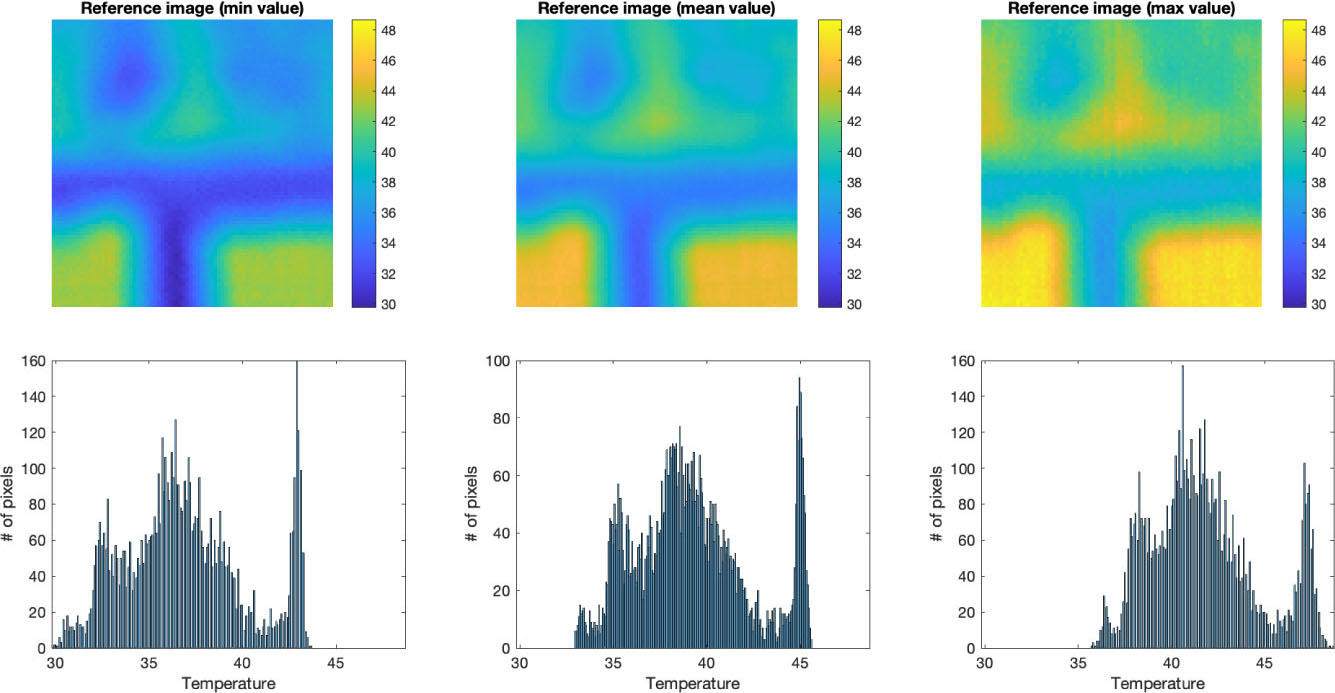
Figure 6.
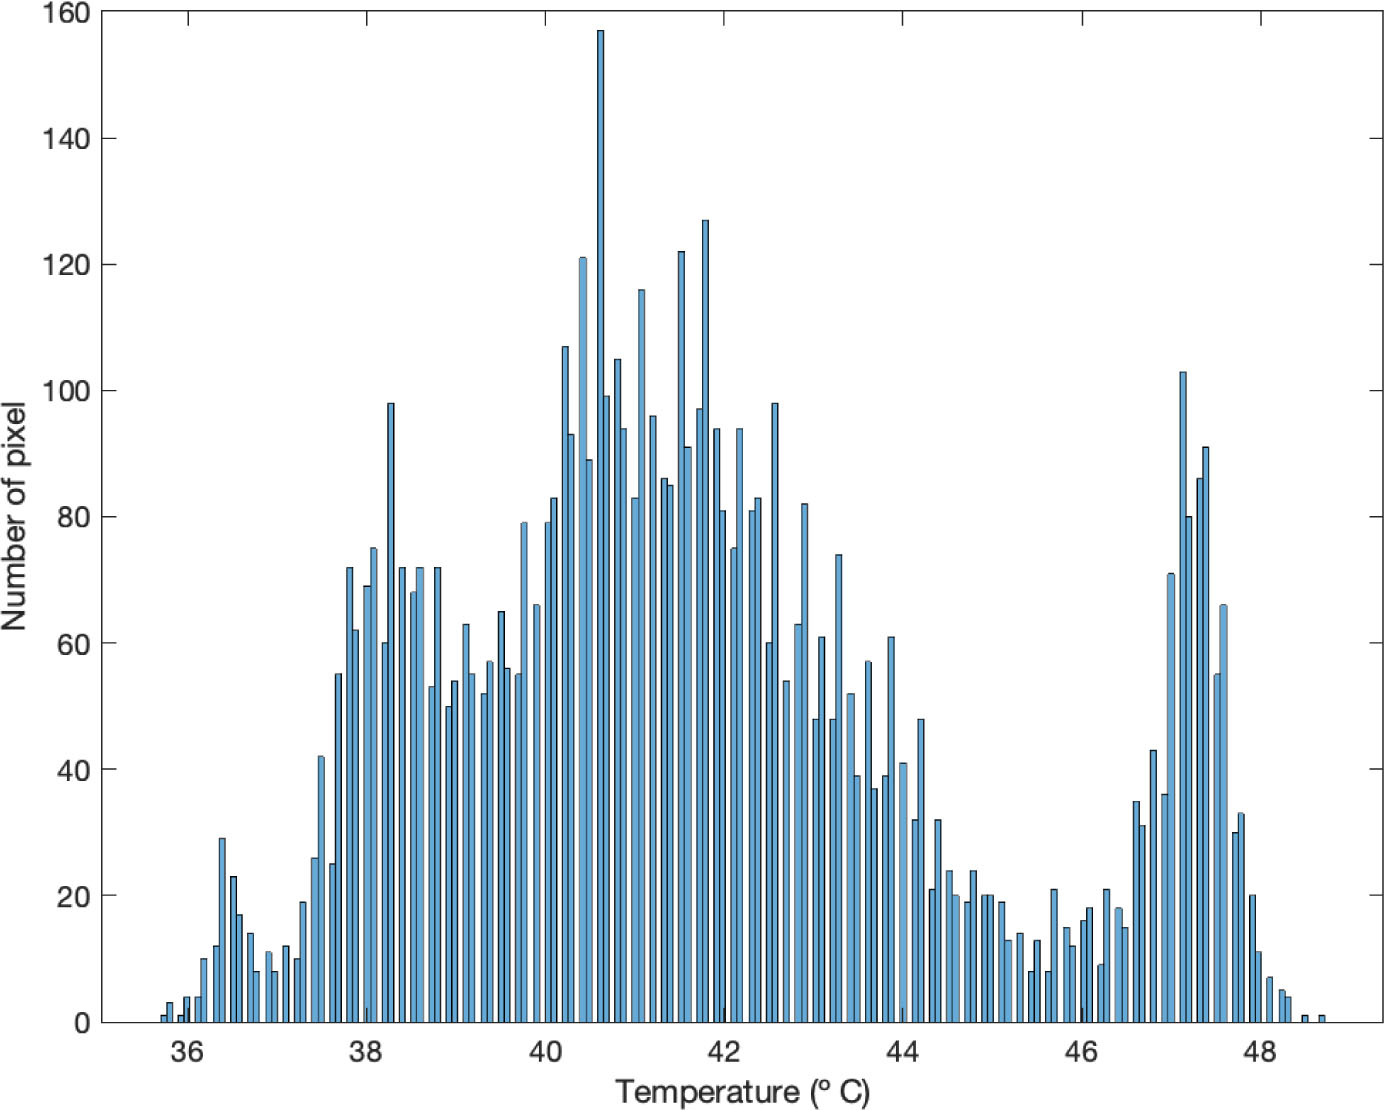
Top row: Reference images obtained by computing respectively the minimum, mean and maximum (pixel wise) of 1440 thermal images captured along 24 hours at a rate of 1 per minute. Bottom row: Histogram of images in the top row.
The conditional dependence of one time series on another can also be quantified by a statistic, F, which measures how much better the adjustment (lower error variance) of the conditional model is compared to the non-conditional model. Let’s suppose two time series,
(3)
(4)
where
(5)
where
(6)
and
Figure 7.
Variation of the average temperature measured from thermal images throughout the day.
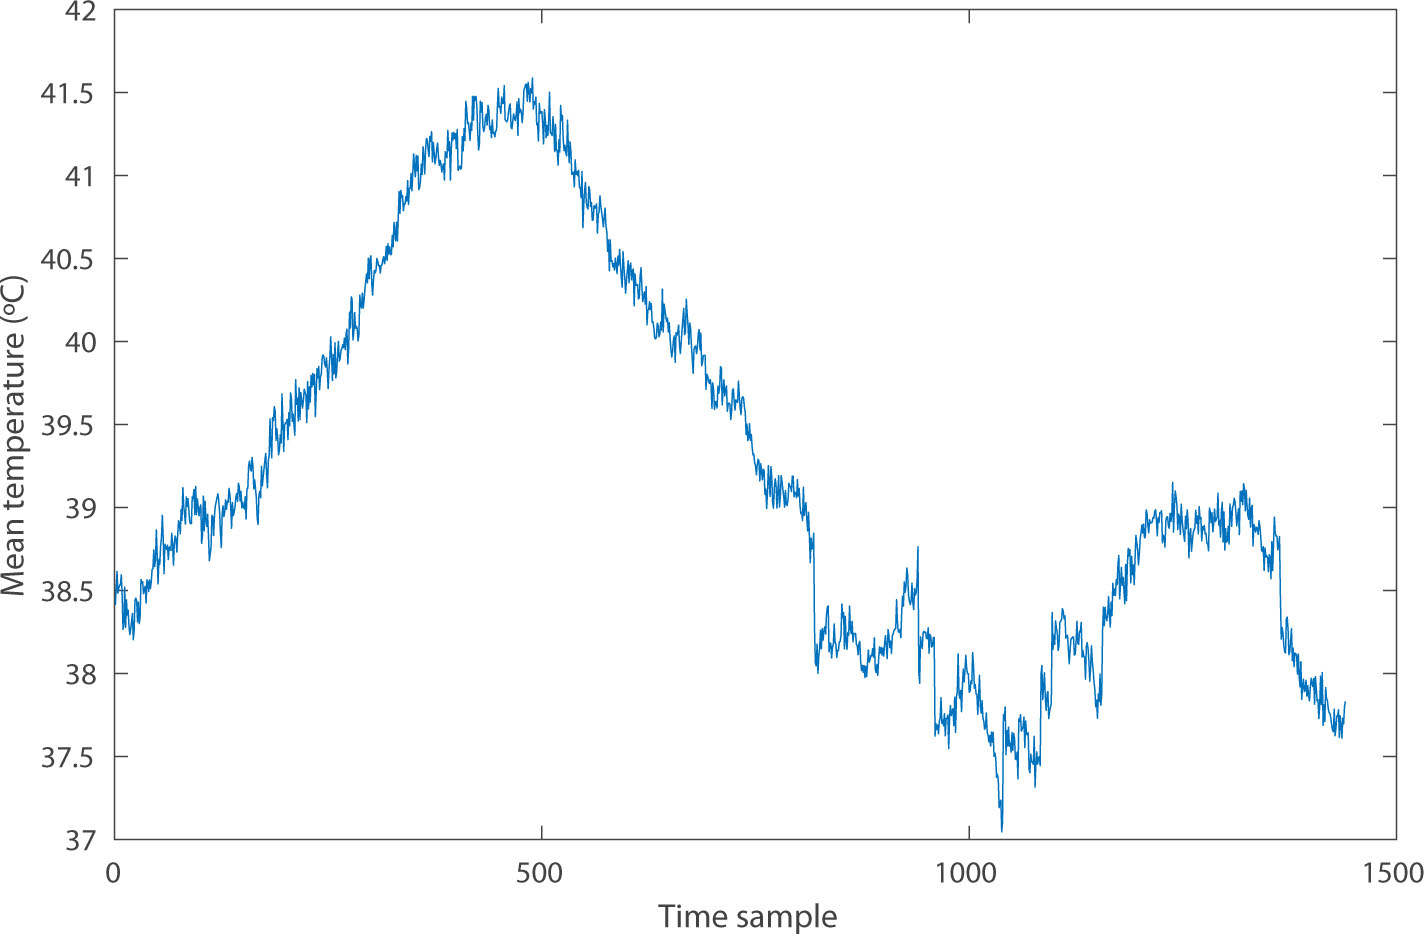
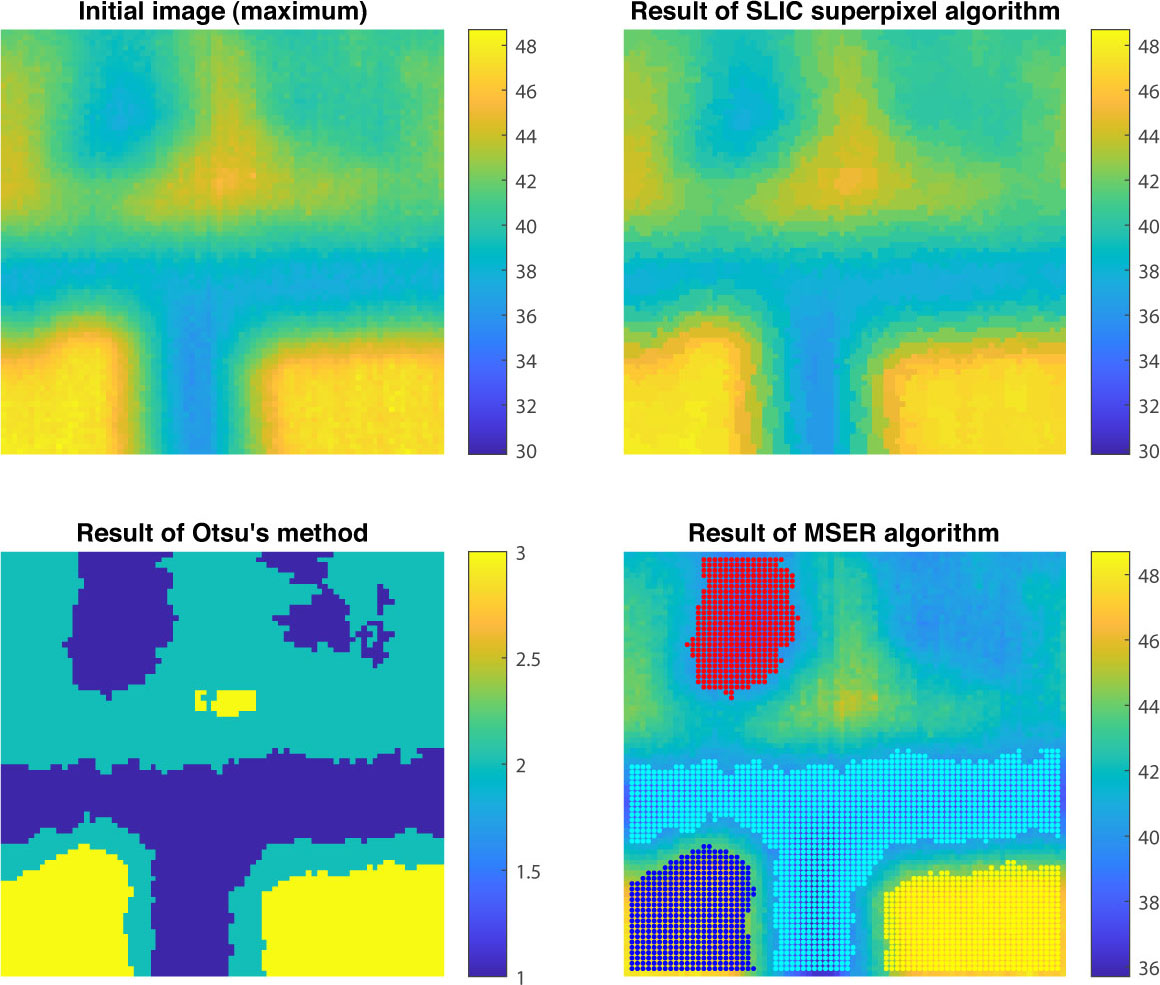
Figure 8.
Segmentation procedure based on SLIC superpixel, Otsu’s and MSER methods
3.Experiments and results
The proposed thermal imaging-based monitoring system was installed at 14 transformer stations of the Spanish power grid. They were configured to capture thermal data at a rate of one image per minute and data was stored and processed on a remote server as described in Sections 2.2 and 2.3. All equipment was configured in our laboratory prior to installation in the transformer centers. This configuration included the calibration of the thermal cameras, which was carried out by setting the factory calibration through the library provided by the manufacturer to configure and control the device. In our case, this factory calibration was adequate since we did not focus on absolute temperature values, but on temperature changes. Beside calibration, some environmental factors, as camera positioning, can affect the temperature measurements. This influence is small (less than 1% at distances between 0.5 and 2.5 meters) for the camera model used, however, in order to avoid differences between the operating temperatures assumed to be normal from one transformer substation to another, all the cameras were installed at a distance of approximately 2 meters from the surface of the transformer.
As mentioned in Section 2.4 the image processing carried out to extract two temperatures from each thermal image required a previous stage of segmentation of a reference image representing the temperature profile of each transformer. In order to build this image, 1440 thermal images taken over 24 consecutive hours were used, and three aggregation measures (mean, minimum and maximum) were considered. This way, the image is independent of the time of day and the whole method is able to deal with images captured at any time. Figure 6 compares the result of these three options. Note that all the three have a similar temperature profile and can be used indifferently for this purpose. For simplicity we selected the last one, where each pixel was calculated as the maximum number of pixels in the same position in all images.
Two segmentation approaches were evaluated. The first one, based on Otsu’s method for thresholds selection, carried out the segmentation into three step:
• First, the image was downsampled using the SLIC superpixel method proposed by Achanta et al. [38]. The parameter
• Then, the resulted image was requantized using several thresholds (multiclass version) computed according to [39].
• Finally, spatially separated regions of equal intensity are considered independently by applying the Maximally Stable Extremal Regions algorithm [40].
The intermediate results of these steps are shown in Fig. 8. Note how, after the last step (MSER application), four clearly differentiated regions appear. The two with the highest average intensity correspond to the transformer and were used to select the transformer pixels while the one with the lowest average intensity corresponds to the protective fence used to estimate the room temperature.
Figure 9.
Intensity profile of the reference image computed as the maximum.
The second segmentation approach proposed in this work modeled the reference image with a mixture of Gaussians and then identified each region with a Gaussian. After obtaining the Gaussian mixture parameters (see Eq. (2)) using a Expectation-Maximization algorithm, the MSER algorithm was also used to separate into regions areas of equal intensity located at distant positions. Given the shape of the intensity profile of the reference image (see Fig. 9), a model with 3 Gaussians was used to fit the image. This would ideally associate one component with pixels of higher intensity (located on the surface of the power transformer), another with pixels of lower intensity (representing the protection fence) and a third component with the rest of the pixels having an intermediate temperature. In practice, some pixels with a temperature similar to that of the protection fence were associated with the same component as the fence, as shown in Fig. 10. In order to isolate the pixels of the fence, we applied the MSER algorithm as in the alternative approach based on SLIC superpixels and Otsu’s methods. In our experiments, both approaches for image segmentation produced almost identical time series of temperatures.
Figure 10.
Result of segmenting the reference image computed as the maximum using a GMM model with 3 Gaussians.

Figure 11.
Comparison of transformer and room temperatures obtained by the proposed system and those obtained by sensor based approach.
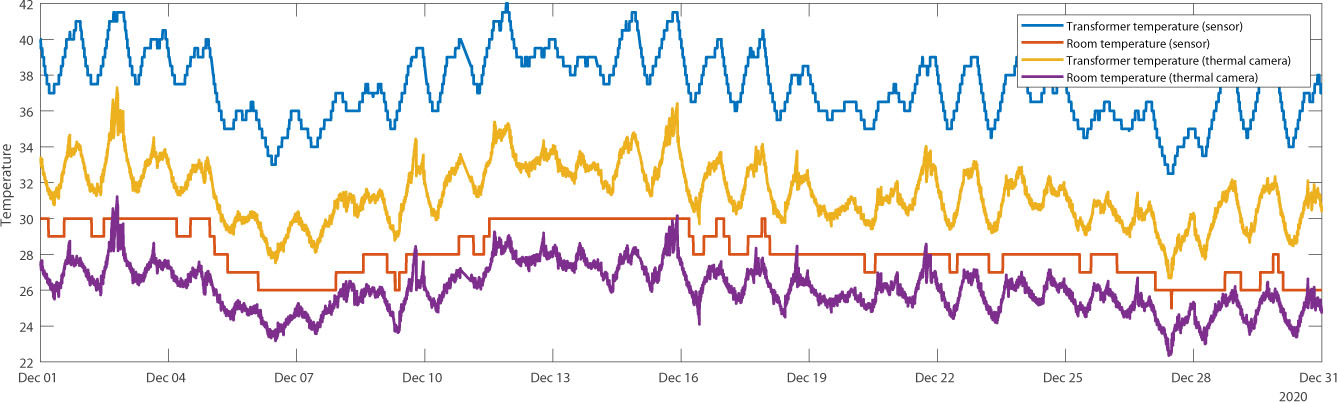
Figure 12.
Transformer temperature obtained by the proposed system based on thermal cameras (red) and by sensors (blue). The former temperature has been shifted so that both have the same mean and in order to the correlation between them can be easily appreciated.
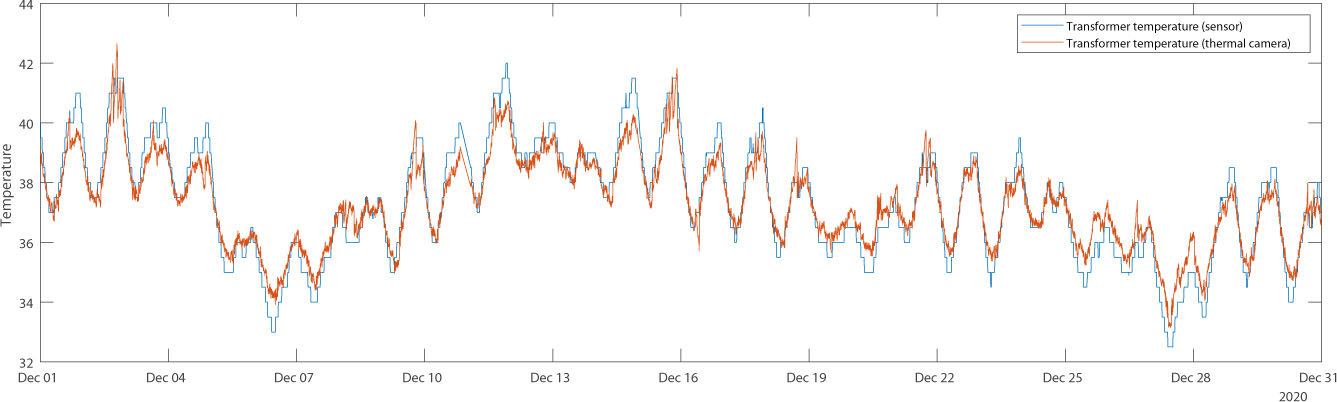
The evaluation of these systems was carried out by comparing the temperatures obtained by them with those obtained by the more standard approach, based on sensors. Figure 11 shows a comparison between the temperatures registered by the proposed system and those obtained by sensors. Note that, despite the offset probably due to differences between the calibration of the sensors and the thermal cameras, there is an almost perfect correlation between the temperatures recorded by the two systems. This correlation can be easily seen if we remove the offset, as is done in Fig. 12, where the temperature obtained from the thermal camera was shifted so that it has the same mean as the temperature obtained from sensors.
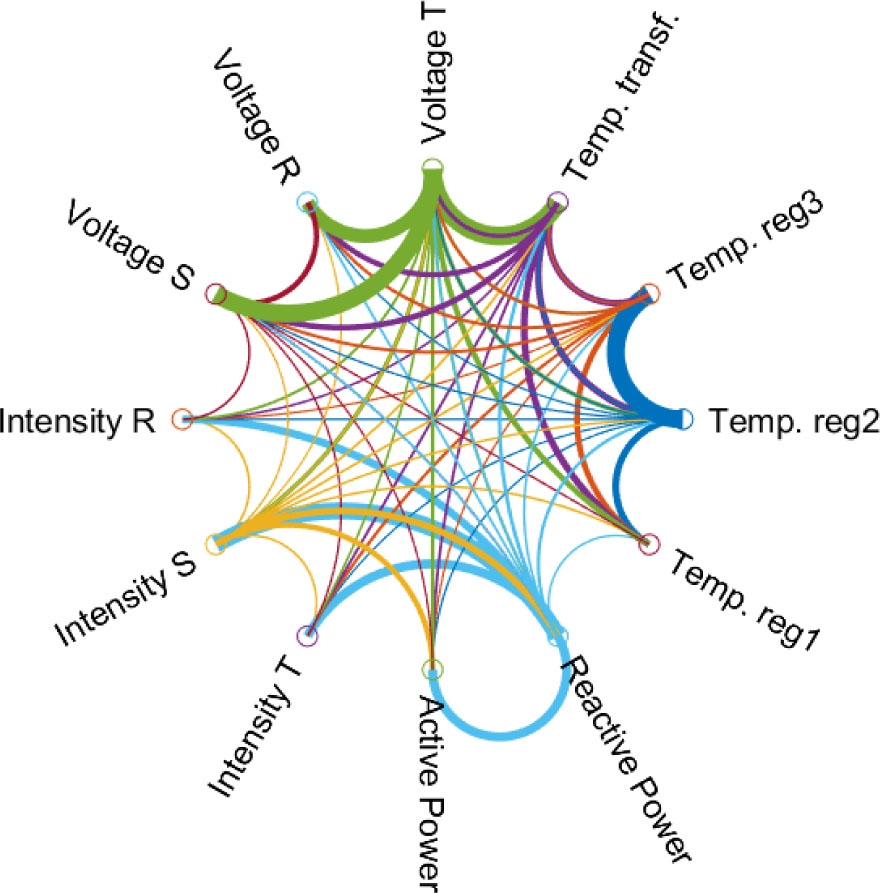
In order to further investigate the relationship between the temperatures obtained by the standard and the proposed monitoring systems, and even the relationship between temperatures and other operating variables, we performed an additional analysis based on G-causality. The results are shown in Figs 13 and 14. The former figure represents the F statistic for some variables of interest, including temperatures computed using the standard and proposed monitoring systems. It was computed using the expression (5). Figure 14 shows a circular graph with stronger connections among the same variables.
Figure 13.
F matrix based on conditional G-causality (see Eq. (5)) and containing a measure of the dependence of some electrical variables on others.
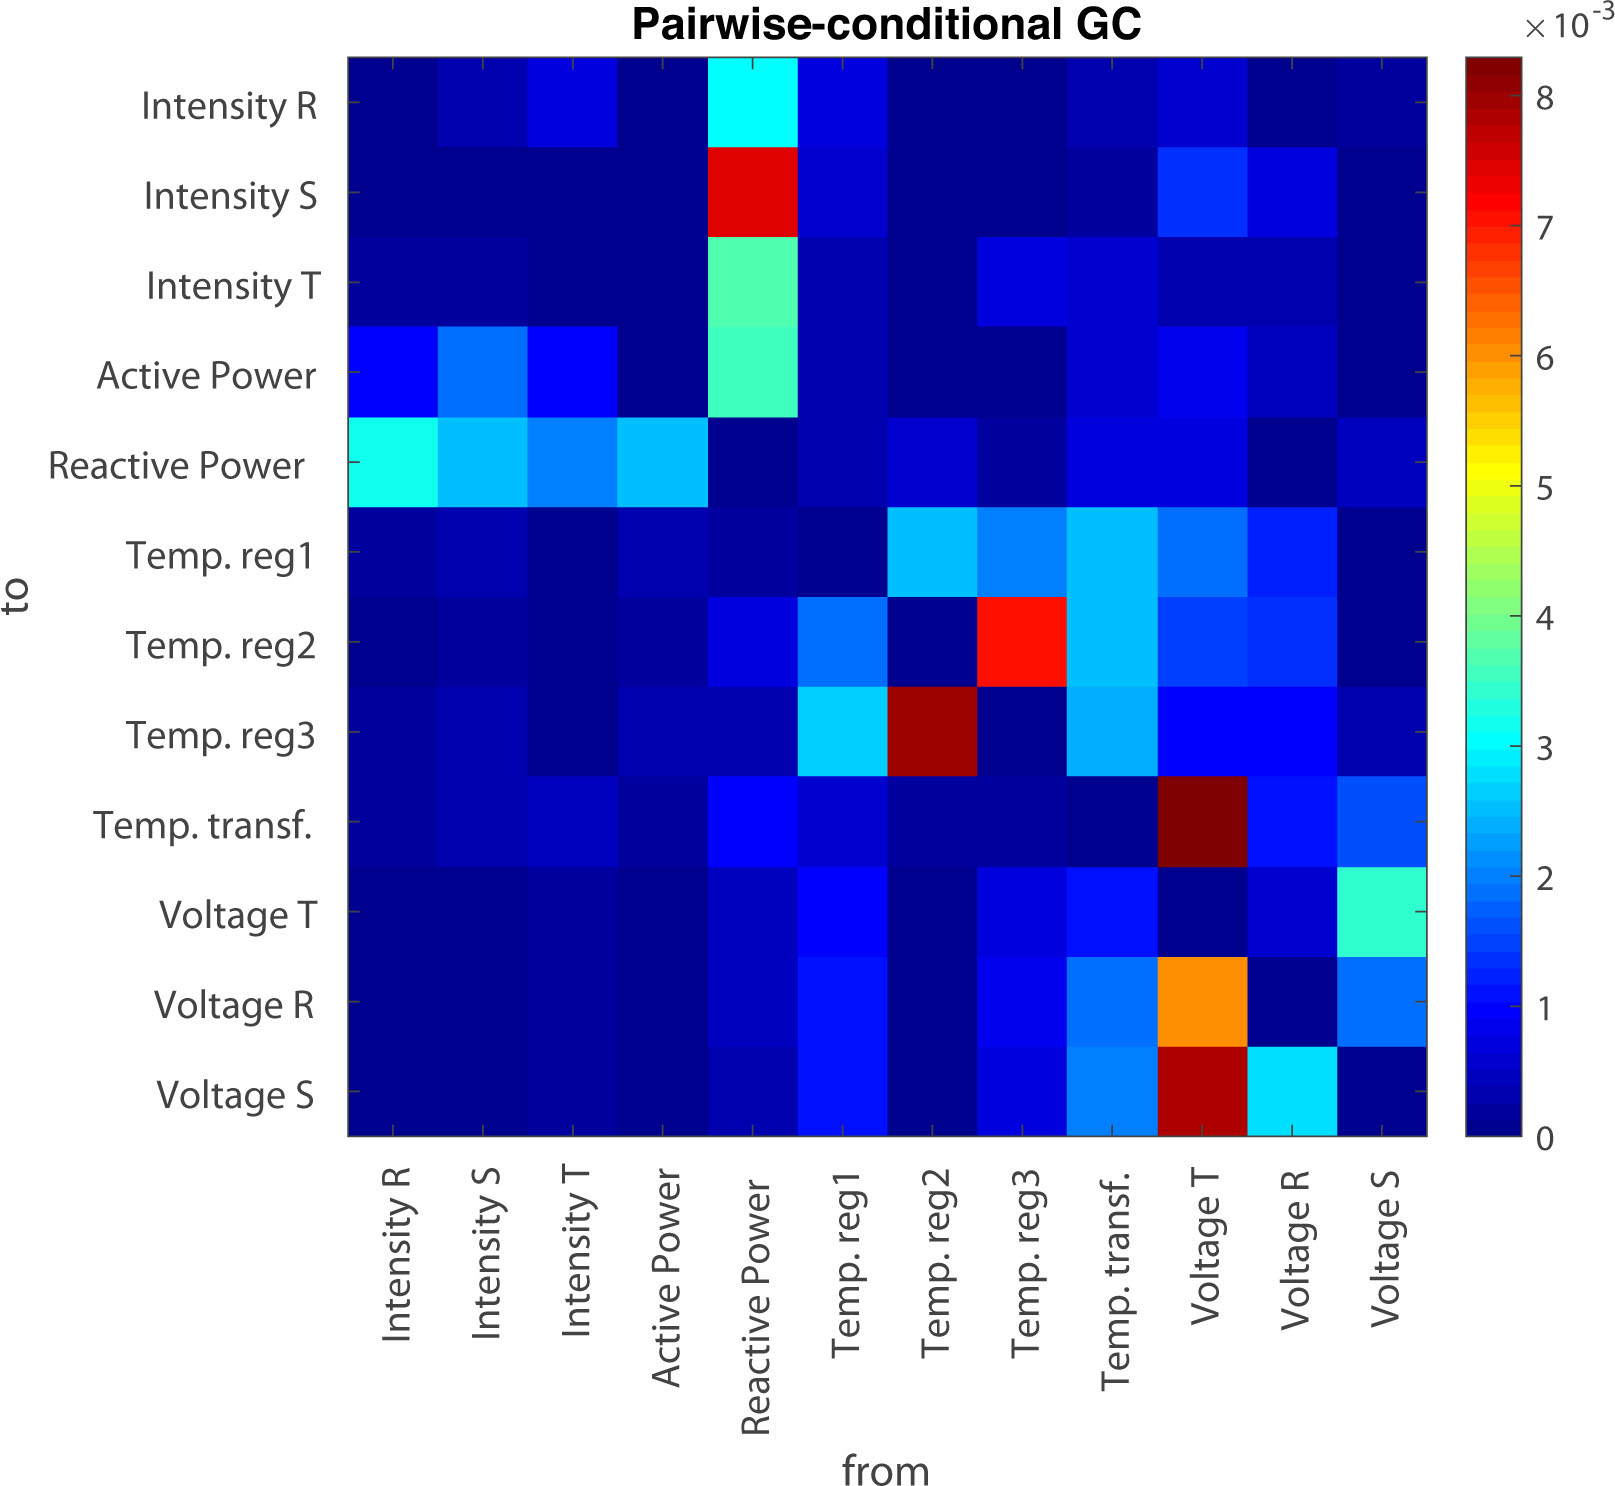
Figure 14.
Circular graph with the stronger relations between electrical variables.
4.Discussion
Temperature control plays a fundamental role in the ability of electrical power transformers to operate faultlessly [49]. Room and transformer temperatures are variables of great relevance in the analysis of transformer operation and has a clear relationship with other electrical variables. In [37], a methodology based on Granger causality is used to study the ability of some electrical variables to predict others. The results show that there is a clear relationship between the transformer temperature and other relevant variables such as current, active power, reactive power and voltage. The last experiment carried out in this work has shown that this relationship between the temperatures obtained by the proposed system and other electrical variables is also present. The relationship between transformer temperature and active power has also been corroborated in [50], which shows that it is possible to predict the transformer temperature in the near future from the active power of the three transformer lines together with the ambient temperature using long short-term memory (LSTM) networks. A similar approach was also demonstrated in [28]. In this case, a non-linear autoregressive neural network with exogenous inputs (NARX) was used to predict the temperature of the transformer as a function of past values of outputs and exogenous inputs. This scenario is also supported by the result of the analysis based on G-causality carried out in this work (figures 13 and 14). This analysis, similar to the one carried out in [37], but including the temperatures obtained by the thermal imaging-based system, meets two objectives: i) to confirm the dependence of some electrical variables on temperature and ii) to corroborate the relationship between the temperatures obtained by the proposed system and the sensor-based system.
The experiments carried out demonstrate that it is possible to obtain reliable information on the operating temperature of an electrical power transformer using a system based on thermal imaging. It could improve the temperature monitoring of electrical power transformers and, that way, reduce the probability of errors that affect the quality of the power supply and shorten the transformer lifetime.
After data acquisition, thermal images were analyzed in order to extract room and transformer temperatures. This analysis included the image segmentation by means for classical algorithms, however the use of these algorithms is not strictly necessarily. Given the fixed position of the thermal cameras and the limited number of locations where they have been installed, a manual segmentation would have been feasible. However, the automation of this task has the advantage of facilitating the extension of the proposed monitoring system to the entire power grid (manual segmentation can be tedious and time-consuming). In addition, it has all the advantages of eliminating the human factor, as subjectivity and error-proneness [51, 52]. In this work two proposals based on classical methods for automatic segmentation of the thermal images have been presented. Both provided a correct separation of the regions that allow us to calculate the transformer and room temperatures. Thus, there was no reason to opt for a manual segmentation.
Figures 11 and 12 show that the thermal camera-based system provides accurate temperatures, similar to the those obtained by the standard sensor-based system. A close examination of the figures shows, however, that there are some small differences, beyond the offset (possibly due to calibration differences). On the one hand, the data from the sensors have lower temporal resolution, which is closely related to sampling frequency of each system. Moreover, temperature peaks are slightly higher in sensor data probably due to sensor inertia. Larger differences at specific instants may be due to inhomogeneous heat distribution that causes heat to be detected earlier by one system than by another. On the other hand, differences in room temperature are more noticeable. These are due to the malfunctioning of the room temperature sensors, which were blocked for hours at a time. In any case, the proposed thermal imaging-based approach provides some interesting advantages:
• It has been set up as an external system that is not coupled to the transformer, i.e. there is no physical contact between the devices of both systems and no data transfer through the electrical network, which guarantees that errors in the transformer will not affect the monitoring system.
• Furthermore, the proposed approach is easily scalable to obtain a higher temperature granularity, i.e. to obtain not only the room and transformer temperatures but also those of other elements such as the connection terminals or the input and output lines. This would only require changing the image processing and eventually the camera orientation, but no hardware changes (additional cameras, etc.) would be necessary.
• Finally, the proposed system based on thermal imaging can also serve as a security system since it allows monitoring the transformer environment. Thus, for example, it would be possible to detect temperature changes in devices close to the transformer but external to it, which could end up affecting the transformer’s operation. Furthermore, it would be possible to detect the presence of persons attempting to tamper with the transformer.
The comparison between the temperatures obtained by sensors and those obtained by the proposed system (Figs 11 and 12) also shows the differences between the sampling frequencies of each system, which is much higher in the case of the thermal imaging-based system. This difference may lead to lower reaction times of one system versus the other, however, it is important to note that it is not so much due to the technology itself, but rather, to the configuration of the system. The reaction time of the system to a failure resulting in overheating also depends on the element in which the failure occurs. Thus, an increase in temperature of an element that is not visible from the position of the thermal camera will not be detected by the camera-based system until the heat has been transferred to the air or other elements that can be captured by the camera. Similarly, a temperature sensor immersed in the oil will not be able to detect a temperature rise in the windings until that temperature rise has caused a temperature rise in the oil as well. For this reason, the safest and most reliable monitoring strategy would be one that includes sensors of different types, including thermal cameras.
Regardless of the system used for data acquisition, data must be permanently stored in a database that allows later analyses [24]. Ideally this permanent storage is carried out externally to the transformer, i.e. in locations other than the transformer whose operation is being monitored. A communication system is therefore required between the acquisition equipment and the servers external to the transformer. Possibly, the most direct application is to use the power grid itself to transmit the monitoring data, but this makes the monitoring system vulnerable to failures in the distribution network and its implementation entails substantial costs. In order for the monitoring system to be completely autonomous from the power grid, it is necessary that the data transmission is carried out independently from the grid. However, implementing an independent data network from scratch (whether wired or wireless), involves high costs. In the proposed approach, a commercial mobile phone network was used for this purpose. This allows significantly lower implementation costs by using already deployed infrastructure, while allowing data transmission to be carried out independently of the power grid. A similar approach was previously described in [53]. Unlike the approach proposed by Jalilian et al. the communication system proposed in this paper is unidirectional. The transmission is made only from the equipment installed next to the transformer to the external database. This facilitates the system to have a certain resilience since synchronous communication is not required and in case of connection error the data are temporarily stored in a buffer memory to be sent later in a new connection attempt.
The main limitations of this work can be divided into two aspects. On the one hand, the proposed system suffers from the limitations implicit in the collection equipment used, i.e., thermal cameras. Therefore, it is not possible to directly obtain other variables of interest, such as input or output line currents or voltages. Although, as mentioned above, it is theoretically possible to estimate these variables from the temperatures, this estimation would not be free of error and would possibly not be as accurate as the direct measurement by means of specific devices. In addition, thermal camera are substantially more expensive than the sensors used in the standard approach. However, despite the high value of the thermal cameras, their price is insignificant compared to that of the monitored equipment. Moreover, a malfunction of the equipment can result in incalculable damage (from hundreds of citizens deprived of a basic good such as electricity to a fire in an urban area with unpredictable consequences), which justifies any investment in the prevention of these events.
On the other hand, the use of commercial mobile networks for data transmission between the AE equipment and the SPS can be a concern when installing the monitoring system in power transformers placed in locations where there is little or no mobile network coverage. This can be stated at least for the climatic conditions of the locations in which our experiments were carried out, i.e., average temperatures between 9 (night) and 30 (day) degrees Celsius, as is typical in autumn on the southern coast of Spain. Although additional experiments in other regions with different climates would be desirable, the results shown can be, in our opinion, reliably extrapolated to other regions with similar or colder climates.
5.Conclusions
In this work we have described a system for monitoring electrical power transformers using thermal cameras. The proposed system allows the monitoring of transformer temperatures, which are critical variables to anticipate potential failures in the system operation. Using thermal cameras, we collected information on the temperature of the transformer and its surroundings at a rate of 1 image per minute. Subsequently, by appropriate thermal image processing, we obtained two temperature values from each image, representing the room and transformer temperature, and resulting in two temperature time series (after processing of a series of images).
This approach has been implemented and evaluated in 14 transformer stations belonging to the Spanish electricity system. The experiments carried out showed that the temperatures obtained by the proposed system are as good as those obtained by widely used sensor-based systems. In addition, the system based on thermal imaging provides some advantages such as greater reliability as it is a system totally independent of the transformation system and therefore not affected by the possible errors of the latter, as well as certain surveillance capabilities.
As future work, we plan to develop time series analysis methods to predict possible anomalies in transformer operation from the registered temperature series.
Notes
Acknowledgments
This work was supported by the Consejería de Economía, Innovación, Ciencia y Empleo (Junta de Andalucía) and FEDER under B-TIC-586-UGR20 and P20-00525 projects and by the University of Granada and Endesa Distribución under the PASTORA (ref. EXP – 00111351/ITC-20181102) and RESISTO (ref. 2021/C005/00144188) contracts.
References
[1] | Mullen S, Onsongo G. Decentralized agent-based underfrequency load shedding. Integrated Computer-Aided Engineering. (2010) ; 17: (4): 321-329. |
[2] | Santofimia MJ, del Toro Garcia X, Villanueva FJ, Villa D, Escolar S, Lopez JC. A comprehensive common-sense-based architecture for understanding voltage-sag events in electrical grids. Integrated Computer-Aided Engineering. (2018) ; 25: (4): 397-416. |
[3] | Zhang Z, Guo M, Fu D, Mo L, Zhang S. Traffic signal optimization for partially observable traffic system and low penetration rate of connected vehicles. Computer-Aided Civil and Infrastructure Engineering. (2022) ; 37: (15): 2070-2092. |
[4] | Shi H, Zhou Y, Wang X, Fu S, Gong S, Ran B. A deep reinforcement learning-based distributed connected automated vehicle control under communication failure. Computer-Aided Civil and Infrastructure Engineering. (2022) ; 37: (15): 2033-2051. |
[5] | Ding C, Dai R, Fan Y, Zhang Z, Wu X. Collaborative control of traffic signal and variable guiding lane for isolated intersection under connected and automated vehicle environment. Computer-Aided Civil and Infrastructure Engineering. (2022) ; 37: (15): 2052-2069. |
[6] | Chen S, Dong J, Ha PYJ, Li Y, Labi S. Graph neural network and reinforcement learning for multi-agent cooperative control of connected autonomous vehicles. Computer-Aided Civil and Infrastructure Engineering. (2021) ; 36: (7): 838-857. |
[7] | Sovetkin E, Steland A. Automatic processing and solar cell detection in photovoltaic electroluminescence images. Integrated Computer-Aided Engineering. (2019) ; 26: (2): 123-137. |
[8] | Foros J, Istad M. Health index, risk and remaining lifetime estimation of power transformers. IEEE Transactions on Power Delivery. (2020) ; 35: (6): 2612-2620. |
[9] | Martinez-Monseco FJ. An Approach to a Practical Optimization of Reliability Centered Maintenance. Case Study: Power Transformer in Hydro Power Plant. Journal of Applied Research in Technology & Engineering. (2020) ; 1: (1): 37-47. |
[10] | Li J, Jiao J, Tang Y. Analysis of the impact of policies intervention on electric vehicles adoption considering information transmission – based on consumer network model. Energy Policy. (2020) ; 144: : 111560. |
[11] | Crozier C, Morstyn T, McCulloch M. The opportunity for smart charging to mitigate the impact of electric vehicles on transmission and distribution systems. Applied Energy. (2020) ; 268: : 114973. |
[12] | Elsisi M, Tran MQ, Mahmoud K, Mansour DEA, Lehtonen M, Darwish MMF. Effective IoT-based deep learning platform for online fault diagnosis of power transformers against cyberattacks and data uncertainties. Measurement. (2022) ; 190: : 110686. |
[13] | Müllerová E, Hrůza J, Velek J, Ullman I, St\̌refauthor{missing}íska . Life cycle management of power transformers: results and discussion of case studies. IEEE Transactions on Dielectrics and Electrical Insulation. (2015) ; 22: (4): 2379-2389. |
[14] | Vītoliņa S. Development of lifetime data management algorithm for power transformers. 2014 5th International Conference on Intelligent Systems, Modelling and Simulation. (2014) . |
[15] | Yazdani-Asrami M, Taghipour-Gorjikolaie M, Mohammad Razavi S, Asghar Gholamian S. A novel intelligent protection system for power transformers considering possible electrical faults, inrush current, CT saturation and over-excitation. International Journal of Electrical Power & Energy Systems. (2015) ; 64: : 1129-1140. |
[16] | Dolata B, Coenen S. Online condition monitoring becomes standard configuration of transformers – practical application for optimized operation, maintenance and to avoid failures. In: E-ARWtr2016 Transformers, Advanced Research Workshop on Transformers. vol. 2. La Toja Island, Spain; (2016) . |
[17] | Barkas DA, Chronis I, Psomopoulos C. Failure mapping and critical measurements for the operating condition assessment of power transformers. Energy Reports. (2022) ; 8: : 527-547. |
[18] | Setayeshmehr A, Akbari A, Borsi H, Gockenbach E. A procedure for diagnosis and condition based maintenance for power transformers. In: Conference Record of the 2004 IEEE International Symposium on Electrical Insulation; (2004) . p. 504-507. |
[19] | AJ C, Salam MA, Rahman QM, Wen F, Ang SP, Voon W. Causes of transformer failures and diagnostic methods – a review. Renewable and Sustainable Energy Reviews. (2018) ; 82: : 1442-1456. |
[20] | Moravej Z, Abdoos AA. An improved fault detection scheme for power transformer protection. Electric Power Components and Systems. (2012) ; 40: (10): 1183-1207. |
[21] | Haghjoo F, Mostafaei M. Flux-based method to diagnose and identify the location of turn-to-turn faults in transformers. IET Generation, Transmission and Distribution. (2016) ; 10: (4): 1083-1091. |
[22] | Abbasi AR. Fault detection and diagnosis in power transformers: A comprehensive review and classification of publications and methods. Electric Power Systems Research. (2022) ; 209: : 107990. |
[23] | Bakar NA, Abu-Siada A, Islam S. A review of dissolved gas analysis measurement and interpretation techniques. IEEE Electrical Insulation Magazine. (2014) ; 30: (3): 39-49. |
[24] | Kunicki M, Borucki S, Zmarzły D, Frymus J. Data acquisition system for on-line temperature monitoring in power transformers. Measurement. (2020) ; 161: : 107909. |
[25] | Peimankar A, Weddell SJ, Jalal T, Lapthorn AC. Evolutionary multi-objective fault diagnosis of power transformers. Swarm and Evolutionary Computation. (2017) ; 36: : 62-75. |
[26] | Velasquez-Contreras JL, Sanz-Bobi MA, Galceran Arellano S. General asset management model in the context of an electric utility: Application to power transformers. Electric Power Systems Research. (2011) ; 81: (11): 2015-2037. |
[27] | Górriz JM, Ramírez J, Ortíz A, Martínez-Murcia FJ, Segovia F, Suckling J, et al. Artificial intelligence within the interplay between natural and artificial computation: Advances in data science, trends and applications. Neurocomputing. (2020) ; 410: : 237-270. |
[28] | Ramírez J, Martínez-Murcia FJ, Segovia F, Ortiz A, Salas-González D, Carrillo S, et al. Power transformer forecasting in smart grids using NARX neural networks. In: Valenzuela O, Rojas F, Herrera LJ, Pomares H, Rojas I, editors. Theory and Applications of Time Series Analysis. Contributions to Statistics. Granada, Spain: Springer International Publishing; (2020) . p. 401-414. |
[29] | de Melo AS, Calil WV, Paz Salazar PD, Liboni LHB, Costa ECM, Flauzino RA. Applied methodology for temperature numerical evaluation on high current leads in power transformers. International Journal of Electrical Power & Energy Systems. (2021) ; 131: : 107014. |
[30] | Mariprasath T, Kirubakaran V. A real time study on condition monitoring of distribution transformer using thermal imager. Infrared Physics & Technology. (2018) ; 90: : 78-86. |
[31] | Sirca GF, Adeli H. Infrared thermography for detecting defects in concrete structures. Journal of Civil Engineering and Management. (2018) ; 24: (7): 508-515. |
[32] | Lu L, Dai F, Zaniewski JP. Automatic roller path tracking and mapping for pavement compaction using infrared thermography. Computer-Aided Civil and Infrastructure Engineering. (2021) ; 36: (11): 1416-1434. |
[33] | Bagavathiappan S, Saravanan T, George NP, Philip J, Jayakumar T, Raj B. Condition monitoring of exhaust system blowers using infrared thermography. Insight: Non-Destructive Testing and Condition Monitoring. (2008) ; 50: (9): 512-515. |
[34] | Itami K, Sugie T, Vayakis G, Walker C. Multiplexing thermography for international thermonuclear experimental reactor divertor targets. Review of Scientific Instruments. (2004) ; 75: (10 II): 4124-4128. |
[35] | Zarco-Periñán PJ, Martínez-Ramos JL, Zarco-Soto FJ. A novel method to correct temperature problems revealed by infrared thermography in electrical substations. Infrared Physics & Technology. (2021) ; 113: : 103623. |
[36] | Segovia F, Ramírez J, Salas-Gonzalez D, Illán IA, Martinez-Murcia FJ, Rodriguez-Rivero J, et al. Temperature control and monitoring system for electrical power transformers using thermal imaging. In: Ferrández Vicente JM, Álvarez-Sánchez JR, de la Paz López F, Adeli H, editors. Bio-Inspired Systems and Applications: From Robotics to Ambient Intelligence. Lecture Notes in Computer Science. Cham: Springer International Publishing; (2022) . p. 573-582. |
[37] | Rodriguez-Rivero J, Ramirez J, Martínez-Murcia FJ, Segovia F, Ortiz A, Salas D, et al. Granger causality-based information fusion applied to electrical measurements from power transformers. Information Fusion. (2020) ; 57: : 59-70. |
[38] | Achanta R, Shaji A, Smith K, Lucchi A, Fua P, Süsstrunk S. SLIC superpixels compared to state-of-the-art superpixel methods. IEEE Transactions on Pattern Analysis and Machine Intelligence. (2012) ; 34: (11): 2274-2282. |
[39] | Otsu N. A threshold selection method from gray-level histograms. IEEE Transactions on Systems, Man, and Cybernetics. (1979) ; 9: (1): 62-66. |
[40] | Matas J, Chum O, Urban M, Pajdla T. Robust wide-baseline stereo from maximally stable extremal regions. Image and Vision Computing. (2004) ; 22: (10): 761-767. |
[41] | Hartigan JA, Wong MA. A K-means clustering algorithm. Journal of the Royal Statistical Society Series C (Applied Statistics). (1979) ; 28: (1): 100-108. |
[42] | Ćurković M, Ćurković A, Vučina D. Image binarization method for markers tracking in extreme light conditions. Integrated Computer-Aided Engineering. (2022) ; 29: (2): 175-188. |
[43] | Donoser M, Bischof H. Efficient maximally stable extremal region (MSER) tracking. In: 2006 IEEE Computer Society Conference on Computer Vision and Pattern Recognition (CVPR’06). vol. 1; (2006) . p. 553-560. |
[44] | Chavez A, Gustafson D. Color-based extensions to MSERs. In: Bebis G, Boyle R, Parvin B, Koracin D, Wang S, Kyungnam K, et al., editors. Advances in Visual Computing. Lecture Notes in Computer Science. Berlin, Heidelberg: Springer; (2011) . p. 358-366. |
[45] | McLachlan GJ, Peel D. Finite mixture models. New York; (2000) . |
[46] | Wiener N. The theory of prediction. In: Modern Mathematics for Engineers. New York: McGraw-Hill; (1956) . p. 165-190. |
[47] | Granger CWJ. Investigating causal relations by econometric models and cross-spectral methods. Econometrica. (1969) ; 37: (3): 424-438. |
[48] | Seth AK. A MATLAB Toolbox for granger causal connectivity analysis. Journal of Neuroscience Methods. (2010) ; 186: (2): 262-273. |
[49] | Karakoulidis K, Fantidis J, Kontakos V. The temperature measurement in a three-phase power transformer under different conditions. Journal of Engineering Science and Technology Review. (2015) ; 8: : 19-23. |
[50] | Martinez-Murcia FJ, Ramirez J, Segovia Román F, Ortiz A, Carrillo S, Leiva FJ, et al. Prediction of transformer temperature for energy distribution smart grids using recursive neural networks. In: International Conference on Time Series and Forecasting. Granada, Spain; (2019) . |
[51] | Lin J, Ma L, Yao Y. A spectrum-domain instance segmentation model for casting defects. Integrated Computer-Aided Engineering. (2022) ; 29: (1): 63-82. |
[52] | García-Aguilar I, García-González J, Luque-Baena RM, López-Rubio E, Domínguez E. Optimized instance segmentation by super-resolution and maximal clique generation. Integrated Computer-Aided Engineering. (2023) ; Preprint(Preprint): 1-14. |
[53] | Jalilian M, Sariri H, Parandin F, Karkhanehchi MM, Hookari M, Jirdehi MA, et al. Design and implementation of the monitoring and control systems for distribution transformer by using GSM network. International Journal of Electrical Power & Energy Systems. (2016) ; 74: : 36-41. |


