
A fitting algorithm based on multi-touch gesture for rapid generation of railway line
Abstract
Human-computer interaction (HCI) technology plays a critically essential role in the computer-aided design of railway line locations. However, the traditional interactive design with a mouse+keyboard cannot well meet the rapid generation requirements of the railway line during scheme discussion. This research presents a fitting algorithm for the rapid generation of railway lines by using a multi-touch gesture algorithm. The fitting method from free hand-drawing lines to satisfied railway lines is proposed. Then the interactive operation hand gestures are defined and implemented into the railway line location design. The hand-drawing lines generated by defined gestures are automatically fitted with the target horizontal line by using the inflection detection algorithm based on Euclidean Distance (ED). Meanwhile, the vertical line can be fitted by a similar algorithm with an extreme point-to-point (EPP) and chord-to-point distance accumulation (CPDA). Moreover, a real-world example verification is carried out. The multi-touch gesture algorithm is applied for the automatic fitting of the railway line. Compared with the traditional interactive methods, the consumption time of railway line generation by using the multi-touch interactive mode is decreased by about 15%. This research provides fundamental support for rapid scheme discussion of railway line generation based on natural HCI, which is well-matched with modern handheld devices, and the requirements of rapid selection as well as the quick comparison of railway line schemes in the early stage of design.
1.Introduction
Line location as an overall work plays a decisive role in the safety, economy, comfort, and environmental protection of railway construction and operation, and even impacts all aspects of the railway [1]. To determine a satisfactory location scheme, professional engineers need to comprehensively analyze the specific conditions in detail and optimize iteratively [2, 3, 4]. More importantly, a large number of scheme discussions are required with repeated human-computer interaction (HCI) from an initial line to the final determination. For instance, designers need to conveniently generate a quick line scheme at the field site or meeting room according to experts’ suggestions or comments for further discussion [5]. However, the traditional HCI with mouse+keyboard cannot well meet the increasing requirements of rapid generation of the railway line location during scheme discussion. Therefore, more efficient HCI technologies, especially natural and intuitive HCI, were quite necessary. Historically, the HCI technology gradually transforms from the traditional computer-centered interaction mode with the mouse+keyboard to a new human-centered interaction mode – the natural HCI mode [6].
For nearly half a century, HCI technology has undergone tremendous changes. Since the 1950s, Command-Line Interface (CLI) has begun to appear [7]. The computer completed the interaction process by feeding the results received from the command line back to the monitor [8]. Massachusetts Institute of Technology (MIT) first made significant contributions to computer-aided alignment design [9]. The Xerox Palo research center developed a graphical user interface (GUI) based on Windows, Icons, Menu, and Pointing (WIMP) Devices in the late 1970s. GUI is an interface display format for communication between humans and computers. GUI allows users to manipulate icons or menu options on the screen with input devices such as a mouse+keyboard to select commands, invoke files, start programs or perform other daily tasks [10, 11]. Currently, the third generation of natural user interaction (NUI) interface only needs users to communicate with the computer in the most natural ways, such as by voice, facial expression, hand gestures, moving body, and a rotating head, to get rid of the mouse+keyboard [12]. Several developed countries, such as the United States, United Kingdom, Germany, and Canada, early conducted intensive research on the design of computer-aided alignment systems. The functions of horizontal and vertical alignment design, earthwork calculation, numerical simulation system, and 3D alignment visualization were integrated and developed collaboratively. This set of sophisticated alignment design systems has fundamentally changed the interaction mode [13], making methods of computer-aided design (CAD) alignment evolve ultimately. The CAD alignment technology started late in China. However, the current independent CAD alignment system developed rapidly, which integrates functions such as horizontal and vertical alignment control, engineering cost calculation, 3D visualization, and even intelligent optimization [14, 15, 16, 17]. With the development of computer science, various new interactive technologies, such as multi-touch, voice input, and retina formation, appeared successively. For example, a novel computer system integrated vision with haptics (touch) and sound as Multi-Sensory Information System (MSIS) has been developed and efficiently applied for planning the location (the alignment) of a new road [18, 19]. In addition, Kinect, the interactive control device of the Xbox 360 game host released by Microsoft in November 2010, realized dynamic HCI by capturing the action of the human body and transforming it into the operation signal of the machine [20, 21]. Meanwhile, research on hand gesture definition and algorithm of multi-touch and pen-touch interaction in human-computer interaction expands the thinking for developers and users by using the pen-touch interface [22, 23]. Jan Derboven discussed the universal hand gesture of multi-touch, some simple gestures are proved by experimental comparison, but it is pretty challenging to deal with some complex gestures [24]. Hand gestures are divided into contact, natural, and pointing gestures, according to the differences in finger movement modes, the number of contacts, arrangement order, and other factors. Contact and natural gestures can be divided into static and dynamic gestures in terms of the specific movement of fingers [25]. The subject is the fingers, and the connection form of the primary receptor is gesture recognition. The interaction is carried out in a natural, intuitive, convenient, and fast manner [26, 27]. Multi-touch interaction technology is often used in the tactile analysis [28]. Uthpala Samarakoon analyzed gesture performance and requirements in early childhood education’s multi-touch applications, providing theoretical support for multi-touch hand gesture design principles [29]. Therefore, how to improve the work efficiency of HCI is still a focus of conducting railway alignment design. Currently, multi-touch technology has been widely applied in various fields, such as the military, classroom teaching, and business meetings. However, the application in alignment exploration and design is still in the primary stage. The high efficiency of railway alignment design and the modernization of interaction mode urgently need development. This paper proposes an approach to the rapid generation of railway lines by using a multi-touch gesture algorithm. An example verification is conducted for the location design of the Sichuan-Tibet railway. Expressly, three aspects are contained, (1) The natural interaction method of multi-touch hand gesture for railway alignment is proposed; (2) The rapid fitting method of alignment design based on hand gesture (or hand-drawing) recognition is given; (3) An example study for the realization and verification of the railway alignment design based on multi-touch interaction is conducted. Accordingly, this paper is organized into five parts. Following Section 1 as this Introduction, Section 2 presents the multi-touch gesture definition. Section 3 describes the fitting algorithm of alignment design based on hand gesture recognition. Section 4 presents an example verification of the approach to rapid generation of railway line location by employing a multi-touch gesture algorithm before the conclusions in Section 5.
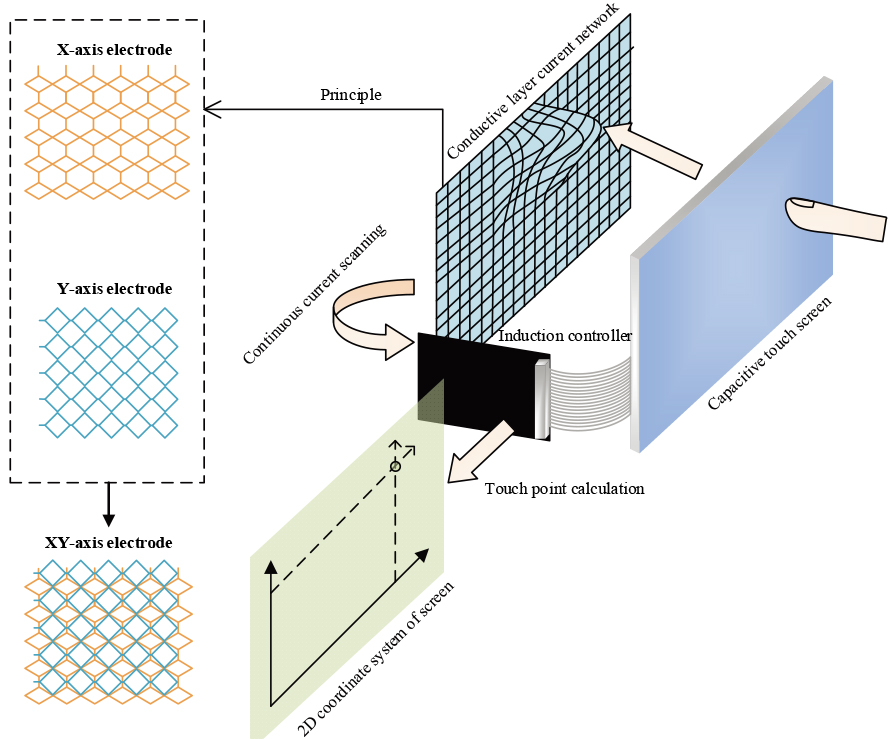
Figure 1.
The principle of capacitive touch screen.
2.Multi-touch interactive hand gesture definition
Multi-touch technology refers to how users interact with the computer system through multiple fingers moving and controlling the dynamic change of the graphical interface with different hand gestures. Users use multiple fingers for human-computer interaction to control the dynamic change of the graphical interface to achieve natural operation and flexible cooperation. The receptor of multi-touch gesture interaction is the multi-touch screen. According to the previous study [30, 31], touch screens can be divided into resistance, capacitance, infrared, and surface acoustic type. The principle of the capacitive touch screen applied in this research is shown in Fig. 1.
The hand gesture semantic diversity classification effect is achieved by setting the horizontal, and vertical two-way expansion, and accumulation. Interactive gestures are defined as listed in Table 1, covering the following three operation modes. (i) Geographical environment browsing manipulation gestures. Long strips usually characterize the terrain of the alignment system. It is necessary to overview the overall trend of the terrain belt, browse the geographical environment characteristics of each part according to the block, and accurately view the geographical environment details of the block position. Browse operations are divided into terrain translation, scaling, rotation, initialization viewpoint, line roaming, and perspective and orthographic switching to the overall scene. (ii) Alignment design operating gestures. To meet the alignment entity operating tasks and detail information inspection, the gestures include line drawing, erasing, marking the control point, and highlighting displays. Users can operate control points (intersection or gradient change point) to complete the relative position change and deletion to realize the curve section angle, direction, or vertical section gradient value change. Users also can query geographic information, and line entity interactive editing to change the curve element information. (iii) Mode switching gestures. To avoid the action conflict between two patterns of geographical environment and interactive alignment design, different types of gestures are placed in different modules, serially connecting model switch gestures to realize rapid and straightforward switching between the two modes.
Table 1
Interactive hand gesture definition
| Model type | Hand gesture | Action | Action description | Semantic connotation |
|---|---|---|---|---|
| The operation mode of geographical environment browsing | Slip |

| Holding a single finger drag along any direction | Model movement |
| Amplification |
| Drag two fingers on opposite sides | Model amplification | |
| Reduction |

| Hold double fingers and merge to the middle | Model reduction | |
| The operation mode of alignment design | Rotation |

| One finger hold and the other move | Rotation around y-axis |

| Double fingers hold rotating | Rotation around z-axis | ||
| Double click |

| Quickly double-click the same position at the blank | Back to the initial view | |
| Move |

| Single finger stroke on terrain | Generate hand-drawing line | |
| Remove |

| Single finger stroke on a hand-drawing line | Delete hand-drawing line | |
| Press |

| Press the mark to drag | Control point operation | |
| Long press |

| Single finger press | Sensitive point labeling | |
| Mode switching | Long press |

| Three fingers press | Mode switching |
3.Fitting algorithm for railway alignment
Research on the fitting method focuses on inflection point detection of hand-drawing line points. Many valuable studies have been on image inflection point detection algorithms, including Moravec inflection point detection technology, Harris inflection point detection technology, SUSAN inflection point detection technology [32], and FAST inflection point detection technology in the gray value detection method [33]. Moreover, the image edge contour curve detection algorithm is based on methods of Freeman chain code (FCC), Euclidean distance (ED) [34], curvature scale space (CSS), and chord-to-point distance accumulation and inflection point detection method based on contour curve [35]. The above inflection detection algorithms have specific graphic geometry characteristics. Inflection detection algorithms can be divided into two categories. One is to detect the inflection by changing the multi-direction grey value of image elements. The other is to judge the inflection by changing the curvature, position, and geometric shape of image edge contour points [36]. According to the distribution law and elements of hand-drawing and the requirements of railway alignment design, this section adopts the Euclidean distance and chord-to-point distance accumulation for the inflection point detection algorithm on a plane and vertical sections, which improves the algorithm kernel to make it better in fitting the railway central line.
3.1Fitting algorithm for a horizontal design
3.1.1Inflection detection algorithm based on Euclidean distance
The fitting method focuses on the inflection detection of hand-drawing points on hand-drawing lines. After hand-drawing, data points intersecting with the terrain in the plane will be generated. Trend distribution is along the terrain belt with the inevitable trend and geometric law, which provides the initial data basis for line fitting of subsequent alignment design. The ultimate goal of graphic alignment fitting is to extract data points at critical positions of planar hand-drawing and convert them into control points of the designed lines, composed of straight lines – curves – straight lines after algorithmic processing and calculation. Based on the Euclidean distance for the inflection detection algorithm of planar hand-drawing lines, the curvature element
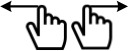
Figure 2.
Euclidean distance and straight line distance.
Curvature element calculation is shown as Eq. (1),
(1)
where
Since the density of discrete points on the curve is not fixed, it is necessary to normalize the curvature element of each point when calculating it. The curve normalization is seen as Eq. (2),
(2)
where,
The curvature element is used to determine the trend of curvature at any inflection point on the curve, which ranges from 0 to 1. According to the definition of curvature element, when the discrete point is close to the curve inflection point, the curvature element of the point will begin to decrease. When the discrete point is far away from the curve inflection point, the curvature element of the point will begin to increase; the curvature element of a straight line is maximum and close to 1.
A parameter threshold
The curvature meta-container data are calculated by the data of each point in the hand-drawing point container. The pseudo-code of the program is written below,
Begin For
3.1.2Horizontal curve fitting based on the inflection detection algorithm
In the design and construction of railway lines, the circular curve needs to be measured in detail. When the curve is set in detail, the middle pile spacing on the curve should be 20 m to meet the accuracy requirements of the fitting. If the terrain is flat and the curve radius is greater than 800 m, the middle pile spacing in the circular curve can be 40 m [37]. Therefore, when selecting the points of the curve, the minimum distance between the two points is less than 20 m to meet the accuracy requirements.
When designed by regulation, it is necessary to add a transition curve to the steering section of the circular curve. The elements of the curve section of the transition curve include angle
The normalized value of the curvature element of each point is calculated, and a fixed constraint threshold t less than one is set to identify the inflection position. Meanwhile, for eliminating noise points in the straight line segment, the constraint is realized by the double-loop and judgment method. The algorithm process is that when
Begin For
First, determine the length of the transition curve
Based on the calculation results of RMS speed, superelevation, and under elevation, the minimum transition curve
(3)
where
Finally, the transition curve corresponding to the typical radius is calculated. If the radius is the intermediate value, the interpolation method is used to calculate the radius of the curve segment after setting the corresponding transition curve. The program pseudo-code is written as below,
Begin For
The radius
The curve element information of the transition curve can be obtained. It is necessary to calculate the world coordinates of points on the transition curve to fit the horizontal curve. The inner shift distance is generated by adding the internal shift of the transition curve segment. Intersection point (JD) position coordinates are related to the approximate alignment position coordinates. The coordinates of point TS and ST can be calculated by JD coordinate, and tangent length
The radius
The curve element information of the transition curve can be obtained. It is necessary to calculate the world coordinates of points on the transition curve to fit the horizontal curve. The inner shift distance is generated by adding the internal shift of the transition curve segment. JD position coordinates are related to the approximate alignment position coordinates. The coordinates of point TS and ST can be calculated by JD coordinate and tangent length
(4)
(5)
(6)
where
The distance of points SC and CS is calculated by points TS, ST, and the length of transition curve
(7)
(8)
where
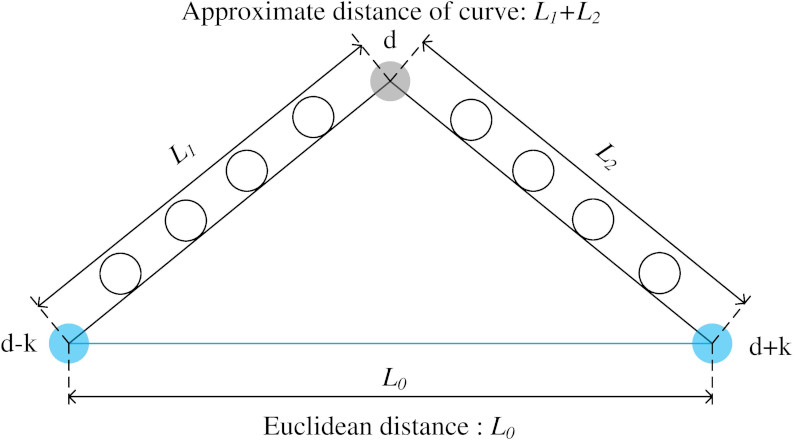
Figure 3.
Calculation chart of each point of the transition curve.
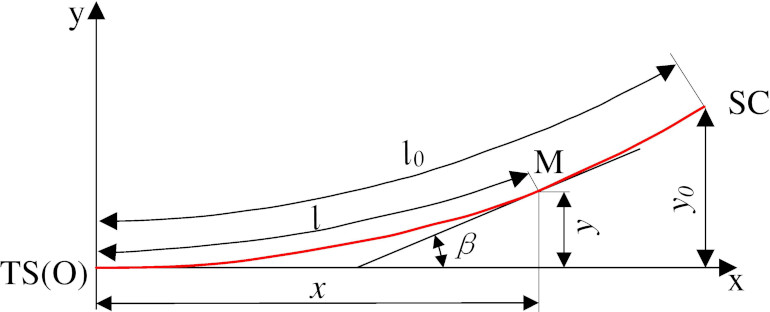
Figure 4.
Transformation diagram from local coordinate to the world coordinate.
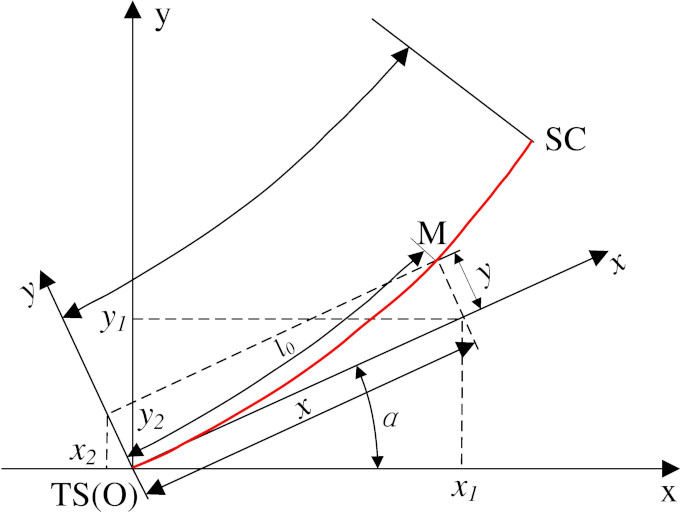
Bringing the length of transition curve
The triangular transformation transforms the relative coordinates of each point [38]. Then, the X and Y directions components are added respectively to get them
(9)
(10)
where (
The coordinate of any point on the transition curve is calculated below,
(11)
where (
The point between SC and CS is on a circular curve. Given the center coordinates of point O, the line
Figure 5.
Coordinate calculation of circular curve.
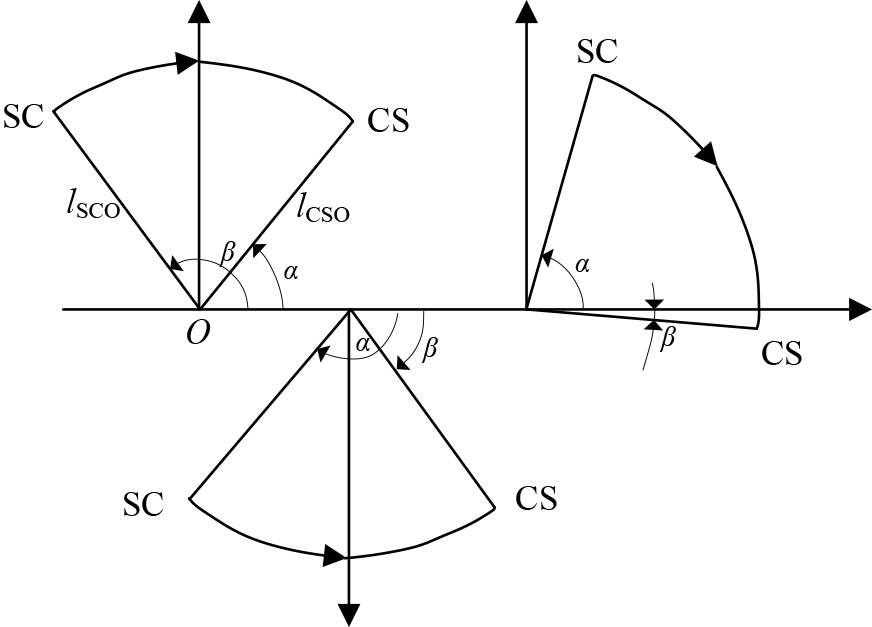
By connecting the points, TS and SC, CS, and ST, smoothly by cubic parabola curve fitting method, as well as connecting points SC and CS by arc corresponding to curve angle, then four relative coordinate systems with TS, ST, SC, and CS as the origin are established, respectively. With an equal step increment in the x-direction, all curve increment points are connected in sequence from the origin. Finally, the fitting curve is drawn by adding the world coordinates of the origin in each coordinate system. The program pseudo-code is as below,
Figure 6.
Fitting point of vertical section.
Begin For
3.2Vertical curve fitting based on extreme point-to-point (EPP) and chord-to-point distance accumulation (CPDA)
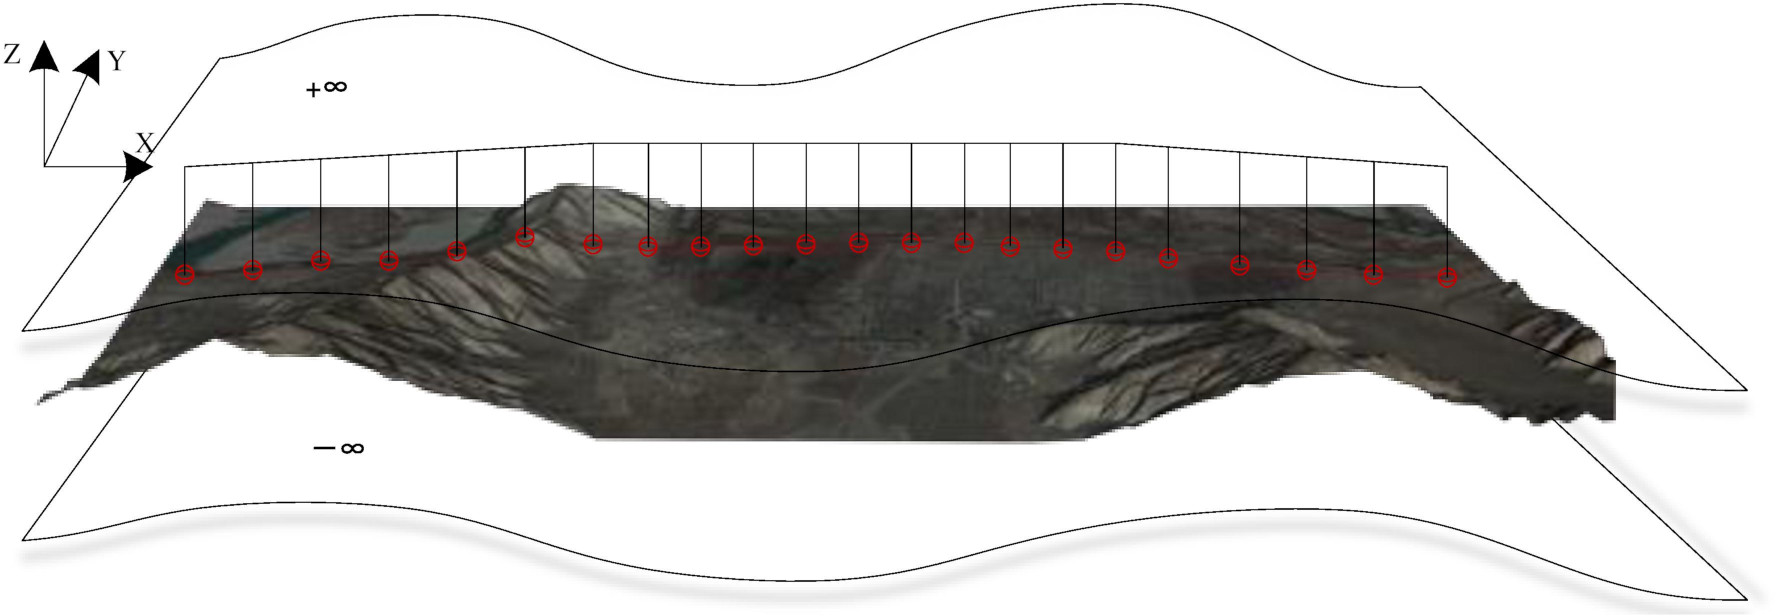
Horizontal design line fitting only aims at the x, and y-direction of the space dimension of the hand-drawing point. Vertical ground line elevation points are generally interpolated from the horizontal line digital terrain model. In the three-dimensional terrain environment, the vertical intersection of space rays with infinite extension. It is obtained that each point on the plane design line corresponds to clear space or a buried depth and actual elevation value projected onto the terrain surface. Take two ends (
Using hand-drawing lines to increase the line mileage, the ground line elevation data of the vertical section can be obtained. Take the points as shown in Fig. 6, where
Vertical alignment design is to find the elevation projection of points on horizontal alignment in 3D terrain. Obtaining elevation data from the ground line in the vertical section provides essential support for the following vertical design and fitting method. The inflection detection algorithm of the hand-drawing line on the vertical section applies the chord-to-point distance accumulation method. The inflection point position is determined by accumulating the distance between the point on the profile curve and the tangent at a fixed position. The inflection detection method based on the relative distance difference between the chord and point has obvious pertinency, which is suitable for the inflection detection set of vertical curve drawings. However, due to the poor inhibition effect on noise points, this method may be affected readily. Therefore, it is necessary to de-duplicate and de-noise hand-drawing data points in advance. Vertical curve radius, slight slope, slope length, and gradient difference between adjacent slopes are considered when the hand-drawing lines of the vertical section are fitted to the designed alignment.
Figure 7.
Initial gradient change point calculation.
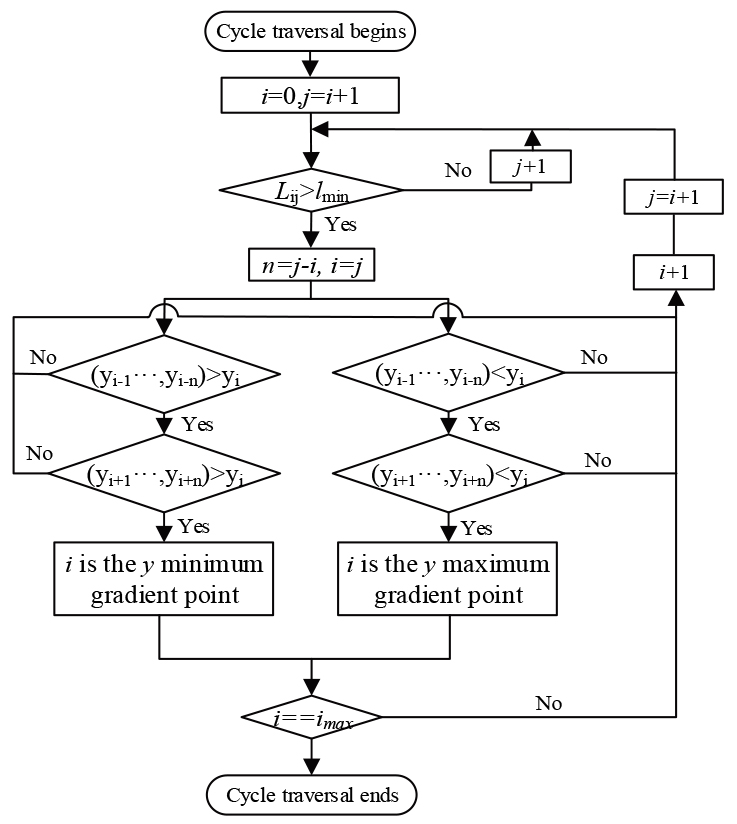
Figure 8.
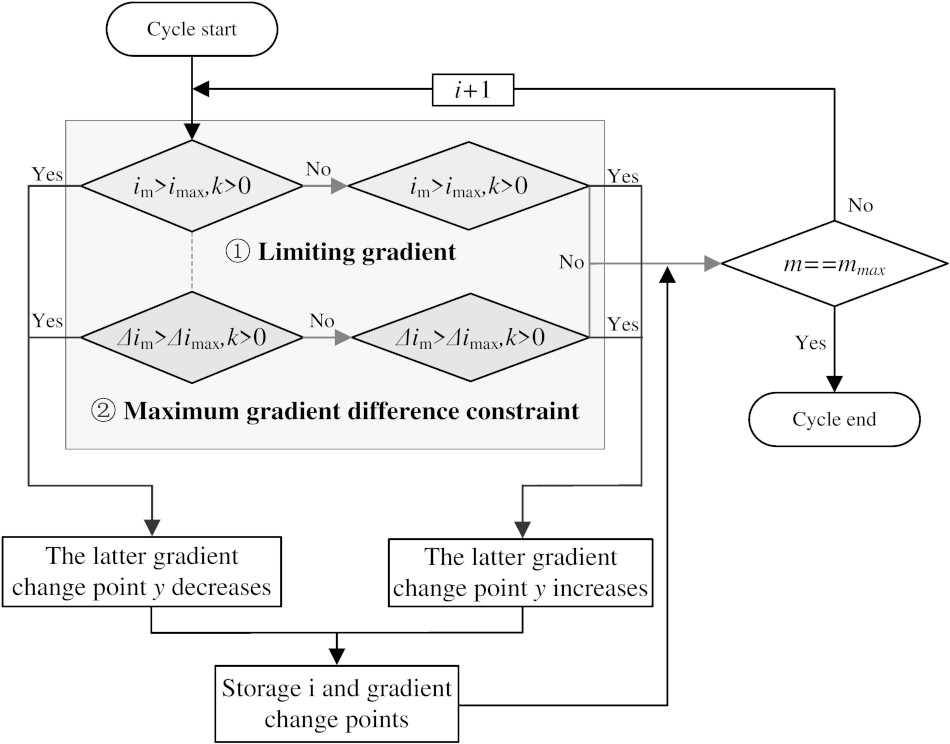
Resetting gradient change points with limiting gradient and maximum gradient difference constraint.
After de-noising and de-duplication, the initial data is input into the fitting program to calculate the positions of the gradient change points. The process is shown in Fig. 7. The calculation process is described in the following steps. (1) Use the starting hand-drawing point
Then, the direction of all hand-drawing points with the current vertical section has been preliminarily found. And the position information of gradient change points satisfies the minimum slope length constraint. It is also necessary to determine whether the restricted gradient (
The former calculation process is described in the following steps: (1) The first gradient change point (the line’s starting point) begins, and the slope sections connecting the two adjacent gradient change points are calculated sequentially. The gradient
The latter calculation process is shown in the following steps (1) Starting from the first slope section, the absolute value
4.Case verification
This paper selects a section of the Sichuan-Tibet Railway from Xierong to Zhaqi (STR-XZ) and verifies the design and implementation of railway alignment based on multi-touch control. The design speed is 160 km/h with a minimum curve radius of 1600 m. The primary design requirements are listed in Table 2.
Table 2
Interactive hand gesture definition
| Technical issues | Requirements |
|---|---|
| Railway classification | I |
| Railway line numbers | Single line |
| Limit gradient | 12‰ |
| Minimum curve radius/m | 1600 |
| Traction type | Electric power |
| The effective length of the arrival-departure track/m | 650 |
| Blocked type | Automatic blocking |
This research selects a projective capacitance induction touch screen (PCITS), which can support multiple points (up to ten points) with user-friendly consideration, and applies the Windows system for multi-touch interactive alignment design and development. As a realization method of terrain entity translation, the corresponding operation is single finger pressing and dragging in geographical environment browsing mode. For single finger operations, the only movement of single contact mode is involved. Through the distance change between two frames, the corresponding matrix (
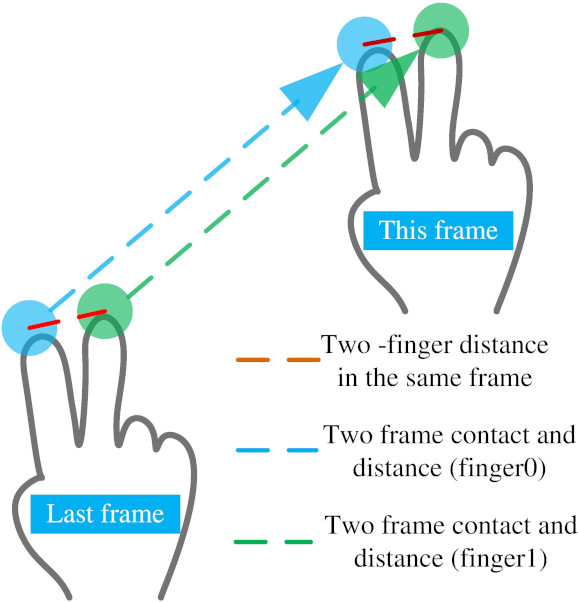
The operations of single fingers and double fingers are taken as examples for calculating essential limiting conditions when touch events occur. The point positions of the double fingers in the previous frame are
Figure 9.
Primary finger distance classification process.
The center point matrix of the camera observation position is (
(12)
where the center is the camera center position matrix, and
Figure 10.
Projection from a plane to a trackball.
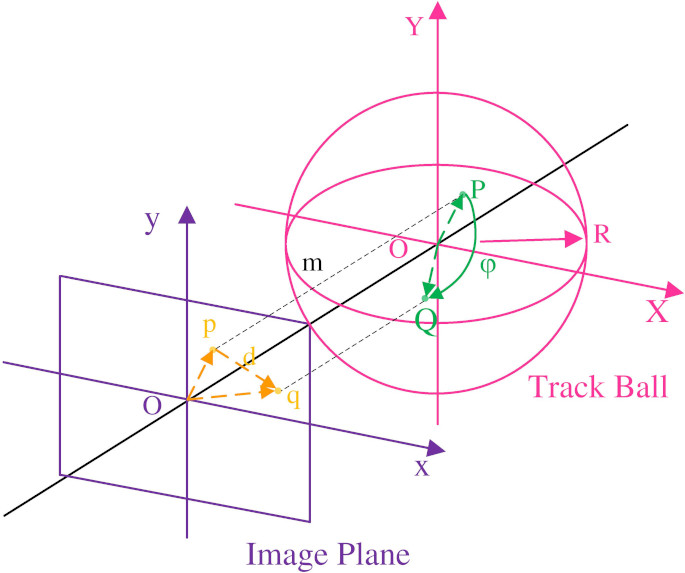
Figure 11.
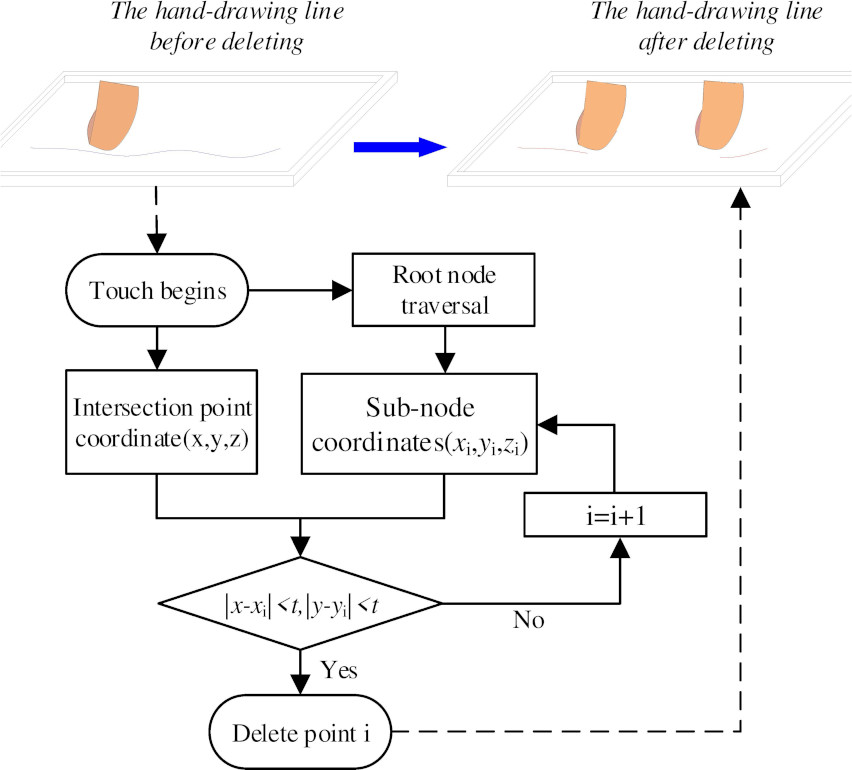
Alignment deletion processing.
The implementation method of terrain entity scaling is as follows: distance change rate
The realization of terrain entity rotation is that entity rotation control is set up according to OpenGL standard trackball principle to ensure a smooth and stable image during finger rotation [39]. The tracking ball is a virtual spherical tool used to simulate and control the rotation of objects in 3D space on a 2D screen. The rotation center is located in the entity’s center on the visual interface, and the radius is adapted to the object’s size, as seen in Fig. 10.
The rotation radian and rotation axis vector in 3D space are calculated when the entity rotates by determining the amount of finger movement. After that, the implementation of terrain browsing state initialization is as follows. The terrain beyond the scope of view cannot be seen caused by the excessive translation. So the single finger fast double-click screen at the same position, the viewpoint, viewport, and sight distance are re-initialized as _homeEye
The finger moves along the hand-drawing line in deletion mode and erases along the hand-drawing line. The deletion algorithm is based on Open Source Graphic (OSG) node traversal and deletion and the computer hand-drawing deletion principle [40]. The single finger is imaged as an eraser with both length and width at a threshold
Figure 12.
Flow chart of mode switching.
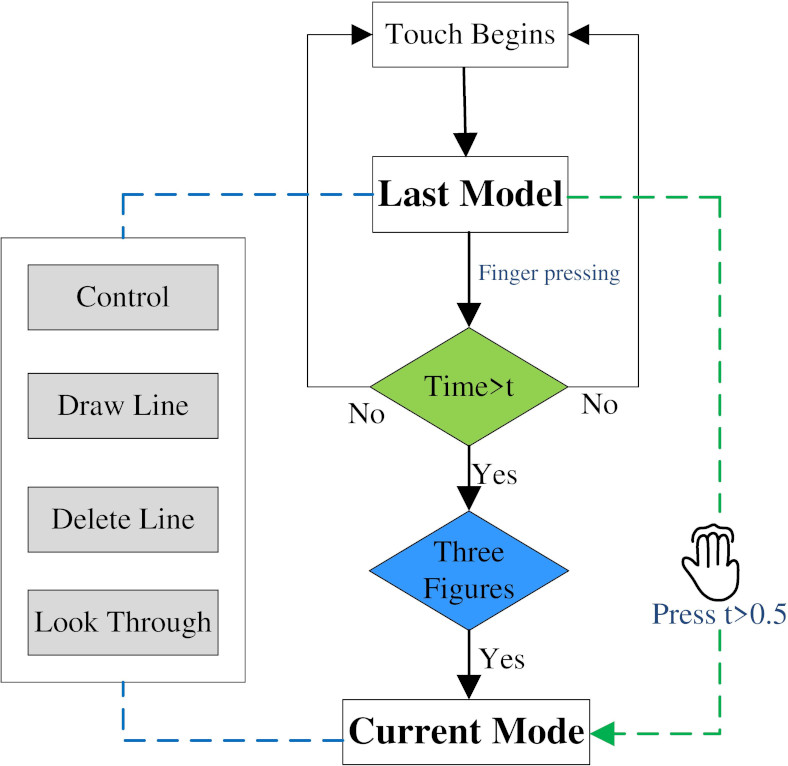
The operation mode switching process is described in Fig. 12. If the three-finger screen time exceeds
Figure 13.
Initial effect diagram of orthographic projection.
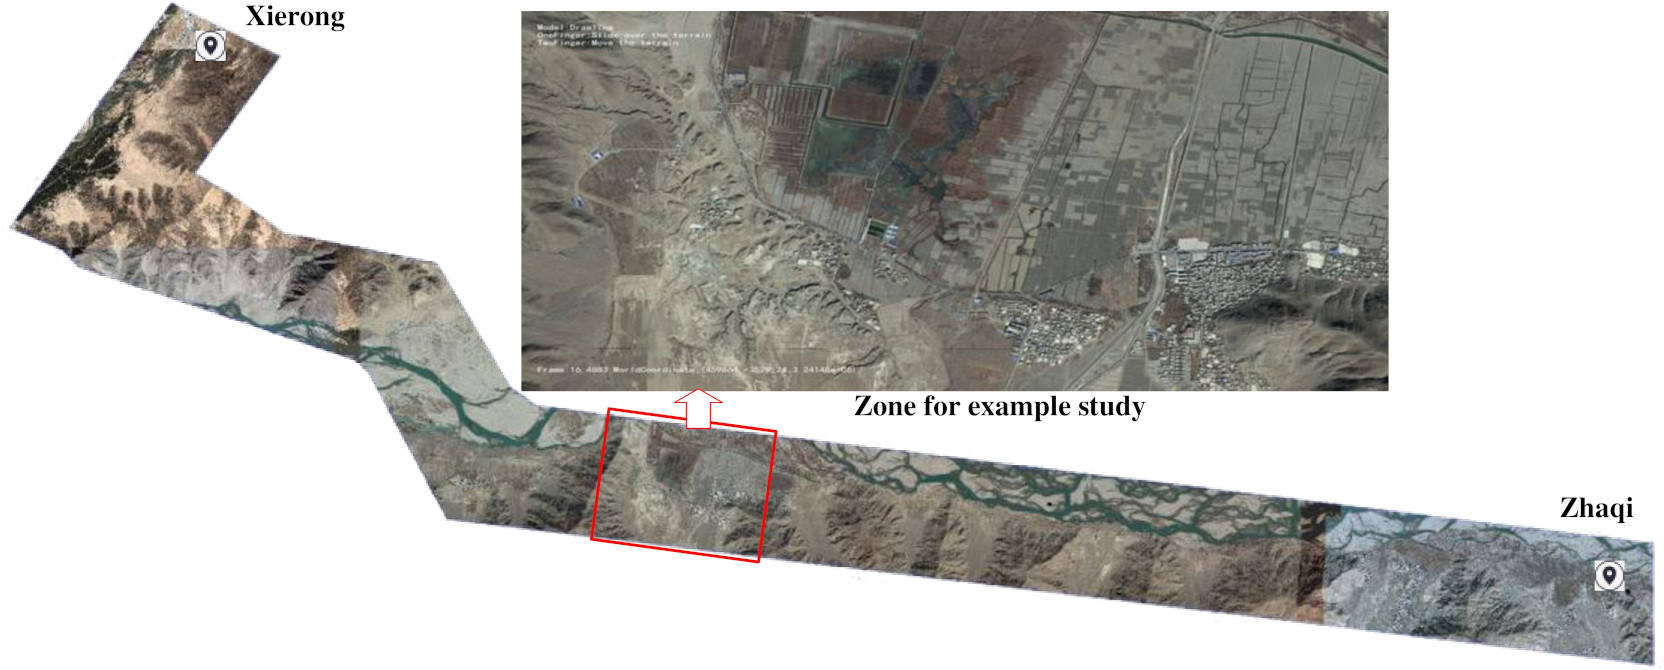
Figure 14.
Horizontal hand-drawing line and the fitted line.
The Virtual Planet Builder (VPB) was loaded into the 3D terrain of OSG. VPB
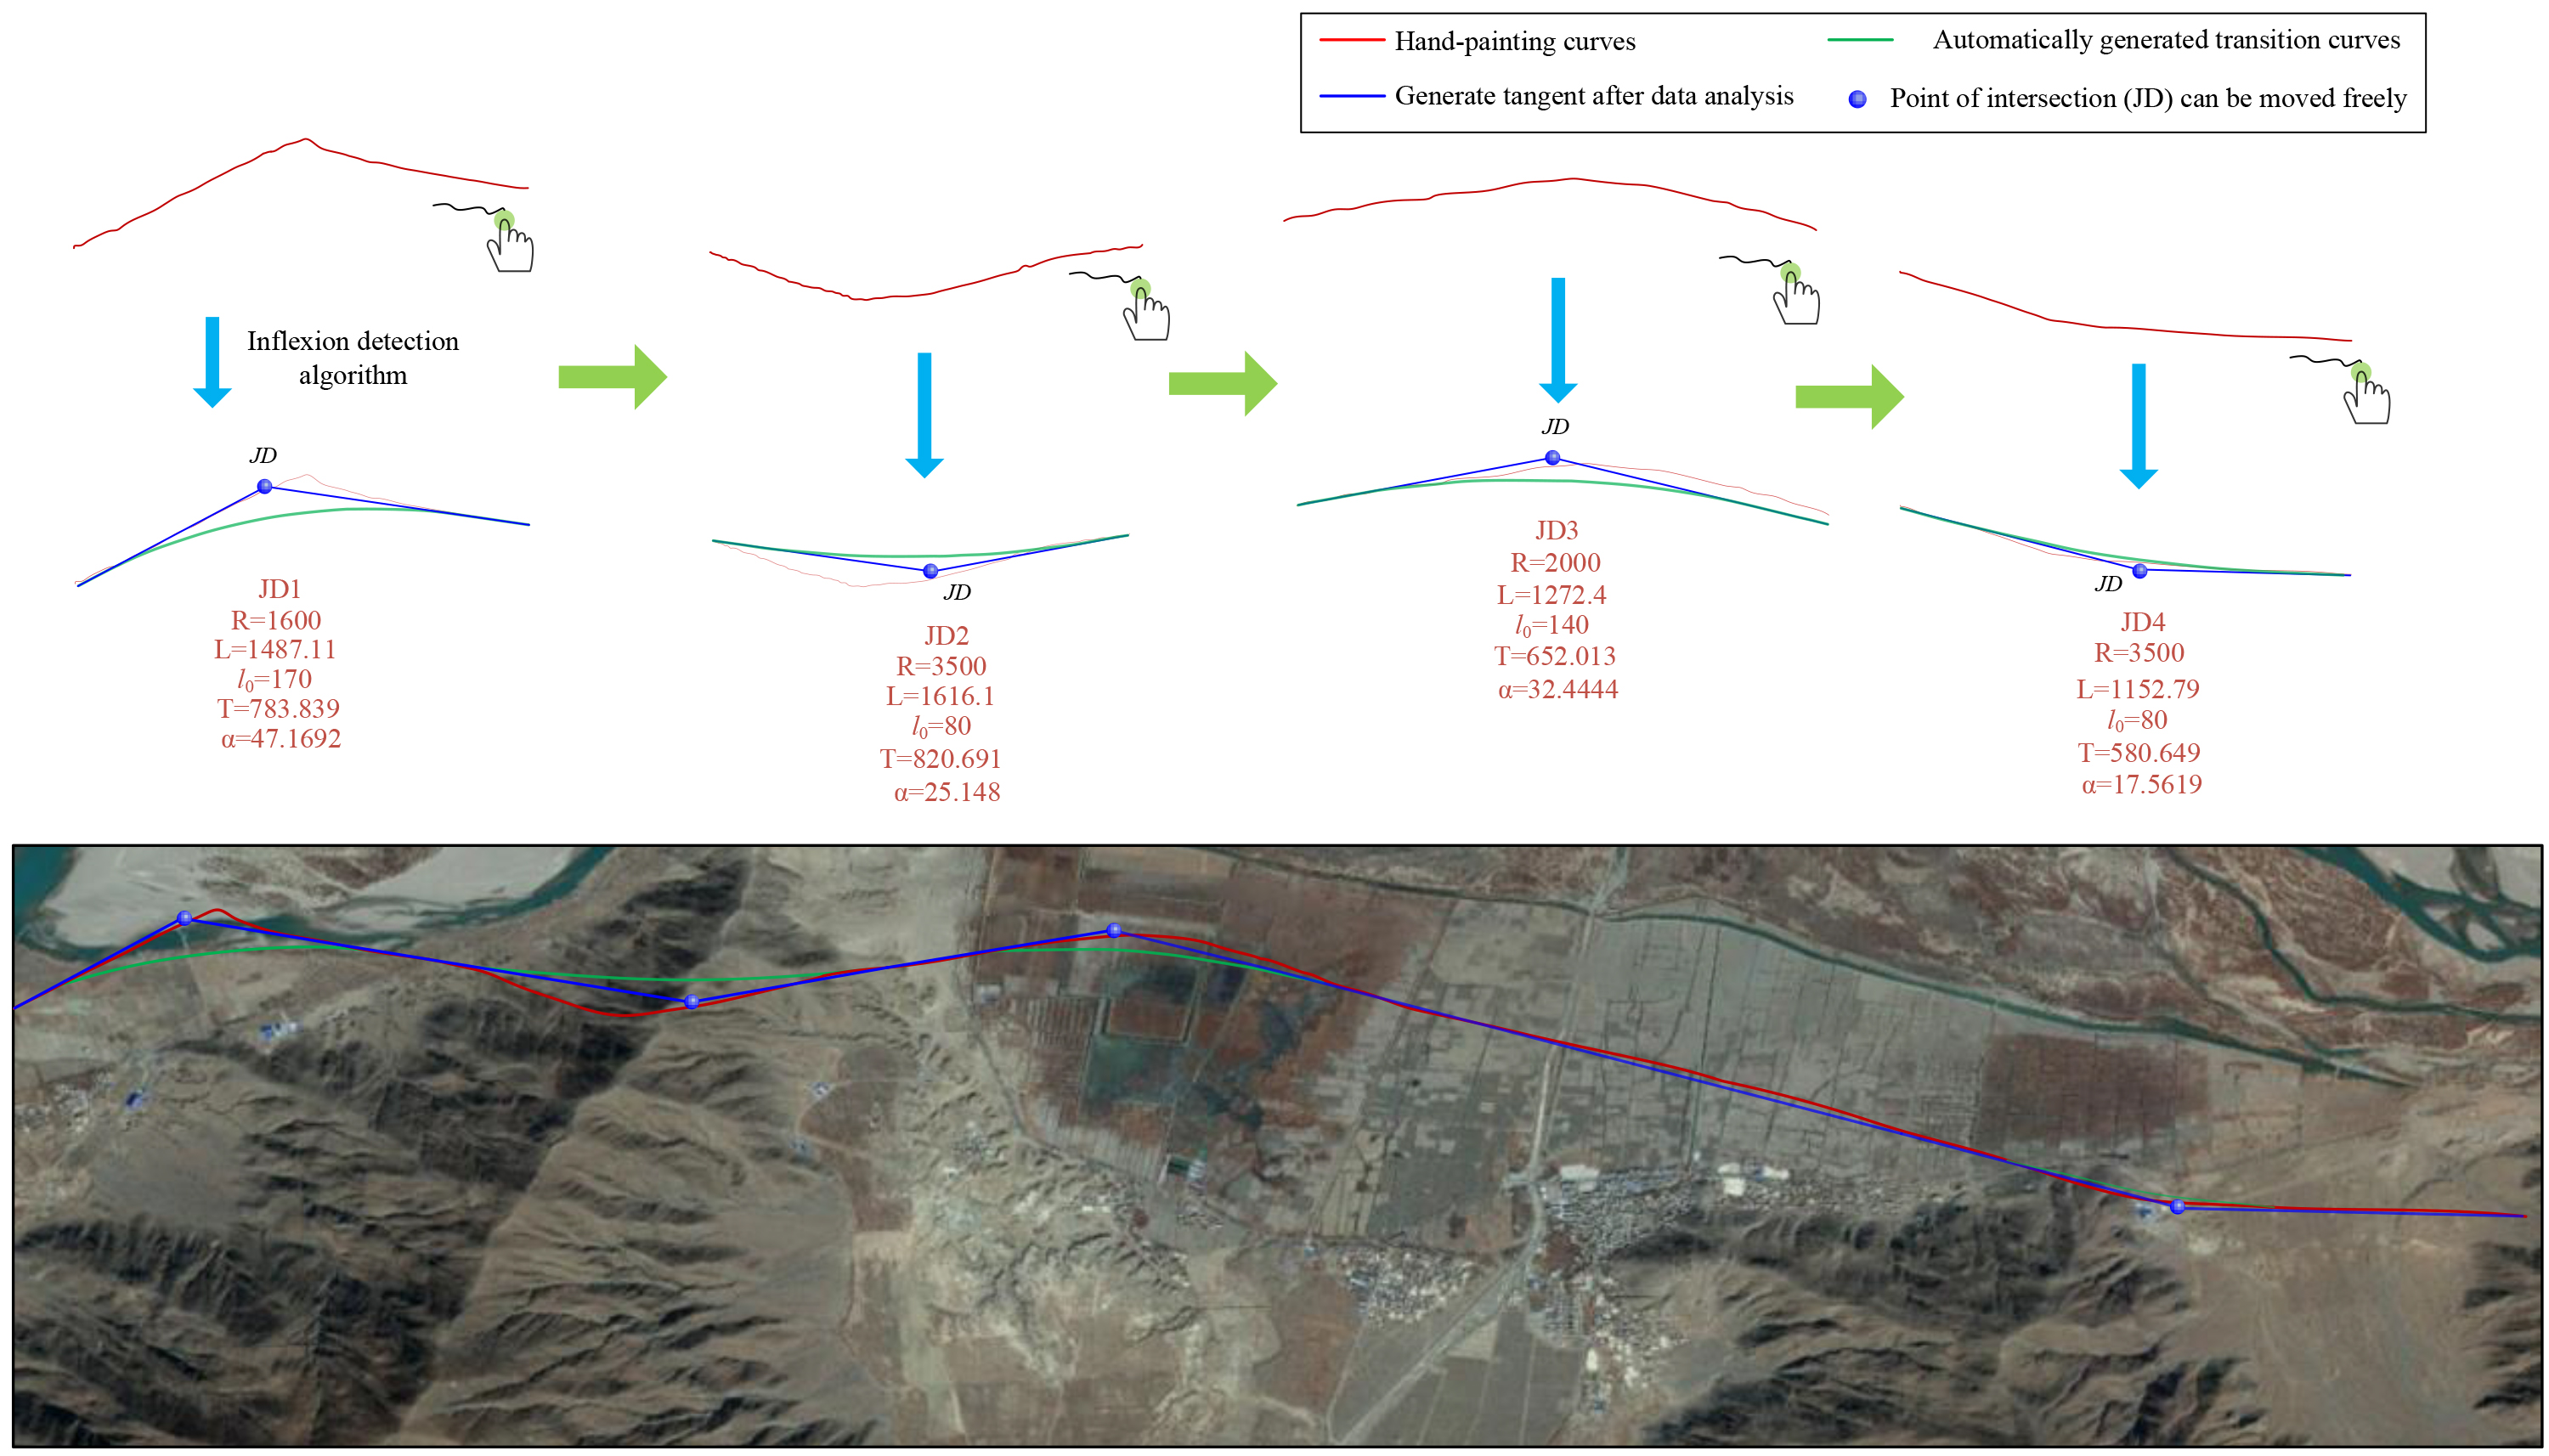
The horizontal design based on multi-touch refers to the final formation of a complete horizontal alignment scheme for the railway, including drawing the initial hand-drawing scheme, the processing of the hand-drawing data, and the automatic fitting of the hand-drawing points to the horizontal design scheme. The line drawn by hand gestures should conform to the fundamental law of alignment design. The smooth curve should be drawn in the curve section to avoid excessive turning angle at the turning point or too close to the two turning points, resulting in the calculation results being unable to meet the requirements of the minimum curve radius and the length of the intermediate straight line.
Table 3
Major parameters for vertical line design
| Slope segment number | Gradient/‰ | Length/m | Slope segment number | Gradient/‰ | Length/m |
|---|---|---|---|---|---|
| 1 | 800 | 10 | 5.1 | 450 | |
| 2 | 1.2 | 400 | 11 | 5.8 | 400 |
| 3 | 2.0 | 2050 | 12 | 3.2 | 400 |
| 4 | 12.0 | 800 | 13 | 800 | |
| 5 | 8.9 | 450 | 14 | 850 | |
| 6 | 400 | 15 | 400 | ||
| 7 | 400 | 16 | 450 | ||
| 8 | 450 | 17 | 3.4 | 400 | |
| 9 | 400 |
Figure 15.
Vertical section fitting diagram.
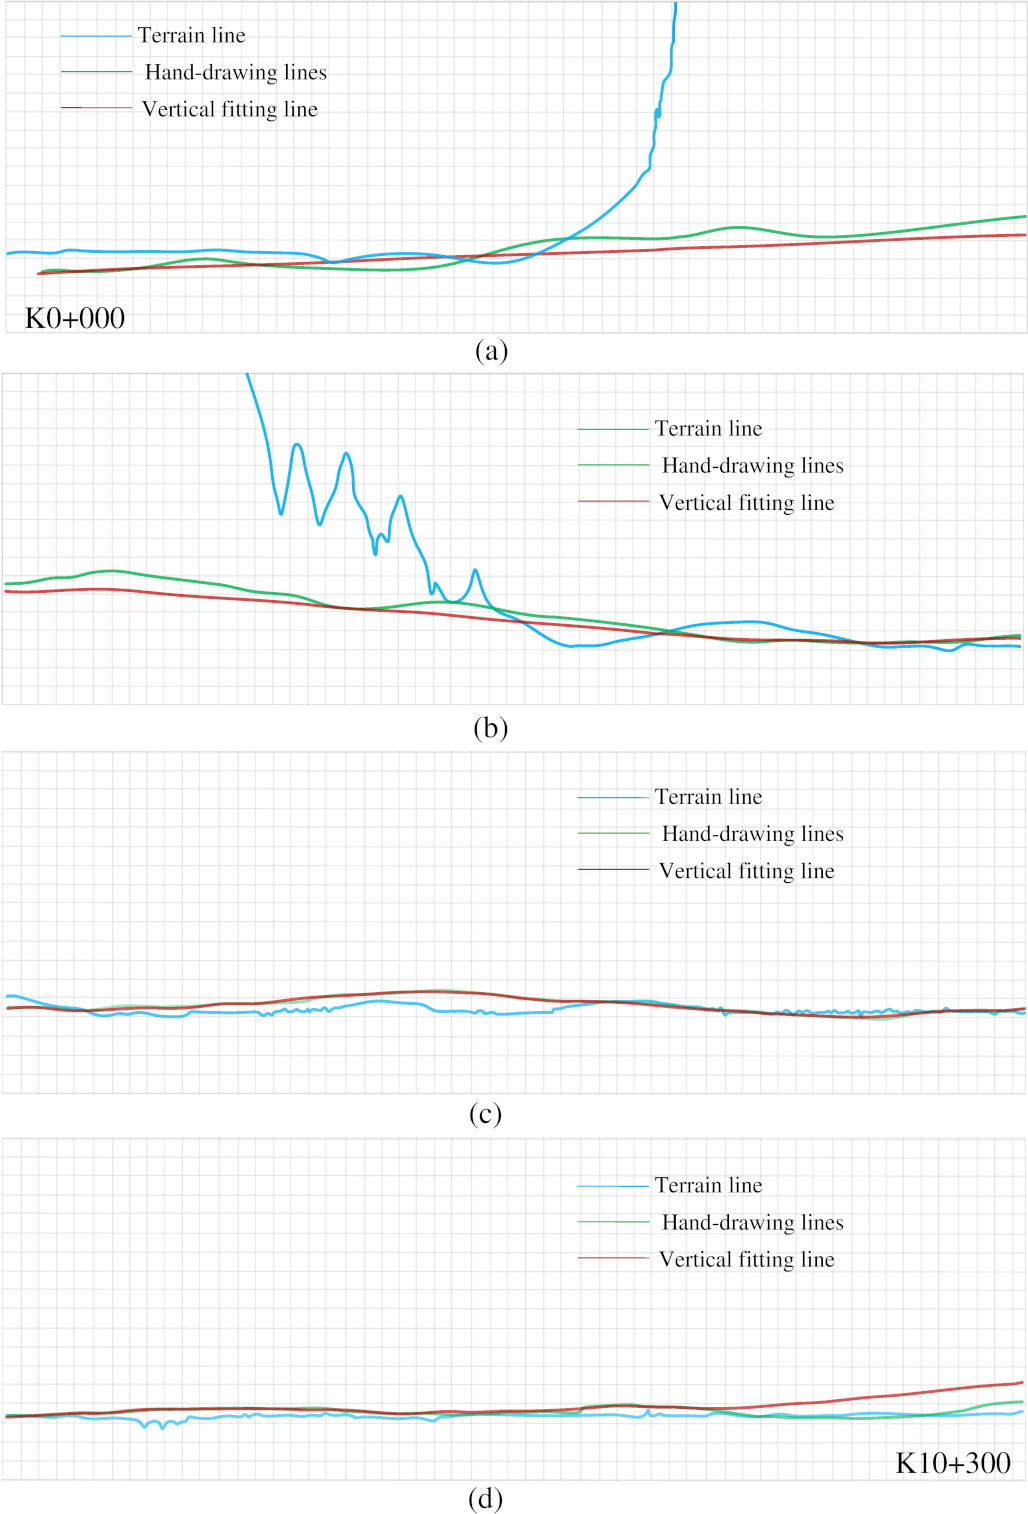
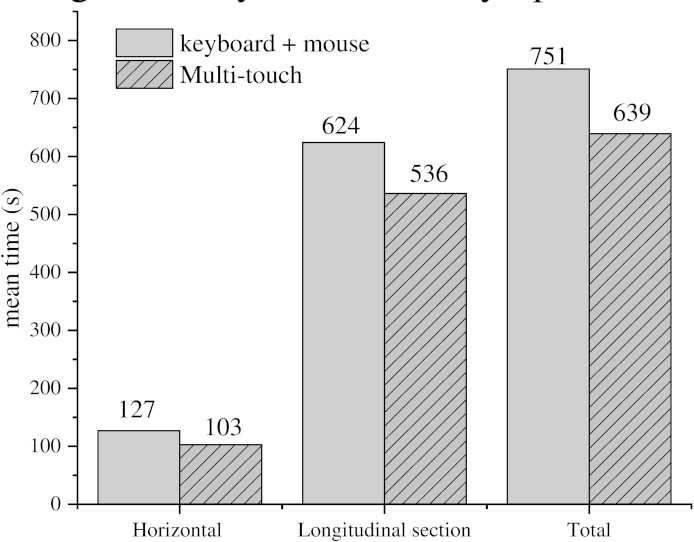
Figure 16.
Time-consuming comparison between traditional interaction and multi-touch.
After completing the basic drawing process, the data container in the program is set to store the necessary line information for the drawing process, including hand-drawing points, curvature elements, the control points of the turning interval starting point and endpoint, as well as an intermediate straight line, intersection points, slope and intercept, left or right deviation judgment, control points TS, SC, CS, ST. Meanwhile, the curve segment elements of the label information storage container are set, including radius
Firstly, the line is drawn by hand gesture on a multi-touch screen. Then, the line data are stored, and the line is automatically fitted after running the plane fitting program. The red line is the direct line drawn by hand, which is the horizontal curve. The blue line is the fitting line with the plane curve element. The hand-drawing curve and the effect of the fitting by-hand gesture interaction are shown in Fig. 14. According to China’s Code for Design of Railway Lines [41], it can be seen that the fitting line coincides with the red hand-drawing line based on conforming to the railway design specification.
Railway vertical alignment design is to fit the hand-drawing lines of the vertical section to the alignment design and then form the complete process of the vertical design scheme. According to the vertical curve fitting method of the vertical section described above, the selected points of the initial fitting procedure of the design alignment are collected, and the data information is automatically processed and calculated by the program algorithm. The hand-drawing points are fitted to the vertical section scheme in line with the design specification of railway alignment. The relevant results and necessary annotations are written in the program. Finally, the railway vertical alignment design based on multi-touch interaction is realized.
This example in the real world selects the vertical terrain section where the horizontal is located. The limiting gradient is 12‰, the length of the vertical curve is 15,000 m, the maximum gradient difference is 15‰, and the total length of the railway line is 10.3 km from K0
The results indicate that in the design process based on multi-touch interaction, the position elements of each gradient change point are automatically calculated by an integrated multi-touch gestures algorithm to output the alignment autonomously. The comparison contrasted the scheme based on the mouse+ keyboard and multi-touch is shown in Fig. 16. The user test is carried out with all the time-consuming of the design process as the judgment result. Without considering the advantages and disadvantages of the scheme, the alignment efficiency between the traditional interaction model and the multi-touch interaction mode is carried out in the same design zone. The hand-drawing lines can be directly and rapidly converted to the design alignment in the arbitrary scene, which notably saves the consumption time of railway alignment design up to 18.9% and 14.1% for horizontal and vertical alignment, respectively. The total working time may be reduced by up about 15%.
5.Conclusions
This paper presents an approach to the rapid generation of railway lines using a multi-touch gesture algorithm for natural, intuitive, flexible, and efficient implementation, including the multi-touch interactive hand gesture definition, horizontal and vertical fitting algorithm from gesture recognition, and a real-world example verification. The conclusions can be drawn as follows,
(i) The multi-touch interactive hand gestures for the railway line location are defined. There are three categories, geographical environment browsing manipulation gestures, alignment design operating gestures as well as mode switching gestures.
(ii) A fitting algorithm from hand-drawing lines to satisfied horizontal lines is proposed. The hand-drawing lines generated by defined multi-touch gestures are automatically fitted with the target horizontal lines using the inflection detection algorithm based on Euclidean Distance (ED).
(iii) A fitting algorithm from hand-drawing lines to satisfied lines is developed. The vertical line can be fitted by an integrated algorithm of extreme point-to-point (EPP) and chord-to-point distance accumulation (CPDA).
(iv) This research provides fundamental support for rapid scheme discussion of railway line generation, which is well-matched with modern handheld devices and the requirements of rapid selection as well as the quick comparison of railway line schemes in the early stage of design. A real-world example indicates that the generating time of a railway line is decreased by about 15% in the initial scheme compared with the traditional methods with mouse+keyboards.
Acknowledgments
This research is jointly and financially supported by the Youth Fund of Hebei Natural Science Foundation of China (Grant No. E2019210339); the Science and Technology Project of the Hebei Education Department (Grant No. QN2018068).
References
[1] | Song T, Pu H, Schonfeld P, Li W, Zhang H, Ren Y, Wang J, Hu J, Peng X. Parallel three-dimensional distance transform for railway alignment optimization using OpenMP. Journal of Transportation Engineering, Part A: Systems. (2020) ; 146: (5): 04020029. doi: 10.1061/JTEPBS.0000344. |
[2] | Song T, Pu H, Schonfeld P, Zhang H, Li W, Hu J. Simultaneous optimization of 3D alignments and station locations for dedicated high-speed railways. Computer-Aided Civil and Infrastructure Engineering. (2021) ; 37: (4): 405-426. doi: 10.1111/mice.12739. |
[3] | Song T, Pu H, Schonfeld P, Zhang H, Li W, Hu J, Wang J. Bi-objective mountain railway alignment optimization incorporating seismic risk assessment. Comput-Aided Civil and Infrastructure Engineering. (2021) ; 36: (2): 143-163. doi: 10.1111/mice.12607. |
[4] | Pu H, Wan XJ, Song TR, Schonfeld P, Li W, Hu JP. A geographic information model for 3-D environmental suitability analysis in railway alignment optimization. Integrated Computer-Aided Engineering. (2022) ; 30: (1): 67-68. doi: 10.3233/ICA-220692. |
[5] | Trietsch D. A Family of Methods for Preliminary Highway Alignment. Transportation Science. (1987) ; 21: (1): 17-25. doi: 10.1287/trsc.21.1.17. |
[6] | Cai L, Zhang J, Liu B. Somatosensory interaction with virtual environments based on gesture recognition. Journal of Huazhong University of Science and Technology (Natural Science Edition). (2015) ; 43: (S1): 136-139-165. |
[7] | Singh TD, Khilji A, et al. Predictive approaches for the UNIX command line: curating and exploiting domain knowledge in semantics deficit data. Multimedia Tools and Applications. (2021) ; 80: (6): 9209-9229. doi: 10.1007/s11042-020-10109-y. |
[8] | Schmidt A, Churchill E. Interaction Beyond the Keyboard. Review of Computer. (2012) ; 45: (4): 21-24. doi: 10.1109/MC.2012.137. |
[9] | Mitra G, Calogero V. A computer method for designing the optimum vertical profile of highways-a mathematical programming approach. International Conference on Computer Aided Design. (1969) ; 306-319. |
[10] | Shyr WJ. Development of Graphical Human Interface Technology for Use in Experimental Temperature-Sensing Module. Computer Applications in Engineering Education. (2011) ; 19: (3): 487-492. doi: 10.1002/cae.20328. |
[11] | de Mello FL, Strauss E, de Oliveira AAF. Computer theory and digital image processing applied to brain activation recognition. Integrated Computer-Aided Engineering. (2011) ; 18: (2): 157-166. doi: 10.3233/ICA-2011-0368. |
[12] | Hearst MA. Natural’ Search User Interfaces. Communications of the ACM. (2011) ; 54: (11): 60-67. doi: 10.1145/2018396.2018414. |
[13] | Zhang L. Graphical interface method and interactive graphics technology based on railway line selection CAD system. J Lanzhou University. (2011) ; 47: (2): 117-121. |
[14] | Li G. Technical Research on Railway Route Selection Based on Three-dimensional Scene. Railway Standard Design. (2012) ; (10): 19-21 plus 72. |
[15] | Li W, Pu H, Schonfeld P, et al. Mountain Railway Alignment Optimization with Bidirectional Distance Transform and Genetic Algorithm. Computer-Aided Civil and Infrastructure Engineering. (2017) ; 32: (8): 691-709. doi: 10.1111/mice.12280. |
[16] | Li W, Pu H, Schonfeld P, et al. A Method for Automatically Recreating the Horizontal Alignment Geometry of Existing Railways. Computer-Aided Civil and Infrastructure Engineering. (2019) ; 34: (1): 71-94. doi: 10.1111/mice.12392. |
[17] | Pu H, Song T, et al. A three-dimensional distance transform for optimizing constrained mountain railway alignments. Computer-Aided Civil and Infrastructure Engineering. (2019) ; 34: (11): 972-990. doi: 10.1111/mice.12475. |
[18] | Harding C, Souleyrette R. Investigating the Use of 3D Graphics, Haptics (Touch), and Sound for Highway Location Planning. Computer-Aided Civil and Infrastructure Engineering. (2010) ; 25: (a): 20-38. doi: 10.1111/j.14678667.2008.00591.x. |
[19] | Fu X, Long L, Li H, et al. Method and System Architecture of True Three-Dimensional Highway Alignment Design Based on Motion Sensing Interaction. Journal of South China University of Technology (Natural Science Edition). (2014) ; 42: (08): 91-96. |
[20] | Zackery C. Microsoft’s Upcoming Xbox Series X Console Brings The Power: Support for Xbox One, Xbox 360 and original games confirmed. Twice: This Week in Consumer Electronics. (2020) ; 35: (10): 15-15. |
[21] | Francisco RO, Adam SW, Katherine T, Armando B, Naphtali R. 3D Travel Comparison Study between Multi-Touch and Game Pad. International Journal of Human-Computer Interaction. (2020) ; 36: (18): 1699-1713. doi: 10.1080/10447318.2020.1780016. |
[22] | Chen Z. Recognition and interpretation of multi-touch gesture interaction. Human-Computer Interaction. INSA de Rennes; (2017) . |
[23] | Seol KS, Park S, Lee J, Nam H. Active stylus-touch discrimination scheme based on anomaly detection algorithm. Journal of the Society for Information Display. (2020) ; 28: (10): 1071-0922. doi: 10.1002/jsid.921. |
[24] | Derboven J, et al. Semiotic analysis of multi-touch interface design: The MuTable case study. International Journal of Human-Computer Studies. (2012) ; 70: (10): 714-728. doi: 10.1016/j.ijhcs.2012.05.005. |
[25] | Jordi T, Frank H. Visualization and Interaction with Multiple Devices: A Case Study on Reachability of Remote Areas for Emergency Management. I-com. (2017) ; 16: (3): 223-246. doi: 10.1515/icom-2017-0027. |
[26] | Tseng PH, et al. EZ-Manipulator: Designing a mobile, fast, and ambiguity-free 3D manipulation interface using smartphones. Computational Visual Media. (2018) ; 4: (2): 139-147. doi: 10.1007/s41095-018-0105-0. |
[27] | George SH, Rafiei MH, Borstad A, Gauthier L, Buford JA, and Adeli H. Computer-Aided Prediction of Extent of Motor Recovery Following Constraint-Induced Movement Therapy in Chronic Stroke. Behavioural Brain Research. (2017) ; 327: : 191-199. doi: 10.1016/j.bbr.2017.03.012. |
[28] | Grecia GG, Ronald RG, Aldrich FK, Peter CH. Multi-touch Interaction Data Analysis System (MIDAS) for 2-D tactile display research. Behavior Research Methods. (2020) ; 52: (2): 813-837. doi: 10.3758/s13428-019-01279-1. |
[29] | Uthpala S, et al. What they can and cannot: A meta-analysis of research on touch and multi-touch gestures by two to seven-year-olds. International Journal of Child-Computer Interaction. (2019) ; 22: (Dec): 100151. doi: 10.1016/j.ijcci.2019.100151. |
[30] | Jay C, Sung K. Identifying the boundaries of screen edge and screen corner gestures based on thumb and index finger interactions on a small touch screen. Proceedings of the Human Factors and Ergonomics Society. (2017) ; 61: (1): 1071-1813. doi: 10.1177/1541931213601870. |
[31] | Roda-Sanchez L, Olivares T, Garrido-Hidalgo C, de la Vara JL, Fernandez-Caballero A. Human-robot interaction in Industry 4.0 based on an Internet of Things real-time gesture control system. Integrated Computer-Aided Engineering. (2021) ; 28: (2): 159-175. doi: 10.3233/ICA-200637. |
[32] | Smith SM, Brady JM. SUSAN – A New Approach to Low Level Image Processing. International Journal of Computer Vision. (1997) ; 23: (1): 45-78. doi: 10.1023/A:1007963824710. |
[33] | Verkeenko MS. Development of an algorithm for fast corner points detection. Journal of Computer and Systems Sciences International. (2014) ; 53: (3): 392-401. doi: 10.1134/S1064230714030162. |
[34] | Frank YS, Wu YT. Three-dimensional Euclidean distance transformation and its application to shortest path planning. Pattern Recognition. (2003) ; 37: (2004): 79-92. doi: 10.1016/j.patcog.2003.08.003. |
[35] | Awrangjeb M, Lu G. Robust Image Corner Detection Based on the Chord-to-Point Distance Accumulation Technique. IEEE Transactions on Multimedia. (2008) ; 10: (6): 1059-1072. doi: 10.1109/TMM.2008.2001384. |
[36] | Shi J, Tian Y, Sun Y, et al. Corner Detection Algorithm Based on Image Contour Curve. Measurement and control technology. (2020) ; 39: (8): 91-96+105. |
[37] | Wang Z. Railway engineering survey. China Railway Publishing House. (1998) . ISBN: 9787113026851. |
[38] | Shen TI, Chang CH, Chang KY, et al. A Numerical Study of Cubic Parabolas on Railway Transition Curves. Journal of Marine Science and Technology-Taiwan. (2013) ; 21: (2): 191-197. doi: 10.6119/JMST-012-0403-1. |
[39] | Henriksen K, Sporring J, Hornbaek K. Virtual trackballs revisited. IEEE Transactions on Visualization and Computer Graphics. (2004) ; 10: (2). doi: 10.1109/TVCG.2004.1260772. |
[40] | Rao X, Zou B. An Algorithm for Erasing Grid-lines and Reconstructing Strokes in Chinese Handwriting Based on Block Adjacency Graph. Journal of Image and Graphics. (2006) ; 11: (4): 549-554. doi: 10.11834/jig.20060491. |
[41] | China Ministry of Railways Code for Design of Railway Line. Beijing, China: China Planning Press; (2017) . |


