
Enhancing citizen satisfaction and loyalty in e-government: Lessons learned from Jakarta COVID-19 website
Abstract
This study focuses on the sustainability of utilizing health information related to COVID-19 to meet public needs after the end of the pandemic era in Jakarta. During the COVID-19 pandemic in 2020, as a form of response to public needs regarding information and services about COVID-19, the government provided services and digital information to optimize information access to citizens. However, the COVID-19 situation in Jakarta has changed, therefore the Corona website’s needs for information and services have also changed. By maximizing e-government owned by the Jakarta Provincial Government, one of the efforts that can be made is increasing service loyalty and information utilization. This research model refers to the theory of Four-Stages Loyalty and reputation on websites, adding variables to Communicative Ecology on government media as a source of information about COVID-19 and variables in visual complexity models on electronic devices. This research methodology uses quantitative approaches using PLS-SEM, and the respondents are users within the last three months. Based on the results of this research, the loyalty stage provides the basis for the development of the Jakarta government’s Corona website to maintain user loyalty.
1.Introduction
Currently, the existence of official websites of the Jakarta Provincial Government, Indonesia, and even worldwide, which are focused on health information about COVID-19, faces significant challenges, especially since the COVID-19 pandemic has been declared over [1]. The corona.jakarta.go.id website is the official website owned by the Jakarta Provincial Government that provides up-to-date information and news about COVID-19 [2]. The information on the website is considered irrelevant to the current COVID-19 situation, indicated by the decrease in the number of visitors over the past year. Moreover, the accuracy of the information needs to be updated to ensure that specific information remains available and easily accessible to users. In addition, the health information available on the site needs to maintain consistency as it is used as a recommendation for health treatments and health guidelines. This can be achieved by improving the readability of the information and updating it according to the current conditions.
To promote digital transformation in public service delivery, the Indonesian Government needs to regulate it within the Electronic-Based Government System (SPBE) regulations. These regulations encourage the government to create digital products [3]. The digital products created by the government are expected to accommodate and meet the various needs of the public. The mandate of Law No. 14 of 2008 on Public Information Disclosure states that; First, the government has a role in supporting these needs; Second, it guarantees the citizens’ right to know the plan of making public policy; Third, it actualizes the implementation of transparent and accountable services, and enlightens the life of the nation.
This can be done through websites, allowing the public to efficiently access credible and reliable information. The information provided by the government is essential for public use. Therefore, the Jakarta Provincial Government has developed the corona.jakarta.go.id website as a channel for delivering COVID-19-related information in Jakarta. Developing the Corona Website can also be a strategy for digital community health development [4].
According to the World Bank [5], countries with broader internet access and utilization of information technology to disseminate information about the pandemic, tend to have good infrastructure, governance, and community development in dealing with the pandemic. This is evident during the COVID-19 pandemic, where 167 countries have created digital platforms through mobile applications and social media, providing information and guidelines regarding COVID-19, pandemic statistics, travel guidelines, and guidelines for protecting oneself from COVID-19.
Based on these factors, this research discusses the strategies that need to be implemented to keep the corona.jakarta.go.id website engaging and enhance user loyalty. The objective of this research is to determine the factors that influence user loyalty and how these factors relate to loyalty. User loyalty behavior on the Corona website is important to explore as it can determine future development strategies for the Corona website, especially after the end of the COVID-19 pandemic.
2.Theoretical framework
2.1.E-government
In the study of Cumbie and Carr [6], e-government is a service from the government by utilizing ICT, one of which is using a website. This online service can be provided inclusively to support the provision of quality public services including in-service integration, service distribution, and service development. The general characteristic of e-government is in the form of a one-stop service that makes it easier for different stakeholders from government organizations to build services for the public that are more democratic and participatory. There are three components of e-government, that is ICT (internet, website, platforms), stakeholders, and several outcomes including increasing interaction among stakeholders, increasing public participation, and improving transparent and convenient government services.
Satisfying e-government services will increase the level of public trust. This is in line with the study conducted by Jameel, et al. [7], that e-government has a mediating role in improving good governance and public trust due to transparent and accountable information. Therefore, the development of e-government needs to be done to maintain the quality of information so that it remains relevant for use by the public. Butt et al. [8] stated that the use of government websites needs to be readjusted in terms of design and information so that the public experience is more comfortable in accessing websites.
2.2.Government public communication
The government has a stake in managing an area, including providing services to the community. Therefore, the government needs to have a communication strategy, including during times of crisis. This communication strategy can be used as a form of maintaining the reputation of an organization, both from the public and framed by the media. However, the communication strategy used is related to the political environment. Even though this strategy is more relevant, it can be seen from the pattern of people’s habits that can be seen from the process of exchanging behavior. As a result, the public communication strategy undertaken by the government also faces challenges due to the various types of society (segmentation) and standpoints. To run effectively, the government’s public communication strategy can be designed with similar values from various segments of society and identifying orientations and needs with certain issues [9].
In addition, the government’s public communication strategy can use a collaborative and more personal communication model to open up space for the public to make decisions and solve problems. In this case, the communication that is carried out can focus on community-building so that it can be more connected, democratic, and responsive so that strategies can be made based on shared values and interests. Furthermore, the government’s public communication is more focused on disseminating information to the more transparent public. However, the government’s public communication has a gap between the goals of government communication and the public’s perception, because there are differences in expectations and mutual benefits [10].
2.3.The role of government
Over the years, the role of government has broadened to include the economy and public services. In the past, the role of government focused on the creation of laws which historically evolved until its purpose changed to protect society from conflict by providing law and orderliness. As stated by the 4th President of the United States, James Madison, “The role of government extends to all objects which, in the ordinary course of affairs, concern the life, liberty, property of the people, internal orderliness, improvement, and prosperity of the State”. The pressures on governments today are numerous, the challenges complex and the politics diverse. Therefore, the role of society is equally important, where the two coincide to form an effective government. The role of government itself is very diverse depending on the sector, whether the role is social, economic, political, or public services.
Cited from the Walyben website, Princewill Ene mentions 5 important roles of government in general, namely Provision of Security, Welfare of Citizens, Promotion of Political Activities, Provision and Promotion of Economic Activities, and Provision of Social Amenities. Although the role of government is constantly changing, its function in the life of the state is certainly very important considering that its main role as a responsible person will continue to be inherent for an infinite time.
2.4.Strategic communication through Jakarta COVID-19 website
Built in 2020, the Jakarta Government’s COVID-19 Website serves as a center for information and services related to the prevention and control of the COVID-19 pandemic (Fig. 1). The complete presentation of data on this website is also inseparable from the support of various stakeholders such as the Health Service, and the Spatial Planning and Land Creation Services who work together to present the latest information about COVID-19. As a one-stop service platform, the COVID-19 website presents mainstay features such as Dashboard Monitoring Data on COVID-19 cases, COVID-19 and Vaccine Distribution Map, Fund Distribution and Collaboration, Vaccine Quotas, as well as Information, Publications, and Policy Features.
Website performance is also monitored with the help of Google Analytics which can measure the number of visits, the most frequently accessed pages, and the bounce rate on the website. This website initially used the Universal Analytics version of Google Analytics, then at the end of 2022 it was migrated to Google Analytics Version 4. According to the analysis results, users actively accessed Data Monitoring, Map of the Spread, Vaccination Quota, and Fund Distribution and Collaboration. In addition, the bounce rate analysis on this website has a high percentage. This shows that visitors only want to access the pages they want and do not intend to explore the website deeper. However, this shows that users are interested in information that is specific and suits their needs.
3.Research framework and hypothesis
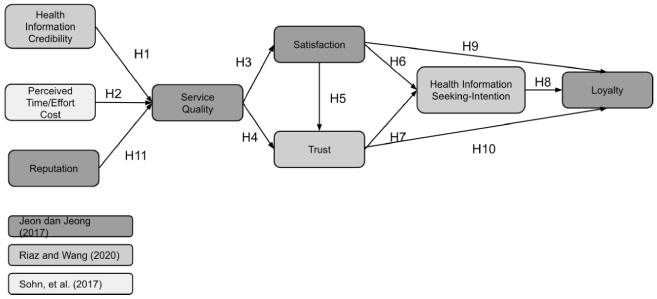
The research model was developed based on previous studies, including the Four-Stage Loyalty model and website reputation [11], the Communicative Ecology Theory on government media as a source of COVID-19 information [12], and the visual complexity model on electronic devices [13]. The research model and its hypotheses are illustrated in Fig. 2.
Fig. 2.
Research framework for study.
3.1.Loyalty
Customer loyalty is defined as a commitment to reuse a product or service consistently regardless of the influence and marketing of other similar products or services that can cause customers to migrate. Loyalty includes attitude and behavioral/action phases. The attitude phase consists of three stages, including cognitive, affective, and conative. Loyalty will increase through the cognitive, affective, conative, and behavioral stages in sequence, and each stage is influenced by different factors [14]. This concept is known as the Four-Stage Loyalty theory.
The first stage, cognitive, originates from knowledge based on experience. An individual in this stage builds loyalty through comparing the chosen product or service with alternative options based on their knowledge or experience [15]. Factors within this stage are related to quality or functional and psychological aspects, as well as perceived value, which is the evaluation of consumers towards the product or service based on their customer experience [15,16]. In this research, perceived value is depicted as the user’s experience in using the Corona Website, including the health information credibility, perceived time/effort costs, and service quality. Health information credibility refers to the reliability and trustworthiness of the information. When individuals or users of media platforms perceive health information to have high credibility, they will positively intend to seek health services information with confidence, consistently using the media platform [12,17]. Perceived time/effort costs refer to the cognitive effort required to use the website, where the exerted effort is related to the amount of time needed to complete the effort [13,18].
Information quality is an important factor in the quality of government website services, encompassing the accuracy and speed of the information delivered by the government website [19,20]. Another factor, perceived time/effort costs, also influences service quality. A user-friendly website reduces the time customers spend accessing the website, making them feel more comfortable and encouraging repeat visits [11,21]. High time and effort costs can reduce customers’ perception of service quality. Based on these factors, the following hypotheses can be formulated:
H1: Health Information Credibility has a positive influence on Service Quality; H2: Perceived Time/Effort Costs have a negative influence on Service Quality.
Service quality is the overall evaluation of attitudes towards the provided service [11,22]. Based on several studies, service quality (cognitive phase) influences satisfaction (affective phase) [11,23]. Furthermore, according to Harris and Goode [24], service quality can affect trust in the website. Therefore, the following hypotheses can be proposed:
H3: Service Quality has a positive influence on Satisfaction; H4: Service Quality has a positive influence on Trust.
The second stage, affective, is the level of loyalty where customers like and derive satisfaction from a product or service [14]. According to Han, et al. [16], several factors within the affective stage can influence conative behavior, such as attitudes, satisfaction, emotions, and enjoyment. In this study, the affective stage is represented by satisfaction and trust factors. Satisfaction refers to the degree of fulfillment of customer needs and their evaluation of website services [11]. Trust is defined as a party’s willingness to be vulnerable to the actions of another party based on the expectation that the other party will perform certain actions important to the trustor, irrespective of the ability to monitor or control the other party [25]. According to Lee, et al. [26], customer satisfaction is closely related to positive word-of-mouth and can enhance customer trust in a product or service. Based on this, the following hypotheses can be proposed:
H5: Satisfaction has a positive influence on Trust.
According to Jeon and Jeong [11], customer satisfaction as an affective stage influences customers’ intention to return. In this study, the Corona website provides information related to COVID-19 data and various guidelines on COVID-19 prevention. Therefore, the expected intention of users is to have the awareness to continuously update information about the COVID-19 pandemic and implement health guidelines. Furthermore, according to Hooda, et al. [27], trust between users and the government through the e-government system can reduce the negative impact of perceived risks, thus influencing users’ intention to use e-government. The Corona website is a government-owned website in Jakarta that focuses on health matters. When users trust this media, they are more inclined to adopt the information provided on the website [28]. Based on these findings, the following hypotheses can be formulated:
H6: Satisfaction has a positive influence on the Health Information Seeking-Intention; H7: Trust has a positive influence on the Health Information Seeking-Intention
The third stage, conative, represents strong customer commitment to a product or service, characterized by repeated purchasing or usage behavior [14]. In this study, the Corona Website is a government-managed website that provides health information and guidance during the COVID-19 pandemic, so the appropriate repeated usage intention for users is to seek health information. Therefore, the intention to find health information is used as a conative factor in this study. Seeking health information through the website can support the public in understanding their health conditions and taking preventive actions as a personal healthcare habit [29], especially in health emergencies such as the COVID-19 pandemic.
The fourth stage, behavioral loyalty, is achieved when customers have gone through the previous three stages. According to Oliver [14], customers at this stage disregard other similar competitors. In this study, user loyalty is depicted as a behavior where users rely solely on the Corona Website as their source of information on COVID-19. The conative stage can influence the behavioral stage, thus the hypothesis relationship between the health information seeking-intention and loyalty is as follows:
H8: Health Information Seeking-Intention has a positive influence on Loyalty.
According to Anderson and Srinivasan [30], dissatisfied customers tend to seek information to find alternative products/services and eventually switch to competitors’ products/services that they find more satisfying. Therefore, satisfied users are more likely to be loyal to the product/service. Furthermore, several studies have shown that trust can influence loyalty, especially in the context of digital products [24,31–33]. Based on these findings, the following hypotheses can be proposed:
H9: Satisfaction has a positive influence on Loyalty; H10: Trust has a positive influence on Loyalty.
3.2.Reputation
Reputation on a website is defined as the customers’ belief that the website is presented honestly and cares about their needs [34]. A website with a good reputation can present more objective and accurate information, allowing customers to receive credible information and derive value from the products or services on the website [35]. This can enhance customers’ benefits when using the website and ultimately increase trust [36]. A good reputation on a website can also enhance customers’ perception of good website quality, characterized by good information quality, fast website response, and appealing visual design [37]. Based on these factors, the following hypothesis can be proposed:
H11 : Reputation has a positive influence on Service Quality.
4.Methodology
This survey utilized purposive sampling, targeting users who have accessed the Corona website (www.corona.jakarta.go.id) within the last 3 months. Respondents eligible to complete the questionnaire were those who have used the Corona website. The survey questionnaire was created using the LimeSurvey tool, consisting of multiple-choice and Likert scale questions in the Indonesian language. The survey comprised three sections: demographic questions, questions regarding the experience of using the Corona website, and statements to address the model. The Likert scale used in the questionnaire ranged from 1 to 4 (Strongly Disagree–Strongly Agree). The list of statements used can be seen in Table 1. The survey was distributed online through various platforms, including social media and banners within the Corona website. The distribution took place from March 7, 2023, to March 17, 2023. A total of 514 respondents joined the survey resulting in 166 respondents who have experience in using Website Corona, 249 respondents never used Website Corona, and 99 respondents never completed the survey. Out of 166 respondents, 116 respondents completed their survey and met the criteria for analysis.
Table 1
List of variables and statements
| Variable name | Code | Statement | Source |
| Health Information Credibility (HIC) | HIC1 | During the COVID-19 pandemic, the health information provided on the Corona website is accurate | Riaz and Wang (2020) [12] |
| HIC2 | During the COVID-19 pandemic, the information available on the Corona Website is up-to-date. | ||
| HIC3 | During the COVID-19 pandemic, the information provided on the Corona website has a great format/layout | ||
| HIC4 | During the COVID-19 pandemic, the information available on the Corona website suits my needs | ||
| Perceived Time/Effort Cost (PTE) | PTE1 | The ease of finding information on the Corona website | Sohn, et al. (2017) [13] |
| PTE2 | The time taken to load (loading time) the Corona website | ||
| PTE3 | The ease of using the Corona website | ||
| Reputation (RP) | RP1 | I received a good impression from the media about Corona Website | Jeon and Jeong (2017) [11] |
| RP2 | Some people I know have recommended Corona Website to me | ||
| RP3 | I read many positive feedbacks on social media about Corona Website | ||
| RP4 | The quality provided by the Corona Website is in line with my expectations. | ||
| Service Quality (SQ) | SQ1 | Corona’s website provides quality services and information that suit my needs. | Jeon and Jeong (2017) [11] |
| SQ2 | Features on the Corona website are able to function properly | ||
| SQ3 | Corona website provides information with technology that supports the display of COVID-19 data | ||
| Satisfaction (SF) | SF1 | I am satisfied with the services and information provided by the Corona website. | Jeon and Jeong (2017) [11] |
| SF2 | The Corona website is able to provide the health information I need. | ||
| SF3 | Website Corona is reliable | ||
| Trust (TR) | TR1 | The Corona website is the primary guide to finding health information during the COVID-19 pandemic | Riaz and Wang (2020) [12] |
| TR2 | In my opinion, the health information I get from the Corona Website is reliable | ||
| TR3 | I believe that the Corona Website guarantees the confidentiality of personal data. | ||
| TR4 | I ensure that Corona’s website is the best media to provide health information. |
Table 1 (Continued).
| Variable name | Code | Statement | Source |
| Health Information Seeking-Intentions (HIS) | HIS1 | I will implement the COVID-19-related health tips displayed by the Corona Website | Riaz and Wang (2020) [12] |
| HIS2 | I will use the Corona website as my main reference for information about COVID-19 | ||
| HIS3 | I will prioritize health information through the Corona website over other sources. | ||
| Loyalty (LY) | LY1 | I use the Corona Website regularly | Jeon and Jeong (2017) [11] |
| LY2 | I will continue to use the Corona Website to get information about COVID-19 | ||
| LY3 | I actively recommend the Corona Website to friends and/or family |
The analysis method used was PLS-SEM (Partial Least Squares Structural Equation Modeling) using SmartPLS software version 3. The analysis consisted of measurement model analysis and structural model analysis. PLS-SEM was chosen for this research because it can measure the causal relationships between factors, it can be used with small sample sizes (<500), and it is suitable for exploring relationships between models [38]. The analysis process started with analyzing the respondents’ demographics, measuring the measurement model, which included validity and reliability tests, and measuring the structural model, which involved measuring the path coefficients to determine the research hypotheses and measuring the R2 and f2 values.
5.Findings and discussion
The data findings are divided into demographic data and the experiences of respondents when using the Corona website. There were 116 selected respondents who proceeded to the analysis stage. Here are the findings from the respondents who filled out the survey on the utilization of the Corona website.
5.1.Demographics
The demographic data of the respondents include users with Jakarta ID Card, gender, age, highest education level, domicile, occupation, work location, duration of accessing the Corona website, last access to the Corona website, and the information that is commonly searched for.
Table 2
Demographics of respondents
| Latest education (n = 116) | Age (n = 116) | ||
| Bachelor degree | 50,86% | 41–60 | 37,07% |
| High school | 31,03% | 25–40 | 37,07% |
| Master degree | 7,76% | 18–24 | 12,93% |
| Diploma | 6,03% | >60 | 12,93% |
| Mid school | 2,59% | ||
| Elementary school | 1,72% | ||
| Occupation (n = 116) | Work location (n = 116) | ||
| Private officer | 18,10% | South Jakarta | 25,86% |
| Contract officer | 15,51% | East Jakarta | 23,27% |
| Non-civil servant officer | 12,93% | Central Jakarta | 22,41% |
| Taking care of household | 10,34% | North Jakarta | 10,34% |
| Retired | 9,48% | West Jakarta | 6,89% |
| Entrepreneur | 7,76% | Bogor, Depok, Tangerang, Bekasi | 6,03% |
| Professional | 6,03% | Others | 5,17% |
| Others | 5,17% | ||
| Civil servant | 4,31% | ||
| Students | 4,31% | Since when did you access Jakartas corona website? (n = 116) | |
| Unemployment | 4,31% | >12 months ago | 55,17% |
| Freelancer | 1,72% | Less than 6 months ago | 23,27% |
| 6–12 months ago | 21,55% | ||
| Domicile (n = 116) | |||
| South Jakarta | 26,72% | ||
| East Jakarta | 25,86% | Information you usually looked in Jakartas corona website (n = 197)* | |
| Bodetabek | 14,66% | COVID-19 cases and other data | 43,65% |
| Central Jakarta | 12,93% | Information and services about vaccination | 34,52% |
| North Jakarta | 10,34% | Information about social distancing policy | 13,70% |
| West Jakarta | 8,62% | Information about government assistance | 8,12% |
| Others | 0,86% | *Respondents choose more than one options | |
Based on Table 2, 75.86% of respondents have Jakarta ID Card, 70.69% of respondents are male, 50.86% of respondents have a Bachelor’s degree as their highest education level, 74.14% of respondents are between 25 and 60 years old, 46.54% of respondents are employed, 25.86% of respondents work in South Jakarta, 26.72% of respondents live in South Jakarta, and 55.17% of respondents have accessed the Corona website more than 1 year ago. Furthermore, 43.65% of respondents stated that they searched for Covid-19 cases and other related data.
Fig. 3.
Most beneficial and most visited information in corona website.

Based on survey results (Fig. 3), the most useful and most visited information in 2020 was Data Monitoring, Map of the Spread, and Chronological Map. This shows that at the beginning of the COVID-19 pandemic, users needed information about the spread of the virus throughout DKI Jakarta. Furthermore, in 2021, the most useful and most visited information was Vaccination, Vaccination Quota, Chronological Map, Vaccination Coverage, and Data Monitoring. This shows that in that year, users began to realize the importance of the COVID-19 vaccine, so they actively looked for information about vaccination and how to get the vaccine. Then in 2022, the most useful and most visited information was Data Monitoring and Vaccination. This shows that users were still monitoring information about vaccines and monitoring the spread of COVID-19 during the period of Large-Scale Social Collaboration (Kolaborasi Sosial Berskala Besar).
5.2.Measurement model
Table 3a
Result of reliability test
| Indikator | Factor loading | AVE | Composite reliability | Cronbach’s Alpha |
| HIC1 | 0,868 | 0,761 | 0,927 | 0,895 |
| HIC2 | 0,863 | |||
| HIC3 | 0,861 | |||
| HIC4 | 0,897 | |||
| PTE1 | 0,901 | 0,753 | 0,901 | 0,834 |
| PTE2 | 0,769 | |||
| PTE3 | 0,924 | |||
| RP1 | 0,872 | 0,754 | 0,924 | 0,892 |
| RP2 | 0,820 | |||
| RP3 | 0,901 | |||
| RP4 | 0,878 | |||
| SQ1 | 0,927 | 0,871 | 0,953 | 0,926 |
| SQ2 | 0,934 | |||
| SQ3 | 0,938 | |||
| SF1 | 0,864 | 0,790 | 0,918 | 0,867 |
| SF2 | 0,903 | |||
| SF3 | 0,899 | |||
| TR1 | 0,878 | 0,753 | 0,924 | 0,890 |
| TR2 | 0,861 | |||
| TR3 | 0,846 | |||
| TR4 | 0,885 | |||
| HIS1 | 0,743 | 0,728 | 0,888 | 0,816 |
| HIS2 | 0,898 | |||
| HIS3 | 0,908 | |||
| LY1 | 0,840 | 0,764 | 0,907 | 0,848 |
| LY2 | 0,895 | |||
| LY3 | 0,887 |
Based on the results of the measurement model analysis in Table 3a and Table 3b, the factor loading values for all statement items are above 0.7 and have an AVE value above 0.5 thus it can be concluded that they meet the convergent validity requirements. Then the Composite Reliability (CR) value and the value on Cronbach’s Alpha for each construct are on a scale of 0.7 to 0.9 so that it has good internal consistency reliability. The Fornell–Larcker criterion value indicates that the square root value of AVE in each construct must be higher than the highest correlation in the other constructs so that it can be concluded that it meets the requirements of discriminant validity.
Table 3b
Result of validity test (Fornell–Larcker criterion)
| HIC | PTE | RP | SQ | SF | TR | HIS | LY | |
| HIC | 0,872 | |||||||
| PTE | 0,594 | 0,868 | ||||||
| RP | 0,547 | 0,661 | 0,868 | |||||
| SQ | 0,859 | 0,609 | 0,606 | 0,933 | ||||
| SF | 0,620 | 0,647 | 0,849 | 0,669 | 0,889 | |||
| TR | 0,540 | 0,660 | 0,767 | 0,518 | 0,518 | 0,868 | ||
| HIS | 0,661 | 0,587 | 0,539 | 0,587 | 0,572 | 0,618 | 0,853 | |
| LY | 0,408 | 0,371 | 0,605 | 0,367 | 0,574 | 0,645 | 0,431 | 0,874 |
[i] **p < 0,01; *p < 0,1; n.s not significant.
5.3.Structural model
Based on the results of the structural model analysis to test the hypotheses (Fig. 4), of the 11 hypotheses that were proven to be accepted, only 5 hypotheses were accepted. The hypotheses that were proven to be accepted were H1 (HIC → SQ), H3 (SQ → SF), H5 (SF → TR), H7 (TR → HIS), and H10 (TR → LY). The R2 value indicates the level of importance of the endogenous construct. Based on Table 4, Service Quality is included in the important category (>0.75), while Satisfaction, Trust, Health Information Seeking-Intention, and Loyalty are included in the moderate category (0.5 to 0.75). The f2 value indicates the level of influence of the exogenous construct on the endogenous construct. Based on Table 4, the value of f2 on HIC → SQ, SQ → SF, SF → TR, TR → HIS, and TR → LY has a large effect (>0.35), and the relationship TR → HIS has a moderate effect (<0.15).
Fig. 4.
Hypothesis result.
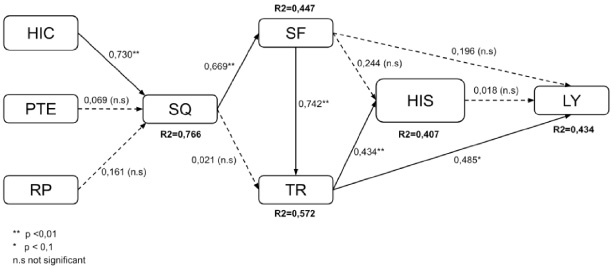
Table 4
Hypothesis result
| Hypothesis | Path | Standardized path coefficient | t-value | R2 | f2 | Result |
| H1 | HIC → SQ | 0,730** | 4,155 | 0,766 | 1,376 | Supported |
| H2 | PTE → SQ | 0,069 (n.s) | 0,507 | 0,010 | Not supported | |
| H3 | SQ → SF | 0,669** | 4,211 | 0,447 | 0,810 | Supported |
| H4 | SQ → TR | 0,021 (n.s) | 0,208 | 0,572 | 0,001 | Not supported |
| H5 | SF → TR | 0,742** | 7,548 | 0,711 | Supported | |
| H6 | SF → HIS | 0,244 (n.s) | 1,857 | 0,407 | 0,043 | Not supported |
| H7 | TR → HIS | 0,434** | 3,438 | 0,136 | Supported | |
| H8 | HIS → LY | 0,018 (n.s) | 0,130 | 0,434 | 0,000 | Not supported |
| H9 | SF → LY | 0,196 (n.s) | 1,075 | 0,028 | Not Supported | |
| H10 | TR → LY | 0,485* | 2,556 | 0,157 | Supported | |
| H11 | RP → SQ | 0,161 (n.s) | 1,222 | 0,058 | Not supported |
[i] **p < 0,01; *p < 0,1; n.s not significant.
5.4.Discussion
This research aims to find out what factors affect user loyalty, and how the relationship between these factors can affect loyalty. These factors are then used as the basis for developing the features of the Corona website, which was originally a source of information during the COVID-19 pandemic, into a website that provides information that is more relevant to the current situation of Jakarta. This is intended so that website users can continue to maintain their loyalty in accessing information provided by the government.
Based on the results in Hypothesis 1, Health Information Credibility is proven to have a significant positive effect on Service Quality. This shows that users who have a perception of the credibility of good health information on the Corona website will feel that the quality of website services is also good. The same results were also obtained from Li and Shang [20] that information quality is the strongest factor affecting service quality compared to other quality factors.
The results of Hypothesis 3 show that Service Quality is proven to have a significant positive effect on Satisfaction. The results of this study are similar to Jeon and Jeong [11] that website service quality affects customer satisfaction. This shows that service quality as a cognitive stage affects satisfaction as an affective stage. Then Satisfaction is proven to have a significant positive effect on Trust, so Hypothesis 4 is accepted. The results of this study are similar to Lee et al. [26] and Seduram et al. [15] that higher customer satisfaction on mobile devices leads to higher customer trust.
The results in Hypothesis 7 show that Trust is proven to have a significant positive effect on Health Information Seeking-Intention. This result is consistent with Riaz and Wang’s [12] research that trusts in government social media increases users’ intention to seek health information. Trust is also proven to have a significant positive effect on Loyalty; thus Hypothesis 10 is also accepted. The results of this study are similar to Lee et al. [26], the higher the customer’s trust in mobile devices, the higher the loyalty.
On the other hand, several hypotheses were rejected, such as Hypothesis 2 (Perceived Time/Effort Cost → Service Quality), Hypothesis 4 (Service Quality → Trust), Hypothesis 6 (Satisfaction → Health Information Seeking-Intention), Hypothesis 8 (Health Information Seeking-Intention → Loyalty), Hypothesis 9 (Satisfaction → Loyalty) and Hypothesis 11 (Reputation → Service Quality). Perceived Time/Effort Costs are proven not to affect service quality due to the demographics of users which are workers with productive ages, therefore users need a website that is mobile-friendly, has a simple visual design, and can be accessed in a short time. However, the Corona website has been made only optimally accessed via laptop/PC, making it difficult for users to use the website properly. Furthermore, reputation is proven not to affect the quality of Corona’s website services. This shows that users do not feel that the reputation of the organization, in this case, the Jakarta Provincial Government, affects the quality of service on the website. In addition, there is no relationship between satisfaction - intention to seek health information - loyalty and the relationship between intention to seek health information and loyalty. This is not similar to the Four-Stage Loyalty theory, where satisfaction at the affective stage affects behavioral intentions at the conative stage, and behavioral intentions affect loyalty at the action stage. This shows that users who have the intention to seek health information do not necessarily have high loyalty to the Corona website.
6.Implications, limitations, and future research
6.1.Implications
This study offers several theoretical and practical implications. First, this study focuses on government communication strategies in health information and services related to COVID-19 through the four stages of loyalty. Based on the research findings, it can be concluded that health information credibility is an important initial factor in the cognitive stage when users are building their experience with the Corona website. Higher health information credibility leads to higher perceived service quality. Service quality, as the subsequent cognitive stage, then influences satisfaction in the affective stage. Users who are satisfied with the Corona website will develop a strong trust in the website. Users who have established trust are more likely to seek health information and exhibit strong loyalty. This aligns with the findings of previous studies by Flavian, et al. [39] and Lee, et al. [26], which indicate that the mechanism of loyalty consists of the stages of usability perception, satisfaction, trust, and loyalty.
Second, the distinction between loyalty stages in commercial services or products and those provided by the government. In the case of the Corona website, user loyalty is highly dependent on trust in the website. The Jakarta Provincial Government can enhance user loyalty by improving trust and the credibility of information on the Corona website. High-quality information indirectly increases trust through the mediating variables of service quality and satisfaction.
Third, based on the research findings, the health information credibility highly influences users to build loyalty to the Corona Website. Furthermore, the quality of services and information can be enhanced by adjusting the content to focus on vaccination and providing information such as activity guidelines, travel guidelines, and healthcare services other than COVID-19. In addition, the website design should be made more mobile-friendly. To enhance user comfort, interactive features like chatbots can be implemented, and new menu sections related to the “New Normal” theme and information about the transition period and activity guidelines can be added.
Fourth, this research evaluates the quality of health information websites which is built on the Four-Stage Loyalty model and website reputation [11], the Communicative Ecology Theory on government media as a source of COVID-19 information [12], and the visual complexity model on electronic devices [13]. This study contributes to the evaluation of health communication theory, which also takes into account new technologies such as the internet and websites, which can influence people’s health behavior [40–42]. Apart from that, this research also considers user perceptions of using technology. The success of creating websites with health-related information can be determined by using research that emphasizes user-centered design [43].
Finally, this research is an evaluation of health communication carried out using quantitative methods with a systematic framework approach. According to Neuhauser and Kreps [41], the dimensions tested in an evaluation must be able to contribute to previous research, by including a literature review, research framework, comprehensive discussion of research methods, and limitations and discussion of the evaluation’s contribution to the context of the literature studied. In addition, quantitative methods have challenges such as collecting sample sizes and types of questions that are less in-depth, because they are limited to a Likert scale. Furthermore, this research adds perspective regarding health communication strategies in terms of user perceptions of technology using quantitative methods.
6.2.Limitations and future research
The limitations of this research are explained further. First, it only focuses on the experience of users of the Corona Website in Jakarta retrospectively, with a sample size that needs to be increased to generalize to the people of Jakarta or Indonesia. Furthermore, this study has not compared user experiences when accessing the Corona website on PCs and mobile devices. This study examines the general user experience of the Corona website in Jakarta. The information obtained from this study aims to develop communication strategies and health information distribution relevant to the development of the COVID-19 situation in Jakarta.
Second, this research has yet to discuss the quality of information on websites, such as the readability of information and in-depth analysis of user perceptions in utilizing the health information provided. Apart from that, this research has yet to discuss the impact of the Corona website on public health awareness, search for health information and shared knowledge regarding health, especially COVID-19. This research examines the factors that influence the loyalty of users of the Corona website as a government communication strategy in the health sector. Based on these limitations, this research can be a preliminary study for a more in-depth evaluation regarding improving the quality of information on the Corona website. This evaluation aims to increase public loyalty and strengthen communication strategies that the government can implement.
Further research can discuss the following matters. First, several variables can be integrated into further model development, such as ease of readability of information and analysis of user patterns in utilizing health information presented by the government. Second, the product of websites based on public health literacy can be covered in more detail in future research. This is important because a website is one of the platforms the public uses to get reliable information. Research on raising health literacy and organizing health information to meet the requirements of the community better is therefore required. In addition, further research may incorporate technical elements about the electronic gadgets utilized for information retrieval to ascertain their impact on user conduct.
7.Conclusions
The Corona website is one form of implementation of Jakarta’s policies that are responsive to the issue of COVID-19. The Corona website is also a forum that promotes health information through infographics, articles, and data that is easy to understand. Information such as COVID-19 case data, isolation and healing, and vaccinations are available in one portal. Therefore, the development of the Corona website needs to remain relevant by paying attention to what factors make people loyal in meeting health literacy needs, especially those related to COVID-19. Factors that influence community loyalty are perception, trust, and information quality. To form this loyalty, the mechanism starts from the perception of the credibility of good health information that improves service quality, and then good service quality increases user satisfaction. Then, users who feel satisfied with the Corona website will form a good sense of trust, increasing their intention to seek health information and loyalty. In this study, reputation is proven not to affect service quality, service quality is proven not to involve trust and satisfaction, trust, and intention to seek health information are proven not to affect loyalty, so the factor that directly affects loyalty is trust. The results of this study can be the basis for developing the Corona website by adjusting the information content to be more relevant to the current situation in Jakarta and more mobile-friendly to be easily accessed by the public.
References
[1] | World Health Organization (WHO). Statement on the fifteenth meeting of the IHR (2005) Emergency Committee on the COVID-19 pandemic, 2022 [date accessed 11 May 2023], https://www.who.int/news/item/05-05-2023-statement-on-the-fifteenth-meeting-of-the-international-health-regulations-(2005)-emergency-committee-regarding-the-coronavirus-disease-(covid-19)-pandemic?adgroupsurvey=%7Badgroupsurvey%7D&gclid=CjwKCAjwge2iBhBBEiw. |
[2] | Jakarta Tanggap COVID-19. Jakarta Tanggap COVID-19, 2020. Retrieved May 11, 2023, from https://corona.jakarta.go.id/id/. |
[3] | Presidential Regulation (PERPRES) Number 95 of 2018 concerning Electronic-Based Government Systems. |
[4] | J. Budd, B.S. Miller, E.M. Manning , Digital technologies in the public-health response to COVID-19, Nat Med 26: : ((2020) ), 1183–1192. |
[5] | World Bank. How does digital technology help in the fight against COVID-19? 2020 [date accessed: 6 June 2023] https://blogs.worldbank.org/developmenttalk/how-does-digital-technology-help-fight-against-covid-19. |
[6] | B.A. Cumbie and B. Kar, A study of local government website inclusiveness: The gap between e-government concept and practice, Information Technology for Development 22: (1) ((2016) ), 15–35. |
[7] | A. Jameel, M. Asif and A. Hussain, Good governance and public trust: Assessing the mediating effect of E-government in Pakistan, Lex Localis 17: (2) ((2019) ), 299–320. |
[8] | N. Butt, N.F. Warraich and M. Tahira, Development level of electronic government services: An empirical study of e-government websites in Pakistan, Global Knowledge, Memory and Communication 68: (1/2) ((2019) ), 33–46. |
[9] | M.G. Chon, Government public relations when trouble hits: Exploring political dispositions, situational variables, and government–public relationships to predict communicative action of publics, Asian Journal of Communication 29: (5) ((2019) ), 424–440. |
[10] | M. Kim and M. Cho, Examining the role of sense of community: Linking local government public relationships and community-building, Public Relations Review 45: (2) ((2019) ), 297–306. |
[11] | M.M. Jeon and M. Jeong, Customers’ perceived website service quality and its effects on e-loyalty, International Journal of Contemporary Hospitality Management 29: (1) ((2017) ). |
[12] | M. Riaz, X.S. Wang and Y. Guo, An empirical investigation of precursors influencing social media health information behaviors and personal healthcare habits during coronavirus (COVID-19) pandemic, Information Discovery and Delivery 49: (3) ((2021) ), 225–239. |
[13] | S. Sohn, B. Seegebarth and M. Moritz, The impact of perceived visual complexity of mobile online shops on user’s satisfaction, Psychology and Marketing 34: (2) ((2017) ), 195–214. |
[14] | R.L. Oliver, Whence consumer loyalty? Journal of Marketing 63: : ((1999) ), 33–34. |
[15] | L. Seduram, A. Al-Mamun, A.A. Salameh, S. Perumal and H. Shaari, Predicting smartphone brand loyalty using four-stage loyalty model, Sage Open ((2022) ), 1–15. |
[16] | H. Han, Y. Kim and E.K. Kim, Cognitive, affective, conative, and action loyalty: Testing the impact of inertia, International Journal of Hospitality Management 30: (4) ((2011) ), 1008–1019. |
[17] | Y. Li, X. Wang, X. Lin and M. Hajli, Seeking and sharing health information on social media: A net valence model and cross-cultural comparison, Technological Forecasting and Social Change 126: : ((2018) ), 28–40. |
[18] | S. Harper, E. Michailidou and R. Stevens, Toward a definition of visual complexity as an implicit measure of cognitive load, ACM Transactions on Applied Perception 6: : ((2009) ), 1–18. |
[19] | Muhammad Aljukhadar, Jean-François Belisle, Danilo C. Dantas, Sylvain Sénécal and Ryad Titah, Measuring the service quality of governmental sites: Development and validation of the e-Government service quality (EGSQUAL) scale, Electronic Commerce Research and Applications 9. 55: : ((2022) ), 101182–101182. doi:10.1016/j.elerap.2022.101182. |
[20] | Y. Li and H. Shang, Service quality, perceived value, and citizens’ continuous-use intention regarding e-government: Empirical evidence from China, Information \& Management 57: (3) ((2020) ), 0378-7206. |
[21] | H.H. Chang and S.W. Chen, Consumer perception of interface quality, security, and loyalty in electronic commerce, Information and Management 46: (7) ((2007) ), 411–417. |
[22] | A. Parasuraman, V. Zeithaml and L. Berry, SERVQUAL: A multiple-item scale for measuring consumer perceptions of service quality, Journal of Retailing 64: (1) ((1988) ), 12–40. |
[23] | Z. Yang, S. Cai, Z. Zhou and N. Zhou, Development and validation of an instrument to measure user perceived service quality of information presenting web portals, Information and Management 42: (4) ((2005) ), 575–589. |
[24] | L.C. Harris and M.M.H. Goode, The four levels of loyalty and the pivotal role of trust: A study of online service dynamics, Journal of Retailing 80: : ((2004) ), 139–158. |
[25] | R.C. Mayer, J.H. Davis and F.D. Schoorman, An integrative model of organizational trust, The Academy of Management Review 20: (3) ((1995) ), 709–734. |
[26] | D. Lee, J. Moon, Y.J. Kim and M.Y. Yi, Antecedents and consequences of mobile phone usability: Linking simplicity and interactivity to satisfaction, trust, and brand loyalty, Information & Management 52: (2015) ((2015) ), 295–304. |
[27] | A. Hooda, P. Gupta, A. Jeyaraj, M. Giannakis and Y.K. Dwivedi, The effects of trust on behavioral intention and use behavior within e-government contexts, International Journal of Information Management 67: ((2022) ). |
[28] | C. Huo, M. Zhang and F. Ma, Factors influencing people’s health knowledge adoption in social media, Library Hi Tech 36: (1) ((2018) ), 129–151. |
[29] | D.B. Friedman, A. Gibson, W. Torres, J. Irizarry, J. Rodriguez, W. Tang , Increasing community awareness about Alzheimer’s disease in Puerto Rico through coffee shop education and social media, Journal of Community Health 41: (5) ((2016) ), 1006–1012. |
[30] | R.E. Anderson and S.S. Srinivasan, E-satisfaction and e-loyalty: A contigency framework, Psychol Mark 20: : ((2003) ), 123–138. |
[31] | K.J. Stewart, Trust transfer on the World Wide Web, Organization Science 14: (1) ((2003) ), 5–17. |
[32] | P. Lynch, R. Kent and S.S. Srinivasan, The global internet shopper: Evidence from shopping tasks in twelve countries, Journal of Advertising Research 41: (3) ((2001) ), 15–23. |
[33] | F.F. Reichheld and P. Schefter, E-loyalty: Your secret weapon on the Web, Harvard Business Review 78: : ((2000) ), 105–113. |
[34] | M. Hsu, C. Chang, K. Chu and Y. Lee, Determinants of repurchase intention in online group buying: The perspectives of DeLone & McLean IS success model and trust, Computers in Human Behavior 36: : ((2014) ), 234–245. |
[35] | Y. Sullivan and D. Kim, Assessing the effects of consumers’ product evaluations and trust on repurchase intention in e-commerce environments, International Journal of Information Management 39: : ((2018) ), 199–219. |
[36] | S. Kim and H. Park, Effects of various characteristics of social commerce (s-commerce) on consumers’ trust and trust performance, International Journal of Information Management 33: : ((2013) ), 318–332. |
[37] | C. Liao, P. Palvia and H.-N. Lin, The roles of habit and web site quality in e-commerce, International Journal of Information Management 26: : ((2006) ), 469–483. |
[38] | J.F. Hair, G.T.M. Hult, C. Ringle and M. dan Sarstedt, A Primer on Partial Least Squares Structural Equation Modeling (PLS-SEM). SAGE Publications, California, (2014) . |
[39] | C. Flavian, M. Guinaliu and R. Gurrea, The role played by perceived usability, satisfaction and consumer trust on website loyalty, Inf Manag 43: : ((2006) ), 1–14. |
[40] | N.G. Harrington, P.C. Palmgreen and L. Donohew, Programmatic research to increase the effectiveness of health communication campaigns, Journal of Health Communication 19: : ((2014) ), 1472–1480. |
[41] | L. Neuhauser and G.L. Kreps, Integrating design science theory and methods to improve the development and evaluation of health communication programs, Journal of Health Communication 19: : ((2014) ), 1460–1471. |
[42] | R.A. Logan and G.L. Kreps, The NLM evaluation lecture series: Introduction to the special section on evaluating health communication programs, Journal of Health Communication 19: (12) ((2014) ), 1440–1448, doi:10.1080/10810730.2014.954079. |
[43] | B.W. Hesse, A. Gaysynsky, A. Ottenbacher, R.P. Moser, K.D. Blake, W.-Y.S. Chou , Meeting the Healthy People 2020 goals: Using the Health Information National Trends Survey to monitor progress on health communication objectives, Journal of Health Communication 19: : ((2014) ), 1497–1509. |


