
Next generation Open Access analytics: A case study
Abstract
A critical component in the development of sustainable funding models for Open Access (OA) is the ability to communicate impact in ways that are meaningful to a diverse range of internal and external stakeholders, including institutional partners, funders, and authors. While traditional paywall publishers can take advantage of industry standard COUNTER reports to communicate usage to subscribing libraries, no similar standard exists for OA content. Instead, many organizations are stuck with proxy metrics like sessions and page views that struggle to discriminate between robotic access and genuine engagement.
This paper presents the results of an innovative project that builds on existing COUNTER metrics to develop more flexible reporting. Reporting goals include surfacing third party engagement with OA content, the use of graphical report formats to improve accessibility, the ability to assemble custom data dashboards, and configurations that support the variant needs of diverse stakeholders. We’ll be sharing our understanding of who the stakeholders are, their differing needs for analytics, feedback on the reports shared, lessons learned, and areas for future research in this evolving area.
1.The current environment
1.1.An era of experimentation
We characterize the current environment as an era of experimentation in relation to OA analytics, perhaps similar to pay-walled analytics before the adoption of COUNTER standards.
We’re seeing innovative new business models developing in addition to the traditional models of funding Gold OA with an Article Processing Charge1. For example, Subscribe to Open or the Public Library of Science’s (PLOS) Community Action Publishing model2.
In turn, this is generating a variety of different goals for usage analytics, ranging from simply counting usage of a particular business model, to identifying organizations that have accessed that content all the way through to granular analysis of topics/subjects to support editorial development.
Organizations are using a variety of metrics to support this activity. Those relying on generic analytical tools like Google and Adobe Analytics will be getting very generic metrics like sessions, page hits, and downloads. Some are using COUNTER metrics. And some are crafting home-brew solutions.
There is a proliferation of stakeholders interested in analytics far beyond the library. And there is a lot of money at stake. Much of that money is currently sunk into traditional pay-walled models, and OA analytics are a crucial tool in informing negotiations on all sides. And another large chunk is sitting with funders who have influence on where the research they fund gets published.
1.2.What about COUNTER Reports?
COUNTER Reports could seem to be an obvious answer to this problem, but they don’t really work here because they’re engineered for a very specific use case - to help a librarian understand and compare usage of paid content in order to make informed decisions on acquiring content to meet their library’s learning and research goals.
This COUNTER use case rightly focuses on the aggregate numbers, and prioritizes scalability over usability because, in most situations, these usage numbers will be further aggregated and analyzed using software that can automate bulk ingestion via SUSHI feeds.
However, this does not mean that COUNTER has no role to play. Far from it, because “metrics are the gold nugget at the heart of COUNTER3”. Think of COUNTER metrics as a defined set of Lego bricks that we can re-combine to create new, valuable analytics reporting.
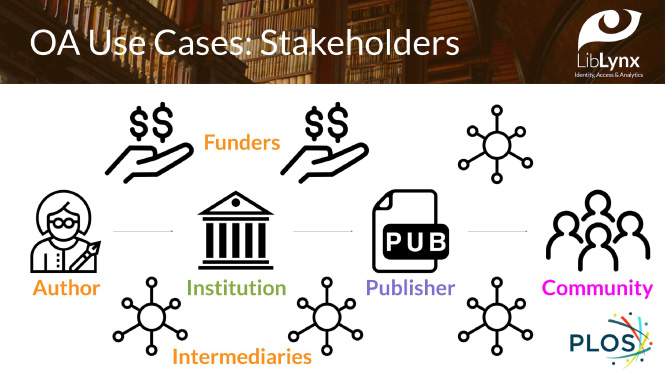
Fig. 1.
Open Access stakeholders.
2.Open Access use cases
2.1.Stakeholders
First, let us recap the stakeholders involved in the OA publishing workflow (Fig. 1):
Research institutions that are typically generating the research that is published.
Publishers that publish OA content. These can be the same research institutions or dedicated publishing organizations such as PLOS.
Authors of that research.
The broader community that is interested in reading that research.
Funders that pay for the research to be published. These can be institutional budgets or separate entities, such as Wellcome or the Gates Foundation.
Various intermediaries performing a variety of functions that support the publishing workflow.
2.2.Roles
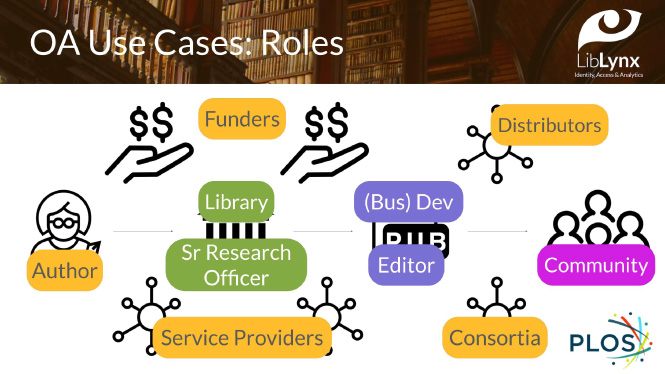
Next, let us walk through some of the roles within this pool of stakeholders that need some form of OA analytics (Fig. 2).
Most obviously, we have the traditional library role, which sits at the core of the COUNTER Reporting use case. Librarians are already tracking usage of OA content as part of licensed collections. Those that also play a role in pure OA publishing will be equally interested in monitoring that usage.
We also have institutional roles that sit outside of the library and are focused on research management, such as the Senior Research Officer. If you haven’t already read Roger Schonfeld’s fascinating Scholarly Kitchen post about this role4, we heartily recommend it. This role is going to be more interested in understanding how usage of OA content ties into the institutional research priorities.
On the publisher side, we have development roles that need to understand which organizations are getting value from OA content in order to identify potential future sources of funding. When the publisher is a commercial entity, it is more of a Business Development role. Publishers also have editorial roles that want to understand the subjects and topics that are engaging the community.
Authors want to understand the impact of the research that they publish. In some cases, this information can influence their choice of publisher.
Similarly, funders want to understand the impact of the research that they have funded. Did it reach the communities they were targeting, or perhaps it was also engaged by new communities of which they were previously unaware?
We also have various flavors of intermediaries, such as service providers such as Knowledge Unlatched (KU)5, consortia such as Jisc6, and distributors such as JSTOR7.
Last, but not least, the community itself has an interest in OA analytics. This is particularly important for publicly-funded organizations such as state colleges who need evidence that OA content is reaching the broader community.
Fig. 2.
Open Access use cases and the roles associated with them.
2.3.Metadata
We are seeing a clear need for a broader range of metadata to enhance the traditional COUNTER metrics of searches, investigations and requests.
One is metadata on the audience for OA content. What type of audience is engaging with content; is it identifiable organizations or unaffiliated usage? Geographically, from what region is usage coming. From what categories of organization, such as government bodies vs higher education vs corporate? And on what areas of specialty do those organizations focus, such as biomedical research vs cancer research.
A second example is metadata on the subject/topic of OA content. This would provide very interesting analytics back to Senior Research Officers, as well as to authors, funders, and editors involved in shaping future content priorities.
A third example would be metadata on the source of funding. It would be interesting to see the impact that funders have on OA content, or to do portfolio analysis on funding in terms of the communities impacted by making the content open.
2.4.Other reporting attributes
Finally, here’s a grab-bag of other attributes of reporting that we’re seeing in relation to OA use cases:
Granularity: i.e. which organizations accessed what OA content, when, and from where? (versus aggregated COUNTER Reports).
Style: in use cases where usability is valued more than scalability, it is not hard to imagine that visually-rich layouts that are made for easy consumption would be of interest.
Immediacy: while COUNTER Reports are monthly, there are OA use cases where having more real-time usage reporting would be of interest.
Format: as the number of use cases rises, so do the ways in which users want to consume analytics.
3.The next generation analytics project
3.1.Introduction
The next generation analytics project is a partnership between PLOS and LibLynx to explore this developing area.
The project has three goals:
To understand stakeholder needs from OA Analytics. We’re in the process of soliciting feedback from a range of internal and external stakeholders in the PLOS community, and some of that feedback is already reflected in our analysis of use cases.
To provide COUNTER Reports to meet the community’s immediate need to better understand the impact of OA content published with PLOS.
To develop next-generation analytics that can meet the needs of the more diverse use cases that we are seeing in the OA environment.
3.2.OA counter reports
Goal 2 is to provide COUNTER Reports to meet the needs of PLOS’ stakeholders. These COUNTER reports look exactly the same as a normal COUNTER Report - the only difference under the hood is that we are attributing usage to organizations based on matching their IP address to the data in the IP Registry, rather than as a result of controlled access to pay-walled content.
The example Item Master report below (Fig. 3) shows COUNTER investigations attributed in the month of December to IP addresses associated with Stanford University. It lists seven hundred and eighty-three PLOS OA articles that were investigated during that period.
Fig. 3.
Example OA Counter Report for Stanford University.
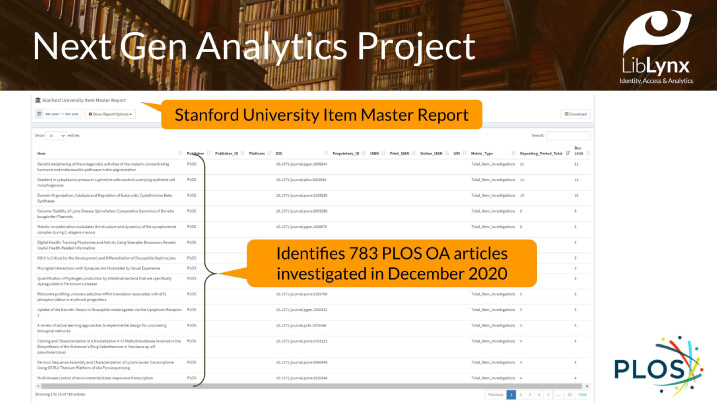
These reports will be going live to PLOS customers in early March 2021.
3.3.Next Gen Analytics Prototypes
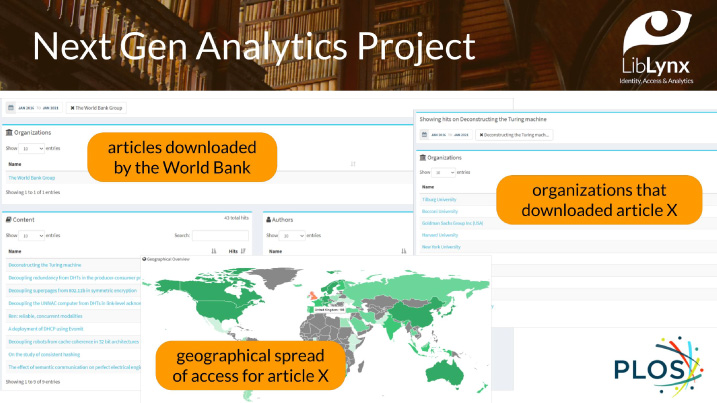
We have also been working on prototypes for more interactive analytics that could meet these broader use cases (Fig. 4). They would provide access to real-time, granular data with interfaces that would facilitate enquiry and support a broader range of metrics and related metadata.
The first example is a report enabling a user to pick an organization associated with a usage and drill down to the articles and authors with whom users from that organization engaged.
Example two flips that around to pick an article and drill down to a list of organizations that accessed that content.
Example three shows the geographical spread of access for a particular article.
In all cases, you can interrogate the analytics with multiple dimensions, such as show me all the usage of an article from governmental organizations in Spain.
Fig. 4.
Examples of prototype interfaces for Next Gen Analytics.
4.Feedback, Thoughts?
If you’re interested in learning more about the Next Gen Analytics project or have feedback for us, please contact either Tim Lloyd ([email protected]) or Sara Rouhi ([email protected]).
About the authors
Tim Lloyd is the CEO of LibLynx, a company that provides cloud-based solutions to publishers, service providers and libraries to help them manage identity and access to online resources, and to better understand usage of those resources. He is also a member of the governance and outreach committees for the Coalition for Seamless Access and Project COUNTER’s Open Access/Unpaywalled sub-group, and has decades of experience in a variety of product development and operational roles in publishing. E-mail: [email protected]; Phone: 202-888-3324 (Liblynx offices).
Sara Rouhi is the Director of Strategic Partnerships at PLOS focusing on developing new business models for sustainable, inclusive Open Access publishing. In 2020 she launched PLOS first collective action business model for highly selective publishing, PLOS Community Action Publishing, and has solicited more than fifty partners from around the globe, including consortia such as the Big Ten Academic Alliance, Jisc, and CRKN. Her partnerships work focuses on collaborating with mission-aligned organizations to further PLOS’ open science mission. Before coming to PLOS in 2019, Sara managed business development at Digital Science for both the Altmetric and Dimensions platforms. She was the recipient of the SSP’s Emerging Leader award in 2015 and writes and speaks frequently on Open Access and diversity in scholarly communications. She is also a comedian and improviser in Washington DC and tweets all things politics, open science, improv, and #scholcomm on Twitter @RouhiRoo. E-mail: [email protected].
Notes
1 “Article Processing Charge,” Wikipedia, see: https://en/wikipedia.org/wiki/article_processing_charge, accessed July 11, 2021.
2 See: https://plos.org/resources/community-action-publishing, accessed July 11, 2021.
3 Quote from Jeremy Morse, Director of Publishing Technology, Michigan Publishing.
4 Schonfeld, R.C., “The Senior Research Officer and the Academic Research Enterprise,” The Scholarly Kitchen, December 18, 2020, available at: https://scholarlykitchen.sspnet.org/2020/12/18/senior-research-officer-academic-research-enterprise/, accessed July 11, 2021.
5 See: https://knowledgeunlatched.org, accessed July 11, 2021.
6 Formerly the Joint Information Systems Committee, see: https://www.jisc.ac.uk, accessed July 11, 2021.
7 See: https://www.jstor.org, accessed July 11. 2021.


