
A citizen-centric approach to understand the effectiveness of e-government web portals: Empirical evidence from India
Abstract
A citizen-centric approach was used to understand the effectiveness of e-government web portals in India. So, the study aims to find the factors of e-government (i.e., information clarity and appropriateness, relevance & usefulness, information accuracy & completeness, system security, users’ privacy, system stability, and interactive services) and their influence on citizen perception, citizen satisfaction, and users’ intention. Since the e-government web portal is for the citizen of a country and random sampling is more appropriate. So, our study did the same with a modified scale. The confirmatory factor analysis (CFA) model was applied to show model fit and multiple regression analysis was employed to analyze the final data. The results revealed that the factors of e-government positively impact quality perception, citizen satisfaction, and Users’ intention toward e-government. Further, data analysis has enough evidence to say e-government quality perception and citizen satisfaction mediate the relationship between factors of e-government and Users’ intention. This investigation outlines how the government designs its e-government portal to enhance citizen satisfaction, citizen perception in terms of e-government quality, and users’ intentions.
1.Introduction
Usage of Information and Communication Technologies (ICT) (Kumar et al., 2017a) has been path towards the improvement of the democratic system of a nation as well as increasing the participation of people in the various decision-making processes (Sharma et a., 2021). E-government is such an ICT-enabled initiative embraced by governments worldwide. It includes delivering or allowing a broad range of online services to citizens to access online services, access government information and services, and decision-making processes related to government (Fan & Yang, 2015). E-government espouses greater population participation in the decision-making process and guarantees public control over the government’s actions. This process broadly includes government web portals, an electronic medium of government, business-related aspects of governance, sending and receiving complaints, giving suggestions for shared or public resources, digital inclusion, and citizens’ participation and interaction.
The efficiency of e-Government websites is pivotal for the success of e-government projects in India. The benefits of using the e-Government websites are two-way for citizens and government (Agrawal et al., 2007). Citizens prefer using those online services with greater efficiency, high quality, and tasks that can be completed quickly. Various governments’ higher quality of online portals ensures higher acceptance and this process broadly includes using a low level of fear among citizens. On the other hand, it helps the government reduce operations and management costs. The operation and management cost center Behavior to percent reduced to India the increase in the number of citizens using the government websites. This has a direct implication for various e-government initiatives by governments worldwide. Some of the e-Government websites in India responsible for formulating developmental policies aimed at accelerating the growth are Digital India, PM India website, National Portal of India, and National Informatics Center.
Against this backdrop, there is a need to understand the perceptions of e-government users. As the government is considered a service provider, a higher quality and more efficient service will help generate a high level of users’ acceptance, usage, intention, and satisfaction with the e-government web portal (Yoo & Donthu, 2001; Loiacono et al., 2000). This study will explore the components affecting the adoption and usage of e-Government websites by critically investigating the citizens based on their experience with various e-Government websites (Fan & Yang, 2015). The factors explored are based on the information provided, the effectiveness of the e-government web portals, and system quality aspects. Other factors include accuracy, relevancy, and completeness. This will provide a clear picture of those quality aspects of these portals affect their use and users’ satisfaction with them. This study will also investigate any hurdles affecting the adoption or usage of e-Government websites that have tried or never used e-Government websites.
The efficiency of e-Government online portals in India is investigated using a citizen-centric approach in this study. The examination aims to discover users’ impressions of the attributes and determine the quality of e-gov Services. The study’s primary goal is to understand better and investigate the quality of e-gov Services from users’ perspectives. Moreover, the study also aims to find the linkage between e-Government service quality and other factors such as customer satisfaction and user intention. At this level, the finding of significant e-government factors develops the influence of other attributes which determine the quality of the e-government web portals. In this way, the work proposes to measure the effectiveness of the current e-Government web portals in India using two different methods. The methods are related to time and effort. The first method, the time method used, is about the number of successful tasks taken up by the users completed in less time. The second method is the effort method. It is the number of successful tasks per unit of time taken online. The attributes are also added to broader accessibility, security, privacy, information reach, truth and precision, service readiness and transparency.
Attributes, a questionnaire is adopted and modified for the empirical survey. The outcome of the experiment conducted for the study will measure the effectiveness of e-Government web portals through a citizen-centric approach in India. The results are expected to show an urgent need to improve the usability, effectiveness, acceptance, satisfaction, reliability, and transparency among the citizen users. Thus, the research questions of this study are as follows, based on the preceding explanation:
RQ1: What are the various factors of e-government? RQ2: How do the various factors of e-government influence quality perception, customer satisfaction, and users’ intentions? RQ3: What are the mediating roles of service quality factors and the User’s intention toward the e-government portal?
The following are the research objectives:
(a) To identify e-Government service quality issues from users’ perspectives.
(b) To identify the service quality of the e-government web portal and its influence on building citizen perception and User satisfaction.
(c) To analyze the effect of web portals’ overall quality of services on the adoption of government portals.
(d) To assess the mediating role of perception and citizen satisfaction in the relationship between service quality factors and User’s intention toward e-government portal.
Furthermore, the empirical studies investigated the influence of e-government on the quality perception, citizen satisfaction, and users’ intention with their mediation roles. Interestingly there is no study available in the perspective of the effect of factors of e-government on these variables.
2.Literature review and theoretical support
2.1e-Government web portal
The rapid development of ICT has considerably aided the growth of e-gov Services worldwide (Sigwejo & Pather, 2016). Government websites are generally used to gather information, connect with residents, and conduct online commercial transactions (Butt et al., 2019). In the same way, a web portal is the usual e-Government initiative implementation platform, enabling access to the government and its services (Goh et al., 2008). However, using an e-Government web portal differs from using other web portals i.e., e-commerce and e-learning apps regarding user goals and requirements (Jiang & Ji, 2014). To put it another way, e-Government, as defined by the World Bank (World Bank, 2005), is the use of information technology by government bodies to change interactions with individuals, and corporations (Hirwade, 2010). Government services respond to changes in the broader economy and society through an e-government web portal (Howard, 2001). However, e-government has created new opportunities along with challenges for public administration (Parycek & Pircher, 2003). Consequently, e-government acceptance is affected by various factors such as demographic factors and trust factors towards e-Government like internet experience, ICT infrastructure, e-readiness, and quality of service (Butt et al., 2019).
Internet and communication technologies (ICTs) support government websites or e-government web portals, and these technologies (ICTs) enable individuals to be better educated about government policies and services in a user-friendly environment (Bournaris, 2020). It is also utilized to re-design and alter relationships between governments and its other government bodies (G2G), government to businesses (G2B), and governments and citizens (G2C) at various levels (Behzadi et al., 2012). Nonetheless, while there have been several advances, the stage of e-Government is still considered in infancy. Also, mainly e-Government adoption existed in local governments, primarily municipal governments (Huang, 2007). As a result of the rapid development of the internet and its complementary technology, government projects in countries have begun (Butt et al., 2019). The quality of the web portal can be measured by the system, information, and service quality (Ziemba et al., 2014; Parasuraman et al., 1985).
2.2Citizens-centric approach
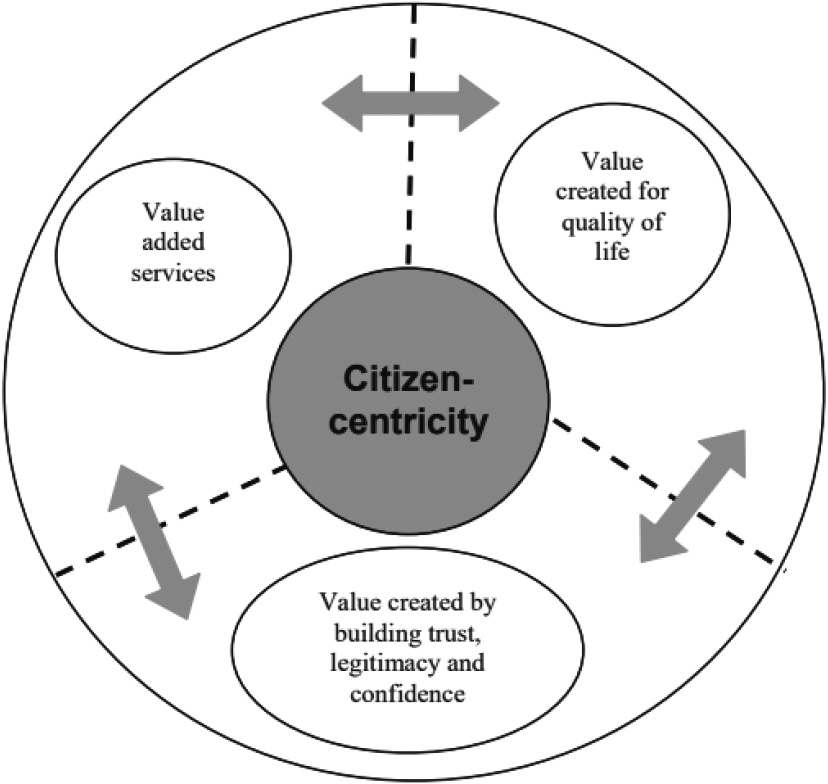
A citizen-centric strategy should encourage citizens to use the citizen portal to access e-services. A citizen-centric approach is emerging that places individuals at the center and provides them with a single edge to access all (subset of) public services (Sigwejo & Pather, 2016). A citizen centric approach mainly concerns the needs of the citizens or develops products and services with the orientation of benefits to the citizens. Additionally, citizen centricity is all about creating value for citizens (Fig. 1). Citizen-centric methods for government transformation are at the forefront of public sector reform and are increasing worldwide. When governments offer services tailored to the needs of the individuals they serve, they may boost public satisfaction while lowering costs. Citizens today expect the government to provide more transparent, accessible, and responsive services. Most governments place a high value on their citizens’ happiness with e-gov Services (Eggers & Bellman, 2015). Additionally, according to Yildirim and Bostanci (2021), the most recent trend in e-government portal design is toward citizen-user friendliness. The quality, usefulness, dependability, and security and privacy protection elements of web portals influence the usage of e-gov Services and, as a result, user adoption of e-government systems. The focus of e-government has evolved from a government-focused to a citizen-centered paradigm, according to Sorn-In et al. (2015), with the citizen having a vital part in the service and has been embraced by various nations i.e., USA, England, Canada, Australia, South Korea, Italy, and Singapore (Sorn-In et al., 2015). Now, this concept is also evolving in India. However, in India, the e-government system is still in its early stages and is prone to failure owing to a lack of engagement from key stakeholders, namely rural populations (Misra, 2009). A Citizen-centric approach is critically important when e-gov Services are implemented. Lack of citizen-centricity is one of the critical obstacles to e-government (Alomari et al., 2012).
Figure 1.
Creating Value for Citizens (Source: Gupta (2008). Citizen-centric Approach for e-government).
The quality, usefulness, dependability, and security and privacy protection elements of web portals influence the usage of e-gov Services and, as a result, user adoption of e-government systems. Along with using an e-government service, various stakeholders such as citizens, information technology developers, government personnel, and policymakers are impacted by E-gov Services (Osman et al., 2014). The government’s investment in creating Web portals and delivering services is closely related to the efficacy of government Web sites in promoting dealings between the public and government entities (Wang et al., 2005). Population participation adaptability of e-gov Services depends upon various factors like human and non-human factors. According to Nandal and Singla (2019), people unwilling to embrace E-government services have poor education, are older, are less technologically adept, and work in white-collar professions. The adaptability of e-gov Services is determined by the quality of web portals and the customer’s intention to use that portal or if the consumer finds it helpful. The technology acceptance model is also applicable here for the acceptability of web portals, whether the websites are public or private (Mohammad et al., 2020). Governments have begun preparing to deliver e-services to their citizens (Sigwejo & Pather, 2016).
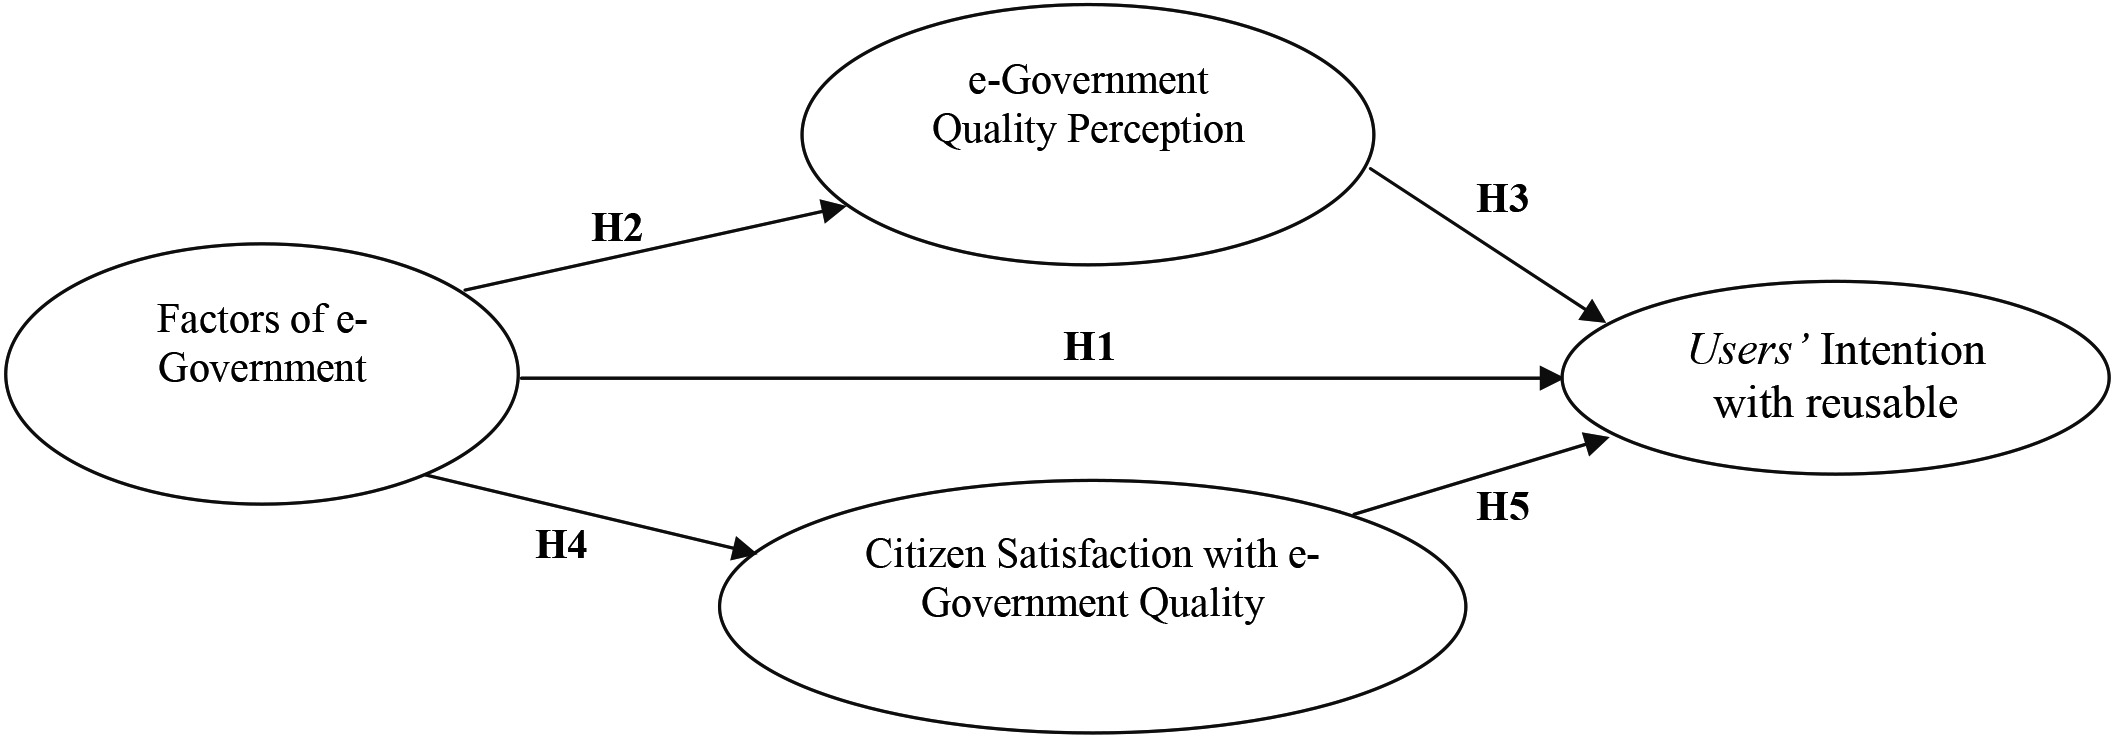
Thus, based on the above argument, the following hypotheses have been developed, and the proposed model of e-government factors to Users’ intention is framed in Fig. 2.
H1: Factors of e-government have a significant influence on the Users’ intention. H2: Factors of e-government have a significant influence on e-government Service Quality Perception (QP). H3: e-government Service Quality Perception (QP) significantly influences the Users’ Intention. H4: Factors of e-government have a significant influence on Citizens’ Satisfaction (CS) with e-gov Services. H5: Citizens’ Satisfaction with e-gov Services (CS) positively influences the Users’ Intention. H6: e-government Service Quality Perception (QP)) mediate the relationship between Factors of E-government and User’s intention. H7: Citizens’ Satisfaction with e-gov Services satisfaction (CS) mediates the relationship between Factors of e-government and Users’ intention.
Figure 2.
The Framework of e-government Factors to Users’ Intention (Proposed Model).
3.Research methodology
The current study is based on quantitative methods along with nonprobability sampling. In this investigation, first, primary data were collected from Indian citizens using an online survey question developed collected from May 2021 to July 2021. Citizens were requested to engage in the research process via email, and the questionnaire was posted on several social media sites such as LinkedIn, Research Gate, and Facebook, with potential respondents being directed to the website to complete the survey (Paliwal et al., 2022; Singh et al., 2022). There were three sections to the survey questionnaire. The first section consists of personal information-related questions. The second section of the questionnaire was related to the citizen visiting pattern of e-government web portals, and various factors influencing citizens to visit web portals. The third section of the questionnaire is the measurement variable related to citizens’ perception of service quality e-government portals-citizen satisfaction towards e-government portal and Users’ intention. Population participation required services, considerably affect the questions are based on a Likert scale of 1 to 5, with one denoting strongly disagree and five denoting strongly agree. The factors of e-government portal, perception of service quality of web portal, citizens’ satisfaction and Users’ intention were based on previous works of Loiacono et al. (2000), Yoo and Donthu (2001), Agrawal et al. (2007), Fan and Yang (2015) and the measurement variable were further modified and used for the survey.
4.Data analysis and results
Table 1 indicates the Demographic information of respondents using different e-government portals which explain the characteristics of respondents i.e., age, gender, Marital Status, Education level, Profession, and experience of using the e-govt portal.
Table 1
Demographic profile of respondents (
| Description | Frequency | Percentage | |
|---|---|---|---|
| Age | 20 Years and Below | 34 | 5.4 |
| 21–30 Years | 173 | 27.4 | |
| 31–40 Years | 221 | 35.0 | |
| 41–50 years | 86 | 13.6 | |
| 51–60 Years | 105 | 16.6 | |
| Above 60 Years | 12 | 1.9 | |
| Gender | Male | 350 | 55.5 |
| Female | 258 | 40.9 | |
| Transgender | 23 | 3.6 | |
| Marital status | Married | ||
| Unmarried | 471 | 74.6 | |
| Separated/ | 146 | 23.1 | |
| Divorced/ | 14 | 2.2 | |
| Widowed, etc. | |||
| Education level | Matric & below | 64 | 10.1 |
| Under-Graduate | 56 | 8.9 | |
| Graduate | 191 | 30.3 | |
| Post Graduate | 303 | 48.0 | |
| Technical degree/diploma | 17 | 2.7 | |
| Occupation/ | Student | 250 | 39.6 |
| Profession | Business | 125 | 19.8 |
| Service | 72 | 11.4 | |
| Professional | 184 | 29.2 | |
| Years of using | 0–2 Years | 65 | 10.3 |
| e-government | 2–5 years | 275 | 43.6 |
| portal | 5–10 Years | 139 | 22.0 |
| 10–15 years | 55 | 8.7 | |
| 15–20 years | 51 | 8.1 | |
| Above 20 years | 46 | 7.3 |
Information presented in Table 2 indicates the e-government portal uses a pattern by the respondents under investigation. Multiple responses were received and processed through SPSS software and indicate that the education portal is the most used e-government portal, as was indicated by 56–9% of respondents in the sample. Another 47.9%, 25.2%, 52.5%, 26.0%, 51.0%, 14.6%, 34.9%, 58.0%, 35.5%, 49.8%, 11.1%, 4.0%, 19.7% respondents respectively indicated Health, Passport, Employment, Culture, Sports, Airlines service, Rail/Transport Service, Hotel’s/Tour/Travel service, Postal service, Telecommunication Service, Municipal Reference services, Legal services and Other Government service portals that are commonly used by them.
Table 2
e-Government portal uses pattern
| Responses | Percent of cases | |||
|---|---|---|---|---|
|
| Percent | |||
| E-government | Education | 378 | 12.2% | 59.9% |
| Health | 302 | 9.8% | 47.9% | |
| Passport | 159 | 5.1% | 25.2% | |
| Employment | 331 | 10.7% | 52.5% | |
| Culture | 164 | 5.3% | 26.0% | |
| Sports | 322 | 10.4% | 51.0% | |
| Airlines service | 92 | 3.0% | 14.6% | |
| Rail/Transport Service | 220 | 7.1% | 34.9% | |
| Hotel’s/Tour/Travel service | 366 | 11.8% | 58.0% | |
| Postal service | 224 | 7.2% | 35.5% | |
| Telecommunication Service | 314 | 10.2% | 49.8% | |
| Municipal Reference services | 70 | 2.3% | 11.1% | |
| Legal services | 25 | 0.8% | 4.0% | |
| Other Government service portals | 124 | 4.0% | 19.7% | |
| Total | 3091 | 100.0% | 489.9% | |
| a. Group | ||||
4.1Factor of service quality of e-government web portals: Descriptive statistics (N =
The statistics indicate the descriptive statistics (mean and standard deviation) of various factors promoting the e-government portal by the respondent, their e-Gov service QP, CS, and users’ intention (UI). Cronbach’s alpha is by far the most popular measure of reliability (Jha et al., 2022; Kumar & Sharma, 2017b; Kumar & Sharma, 2017c; Kumar et al., 2022). It is observed that out of six factors identified, system stability (SS) has scored the highest mean of 3.9144 with a standard deviation (SD)
Table 3
Factor of service quality of e-government web portals: descriptive statistics (
| Reliability ( | Mean | Std. deviation | |
|---|---|---|---|
| Information Clarity and appropriateness (ICA) | 0.792 | 3.7995 | 0.69936 |
| The website is having information clarity and is able to deliver information as needed via keywords. | 4.1426 | 0.73156 | |
| All the website information and functions are well categorized and able to facilitate information and services you need quickly. | 4.0301 | 0.92103 | |
| The website is equipped with the facility of guidance and instructions to users for easy and smooth operation. | 3.4897 | 1.03255 | |
| We get clear accurate and appropriate information from the e-government website as per our needs. | 3.5357 | 1.14569 | |
| Relevance and Usefulness (EU) | 0.745 | 3.5613 | 0.77437 |
| I find this website user-friendly and easy to use | 3.4754 | 0.96886 | |
| Users’ difficulty in handling websites is managed well | 3.7132 | 1.17991 | |
| I consider this website user friendly | 3.7147 | 1.25271 | |
| I find the information on this website helpful and useful | 3.5119 | 0.93746 | |
| The information on this website is relevant to me | 3.3914 | 1.12427 | |
| Information accuracy and Completeness (IAC) | 0.794 | 3.6183 | 0.68686 |
| I get sufficient information from this website. | 3.3740 | 1.23683 | |
| I get accurate information from these websites | 3.6830 | 1.02555 | |
| I know where to find the information I need on this website | 3.7369 | 1.03765 | |
| I was constantly being redirected to this website while I was looking for information | 3.7464 | 1.01530 | |
| I find the structure of this website clear and appropriate | 3.1569 | 1.17478 | |
| I am able to explore the information I needed conveniently from this website | 4.0127 | 1.04798 | |
| System Security and users’ privacy (SUP) | 0.734 | 3.7787 | 0.77058 |
| I am confident that all my personal information given to this website is secure | 3.5246 | 0.96063 | |
| This website has users’ privacy protection settings, such as password authentication and mobile authentication. | 3.9065 | 0.89574 | |
| My submitted information will be kept private and will not be disclosed. | 3.9049 | 1.00182 | |
| System Stability (SS) | 0.756 | 3.9144 | 0.60848 |
| This website is technologically stable, and all of its images, videos, and hyperlinks may be viewed properly. | 4.1775 | 0.78490 | |
| The usage of online services almost never results in a system breakdown. | 3.9255 | 0.99960 | |
| The content and services on the website are not time-limited. | 3.4849 | 1.07468 | |
| Using various browsers or Internet tools to open government portal websites will have no effect on the website’s content or functionality. | 4.0697 | 0.82705 | |
| Interactive Services (IS) | 0.764 | 3.8122 | 0.66547 |
| Real-time communication methods, such as online customer support, are available on the website. | 4.0491 | 0.87421 | |
| The website’s online service or email system, message boards, and other channels can respond to my queries and concerns in a timely and serious manner. | 4.0634 | 0.91847 | |
| According to the data, the website will take the initiative to notify me of any new information or services. | 3.5246 | 0.96063 | |
| Online transactions can be performed in a set amount of time. | 3.6117 | 1.01409 | |
| E-government Service Quality Perception (QP) | 0.835 | 3.7322 | 0.76749 |
| The goal of e-Government is self-evident. | 3.6307 | 1.02118 | |
| The e-Government system is safe and reliable. | 3.6830 | 1.02555 | |
| Other systems are interconnected with the e-Government system. | 3.7385 | 1.03728 | |
| Employees of the government’s offline services are informed and enthusiastic. | 3.7306 | 1.01747 | |
| The online company helps me feel happy with the outcomes once I submit appropriate resources. | 3.8780 | 0.82385 | |
| Citizens’ Satisfaction with e-Government Services (CS) | 0.778 | 3.6236 | 0.79568 |
| I am satisfied with the function of the e-Government system is comprehensive and the process of the e-Government system is simple. | 3.7021 | 1.04956 |
|
Table 3, continued | |||
|---|---|---|---|
| Reliability ( | Mean | Std. deviation | |
| I am satisfied with the responsiveness of websites | 3.4469 | 1.22537 | |
| I am satisfied with the information provided by the e-Government system can meet my needs | 3.6529 | 0.91286 | |
| I am satisfied with the efficiency of the e-Government system and its ability in accelerating the pace of business | 3.6926 | 0.88403 | |
| Purchase Intention (PI) | 0.769 | 3.7680 | 0.54365 |
| I consider myself a loyal customer of this website. | 4.0285 | 0.72960 | |
| I am likely to recommend this website to a colleague or friend. | 3.9168 | 0.65239 | |
| I plan on continuing to make transactions from this website in the future. | 3.6377 | 0.95268 | |
| I enjoy this website and will continue to use the website. | 3.7702 | 0.87661 | |
| I will revisit this site again to avail these services in future | 3.5975 | 0.84137 | |
| I will consider this site to be the first choice for future transaction | 3.6573 | 0.69515 | |
| Valid N (listwise) | 631 | ||
4.2Regression analysis
In statistical modeling, regression analysis is a set of statistical tools for estimating the connections between constructs (IV & DV) (Kumar & Sharma, 2018; Verma et al., 2022; Verma et al., 2021). The relationship between factors impacting e-government, e-government Service Quality Perception (QP), Citizens’ Satisfaction with e-government portals, and Purchase Intention was tested using Regression analysis in the current study model. Combined factor means (Information Clarity and appropriateness (ICA), Relevance and Usefulness (EU), Information accuracy and Completeness (IAC), System Security and users’ privacy (SUP), System Stability (SS), and Interactive Services (IS) were used in analyzing the construct “Factors of e-government”. Similar to e-Government Service Quality Perception (QP), Citizens’ Satisfaction (CS) was calculated to measure “Citizens’ Satisfaction of e-gov Services,” and Users’ Intention (UI). Five stems were subjected to additional regression analysis. In the first step, regression analysis was used to determine the direct impact of a factor related to e-Government portals on purchase intent. The impact of e-Government factors on e-Government service quality perception and citizen satisfaction with the e-Government service portal was calculated next stage. SPSS software was used to calculate the impact of e-Government Service Quality Perception (QP) and Citizens’ Satisfaction with e-gov Services (CS) on users’ intention (UI).
The information presented in Table 6 depicts the outcome of regression analysis between factors of e-government, QP, CS, and UI. The direct effect of factors of e-government on citizen online users’ intention was found significant (F-value
The other indirect impact of Factors of e-government on users’ intention to reuse the portal was calculated via e-Gov Service QP, and the result was found significant (F-Value
The impact of factors of e-Gov Service QP on users’ intention was found significant (F-Value
4.3The mediation effect of e-government Service Quality Perception (QP) between Factors of e-government and Users’ Intention to reuse of portal
A mediator variable explains how or why a link exists between an independent and dependent variable. They can be qualitative or quantitative characteristics that affect a relationship’s direction and strength. In the absence of a mediating variable, the link between independent and dependent variables is relatively weak, resulting in an interaction effect (Baron and Kenny, 1986). The findings of the Sobel test, Aroian test, and Goodman test were used to analyze the effect of a mediating variable (e-government Service Quality Perception (QP) of a given independent variable (factor of e-government) on a given dependent variable, as shown in Table 4(A) and 4(B) (users’ intention). Mediation can take place in general if the following conditions are met: (1) The independent variable has a significant unique effect on the dependent variable; (2) the independent variable has a significant unique effect on the dependent variable in the absence of the mediator; and (4) the independent variable’s influence on the dependent variable and dependent variable shrinks when the mediator is applied to the model. These considerations can be used to determine whether or not mediation is taking place informally. The Sobel test revealed that p-values are less than 0.05 when a two-tailed z-test is more than 1.96, indicating that the research hypothesis is accepted and that e-government Service Quality Perception (QP) mediates the association between e-government Factors and Users’ Intention.
Table 4(A)
Influence of Mediating Variable (e-government Service Quality Perception (QP)) using Sobel Test (A)
| Input | Test statistics | Standard error | |||
|---|---|---|---|---|---|
| A | 1.092 | Sobel test | 28.44010389 | 0.02303789 | 0.000 |
| B | 0.600 | Aroian test | 28.43571024 | 0.02304145 | 0.000 |
| Sa | 0.027 | Goodman test | 28.44449957 | 0.02303433 | 0.000 |
| Sb | 0.019 |
Table 4(B)
Influence of Mediating Variable (Consumer perceived Risk) using Sobel Test (B)
| Input | Test statistics | |||
|---|---|---|---|---|
|
| 40.366 | Sobel test | 28.43355234 | 0.000 |
|
| 40.058 | Aroian test | 28.4291574 | 0.000 |
| Goodman test | 28.43794932 | 0.000 |
4.4The mediation effect of Citizens’ Satisfaction of e-gov Services satisfaction (CS) between Factors of e-government and Users’ Intention
Table 5(A) and 5(B) show the results of the Sobel, Aroian, and Goodman tests, which were used to determine the effect of a mediating variable (e-gov Services CS) on a given independent variable (factor of e-government) on a given dependent variable (user intention). According to the Sobel test, CS of e-gov mediated the relationship between Factors of e-government and User intention. Assuming a two-tailed z-test is more significant than 1.96, the research hypothesis is accepted, and the conclusion is that CS of e-gov Services mediated the relationship between Factors of e-government and UI.
Table 5(A)
Influence of Mediating Variable (e-gov Services Satisfaction (CS)) using Sobel Test (B)
| Input | Test statistics | Standard error | |||
|---|---|---|---|---|---|
| a | 0.627 | Sobel test | 11.44856536 | 0.02667138 | 0.000 |
| b | 0.487 | Aroian test | 11.44159696 | 0.02668762 | 0.000 |
| Sa | 0.049 | Goodman test | 11.4555465 | 0.02665512 | 0.000 |
| Sb | 0.019 |
Table 5(B)
Influence of Mediating Variable (e-gov Services Satisfaction (CS) using Sobel Test (B)
| Input | Test statistics | |||
|---|---|---|---|---|
|
| 13.19194 | Sobel test | 11.71998513 | 0.000 |
|
| 25.532 | Aroian test | 11.71289637 | 0.000 |
| Goodman test | 11.72708677 | 0.000 |
5.Discussion and findings
Adoption of the e-Government web portal has significantly increased. The digital infrastructure support system and its extensive application in various non-government and government departments have enhanced the utility of the e-government web portal. The present study tries to explore the impact of different factors of e-government services on users’ re-use patterns and mediating role of the mediation effect of e-government Service Quality Perception (QP)) and Citizens’ Satisfaction of e-gov Services satisfaction (CS) in the relationship between Factors of e-government and Users’ intention. The study examines the Indian citizen adoption and intention to continue the e-Government web portal from a service level and service quality using CFA model and multiple regression analysis. Based on primary data size factors of e-government web portal adaption (Information Clarity and appropriateness (ICA), Relevance and Usefulness (EU), Information accuracy and Completeness (IAC), System Security and users’ privacy (SUP), System Stability (SS) and Interactive Services (IS). A study approach is suggested and evaluated utilizing data from 631 individual users of India’s e-Government Web portals. Our research demonstrates that the quality of a Web portal’s service influences user adoption and retention intentions in India. The findings are consistent with Fan and Yang’s (2015) earlier study findings (Carter & Bélanger, 2005; Hussein et al., 2011). Zhang et al. (2014), Khanra and Joseph (2019), Li and Shang (2020), Bhattacharya et al. (2012) identified seven factors that influence the adoption of e-government. Papadomichelaki and Mentzas (2009) also investigate, improve, and verify their work, confirming and testing a multi-item scale for assessing e-Gov service quality for public administration sites where citizens seek information or services in line with our findings.
Further study indicates that factors of e-government have a significant effect on building citizen positive perception and citizen perception influences their users’ intention. The finding indicates the Mediation effect of e-Gov Service QP and CS of e-gov Services in the relationship between Factors of e-government and UI. The finding is consistent with the previous research finding of the study of Beaudry and Pisonneault (2010). Therefore, it can be seen that the research objective of this study has been achieved. It partly assists businesses in understanding the impact of citizen adoption of e-government, perception toward e-government, CS, and UI to use e-government.
Table 6
Direct and indirect impact of service quality factors of e-government portals on purchase intention
|
| Path coefficients | Result | ||||
|---|---|---|---|---|---|---|
| Factors of e-government | 0.872 | 0.851 | 4270.63 | 65.350 | 0.00 | Accepted |
| Factors of e-government | 0.721 | 1.092 | 1628.62 | 48.356 | 0.000 | Accepted |
| E-government Service Quality Perception (QP) | 0.718 | 0.600 | 1604.60 | 40.05 | 0.000 | Accepted |
| Factors of E-government | 0.216 | 0.621 | 174.08 | 13.19 | 0.00 | Accepted |
| Citizens’ Satisfaction of e-gov Services (CS) | 0.509 | 0.487 | 651.88 | 25.53 | 0.000 | Accepted |
Implementation of e-Government progresses through many phases of development, requiring adjustments in strategy at each stage. Transitions in service maturity phases present ongoing problems for service providers measuring the SQ of government web-based services. This study aims to develop a multi-item scale for evaluating the service quality of government portals that involve transactions. An exhaustive evaluation of research conducted by academic researchers and practitioners revealed factors influencing the service quality of government portals. A survey of fully operating portals was conducted using a questionnaire developed based on a review and interviews with users of e-Government programs. The responses were gathered, and the data were subjected to quantitative analysis in order to create a scale. This scale can assess citizen perceptions of the quality of services. Developing sites that better serve the public is a vital component in advancing e-Governmental services. The development of sites that better fulfill the requirements of citizens is a vital component in the evolution of e-Governmental services. We must first learn how users perceive and assess online citizen service to improve service quality. This entails defining e-Government service quality, establishing its underlying aspects, and figuring out how to define and quantify it. In this work, we create, revise, validate, confirm, and test a multiple-item scale for measuring e-Government service quality for public administration sites where citizens seek either information or services. We then conceptualize an e-Government service quality model (e-Gov Qual).
5.1Implications
Though the past studies have found some inherent outcomes with the perceived benefits impacting e-Government, this could be examined further. Citizen attitudes toward contactless services have changed as a result of the research. e-Government must continue to promote strategies that stimulate citizen needs by providing more service options with fair and transparent policies, particularly policies that help citizens gain more trust in the online system and develop citizen perception and satisfaction with contactless transaction systems. System stability and interaction with new technological support systems influence Indian citizens’ effective e-government user decisions regarding the reusable portal of government. Before selecting to use an e-government web portal service, people frequently seek the advice and opinions of their relatives. This investigation outlines the government designs its e-government portal in such a way that can enhance citizen satisfaction, citizen perception in terms of e-government quality, and users’ intentions. Further, the study went deep down to the bottom to understand what other minor and essential factors influence the citizen to use the e-government portal. Such factors are ICA, Relevance and Usefulness, ICA, SUP, SS, IS, QP, CS, UI, etc. Government must focus on the above-mentioned element before presenting it to the public which may enhance e-government and CS.
6.Conclusions, limitations, and future research
The factors of e-government portal, perception of service quality of web portal, citizen satisfaction, and Users’ intention are developed and shown the relationship among these attributes in this study. The factors of e-government are information clarity and appropriateness, relevance & usefulness, information accuracy and completeness, system security and users’ privacy, system stability, and interactive services. Further, it implies that there is a strong need to understand the perceptions of e-government users in terms of the quality of the e-government online services. In research, the presence of a problem that has not been wholly exploited is unavoidable, and this study is no exception. The first is that the mediating variable chosen in this study only relates to emerging citizen satisfaction and perception so that other potential mediating variables may be considered in future research. Second, while citizen demographics considerably affect decisions, this paper focuses on perception and satisfaction rather than these characteristics. This allows follow-up studies to analyze differences in e-Government and reusable intentions across economies and cultures by expanding surveys across countries. A longitudinal strategy to triangulate results over time is recommended in a future study of these identified e-government characteristics with customer satisfaction and users’ intention.
Conflict of interest
None to declare.
References
[1] | Agrawal, A., Shah, P., & Wadhwa, V. ((2007) , May). EGOSQ-users’ assessment of e-governance online-services: A quality measurement instrumentation. In the International Conference on E-governance, pp. 231-244. |
[2] | Al-Khouri, A.M. ((2011) ), “Innovative approach for e-government transformation”, International Journal of Managing Value and Supply Chains (IJMVSC). 2: (1), 22-43. doi: 10.5121/ijmvsc.2011.2102. |
[3] | Alomari, M., Woods, P., & Sandhu, K. ((2012) ). Predictors for e-government adoption in Jordan: Deployment of an empirical evaluation based on a citizen-centric approach. Information Technology & People. 25: (2), 207-234. doi: 10.1108/09593841211232712. |
[4] | Beaudry, A., & Pinsonneault, A. ((2010) ). The Other Side of Acceptance: Studying the Direct and Indirect Effects of Emotions on Information Technology Use. MIS Quarterly, 34: (4), 689-710. doi: 10.2307/25750701. |
[5] | Behzadi, H., Isfandyari-Moghaddam, A., & Sanji, M. ((2012) ). E-government portals: a knowledge management study. The Electronic Library. 30: (1), 89-102. doi: 10.1108/02640471211204088. |
[6] | Bhattacharya, D., Gulla, U., & Gupta, M.P. ((2012) ). E-service quality model for Indian government portals: citizens’ perspective. Journal of Enterprise Information Management. 25: (3), 246-271. doi: 10.1108/17410391211224408. |
[7] | Bournaris, T. ((2020) ). Evaluation of e-Government Web Portals: The Case of Agricultural e-gov Services in Greece. Agronomy. 10: (7), 1-19, 932. doi: 10.3390/agronomy10070932. |
[8] | Butt, N., Warraich, N. F., & Tahira, M. ((2019) ). Development level of electronic government services: An empirical study of e-government websites in Pakistan. Global Knowledge, Memory and Communication. 68: (1/2), 33-46. doi: 10.1108/GKMC-05-2018-0045. |
[9] | Carter, L., & Bélanger, F. ((2005) ). The utilization of e-gov Services: citizen trust, innovation and acceptance factors. Information Systems Journal, 15: (1), 5-25. doi: 10.1111/j.1365-2575.2005.00183.x. |
[10] | Eggers, W., Bellman, J. The Journey to Government’s Digital Transformation; Deloitte University Press: New York, NY, USA, (2015) . |
[11] | Fan, J., & Yang, W. ((2015) ). Study on e-gov Services quality: The integration of online and offline services, Journal of Industrial Engineering and Management, 8: (3), 693-718. doi: 10.3926/jiem.1405. |
[12] | Goh, D.H.L., Chua, A.Y K., Luyt, B., & Lee, C.S. ((2008) ). Knowledge access, creation and transfer in e-government portals. Online Information Review. 32: (3), 348-369. doi: 10.1108/14684520810889664. |
[13] | Gupta, D. N. ((2008) ). Citizen-centric Approach for e-Governance. Foundations of e-Governance: Proceedings of the 5th International. |
[14] | Hirwade, M. A. ((2010) ). Responding to information needs of the citizens through e-government portals and online services in India. The International Information & Library Review, 42: (3), 154-163. doi: 10.1016/j.iilr.2010.07.004. |
[15] | Howard, M. ((2001) ). E-government across the globe: how will’e’change government. e-Government, 90: , 80, 6-9. |
[16] | Huang, Z. ((2007) ). A comprehensive analysis of US counties e-Government portals: development status and functionalities. European Journal of Information Systems, 16: (2), 149-164. doi: 10.1057/palgrave.ejis.3000675. |
[17] | Hussein, R., Mohamed, N., Ahlan, A.R., & Mahmud, M. ((2011) ). E-government application: an integrated model on G2C adoption of online tax. Transforming Government: People, Process and Policy, 5: (3), 225-248. doi: 10.1108/17506161111155388. |
[18] | Jiang, X., & Ji, S. ((2014) , January). E-Government web portal adoption: A service level and service quality perspective. In 2014 47th Hawaii International Conference on System Sciences (pp. 2179-2188). IEEE. |
[19] | Jha, A., Sharma, R.R.K., Kumar, V., & Verma, P. ((2022) ). Designing Supply Chain Performance System: A Strategic Study on Indian Manufacturing Sector, Supply Chain Management: An International Journal, 27: (1), 66-88. |
[20] | Khanra, S. & Joseph, R.P. ((2019) ), Adoption of e-Governance: The mediating role of language proficiency and digital divide in an emerging market context. Transforming Government: People, Process and Policy, 13: (2), 122-142. doi: 10.1108/TG-12-2018-0076. |
[21] | Khatoon, S., Zhengliang, X., & Hussain, H. ((2020) ). The Mediating Effect of customer satisfaction on the relationship between Electronic banking service quality and customer Purchase intention: Evidence from the Qatar banking sector. SAGE Open, 10: (2), 1-12. doi: 10.1177/2158244020935887. |
[22] | Kumar, V., Verma, P., Sharma, R.R.K., & Khan, A.F. ((2017) a). Conquering in Emerging Markets: Critical Success Factors to Enhance Supply Chain Performance. Benchmarking: An International Journal. 24: (3), 570-593. doi: 10.1108/BIJ-05-2016-0078. |
[23] | Kumar, V., & Sharma, R.R.K. ((2017) b). An Empirical Investigation of Critical Success Factors Influencing the Successful TQM Implementation for firms with different strategic Orientation. International Journal of Quality and Reliability Management. 34: (9), 1530-1550. |
[24] | Kumar, V., & Sharma, R.R.K. ((2017) c). Relating Management Problem Solving Styles of Leaders to TQM Focus: An Empirical Study. The TQM Journal. 29: (2), 218-239. |
[25] | Kumar, V., & Sharma, R.R.K. ((2018) ). Leadership Styles and their relationship with TQM Focus for Indian Firms: An Empirical Investigation. International Journal of Productivity and Performance Management, 67: (6), 1063-1088. |
[26] | Kumar, V., Mittal, A., Sharma, A. K., & Ahmad, R. ((2022) ). The role of stress personalities: a comparative study between Indian Academia and industry. The Journal of Mental Health Training, Education and Practice, (ahead-of-print). doi: 10.1108/JMHTEP-07-2021-0081. |
[27] | Li, Y., & Shang, H. ((2020) ). Service quality, perceived value, and citizens’ continuous-use intention regarding e-government: Empirical evidence from China. Information & Management, 57: (3), 1-15, 103197. doi: 10.1016/j.im.2019.103197. |
[28] | Loiacono, E. T., Watson, R. T., & Goodhue, D. L. ((2002) ). WebQual: A measure of website quality. Marketing Theory and Applications, 13: (3), 432-438. |
[29] | Misra, H. K. ((2009) , July). Citizen centric rural e-governance for development in india: an architecture-based approach. In The 3rd International Multi Conference on Society, Cybernetics & Informatics (IMSCI 2009). |
[30] | Mohammad Ebrahimzadeh Sepasgozar, F., Ramzani, U., Ebrahimzadeh, S., Sargolzae, S., & Sepasgozar, S. ((2020) ). Technology acceptance in e-governance: A case of a finance organization. Journal of Risk and Financial Management, 13: (7), 1-17, 138. doi: 10.3390/jrfm13070138. |
[31] | Nandal, A. H., & Singla, M. L. ((2019) ). Investigating the impact of metaphors on citizens’ adoption of e-governance in developing countries: An empirical study. Transforming Government: People, Process and Policy. 13: (1), 34-61, doi: 10.1108/TG-04-2018-0026. |
[32] | Osman, I. H., Anouze, A. L., Irani, Z., Al-Ayoubi, B., Lee, H., Balı, A., et al., ((2014) ). COBRA framework to evaluate e-gov Services: A citizen-centric perspective. Government Information Quarterly, 31: (2), 243-256. doi: 10.1016/j.giq.2013.10.009. |
[33] | Paliwal, M., Rajak, B.K., Kumar, V., & Singh, S. ((2022) ), Assessing the Role of Creativity and Motivation to measure Entrepreneurial Education and Entrepreneurial Intention. International Journal of Educational Management, 36: (5), 854-874. |
[34] | Papadomichelaki, X., & Mentzas, G. ((2009) , August). A multiple-item scale for assessing e-government service quality. In International Conference on Electronic Government (pp. 163-175). Springer, Berlin, Heidelberg. |
[35] | Parasuraman, A., Zeithaml, V. A., & Berry, L. L. ((1985) ). A conceptual model of service quality and its implications for future research. Journal of Marketing, 49: (4), 41-50. |
[36] | Parycek, P., & Pircher, R. ((2003) ). Teaching e-government and knowledge management. E-Government: Legal, Technocal and Pedagogical Aspects. (eds. F. Galindo, R. Traunmuller), Albaracin, pp. 213-228. |
[37] | Rana, N. P., Dwivedi, Y. K., Lal, B., Williams, M. D., & Clement, M. ((2017) ). Citizens’ adoption of an electronic government system: towards a unified view. Information Systems Frontiers, 19: (3), 549-568. doi: 10.1007/s10796-015-9613-y. |
[38] | Sigwejo, A., & Pather, S. ((2016) ). A citizen-centric framework for assessing e-government effectiveness. The Electronic Journal of Information Systems in Developing Countries, 74: (1), 1-27. doi: 10.1002/j.1681-4835.2016.tb00542.x. |
[39] | Singh, S., Chamola, P., Kumar, V., Verma, P., & Makkar, N. ((2022) ), Explaining the Revival Strategies of Indian MSMEs to Mitigate the effects of COVID-19 Outbreak” Benchmarking: an International Journal. doi: 10.1108/BIJ-08-2021-0497. |
[40] | Sorn-In, K., Tuamsuk, K., & Chaopanon, W. ((2015) ). Factors affecting the development of e-government using a citizen-centric approach. Journal of Science & Technology Policy Management. 6: (3), 206-222. doi: 10.1108/JSTPM-05-2014-0027. |
[41] | Sharma, N.K., Verma, P., Kumar, V., & Arunachalam, R. ((2021) ). ICT in Mitigating Challenges of Life Amid COVID-19 and Emerging Business Opportunities, Second International Conference on Innovative Trends in Information Technology (ICITIIT’2021) held in IIIT Kottayam, Kerala, India, Feb. 11-12, 2021. pp. 1-6. doi: 10.1109/ICITIIT51526.2021.9399599. |
[42] | Tolbert, C.J. & Mossberger, K. ((2006) ), The effects of e-government on trust and confidence in government. Public Administration Review, 66: (3), 354-369. doi: 10.1111/j.1540-6210.2006.00594.x. |
[43] | Verma, P., Sharma, R.R.K., Kumar, V., Hsu, S.C., & Lai, K.K. ((2022) ), Identifying Organizational Variables to the Implementation of Horizontal Strategy in Conglomerates. Benchmarking: An International Journal, 29: (5), 1703-1733. |
[44] | Verma, P., Singh, S., Kumar, V., Paliwal, M., Sharma, P., & Hsu, S.C. ((2021) ). Fear of COVID-19 Outbreak, Stress and Anxiety among working employees: A Multi-Service Sector Study. International Journal of Industrial and System Engineering, doi: 10.1504/IJISE.2022.10046612. |
[45] | Wang, L., Bretschneider, S., & Gant, J. ((2005) , January). Evaluating web-based e-gov Services with a citizen-centric approach. In Proceedings of the 38th Annual Hawaii International Conference on System Sciences (pp. 129b-129b). IEEE. |
[46] | Yildirim, S., & Bostanci, S. H. ((2021) ). The efficiency of e-government portal management from a citizen perspective: evidences from Turkey. World Journal of Science, Technology and Sustainable Development. 18: (3), 259-273. doi: 10.1108/WJSTSD-04-2021-0049. |
[47] | Yoo, B., & Donthu, N. ((2001) ). Developing a scale to measure the perceived quality of an Internet shopping site (SITEQUAL). Quarterly Journal of Electronic Commerce, 2: (1), 31-45. |
[48] | Ziemba, E., Papaj, T., & Descours, D. ((2014) , September). Assessing the quality of e-government portals-the Polish experience. In 2014 Federated Conference on Computer Science and Information Systems (pp. 1259-1267). IEEE. |
Appendices
Appendix A: Abbreviations (Complete explanations of abbreviations used in this study)
| CFA | Confirmatory factor analysis |
|---|---|
| ICT | Information and Communication Technologies |
| G2B | Governments and businesses |
| G2C | Governments and Citizens |
| G2G | Government to Government (government agencies) |
| QP | Quality Perception |
| CS | Citizens’ Satisfaction |
| SPSS | Statistical Package for the Social Sciences |
| SS | System Stability |
| SD | Standard Deviation |
| ICA | Information Clarity and Appropriateness |
| PI | Purchase Intention (PI) |
| SUP | system security and user’s privacy (SUP) |
| IS | Interactive Services (IS) |
| Gov qual | Government Quality |
Appendix B: Questionnaire
Information Clarity and appropriateness (ICA)
the website is having information clarity and is able to deliver information as needed via keywords. all the website information and functions are well categorized and able to facilitate information and services you need quickly. the website is equipped with the facility of guidance and instructions to users for easy and smooth operation.
We get clear accurate and appropriate information from the e-government website as per our needs.
Relevance and Usefulness (EU)
I find this website user-friendly and easy to use
Users’ difficulty in handling websites is managed well
I consider this website user friendly
I find the information on this website helpful and useful
The information on this website is relevant to me
Information accuracy and Completeness (IAC)
I get sufficient information from this website.
I get accurate information from these websites
I know where to find the information I need on this website
I was constantly being redirected to this website while I was looking for information
I find the structure of this website clear and appropriate
I am able to explore the information I needed conveniently from this website
System Security and users’ privacy (SUP)
I am confident that all my personal information given to this website is secure
This website has users’ privacy protection settings, such as password authentication and mobile authentication.
My submitted information will be kept private and will not be disclosed.
System Stability (SS)
This website is technologically stable, and all of its images, videos, and hyperlinks may be viewed properly.
The usage of online services almost never results in a system breakdown.
The content and services on the website are not time-limited.
Using various browsers or Internet tools to open government portal websites will have no effect on the website’s content or functionality.
Interactive Services (IS)
Real-time communication methods, such as online customer support, are available on the website.
The website’s online service or email system, message boards, and other channels can respond to my queries and concerns in a timely and serious manner.
According to the data, the website will take the initiative to notify me of any new information or services.
Online transactions can be performed in a set amount of time.
E-government Service Quality Perception (QP) (Parasuraman et al., 1985)
The goal of e-Government is self-evident.
The e-Government system is safe and reliable.
Other systems are interconnected with the e-Government system.
Employees of the government’s offline services are informed and enthusiastic.
The online company helps me feel happy with the outcomes once I submit appropriate resources.
Citizens’ Satisfaction with e-Government Services (CS)
I am satisfied with the function of the e-Government system is comprehensive and the process of the e-Government system is simple.
I am satisfied with the responsiveness of websites
I am satisfied with the information provided by the e-Government system can meet my needs
I am satisfied with the efficiency of the e-Government system and its ability in accelerating the pace of business
Purchase Intention (PI)
I consider myself a loyal customer of this website.
I am likely to recommend this website to a colleague or friend.
I plan on continuing to make transactions from this website in the future.
I enjoy this website and will continue to use the website.
I will revisit this site again to avail these services in future
I will consider this site to be the first choice for future transaction.


