
Learning through online participation: A longitudinal analysis of participatory budgeting using Big Data indicators
Abstract
Local authorities increasingly employ digital platforms to facilitate public engagement in participatory budgeting processes. This creates opportunities for and challenges in synthesizing citizens’ voices online in an iterated cycle, requiring a systematic tool to monitor democratic quality and produce formative feedback. In this paper, we demonstrate how cases of online deliberation can be compared longitudinally by using six Big Data-based, automated indicators of deliberative quality. Longitudinal comparison is a way of setting a reference point that helps practitioners, designers, and researchers of participatory processes to interpret analytics and evaluative findings in a meaningful way. By comparing the two rounds of OmaStadi, we found that the levels of participation remain low but that the continuity and responsiveness of online deliberation developed positively.

1.Introduction
Can Big Data analytics help facilitate democratic decision-making? This question has become prominent among practitioners and researchers as public authorities proactively employ more open and collaborative digital platforms to involve citizens in decision-making processes (Bright & Margetts, 2016; Iandoli et al., 2018; Löfgren & Webster, 2020; Peixoto & Fox, 2016; Touchton et al., 2019). Such digital participatory platforms include Citizenlab, Consul, Decidim, Maptionnaire, and Polis, to name but a few (see Deseriis, 2021). Online repositories such as Participedia (https://participedia.net/) provide comprehensive cases of democratic decision-making across the globe. These platforms hold extensive citizen-generated data in various forms, offering new opportunities to translate citizens’ voices into public services, decision-making, and innovation (Aragón et al., 2017; Kahila-Tani et al., 2019; Royo et al., 2020; Shin & Rask, 2021).
Online deliberation research has traditionally focused on measuring the qualities of discussions by taking representative samples or conducting small-scale forums and manually annotating items based on theory-based criteria (Beauchamp, 2018; Beste & Wyss, 2019; Friess & Eilders, 2015). While the hand-annotated coding scheme or surveys have been widely valued for enabling researchers to assess contextually nuanced political discussions, considerable coding efforts are required in terms of time and resources. Moreover, the changing landscape of diversified digital platforms and participation modes in the digital era (Ruess et al., 2021) has increased the scale and complexity of citizen input to an extent that exceeds the capacity of traditional data processing, resulting in difficulties in synthesizing diverse voices (Connelly et al., 2016; Höchtl et al., 2016; Löfgren & Webster, 2020). This technical challenge has been described as an information overload problem (Arana-Catania et al., 2021) or a decision burden (Deseriis, 2021), calling for a new approach to handling voluminous, dynamic, and fragmented online data.
Recent studies have addressed this problem by employing Big Data analytics to automatically annotate content quality or analyze the underlying patterns of contents and interactions (Aragón et al., 2017; Davies & Procter, 2020; Fournier-Tombs & di Marzo Serugendo, 2019; Fournier-Tombs & MacKenzie, 2021; Parkinson et al., 2020). While (semi-)automated techniques have a great potential to efficiently handle extensive textual and audiovisual data, they are still at the early stage and the results have not advanced researchers’ ability to code the data much compared to traditional manual coding schemes (Beauchamp, 2018; Beste & Wyss, 2019). As Jaramillo and Steiner (2019) have pointed out, political deliberation often involves personal stories, emotions, and spontaneous conversations, making it difficult to measure the quality of the data even for trained human coders.
Overall, online deliberation research can significantly benefit from Big Data analytics in the era of digital communication, yet many challenges remain. In this regard, Maass et al. (2018) have argued that theory-driven and data-driven perspectives should be combined in Big Data analytics. On the one hand, deliberation scholars have proposed normative frameworks for assessing the democratic quality of deliberation that guide scientific inquiries, data requirements, hypotheses, and democratic indicators (see Beauchamp, 2018; Friess & Eilders, 2015; Löfgren & Agger, 2021; Strandberg & Grönlund, 2018). On the other hand, data-driven research inversely starts with extracting and exploring data to model underlying patterns for theoretical insights. In particular, digital platforms have distinct systems that influence data structure, deliberation processes, and perhaps even the democratic quality of the process (Deseriis, 2021; Esau et al., 2020; Gonzalez-Bailon et al., 2010). A crucial challenge of Big Data analytics is thus how to reconcile the two perspectives and produce meaningful information for facilitating deliberation processes.
Against such a backdrop, we recently proposed the adoption of automated online deliberation indicators using network and time-series data (Shin & Rask, 2021). From a theoretical standpoint, we noted that most existing Big Data indicators are designed to assess democratic content quality using natural language-based techniques, while focusing less on dynamic interactions in online deliberation settings. We developed six democratic indicators based on James Fishkin’s (2009) framework: participation, activeness, and continuity for measuring the volume of deliberation and responsiveness, inter-linkedness, and commitment for measuring interactions in online deliberation. Compared to other frameworks that focus on content and intra-group interactions (Steenbergen et al., 2003; Stromer-Galley, 2007), Fishkin (2009) asserted the importance of mass participation and diverse interactions with equal commitment, which suits our research focus. From a data-driven standpoint, we shed light on the metadata (e.g., timestamp, communication threads, area) of online discussions (e.g., textual data). These types of data are common in many platforms, providing empirical evidence of dynamic interactions in online deliberation, yet they have been relatively underexplored in this field. Therefore, our interaction-focused indicators can complement existing content-focused indicators by highlighting different aspects of online deliberation.
However, the indicators are far from complete. While our indicators are mainly designed to provide prompt and intuitive information on the democratic quality of deliberation processes, they require reference points to judge whether democratic criteria are enhanced or undermined in comparative terms, a crucial task of democratic assessment (see Agger & Löfgren, 2008). For instance, is the value of a 0.2 participation rate a democratically enhanced result? Without reference points, quantified measures and figures just float around moving targets. We may observe similar deliberation cases, enabling comparative assessments. However, deliberation scholars have suggested careful use of quantitative measures in cross-case comparisons because each deliberation operates under unique cultural, institutional, and historical contexts (Dryzek, 2009). Few studies have addressed this issue to date.
In this article, we propose using the Big Data indicators in a longitudinal design to help researchers better judge deliberation processes and improve them. While Gastil (2021) appreciated the proliferation of deliberative public engagements over the last few decades, he pointed out that many cases were one-off events or projects not strongly integrated into a democratic system. However, recent OECD reports (OECD, 2020, 2021) have highlighted a new trend of institutionalizing deliberative processes across the globe, calling attention especially to iterated deliberation (Thompson, 2008), self-correction (Gutmann & Thompson, 2004), and collective learning and capacity-building (Dryzek, 2009; Escobar, 2011). This transition provides a new opportunity for local actors to learn about crucial parameters from democratic indicators and change the conditions under which deliberation takes place in an iterated deliberation cycle.
This article demonstrates how democratic indicators can be used as a learning tool for online deliberation. We were able to study two rounds of OmaStadi participatory budgeting processes in the City of Helsinki, Finland, because the municipality continued the second round (2020–2021) with a doubled budget of 8.8 million euros based on successful piloting. OmaStadi employs an open-source participatory platform called Decidim to provide an open digital space for citizens to propose their ideas, co-develop them with city experts, and then decide between appropriate proposals via a popular vote in one place. We scraped the online data of the platform in two OmaStadi rounds and applied Shin and Rask’s (2021) six democratic indicators to examine the extent to which democratic values are enhanced. Our main research question was, how did the democratic quality of online deliberation evolve in the first two rounds of the OmaStadi PB?
This article is structured as follows. Section 2 connects Big Data analytics with online deliberation research, highlighting scant research on its dynamic processes. Section 3 describes the contextual background of the case study. In Section 4, we explain data collection and methods. Section 5 then reports the empirical results, followed by a discussion in Section 6, and concluding remarks in Section 7.
2.Theoretical framework
2.1Big Data analytics
The term Big Data is often characterized by the three Vs (Connelly et al., 2016; Höchtl et al., 2016; Laney, 2001): high volume (e.g., data size), variety (e.g., data forms or features), and velocity (e.g., the speed at which data are generated). For instance, digital platforms such as Twitter produce a large amount of data (e.g., millions of tweets) in real time (e.g., seconds) consisting of various data forms (e.g., strings, numbers, media) and data features (e.g., ID, URL, language, words). Big Data includes machine-generated data, such as sensor networks from the ground, air, and space, and user-generated data, including Web access logs, texts, media, transactions, clickstreams, timestamps, threads, locations, voting, and Facebook Likes collected from web applications, the Internet of Things, and mobile devices (Krishnan, 2013). This dataset is highly unstructured (non-machine-readable formats) and high dimensional (the number of features is higher than the number of observations), making conventional statistical approaches challenging to process.
Big Data analytics refers to techniques applied to collecting, managing, and analyzing Big Data (Elgendy & Elragal, 2014; Shu, 2016; Vassakis et al., 2018). The term analytics is used to highlight multiple methods involved in multiple stages from data mining to final applications (Shu, 2016). In contrast to standard statistics based on data sampling and inference, Big Data analytics usually do not involve sampling but rather combining multiple and unstructured datasets to identify latent patterns and theoretical insights using, for instance, a mix of machine-learning techniques, social network analysis, and time-series analysis (Chang, 2018; Elgendy & Elragal, 2014; Shu, 2016; Wang et al., 2020). These methods rely on diverse algorithms to automatically classify, cluster, and summarize large datasets for fast and better decision-making.
Big Data analytics has its flaws, though. Bigger data does not mean representative data, unless such data have been properly processed (Boyd & Crawford, 2012). For instance, neither Twitter or Facebook nor public platform data alone fully represent citizens’ voices online. Therefore, Big Data needs to be synthesized and contextualized to ensure its quality and to answer “how” and “why” questions. Researchers have recently started combining Big Data analytics with surveys and qualitative methods to improve data quality (Davies et al., 2021; Eck et al., 2019). Moreover, many studies have pointed out that Big Data suffers from low quality due to a lack of collaboration across the various public silos in producing, managing, and sharing such data (Connelly et al., 2016; Ruijer & Meijer, 2020), calling for a new data collaborative governance (Ruijer, 2021).
2.2Big Data analysis for online deliberation research
This section now narrows its focus to Big Data analytics for online deliberation research. Deliberation refers to a process of weighing competing considerations regarding specific issues (Fishkin, 2009; Fishkin & Luskin, 2005). Many scholars distinguish deliberation from other similar forms of political communication, such as debate, dialogue, and consultation, by claiming that deliberation focuses on addressing collective problems or making decisions through a fact-regarding, other-regarding and future-regarding exchange of arguments (Cohen, 2003; Fishkin, 2009; Fishkin & Luskin, 2005; Gastil & Black, 2007; Gutmann & Thompson, 2004; Manin, 1987; Offe & Preuss, 1991). For instance, political dialogue involves exchanging views on collective issues and discovering a new viewpoint, but decisions are not the primary focus (Escobar, 2011). While it might be almost impossible to reach a complete consensus among stakeholders (Gastil & Black, 2007; Thompson, 2008), deliberation is essentially about “the process that precedes decision” (Manin, 1987, p. 345), more specifically, a binding decision that influences stakeholders for a certain period (Gutmann & Thompson, 2004). Therefore, deliberation research involves normative debates on the principles underlying public engagement in “justifiable” collective decision-making regarding equality, respect, and accessibility (Dahlberg, 2001; Fishkin, 2009; Gastil & Black, 2007; Löfgren & Agger, 2021; Steenbergen et al., 2003).
Online deliberation is a young subfield of deliberation literature that studies the recent phenomena of digital-technology-enabled deliberation processes (Beauchamp, 2018; Beierle, 2004; Friess & Eilders, 2015; Jonsson & Åström, 2014; Strandberg & Grönlund, 2018). Digital technologies help overcome the limitations of face-to-face engagements in terms of time and space, enabling a many-to-many deliberation at a large scale. In addition, online deliberation can provide resilient public spheres during a crisis, such as a pandemic (Elstub et al., 2021). However, scholars have also found negative aspects of online deliberation and communication in terms of new digital divides, low effectiveness, cyberbullying, disinformation, and radical communities (Lim & Oh, 2016; Lowry et al., 2017; Norris, 2001; Vaccari & Chadwick, 2020). Therefore, online deliberation does not automatically enhance democratic values and requires further assessment.
Many studies have classified deliberation research into an input (e.g., who participates and under what conditions), throughput (e.g., how people deliberate and its democratic quality), and output dimension (e.g., results and their distribution in society) with distinctive research design and methods (Beauchamp, 2018; Beste & Wyss, 2019; Friess & Eilders, 2015; Geissel & Newton, 2012; Strandberg & Grönlund, 2018). To our knowledge, Big Data analytics has mostly been used to explore the black box of digital platforms, particularly discussion quality and communicative processes. For instance, recent studies have applied automated computational methods, including unsupervised (e.g., topic modeling) or supervised machine learning techniques (e.g., random forests), within a broad family of natural language processing to assess the content quality of large-scale online discussion data (Arana-Catania et al., 2021; Beauchamp, 2018; Fournier-Tombs & di Marzo Serugendo, 2019; Fournier-Tombs & MacKenzie, 2021; Parkinson et al., 2020) or in combination with network analysis to assess its network structures (Aragón et al., 2017; Choi, 2014; Gonzalez-Bailon et al., 2010). A fundamental set of questions raised by the above articles is based on what transpires on the digital platform. With respect to registered users, just who engages in online deliberation? What topics do they discuss, and with whom? How do they deliberate, and what is the quality?
Given that emphasis has been placed on content quality, our contribution is to assess dynamic interactions in online deliberation (Shin & Rask, 2021). Our indicators are based on Fishkin’s (2009) two democratic dimensions – participation and deliberation – where equality serves as an overarching value. Instead of focusing on a certain sampled population, digital platforms can theoretically invite “everyone” to a virtual roundtable and give them an equal chance to obtain information, exchange voices, and vote. Indeed, it has great potential precisely because mass participation is a cornerstone of democracy (Fishkin, 2009). Based on the participation dimension, we developed participation rate (how many participate), activeness (how actively they participate), and continuity (how consistently they participate) indicators to measure the volume of online deliberation over time (Shin & Rask, 2021).
The deliberation dimension focused on how different viewpoints are equally considered during deliberation based on five criteria (Fishkin, 2009; Fishkin & Luskin, 2005): information (equal access to factual claims), substantive balance (of competing sides through reciprocal communications), diversity (of viewpoints), conscientiousness (sincere weight and respect), and equal consideration (regardless of the speakers). As Fishkin and Luskin (2005) highlighted, these criteria promote mutual, diverse, and sincere interactions between different social groups engaged in deliberation. Based on the deliberation dimension, we developed responsiveness (degree of reciprocal communications), inter-linkedness (connections between diverse actors and proposals), and commitment (degree of equal commitment) indicators by considering various digital environments. We operationalize each indicator later in detail.
3.Case study: Two rounds of the OmaStadi participatory budgeting project
Participatory budgeting (hereinafter, PB) – a process in which citizens engage in allocating a public budget (Peixoto, 2009; Peixoto & Fox, 2016; Sintomer et al., 2016; Touchton et al., 2022) – is a recent yet vibrant democratic practice in Helsinki. The first PB case involved cultural activities for the Oodi Central Library in 2012, which promoted competence for a community-oriented flagship project (Hyysalo et al., 2019) and was then institutionalized in the municipal budgeting system in 2013 via a youth participatory project called Ruuti PB (Rask et al., 2021). OmaStadi is a city-wide PB project based on this context. The basic idea is to encourage residents to initiate ideas for improving the well-being of neighborhoods, co-develop ideas with city experts, and finally allocate a portion of city budgets through a popular vote (Ertiö et al., 2019). The City of Helsinki piloted OmaStadi in 2018–2019 with a €4.4 million budget in the first round and an €8.8 million budget in the second round (OmaStadi 2020–2021).
OmaStadi has a biennial cycle. The first year is dedicated to collective decision-making on PB and involves four stages: 1) proposal (residents initiate ideas), 2) screening (city experts screen all proposals and mark them as either possible or impossible based on eligibility criteria), 3) co-creation (residents develop and combine proposals into formal plans and estimate costs with city experts), and 4) voting (offline/online vote by residents older than 12 years of age). The City of Helsinki employs an open-source participatory platform called Decidim to facilitate an all-in-one platform for initiating, co-developing, and voting for citizen-generated PB proposals. In the following year, the City of Helsinki implements the plans receiving the most votes. OmaStadi is designed to iterate the two-year-long PB process.
A comprehensive evaluation (Rask et al., 2021) and online deliberation monitoring (Shin & Rask, 2021) have both called attention to the overall success of the first round, with recommendations on where it can be improved. The first and foremost improvement point is a lack of democratic equity. During the first round, the voices of some marginalized groups were not adequately reflected in the proposals and deliberation processes due to a lack of experience and resources (Rask et al., 2021). Second, Ertiö et al. (2019) pointed out the lack of synergy between online and offline participatory activities. In the first round, the City of Helsinki hosted more than 100 offline meetings in a range of locations, including brainstorming and co-creation workshops, and promoted active participation (Ertiö et al., 2019; Rask et al., 2021). However, Shin and Rask (2021) found that many people were inactive on the digital platform during the first round. Based on this background information, this article examines the extent to which the quality of online deliberation was enhanced in the second round by using six democratic indicators.
4.Data and methods
4.1Data collection
The primary data source was the OmaStadi platform (https://omastadi.hel.fi), which had adopted the Decidim system (https://decidim.org/). While Decidim offers a comprehensive GraphQL API schema for public access to the database, the second-round data were not available during the data collection period. Therefore, we programmed a custom web scraper in a Python environment and collected first-round data in May 2020 and second-round data in May 2021 that cover the first three stages – proposal, screening, and co-creation – in the two rounds (first round: until April 21, 2019; second round: until May 26, 2021). Since Shin and Rask (2021) found almost no online activity after the co-creation stage in the first round, primarily due to the prolonged summer break in Finland, this article focuses on the earlier deliberation processes. The parsed data contain the proposal ID, proposal title, proposal area (
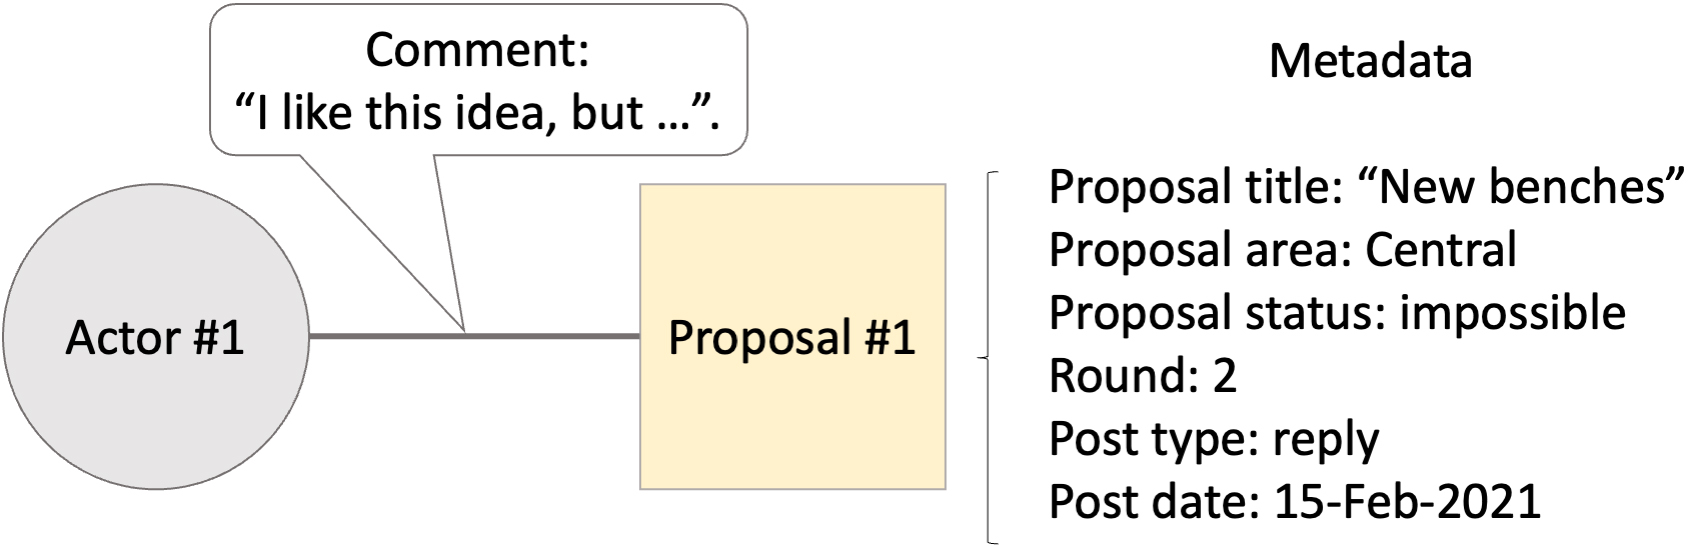
The data collection process was based on a research agreement with the City of Helsinki, and we followed Internet Research: Ethical Guideline 3.0 (Franzke et al., 2020), which provides the updated guideline for Big Data analytics. Based on the guideline, the collected data do not contain any personally identifiable information, with pseudonymized IDs used to prevent personal tracking. Figure 1 provides a graphical representation of the online discussion data we collected. We count one incident of engagement in online deliberation when a person comments on a citizen-generated PR proposal. For instance, assume that Actor #1 posted the following comment for Proposal #1: “I like this idea, but …”. We graphically express the actor and proposal as a circle and square, called nodes, and the comment as an edge. We call a set of actors and proposals connected via comments an actor-proposal network, technically a two-mode or bipartite network. While we did not collect any personal information (e.g., age and gender), we collected metadata on public comments and reconstructed them as network and time-series data (Shin & Rask, 2021).
4.2Deliberative quality indicators and methods
Table 1 summarizes six democratic indicators proposed by Shin and Rask (2021). First, the participation dimension focuses on the volume of online participation. The participation rate indicator measures what percentage of the population participated in online deliberation, calculated by the number of commentator IDs divided by the total population of Helsinki. While Shin and Rask (2021) measured a pool of registered IDs, this article more narrowly focuses on commentator IDs to capture actual engagement in online deliberation in a comparative setting. The activeness indicator measures a longitudinal trend of participation in deliberation. We traced daily and longitudinal trends using moving average and linear regression models (Hamilton, 1994). The continuity indicator measures the durability of online engagement without significant interruptions. We created a binary variable (1: if daily comments exceed 5; 0, otherwise) to measure the consistency of daily activities. Using this variable, we calculated continuity by counting the number of active days divided by the number of days in the investigation period.
Table 1
Deliberative quality indicators
| Indicator | Description | Measurement |
| Participation dimension (volume of deliberation) | ||
| Participation rate | The proportion of residents who engaged in online deliberation | # Commentator IDs/population |
| Activeness | A longitudinal change in active commentators, proposals, and comments | # Comments per day and its trend |
| Continuity | Durability of online engagement without significant interruptions | # Active days/# entire days |
| Deliberation dimension (interaction in deliberation) | ||
| Responsiveness | The proportion of replies to online comments | # Replies/# comments |
| Inter-linkedness | Interactive patterns among actors and proposals | Network visualization, community detection |
| Commitment | Variability in the degree of engagement | Degree distribution |
Source: Revised from Shin and Rask (2021, p. 8).
Figure 1.
Graphical representation of online discussion data.
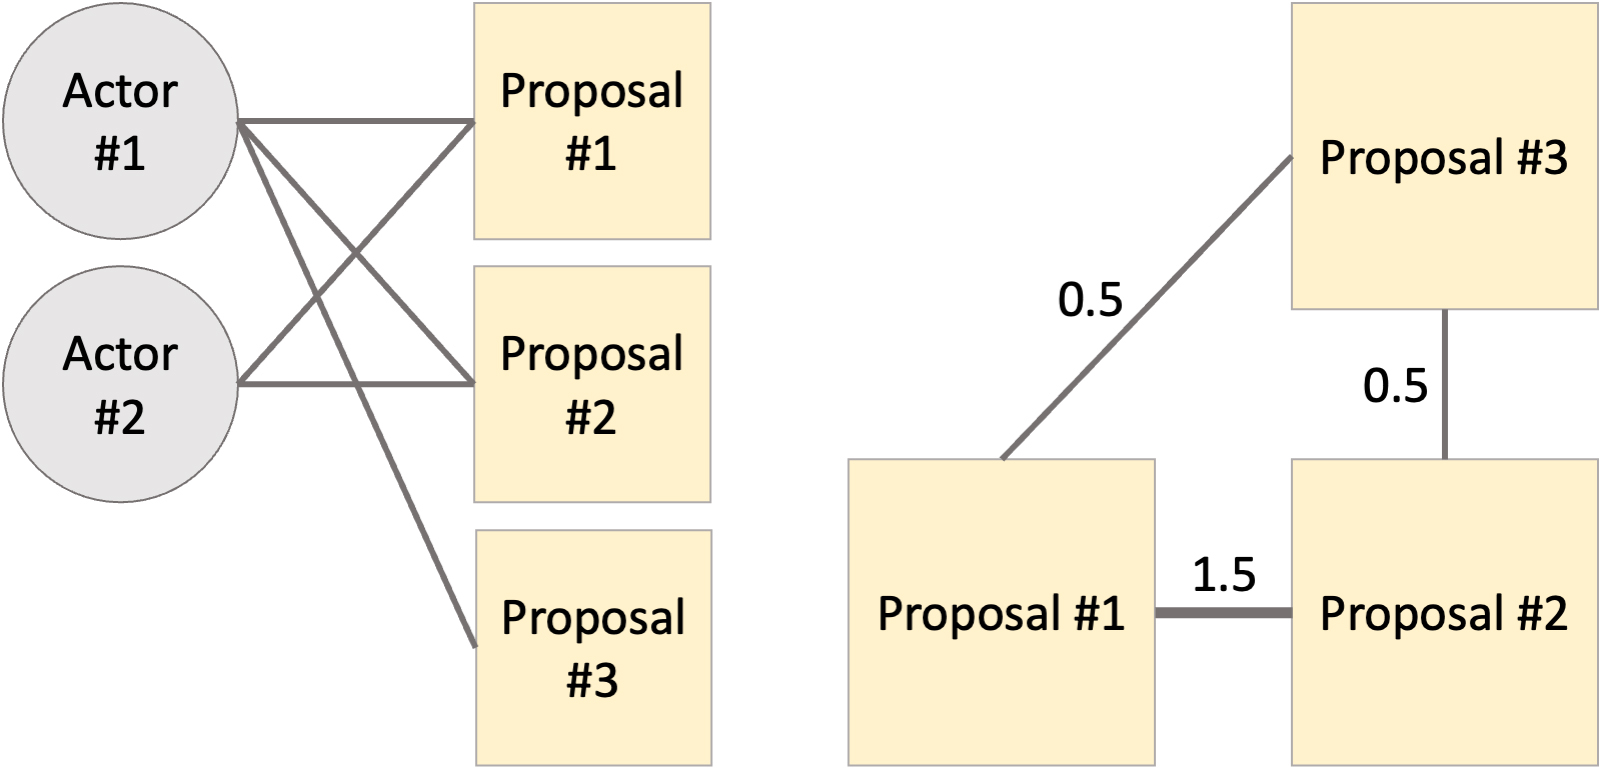
Second, the deliberation dimension focuses on interactions in online deliberation. The responsiveness indicator measures the degree to which comments are reciprocated, reflecting back-and-forth conversations. It is calculated by the number of replies divided by the total number of comments. The inter-linkedness indicator examines who communicates with whom and how proposals are related to each other through a three-step process. The first step is to investigate interaction patterns by visually inspecting actor-proposal networks to check for an abnormal network structure, as shown in Fig. 2a. For instance, Actor 1 commented on three proposals, whereas Actor 2 commented on two proposals. The second step is to use this information to create a new proposal-proposal network for examining indirect interactions between proposals, called a one-mode projection of the two-mode network (Zweig, 2016). A few active participants often engage in many proposals in online deliberation settings, creating challenges for observing proposal-proposal interactions. Following Newman (2001), we addressed this problem by inversely assigning weights to comment ties with a simple equation,
Figure 2.
Graphical representation of a network projection.
We combined network and time-series analyses to calculate the six indicators. A time-series analysis refers to the process of analyzing time-series data, which records data points indexed within specified periods of time to analyze the structural patterns of the observed past data or forecast future trends (Hamilton, 1994). In this article, we used a time-series analysis to measure participation rate, activeness, and continuity in the participation dimension. A network analysis refers to the process of analyzing network data, which records relations between nodes (e.g., actor, protein, and computer) within specified periods of time (Zweig, 2016). We conducted a network analysis to measure responsiveness, inter-linkedness, and commitment in the deliberation dimension.
5.Results
5.1Descriptive statistics
The first case of COVID-19 in Finland was discovered in January 2020, when the second round of OmaStadi was beginning the co-creation stage. The daily confirmed cases rapidly increased to 500 until March 2020, when the Finnish government declared the first state of emergency since World War II (Kuitunen et al., 2020). Lockdowns followed, and all public facilities and shops were closed and gatherings of more than ten people were prohibited. Helsinki, the capital city of Finland, has a dense population, meaning it was gravely affected by the worldwide disaster. It canceled all offline meetings and workshops in the second round. Instead, OmaStadi shifted the whole PB process online and extended the co-creation stage to almost five months, as compared to two months in the first round. The city’s quick response mitigated the shock, a fact reflected in the descriptive statistics.
Table 2 summarizes the two rounds of the OmaStadi project. The first noticeable change in the second round is that the budget doubled in size. It was a welcoming change since only 6.5% of 1,273 proposals had ultimately been selected in the first round due to the initial low budget, making the process highly competitive (Rask et al., 2021; Shin & Rask, 2021). The number of proposals and plans also increased. In the second round, citizens submitted 1,456 proposals, an increase of 14.4 percent compared with the previous round. During the co-creation stage, citizens and experts combined the proposals into 468 plans (the final number was changed to 466) based on their content. Citizens voted on the various proposals in the final stage. On average, 3.1 proposals were transformed into a single plan.
Table 2
Descriptive statistics of OmaStadi’s online data
| Statistics | First round | Second round | Growth rate (%) |
|---|---|---|---|
| Total budget (€mill.) | 4.4 | 8.8 | 100 |
| # Proposals | 1,273 | 1,456 | 14.4 |
| # Plans | 336 | 468 | 39.3 |
| # Comments | 2,699 | 5,740 | 112.7 |
| # Comments/proposals | 1.7 | 3 | 50 |
The number of comments significantly increased from 2,699 to 5,740 in the second round during the investigation period, partly due to the fact that city officials provided the rationale for screening the results or practical guidelines through comments. We believe that such content is also part of the online deliberation process of conveying the voices of those in the city. However, since this article focuses on the interaction (network) and dynamic processes (time series) centered around residents, we excluded comments made by city offices and borough liaisons. Borough liaisons are experts employed by the municipality who help citizens to prepare proposals, facilitate collaborations, and coordinate the implementation of approved PB plans (Rask et al., 2021). Overall, descriptive statistics show that the second round substantially improved the deliberative process despite the pandemic.
In the next subsections, we investigate online deliberation using six democratic indicators.
5.2Participation rate
This article counts participation as occurring whenever people commented on a proposal, a fundamental step in engaging in online deliberation. Therefore, the participation rate indicator measures the number of commentators as a percentage of the Helsinki population. Figure 3 shows that the numbers of commentators were 1,058 and 1,091 in the first and second rounds, respectively. Based on population data for Helsinki (Helsinki Region Infoshare, n.d.), we obtained a 0.16 percent participation rate in the first round and a 0.17 percent participation rate in the second round. This result was somewhat unexpected because the number of comments doubled in the second round (Table 2). It indicates that a few individuals posted many comments in the second round, providing the rationale for excluding city officials’ comment data from the analysis.
Figure 3.
Participation rate.
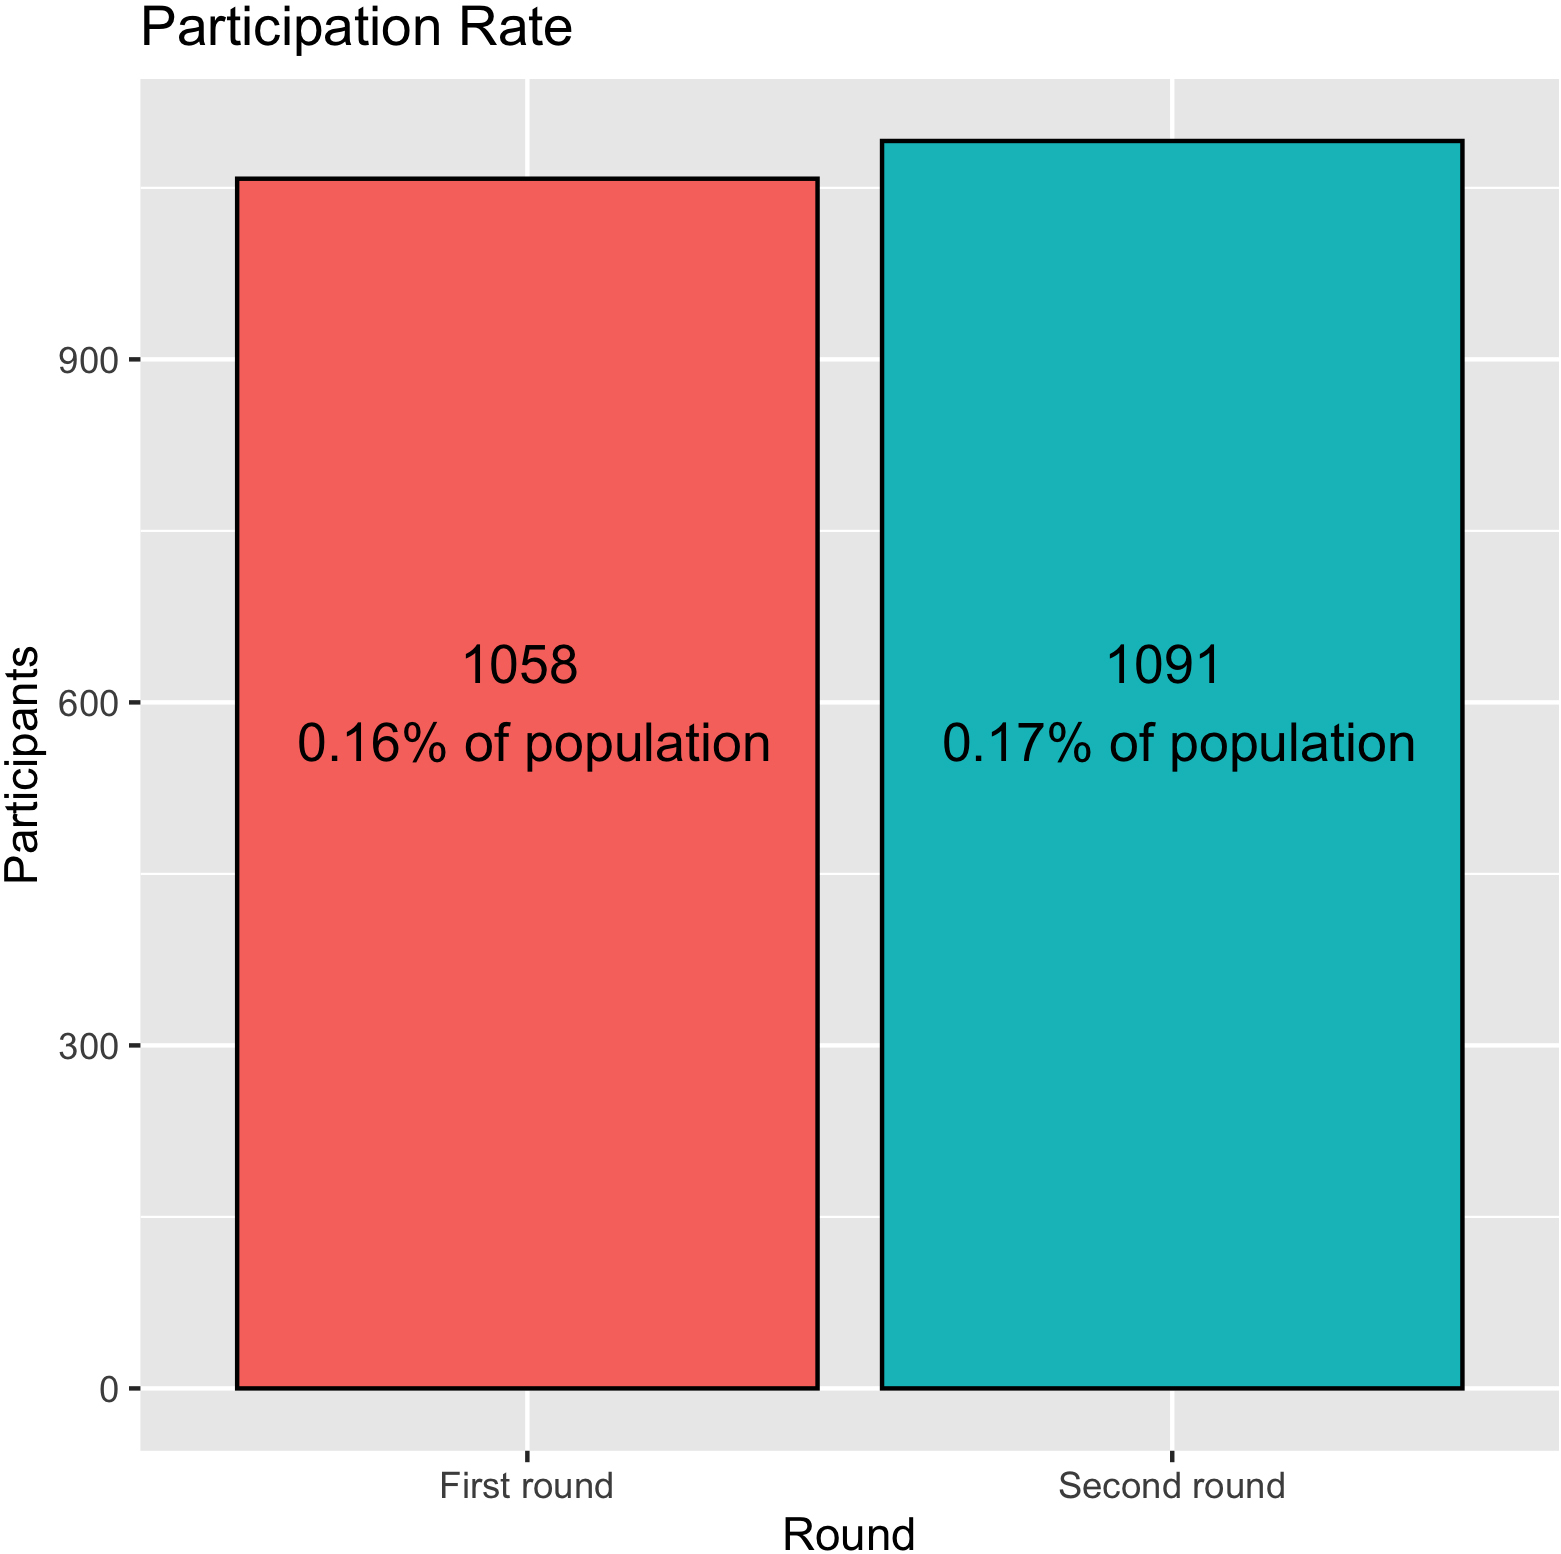
Overall, we found that the participation rate was low and not substantially enhanced in the second round. This is striking, since in general OmaStadi has received significant attention from residents. For instance, the voter turnout in the first round was 8.6% of the population, with 80% of the voting occurring online (Rask et al., 2021, p. 44), a remarkable result because it was the piloted project for distributing 0.1% of the city budget.
The low participation rate is not a problem unique to OmaStadi. Borge et al. (2022) found low online participation rates based on a survey of 34 Catalan municipalities that adopted Decidim, pointing out that it might lead to biased citizen input and a loss of trust and legitimacy. It is difficult to pinpoint a root cause for the problem because many intrinsic and extrinsic reasons influence people’s motivation to participate (Brabham, 2012; Li et al., 2020; Royo et al., 2020). While this calls for a comprehensive evaluation to explore barriers in more detail, it is worthwhile to consider the digital platform (Decidim) itself since the platform design can facilitate or restrict online deliberation (Esau et al., 2017, 2020).
Deseriis (2021) reviewed six existing digital platforms and characterized the Decidim as a “hybrid” model. The platform enables citizens to endorse proposals and comment online, resulting in 3,533 pages of proposals and plans accumulated in the last two OmaStadi rounds (see Table 2). Therefore, it serves as a grand reservoir of citizens’ voices without any flow, requiring more in-depth discussions on synthesizing diverse proposals for allocating the budget. The Decidim platform is hybrid in the sense that it makes it possible to share contact information and event calendars for organizing face-to-face meetings to weigh proposals outside the platform, while the OmaStadi case did not use this function. In other words, Decidim provides deliberation spaces for developing individual PB proposals but relies on other means, including offline meetings, citizen assemblies, Facebook, and Zoom meetings, for the synthesis of proposals. Without the latter function, citizens face challenges in navigating and contributing to fragmented proposals.
Previous studies found that this hybrid model did not work properly since online and offline activities were not seamlessly integrated (Borge et al., 2022; Rask & Ertiö, 2019). Moreover, the COVID-19 pandemic impacted the second round by forcing officials to restrict all offline meetings, exacerbating the condition of participation. Therefore, we underline that the early history of OmaStadi might not be the sole cause of the low online participation rate.
5.3Activeness
The activeness indicator measures the number of daily engagements in online deliberation. Following Shin and Rask (2021), we applied two time-series techniques to monitor activeness trends: moving average and linear regression models (Hamilton, 1994). First, we applied a linear regression model to draw a long trend line that fits the data. An upward trend is a positive signal for activeness. In Fig. 4, the grey lines (with a dark grey area) show daily engagements, whereas the red lines show the linear trend. The linear lines show that neither round had any significant upward or downward trend in the long run, despite drastic spikes when residents submitted their proposals. The spike shows the maximum level of activeness in the year-long deliberation process because public interest generally fades over time.
Figure 4.
Activeness. Note: The grey line shows the number of daily engagements in online discussions. The red line shows the linear trend; the blue line shows the moving average. The shaded areas distinguish different stages: proposal, screen, and co-creation.
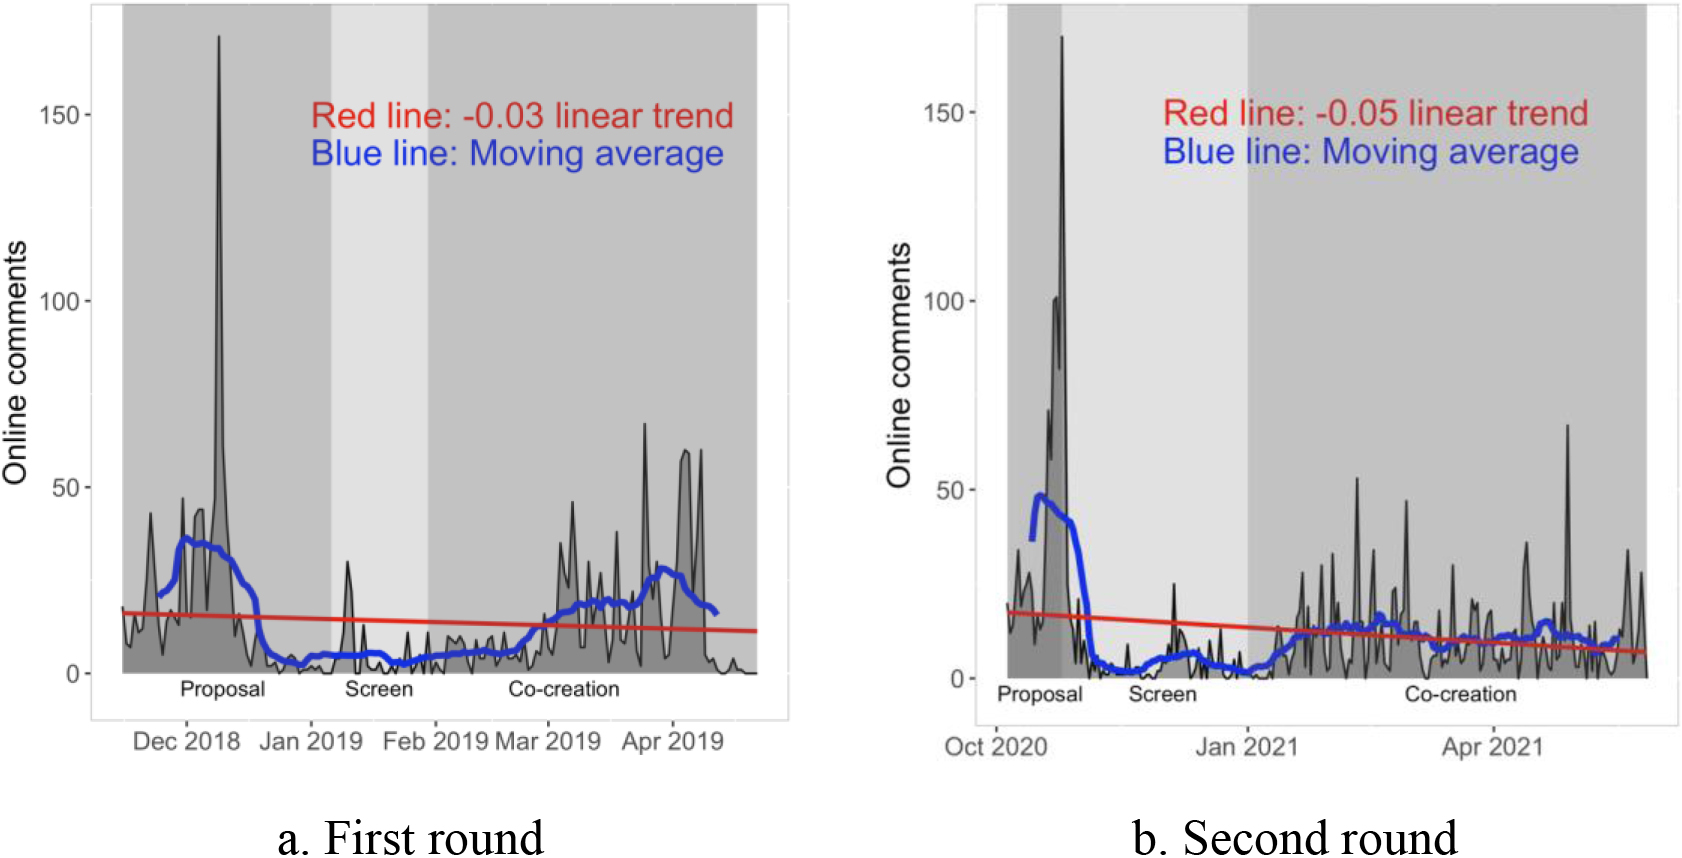
Second, a (simple) moving average was used to smooth out short-term fluctuations with a constantly updated moving average. In Fig. 4, the blue lines show the smoothed trend. We found potential seasonality (a recurring pattern at a fixed period, such as a week or year) of activeness by pairing the two rounds. Activeness as a measure of participation reached its lowest level in both rounds when city officials filtered citizen-generated proposals by labeling them as either “possible” or “impossible” in the screening stage.
Activeness provides three pieces of useful information for monitoring online deliberation. First, it quantifies whether online participation shows an uptrend or downtrend in the long run. Second, it helps researchers detect abnormal daily spikes due to various reasons (e.g., topicality, spam, events) that require a prompt response to facilitate resilient deliberation. Third, it helps actors design deliberation processes for the next round. Based on the two-round data, we learned that the digital platform can temporarily become overloaded because so many people participated in discussions at the proposal deadline, raising the following questions: Is the proposal stage too short for citizens to brainstorm and submit their ideas? Is there a way to disperse the over-concentration caused by specific events? Given the rapid cooling-down period in participation during the screening stage, is there a way to maintain public attention online?
5.4Continuity
The continuity indicator measures the extent to which the digital agora is consistently alive with public engagements. Based on our observations of a low participation rate and fluctuating activeness in both rounds, we investigated system-wide continuity by imposing a threshold. That is, we created a dichotomic variable of continuity: yes, if the number of daily comments was
Figure 5.
Continuity. Note: If the number of daily comments exceeds five in the OmaStadi platform, the corresponding day is filled in with the color black; otherwise, it is filled in with the color white. Therefore, white areas show the days when online participation was inactive.
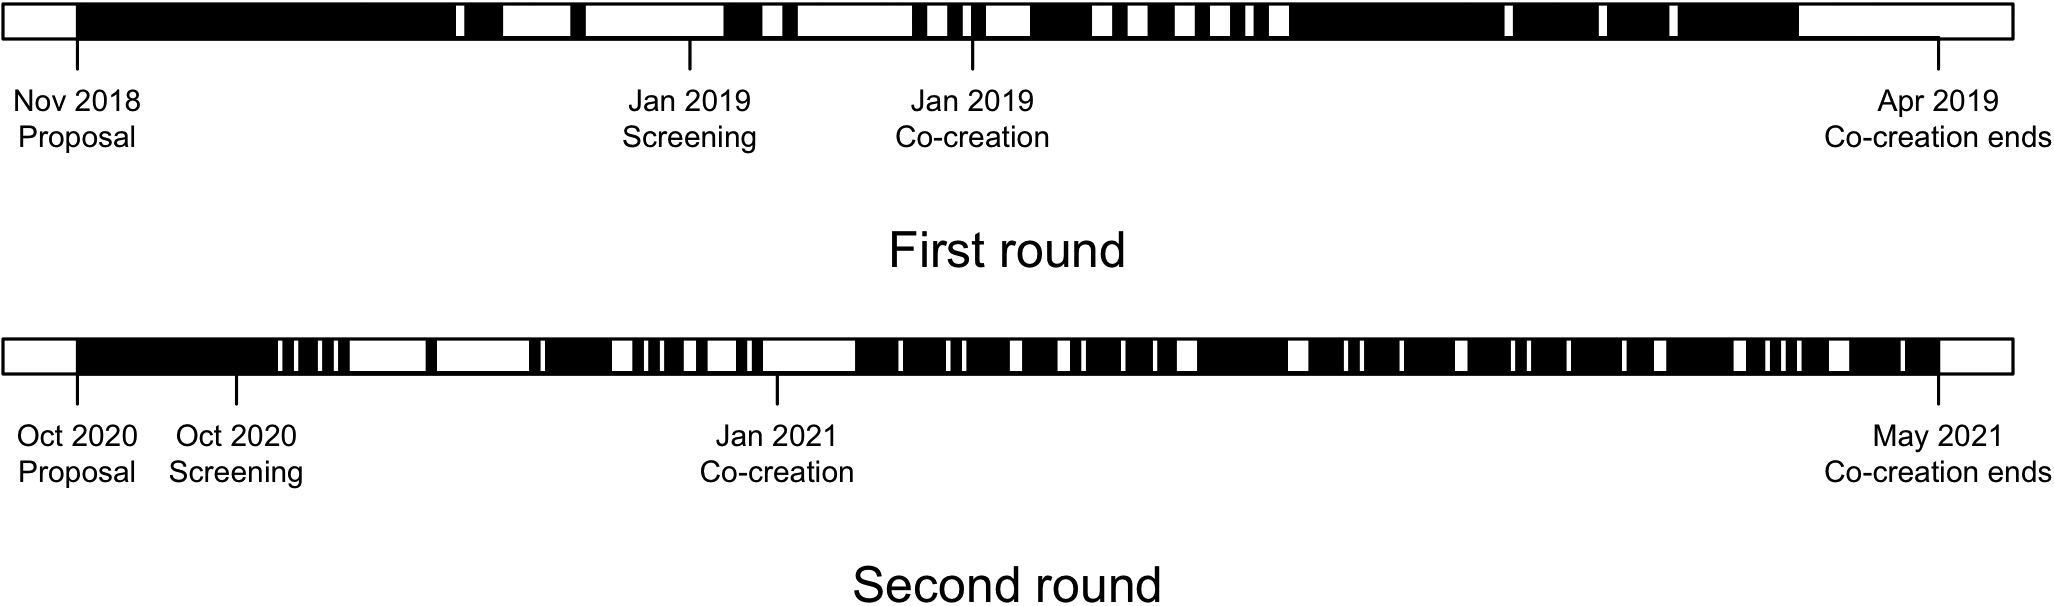
We found that 59.1% of the investigation period demonstrated continuity in the first round and 62.5% in the second round. For instance, if the entire period was ten days, then the first round shows 5.9 days of continuity and the second round 6.3 days, constituting an improvement. It is also insightful to note the high level of durability during the co-creation stage when COVID-19 severely disrupted the local community. It implies that online deliberation can still function quite well even when face-to-face interactions are restricted. We also found significant discontinuation around and during the screening stage, supporting the results regarding activeness.
The results show that continuity improved slightly in the second round. Gutmann and Thompson (2004) have argued that the continuation of deliberation is crucial because it keeps the process dynamic, reflecting citizens’ diverse viewpoints in changing contexts. When the participatory platform is constantly alive, it becomes much easier to motivate inflows of new ideas, actors, and information against dominant perspectives; thus, continuity is a convenient way to measure the prosperity of digital agora. Although the second round showed a slight improvement in continuity, the result was not fully satisfactory because we had set a substantially low threshold of five comments across all proposals per day.
Overall, all three indicators measuring participation rate, activeness, and continuity point to the conclusion that the volume of online deliberation was still low despite minor improvements in the second round of OmaStadi. The results reveal that the significantly increased statistics, such as the number of proposals and comments (Table 2), merely scratch the surface of online participation. We need to be cautious when interpreting the quantified information and triangulate data as much as possible. The rest of the sections thus focus on interactions in online deliberation.
5.5Responsiveness
The fourth indicator, responsiveness, measures the proportion of replies that demonstrate the extent to which online deliberation is reciprocated. In Fig. 6, the light grey area shows the number of total comments, whereas the dark grey area represents the number of replies. We can visually identify two prominent patterns. On the one hand, the second round showed a higher responsiveness rate, specifically 24.7%, as compared to 14.7% in the first round, meaning that citizens created a higher degree of back-and-forth discussions than in the first round. While deliberation “cannot make incompatible values compatible” (Gutmann & Thompson, 2004, p. 11), reciprocal communication creates opportunities to consider the multiple viewpoints of others, which can help clarify or alter their preferences when those arguments have merit (Fishkin, 2009). Therefore, responsiveness is a fundamental trait of deliberation.
Figure 6.
Responsiveness.
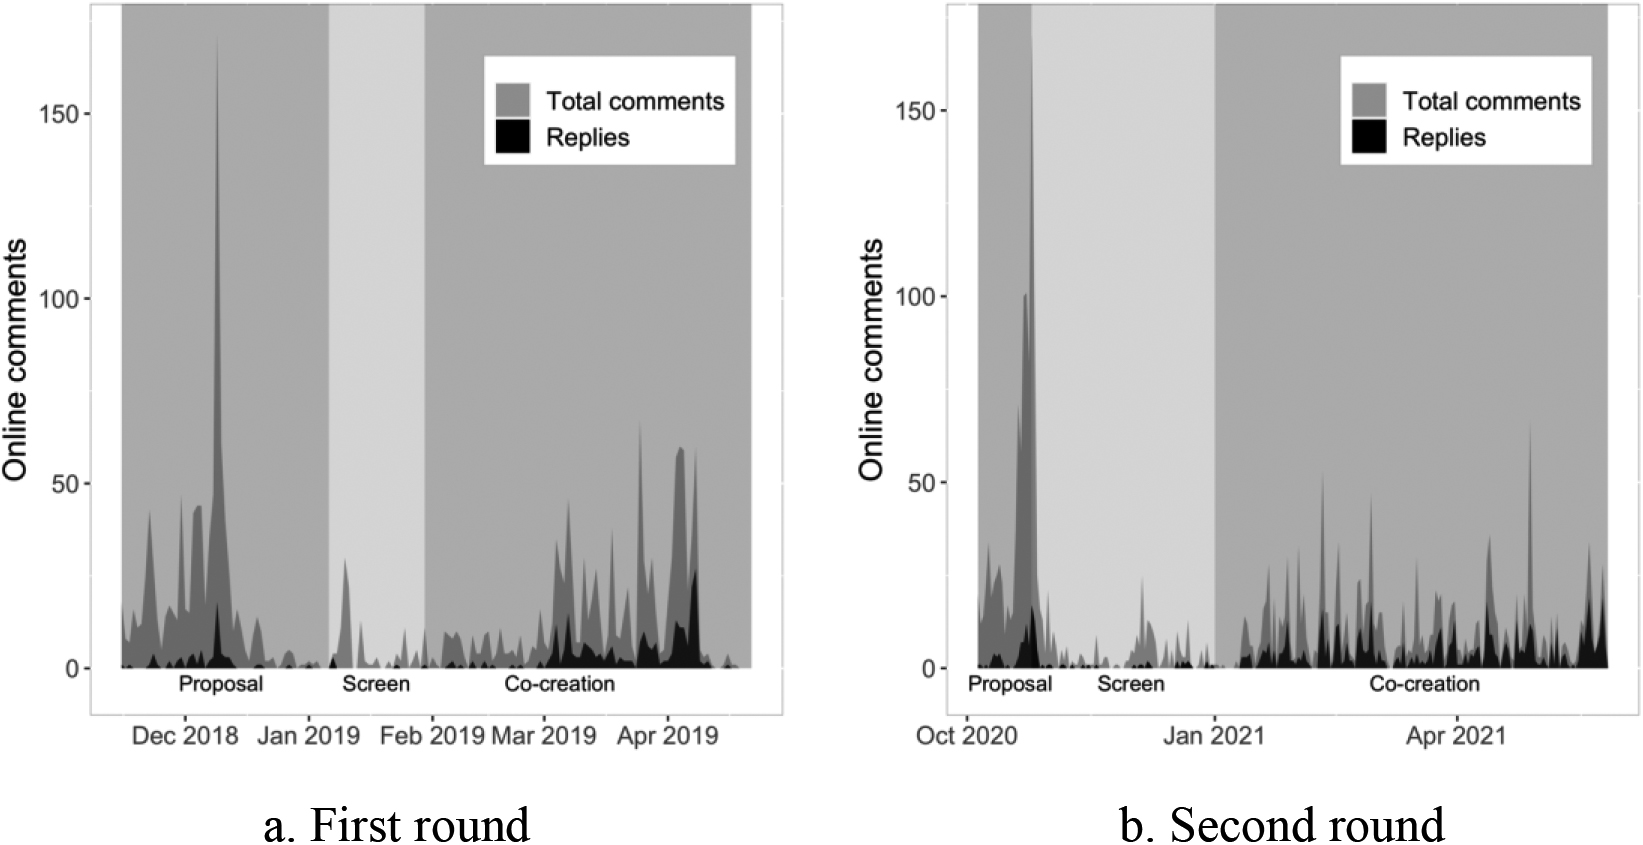
It is also significant that different stages shape different levels of responsiveness. In the first round, responsiveness was only 6.6% in the proposal stage but increased to 22.6% in the co-creation stage. Similarly, the second round showed a responsiveness rate of 8.9% in the proposal stage and 38% in the co-creation stage. This implies that people tend to express simple opinions regarding newly proposed ideas during the proposal stage (e.g., I like this proposal!); they gradually engage in more reciprocal discussions during the co-creation stage.
The increased level of responsiveness in the second round could partly be due to conversations between city officials and proposal organizers on technical matters (e.g., submission guidelines, administrative matters, and meetings). Borge et al. (2022) found a tendency for managerial use of the Decidim platform in their Catalonian case. While such a tendency can improve the transparency and traceability of the participatory process between citizens and public officials, Borge et al. (2022) highlighted that a large proportion of technical communication can also restrict use of the platform to merely collecting proposals and voting on them rather than fostering citizen debate. It is a crucial argument to be tested in OmaStadi. Overall, the results show that responsiveness was substantially increased in the second round, but we acknowledge the need for content analysis to classify discussion contents and measure their democratic quality.
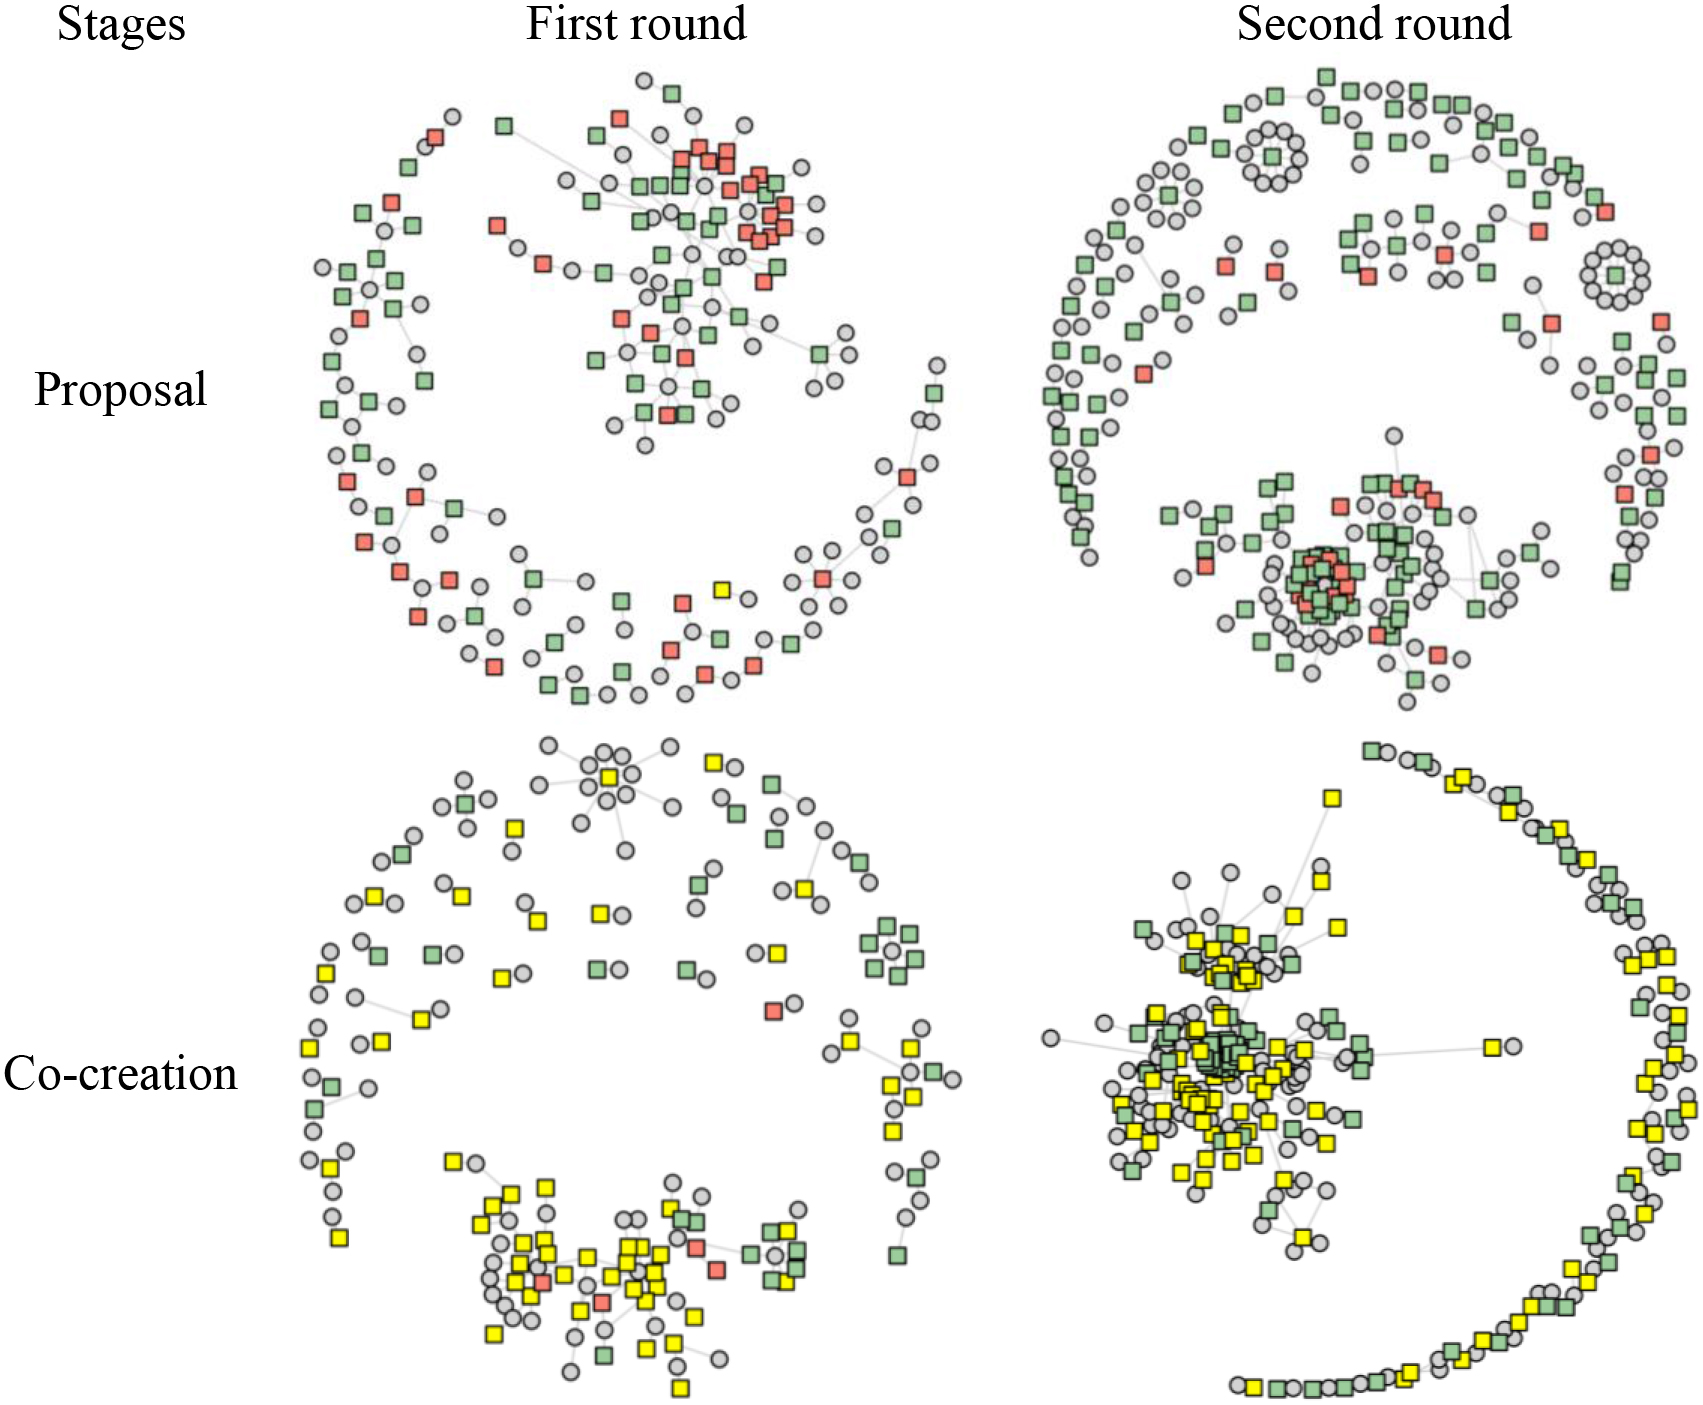
5.6Inter-linkedness
The inter-linkedness indicator explores interactive patterns among commentators and proposals. OmaStadi classifies proposals according to eight categories (east, west, north, south, southeastern, northeastern, central, and the entire City of Helsinki), among which this article focused on the “entire” category, a collection of city-wide proposals. Proposals for the entire/whole city category have received substantial attention from citizens in terms of the proportion of proposals (first round: 20.7%; second round: 27.5%), comments (17.5%; 25.2%), and commentators (16.7%; 24.6%).
Figure 7 visually represents the discussion networks in the entire category. As explained in Fig. 1, circles denote actors, squares denote proposals or plans (red: “impossible” proposals; green: “possible” proposals; yellow: plans), and the ties that connect nodes represent online comments. Here, we have discussed two important aspects of these network graphs. First, the screening stage substantially influenced online deliberation. At the screening stage, city experts labeled 838 out of 1,273 proposals (65.8%) as “possible” in the first round and 1,146 out of 1,456 proposals (78.7%) as “possible” in the second round. While the screening intervention had become more generous (from a 65.8% to a 78.7% acceptance rate), Fig. 7 shows that online comments for “impossible” proposals (red squares) quickly faded from public interest. This transition indicates that residents acknowledge the fundamental mechanism of OmaStadi and strategically shift their focus. Second, we did not find a divided pattern of interactions, as found in certain areas in the first round (Shin & Rask, 2021). Identifying polarized discussion patterns will help resolve conflicts in PB processes.
Figure 7.
Actor-proposal networks in the entire category.
Now, the actor-proposal network during the co-creation stage (Fig. 7) can be converted into a proposal-proposal network (Fig. 8) to explore how proposals (squares) cluster with each other via comments. During the co-creation stage, 94 commentators engaged in 87 proposals and plans with 150 comments in the first round, while 133 commentators engaged in 168 proposals and plans with 280 comments in the second round. Therefore, the second round involved a broader range of commentators and proposals, reflected in a denser proposal-proposal network in Fig. 8b.
Figure 8.
Proposal-proposal networks in the entire category. Note: Squares represent proposals and ties represent comments for the Entire area category. For instance, if Actor A commented on both on Proposals A and B, we drew a tie between the proposals, showing an inter-linkedness. Different colors were assigned based on the Louvain community detection algorithm.
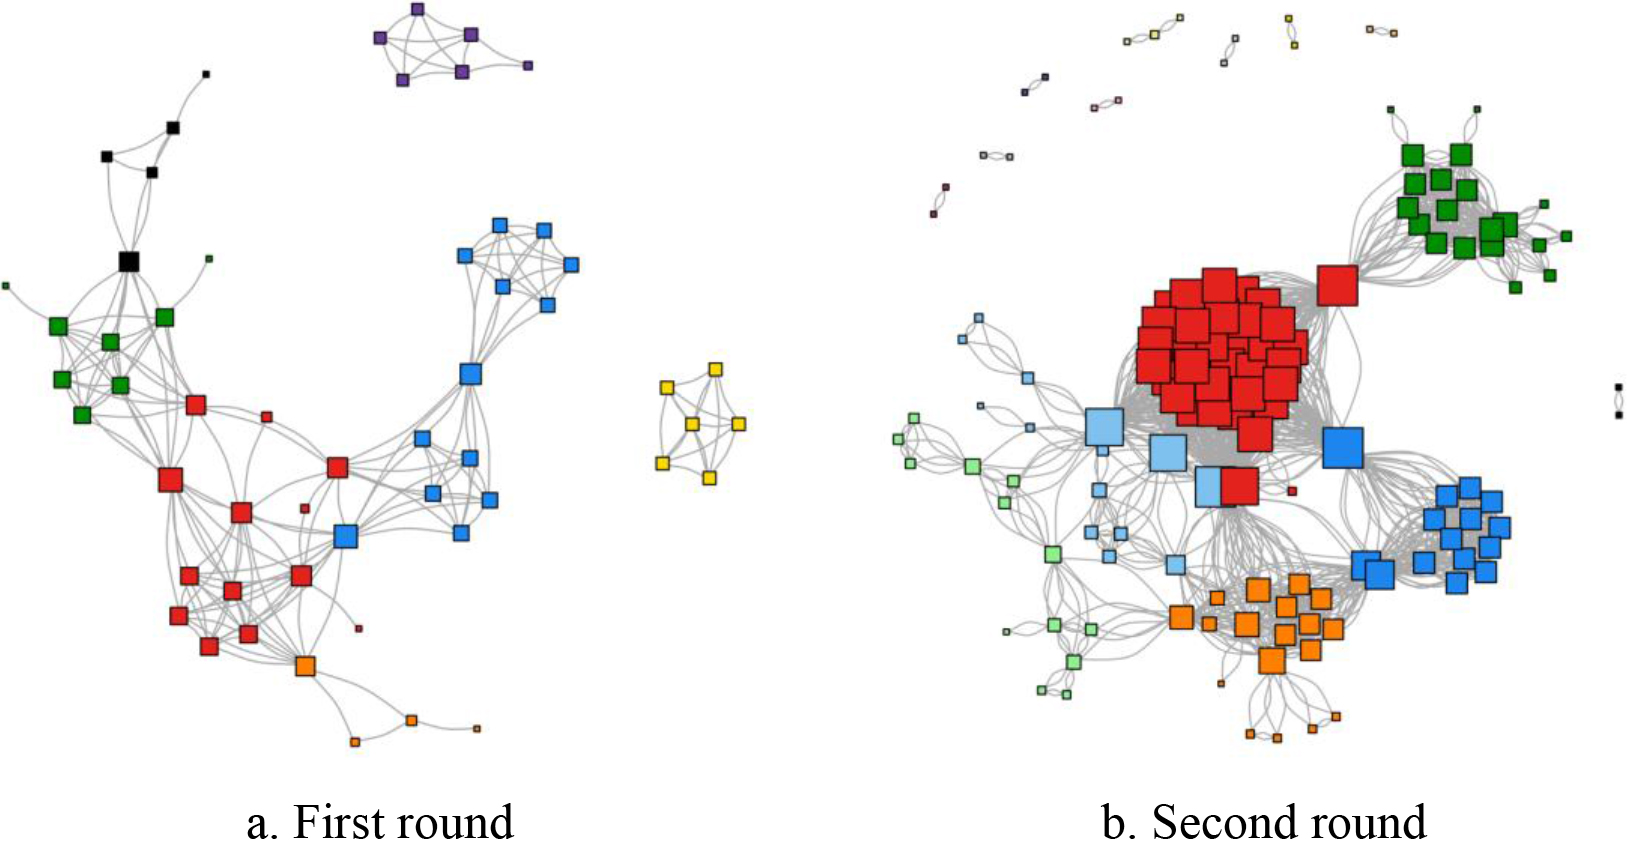
The central proposal groups in both rounds were marked red in Fig. 8. Note that the designation “central” does not mean that they were the “most influential” or “most popular” proposal groups, as measured by the number of comments. Instead, they served as a hub connecting other proposals via comments. For instance, some red-colored proposals received few comments, but they were linked with other popular proposals. In the first round, this group consisted of 13 proposals concerned with the management of urban forests and parks or environmental campaigns; the second-round proposals also shared similar concerns, including a carbon-neutral community, renewables, and wildlife campaigns, with a total of 33 proposals. This result provides crucial information on how proposals interact and create a central PB theme for a locality. By exploring proposal-proposal networks in two rounds, we found that residents raised their voices with respect to environmental concerns regarding parks, outdoor and cultural activities, and campaigns viewed as a city-wide problem. Content analysis of proposals in the first round reflects this finding by showing a large proportion of environmental, equity, and development of communication issues in the entire/whole city category (Rask et al., 2021, p. 11).
5.7Commitment
The commitment indicator measures the varying degrees of participation of commentators and proposals in online deliberation. Figure 9 shows that the distribution curves commonly leaned to the left with long right tails, called a right-skewed (positive skew) distribution. This means that only a few actors were substantially active, and a few proposals received many comments while most of them remained inactive in both rounds. The silent majority on a digital platform could be problematic in the online deliberation context because only a few actors and proposals could dominate the process. While Barabási and Albert (1999) have claimed that high skewness is a universal phenomenon characteristic of many social networks that follow power-law degree distribution, recent studies have found that such empirical networks are rare and that many cases fit traditional log-normal distributions (a bell-shaped distribution) better (Broido & Clauset, 2019). Since there is no clear consensus, we did not test a power-law degree distribution in this article.
Instead, we used skewness to measure varying degrees of participation. Skewness is a straightforward way to measure the extent to which values are equally distributed around the mean (Franceschet, 2011). If it is right-skewed, skewness then becomes positive, indicating many inactive participants, and vice versa. Therefore, a value of skewness close to zero indicates a higher level of equal commitment (data is symmetrical). According to these criteria, we found that residents were more unequally engaged in online deliberation (skewness: 7.3 to 10.3) despite the increasing volume of participation (average: 1.8 to 2.1) in the second round. In terms of proposals, we found that residents were more equally engaged in proposals (skewness: 9.6 to 4.5) with a similar number of comments (average: 2.3 to 2.2). Overall, we found that residents engaged in proposals more equally, yet the gap between inactive and active residents widened in the second round. Conversely, proposals received more equally distributed comments in the second round.
Figure 9.
Commitment.
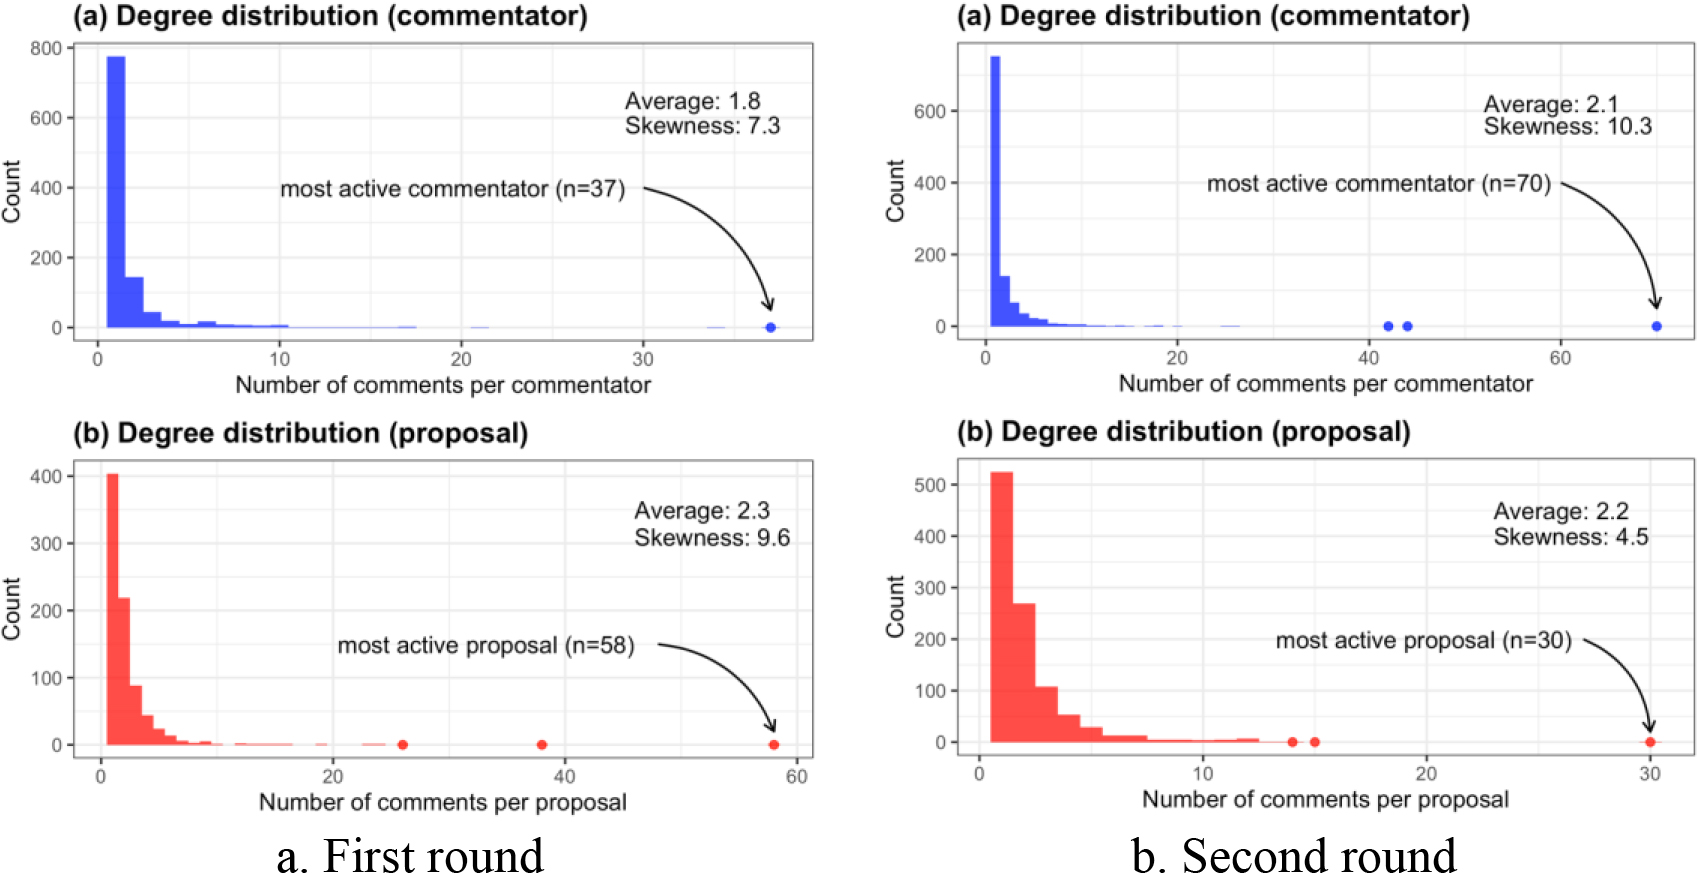
Since Fig. 9 shows the varying degrees of commitment, it helps to introduce follow-up questions. For instance, one could explore the primary backgrounds of the inactive majority and how to promote active engagement in subsequent rounds. In addition, one could focus on why a few proposals attracted substantially more public attention or why some actors stridently voiced their opinions. These questions will contextualize the results, providing fruitful insights into promoting equal engagement.
6.Discussion
This article has compared two rounds of the OmaStadi PB process using six Big Data-based indicators and demonstrated how the resulting indexes can provide valuable information for planners, designers, and researchers of participatory processes. The main empirical findings are summarized in Table 3.
Table 3
Summary of six democratic indicators
| Indicator | Description | Findings |
|---|---|---|
| Participation rate | The proportion of residents who engaged in online deliberation | Unchanged (0.16% and 0.17%) |
| Activeness | A longitudinal change in daily engagement | A similar online activeness pattern (moving average and linear trend) implies high dependency on formal PB stages. |
| Continuity | Durability of online engagement without significant interruptions | Enhanced (59.1% and 62.5%) |
| Responsiveness | The proportion of replies to online comments | Enhanced (14.7% and 24.7%) |
| Inter-linkedness | Interactive patterns among actors and proposals | The entire/whole city category:1) No divided groups detected.2) Proposals concerning environmental issues serve as a hub in linking other proposals. |
| Commitment | Variability in the degree of engagement | While residents participated unequally, proposals received more equal engagement. |
First, the participation rate remained low, indicating that the platform still does not receive much attention from residents. Second, the level of activeness in both rounds interestingly was quite similar in terms of daily and longitudinal trends, strongly implying an association between formal PB stages and the online deliberation profile. Third, continuity was enhanced despite the pandemic, demonstrating the durability of online participatory platforms when physical participatory arrangements are restricted. Fourth, the level of responsiveness shows that residents engaged in more reciprocal deliberation as the PB stages (proposal stage followed by co-creation stage) and PB rounds (first round followed by second round) progressed. Fifth, the level of inter-linkedness shows that environmental proposals served as a hub in connecting many other proposals, implying that residents are concerned with the environment as a city-wide problem. Sixth, the level of commitment shows that the gap between active and inactive participants remained wide, yet proposals received more equal attention in the second round. Overall, the results show that the quality of online deliberation was slightly enhanced during the unprecedented COVID-19 pandemic in the second round but that much greater effort is required in facilitating more active and interactive deliberation.
To test the usefulness of the six indicators, we organized a workshop with the OmaStadi working group in the City of Helsinki. The first time we introduced the indicators, in the context of publishing our first paper on the first round of OmaStadi (Shin & Rask, 2021), we did not have any reference point available. We assume that this was the reason for the difficulty that practitioners had in seeing the practical value of such analytics. The second time we organized the workshop with city experts and presented similar indicator-based results, but with the distinction of comparing the development between the first and second rounds of OmaStadi. The reception by practitioners was quite different that time: the indicators proved highly useful for analyzing the changes resulting from variations in the OmaStadi concept (e.g., operating in merely an online environment, increased investments in transparency, and dissemination of the process), and evaluating the relative success of the second round. Even though some of the indicators are fuzzy in the sense that more qualitative information may be required to fully understand the situation (e.g., why environmental proposals serve as “hubs” for other proposals), they prompted practitioners to build an aggregate-level understanding of the themes and dynamics of the PB process. Practitioners also welcomed new indicators, especially in areas that are linked to the strategy of city inclusion, especially in the area of equity and equality.
In addition to the key insights emerging from this paper, namely that the value of Big Data-based indicators can be substantially increased by comparing the various rounds of the participatory process and thus creating indexes with reference points, three insights for future research emerged based on the results. First, it is possible to develop additional monitoring indicators other than the six we developed. The OmaStadi platform contains many useful functions not used in this article, such as upvote/downvote, flagging, proposal location, and endorsements. We could not use them simply because residents did not use these functions, and there was insufficient data. Big Data analytics will improve when people engage more actively on digital platforms. Topic modeling based on proposal text data would be the most feasible target, complementing our proposal clustering analysis based on comment data. This type of analysis would help detect and cluster citizens’ voices.
Second, our result calls for online deliberation indicators combined with other methods to contextualize the results. Quantitative indicators and figures provide valuable information regarding specific deliberation criteria, albeit without contexts. Multiple actors, including citizens, practitioners, and researchers, need to collectively interpret the results and investigate backgrounds, causes, and solutions. In this regard, Big Data analytics can benefit from other methods, such as participatory observation, in-depth interviews, surveys, and a living lab approach.
Third, it is possible to compare PB cases on the same Decidim platform since the number of adopted cases has risen to 311 instances in 19 countries (Borge et al., 2022). The platform is constantly being updated with new functions, and our proposed indicators should reflect those changes. Decidim’s API coverage has also been improved, creating more opportunities for comparative case studies. However, Decidim was recently switched to open source in 2017 after success in Barcelona, so other recently adopted platforms, including OmaStadi, still need to increase public awareness and participation. In this context, we believe that this article will provide a reference for future comparative case studies.
7.Conclusion
In this paper, we have demonstrated how cases of online deliberation can be compared longitudinally by using automated deliberative quality indicators. Future research could test what can be learned by comparing cases in different contexts. We also observed that some of the indicators developed point-out phenomena that deserve further analytical attention, for example how environmental ideas suggested by citizens may serve as “hubs” for other municipal concerns of the citizenry as a whole.
Acknowledgments
This research was funded by NordForsk and the Academy of Finland, through the COLDIGIT project (no: 100855). The authors acknowledge and thank the editors and anonymous reviewers for constructive comments and recommendations that substantially improved this article.
References
[1] | Agger, A., & Löfgren, K. ((2008) ). Democratic assessment of collaborative planning processes. Planning Theory, 7: (2), 145-164. |
[2] | Aragón, P., Kaltenbrunner, A., Calleja-López, A., Pereira, A., Monterde, A., Barandiaran, X.E., & Gómez, V. ((2017) ). Deliberative platform design: The case study of the online discussions in Decidim Barcelona. International Conference on Social Informatics, 277-287. |
[3] | Arana-Catania, M., van Lier, F.-A., Procter, R., Tkachenko, N., He, Y., Zubiaga, A., & Liakata, M. ((2021) ). Citizen participation and machine learning for a better democracy. Digital Government Research and Practice, 2: (3), 1-22. |
[4] | Barabási, A.-L., & Albert, R. ((1999) ). Emergence of scaling in random networks. Science, 286: (5439), 509-512. |
[5] | Beauchamp, N. ((2018) ). Modeling and measuring deliberation online. In B. Foucault & S. González-Bailón (Eds.), The Oxford Handbook of Networked Communication, pp. 322-349. Oxford University Press. |
[6] | Beierle, T.C. ((2004) ). Digital deliberation: Engaging the public through online policy dialogues. In P. Shane (Ed.), Democracy Online: The Prospects for Political Renewal Through the Internet, pp. 155-166. Routledge. |
[7] | Beste, S., & Wyss, D. ((2019) ). Quantitative methods in democratic innovation research. In S. Elstub & O. Escobar (Eds.), Handbook of Democratic Innovation and Governance, pp. 472-485. Edward Elgar Publishing. |
[8] | Blondel, V.D., Guillaume, J.-L., Lambiotte, R., & Lefebvre, E. ((2008) ). Fast unfolding of communities in large networks. Journal of Statistical Mechanics: Theory and Experiment, 10: , P10008. |
[9] | Borge, R., Balcells, J., & Padró-Solanet, A. ((2022) ). Democratic Disruption or Continuity? Analysis of the Decidim Platform in Catalan Municipalities. American Behavioral Scientist, 00027642221092798. |
[10] | Boyd, D., & Crawford, K. ((2012) ). Critical questions for big data: Provocations for a cultural, technological, and scholarly phenomenon. Information Communication and Society, 15: (5), 662-679. |
[11] | Brabham, D.C. ((2012) ). Motivations for participation in a crowdsourcing application to improve public engagement in transit planning. Journal of Applied Communication Research, 40: (3), 307-328. |
[12] | Bright, J., & Margetts, H. ((2016) ). Big Data and public policy: Can it succeed where e-participation has failed? Policy & Internet, 8: (3), 218-224. |
[13] | Broido, A.D., & Clauset, A. ((2019) ). Scale-free networks are rare. Nature Communications, 10: (1), 1-10. |
[14] | Chang, V. ((2018) ). A proposed social network analysis platform for big data analytics. Technological Forecasting and Social Change, 130: , 57-68. |
[15] | Choi, S. ((2014) ). Flow, diversity, form, and influence of political talk in social-media-based public forums. Human Communication Research, 40: (2), 209-237. |
[16] | Cohen, J. ((2003) ). Deliberation and democratic legitimacy. In M. Derek & J. Pike (Eds.), Debates in Contemporary Political Philosophy: An Anthology, pp. 342-360. Routledge. |
[17] | Connelly, R., Playford, C.J., Gayle, V., & Dibben, C. ((2016) ). The role of administrative data in the Big Data revolution in social science research. Social Science Research, 59: , 1-12. |
[18] | Dahlberg, L. ((2001) ). The Internet and democratic discourse: Exploring the prospects of online deliberative forums extending the public sphere. Information, Communication & Society, 4: (4), 615-633. |
[19] | Davies, J., Arana-Catania, M., Procter, R., van Lier, F.-A., & He, Y. ((2021) ). A mixed-methods ethnographic approach to participatory budgeting in Scotland. Proceedings of the Conference on Information Technology for Social Good, pp. 317-320. |
[20] | Davies, J., & Procter, R. ((2020) ). Online platforms of public participation: A deliberative democracy or a delusion? Proceedings of the 13th International Conference on Theory and Practice of Electronic Governance, pp. 746-753. |
[21] | Deseriis, M. ((2021) ). Reducing the burden of decision in digital democracy applications: A comparative analysis of six decision-making software. Science, Technology, & Human Values, 01622439211054081. |
[22] | Dryzek, J.S. ((2009) ). Democratization as deliberative capacity building. Comparative Political Studies, 42: (11), 1379-1402. |
[23] | Eck, A., Cazar, A.L.C., Callegaro, M., & Biemer, P. ((2019) ). Big Data meets survey science. Sage Publications. |
[24] | Elgendy, N., & Elragal, A. ((2014) ). Big data analytics: A literature review paper. In P. Perner (Ed.), Advances in Data Mining. Applications and Theoretical Aspects. ICDM 2014. Lecture Notes in Computer Science, Vol. 8557, pp. 214-227. Springer, Cham. |
[25] | Elstub, S., Thompson, R., Escobar, O., Hollinghurst, J., Grimes, D., Aitken, M., McKeon, A., Jones, K.H., Waud, A., & Sethi, N. ((2021) ). The resilience of pandemic digital deliberation: An analysis of online synchronous forums. Javnost-The Public, 28: (3), 237-255. |
[26] | Ertiö, T.-P., Tuominen, P., & Rask, M. ((2019) ). Turning Ideas into Proposals: A Case for Blended Participation During the Participatory Budgeting Trial in Helsinki. In P. Panagiotopoulos, N. Edelmann, O. Glassey, G. Misuraca, P. Parycek, T. Lampoltshammer, & B. Re (Eds.), Electronic Participation: 11th IFIP WG 8.5 International Conference, ePart 2019, San Benedetto Del Tronto, Italy, September 2–4, 2019, Proceedings, pp. 15-25. Springer. |
[27] | Esau, K., Fleuß, D., & Nienhaus, S. ((2020) ). Different arenas, different deliberative quality? Using a systemic framework to evaluate online deliberation on immigration policy in germany. Policy & Internet, 13: (1), 86-112. |
[28] | Esau, K., Friess, D., & Eilders, C. ((2017) ). Design matters! An empirical analysis of online deliberation on different news platforms. Policy & Internet, 9: (3), 321-342. |
[29] | Escobar, O. ((2011) ). Public dialogue and deliberation: A communication perspective for public engagement practitioners. Edinburgh Beltane. |
[30] | Fishkin, J.S. ((2009) ). When the people speak: Deliberative democracy and public consultation. Oxford University Press. |
[31] | Fishkin, J.S., & Luskin, R.C. ((2005) ). Experimenting with a democratic ideal: Deliberative polling and public opinion. Acta Politica, 40: (3), 284-298. |
[32] | Fournier-Tombs, E., & di Marzo Serugendo, G. ((2019) ). DelibAnalysis: Understanding the quality of online political discourse with machine learning. Journal of Information Science, 46: , 810-922. |
[33] | Fournier-Tombs, E., & MacKenzie, M.K. ((2021) ). Big data and democratic speech: Predicting deliberative quality using machine learning techniques. Methodological Innovations, 14: (2), 20597991211010416. |
[34] | Franceschet, M. ((2011) ). The skewness of computer science. Information Processing & Management, 47: (1), 117-124. |
[35] | Franzke, A.S., Bechmann, A., Zimmer, M., & Ess, C. ((2020) ). Internet research: Ethical guidelines 3.0. Association of Internet Researchers, 4: (1), 2056305118763366. |
[36] | Friess, D., & Eilders, C. ((2015) ). A systematic review of online deliberation research. Policy & Internet, 7: (3), 319-339. |
[37] | Gastil, J. ((2021) ). A theoretical model of how digital platforms for public consultation can leverage deliberation to boost democratic legitimacy. Journal of Deliberative Democracy, 17: (1), 78-89. |
[38] | Gastil, J., & Black, L. ((2007) ). Public deliberation as the organizing principle of political communication research. Journal of Public Deliberation, 4: (1), 1-49. |
[39] | Geissel, B., & Newton, K. (Eds.). ((2012) ). Evaluating democratic innovations. Routledge. |
[40] | Gonzalez-Bailon, S., Kaltenbrunner, A., & Banchs, R.E. ((2010) ). The structure of political discussion networks: A model for the analysis of online deliberation. Journal of Information Technology, 25: (2), 230-243. |
[41] | Gutmann, A., & Thompson, D.F. ((2004) ). Why deliberative democracy? Princeton University Press. |
[42] | Hamilton, J.D. ((1994) ). Time series analysis. Princeton university press. |
[43] | Helsinki Region Infoshare. (n.d.). Helsinki: Population. Helsinki Region Infoshare. Retrieved September 19, 2021, from https://hri.fi/data/en_GB/group/vaesto. |
[44] | Höchtl, J., Parycek, P., & Schöllhammer, R. ((2016) ). Big Data in the policy cycle: Policy decision making in the digital era. Journal of Organizational Computing and Electronic Commerce, 26: (1-2), 147-169. |
[45] | Hyysalo, S., Hyysalo, V., & Hakkarainen, L. ((2019) ). The work of democratized design in setting-up a hosted citizen-designer community. International Journal of Design, 13: (1). |
[46] | Iandoli, L., Quinto, I., Spada, P., Klein, M., & Calabretta, R. ((2018) ). Supporting argumentation in online political debate: Evidence from an experiment of collective deliberation. New Media & Society, 20: (4), 1320-1341. |
[47] | Jaramillo, M.C., & Steiner, J. ((2019) ). From discourse quality index to deliberative transformative moments. In S. Elstub & O. Escobar (Eds.), Handbook of Democratic Innovation and Governance. Edward Elgar Publishing. |
[48] | Jonsson, M.E., & Åström, J. ((2014) ). The challenges for online deliberation research: A literature review. International Journal of E-Politics, 5: (1), 1-15. |
[49] | Kahila-Tani, M., Kytta, M., & Geertman, S. ((2019) ). Does mapping improve public participation? Exploring the pros and cons of using public participation GIS in urban planning practices. Landscape and Urban Planning, 186: , 45-55. |
[50] | Krishnan, K. ((2013) ). Data warehousing in the age of big data. Elsevier. |
[51] | Kuitunen, I., Artama, M., Mäkelä, L., Backman, K., Heiskanen-Kosma, T., & Renko, M. ((2020) ). Effect of social distancing due to the COVID-19 pandemic on the incidence of viral respiratory tract infections in children in Finland during early 2020. The Pediatric Infectious Disease Journal, 39: (12), e423-e427. |
[52] | Laney, D. ((2001) ). 3D data management: Controlling data volume, velocity and variety. META Group Research Note, 6: (70), 1-4. |
[53] | Li, W., Feng, T., Timmermans, H.J.P., Li, Z., Zhang, M., & Li, B. ((2020) ). Analysis of citizens’ motivation and participation intention in urban planning. Cities, 106: , 102921. |
[54] | Lim, S., & Oh, Y. ((2016) ). Online versus offline participation: Has the democratic potential of the internet been realized? Analysis of a participatory budgeting system in Korea. Public Performance & Management Review, 39: (3), 676-700. |
[55] | Löfgren, K., & Agger, A. ((2021) ). Evaluating the democratic quality of local democratic practices – Sampling seven frameworks. Scandinavian Journal of Public Administration, 25: (3/4), 87-106. |
[56] | Löfgren, K., & Webster, C.W.R. ((2020) ). The value of Big Data in government: The case of ‘smart cities’. Big Data & Society, 7: (1), 1-14. |
[57] | Lowry, P.B., Moody, G.D., & Chatterjee, S. ((2017) ). Using IT design to prevent cyberbullying. Journal of Management Information Systems, 34: (3), 863-901. |
[58] | Maass, W., Parsons, J., Purao, S., Storey, V.C., & Woo, C. ((2018) ). Data-driven meets theory-driven research in the era of big data: Opportunities and challenges for information systems research. Journal of the Association for Information Systems, 19: (12), 1253-1273. |
[59] | Manin, B. ((1987) ). On legitimacy and political deliberation. Political Theory, 15: (3), 338-368. |
[60] | Newman, M.E.J. ((2001) ). Scientific collaboration networks. II. Shortest paths, weighted networks, and centrality. Physical Review E, 64: (1), 16132. |
[61] | Norris, P. ((2001) ). Digital divide: Civic engagement, information poverty, and the Internet worldwide. Cambridge university press. |
[62] | OECD. ((2020) ). Innovative citizen participation and new democratic institutions: Catching the deliberative wave. OECD Publishing. |
[63] | OECD. ((2021) ). Eight ways to institutionalise deliberative democracy. OECD Publishing. |
[64] | Offe, C., & Preuss, U. ((1991) ). Democratic institutions and moral resources. In D. Held (Ed.), Political Theory Today, pp. 143-171. Standford University Press. |
[65] | Parkinson, J., de Laile, S., & Franco-Guillén, N. ((2020) ). Mapping deliberative systems with Big Data: The case of the Scottish independence referendum. Political Studies, 0032321720976266. |
[66] | Peixoto, T. ((2009) ). Beyond theory: E-participatory budgeting and its promises for eParticipation. European Journal of EPractice, 7: (5), 1-9. |
[67] | Peixoto, T., & Fox, J. ((2016) ). When does ICT-enabled citizen voice lead to government responsiveness? Institute of Development Studies, 47: (1), 23-40. |
[68] | Rask, M., & Ertiö, T.-P. ((2019) ). The Co-creation Radar: A comprehensive public participation evaluation model. https://bibu.fi/policy-brief-the-co-creation-radar-a-comprehensive-public-participation-evaluation-model/. |
[69] | Rask, M., Ertiö, T.-P., Tuominen, P., & Ahonen, V. ((2021) ). The final evaluation of the City of Helsinki participatory budgeting: OmaStadi 2018–2020. https://bibu.fi/osallistuvan-budjetoinnin-loppuarviointi/. |
[70] | Royo, S., Pina, V., & Garcia-Rayado, J. ((2020) ). Decide Madrid: A critical analysis of an award-winning e-participation initiative. Sustainability, 12: (4), 1674. |
[71] | Ruess, C., Hoffmann, C.P., Boulianne, S., & Heger, K. ((2021) ). Online political participation: The evolution of a concept. Information, Communication & Society, 1-18. |
[72] | Ruijer, E. ((2021) ). Designing and implementing data collaboratives: A governance perspective. Government Information Quarterly, 38: (4), 101612. |
[73] | Ruijer, E., & Meijer, A. ((2020) ). Open government data as an innovation process: Lessons from a living lab experiment. Public Performance & Management Review, 43: (3), 613-635. |
[74] | Shin, B., & Rask, M. ((2021) ). Assessment of online deliberative quality: New indicators using network analysis and time-series analysis. Sustainability, 13: (3), 1187. |
[75] | Shu, H. ((2016) ). Big data analytics: Six techniques. Geo-Spatial Information Science, 19: (2), 119-128. |
[76] | Sintomer, Y., Röcke, A., & Herzberg, C. ((2016) ). Participatory budgeting in Europe: Democracy and public governance. Routledge. |
[77] | Steenbergen, M.R., Bächtiger, A., Spörndli, M., & Steiner, J. ((2003) ). Measuring political deliberation: A discourse quality index. Comparative European Politics, 1: (1), 21-48. |
[78] | Strandberg, K., & Grönlund, K. ((2018) ). Online deliberation. In A. Bächtiger, J.S. Dryzek, J. Mansbridge & M. Warren (Eds.), The Oxford Handbook of Deliberative Democracy, pp. 365-377. Oxford University Press. |
[79] | Stromer-Galley, J. ((2007) ). Measuring deliberation’s content: A coding scheme. Journal of Public Deliberation, 3: (1), 1-35. |
[80] | Thompson, D.F. ((2008) ). Deliberative democratic theory and empirical political science. Annu. Rev. Polit. Sci., 11: , 497-520. |
[81] | Touchton, M., McNulty, S.L., & Wampler, B. ((2022) ). Participatory Budgeting and Community Development: A Global Perspective. American Behavioral Scientist, 00027642221086957. |
[82] | Touchton, M., Wampler, B., & Spada, P. ((2019) ). The digital revolution and governance in Brazil: Evidence from participatory budgeting. Journal of Information Technology & Politics, 16: (2), 154-168. |
[83] | Vaccari, C., & Chadwick, A. ((2020) ). Deepfakes and disinformation: Exploring the impact of synthetic political video on deception, uncertainty, and trust in news. Social Media+Society, 6: (1), 1-13. |
[84] | Vassakis, K., Petrakis, E., & Kopanakis, I. ((2018) ). Big Data analytics: Applications, prospects and challenges. In G. Skourletopoulos, G. Mastorakis, C.X. Mavromoustakis, C. Dobre & E. Pallis (Eds.), Mobile Big Data, pp. 3-20. Springer. |
[85] | Wang, F., Li, M., Mei, Y., & Li, W. ((2020) ). Time series data mining: A case study with Big Data analytics approach. IEEE Access, 8: , 14322-14328. |
[86] | Zweig, K.A. ((2016) ). Network analysis literacy: A practical approach to the analysis of networks. Springer. |
Appendices
Authors biographies
Bokyong Shin is a Postdoctoral researcher at the Centre for Consumer Society Research, University of Helsinki, Finland. He studies democratic innovations that promote public participation, deliberation, and empowerment, such as collaborative governance, participatory budgeting, and digital participation. He explores new methods for assessing democratic quality and capacity-building by combining qualitative and quantitative approaches, including Big Data analytics (e.g., data mining, natural language processing, network analysis, and time-series analysis).
Mikko Rask is Adjunct Professor of Environmental Policy and Principal Investigator at the Centre for Consumer Society Research, University of Helsinki, Finland. He explores and develops practices of knowledge co-creation and democratic deliberation in the governance of research, innovation and environment. Currently he leads the COLDIGIT project that investigates collective intelligence through digital tools.
Pekka Tuominen is a social and cultural anthropologist specialising on urban transformation, sociocultural qualities of space and citizen participation. He is currently Post-Doctoral Researcher at the University of Helsinki, for Collective Intelligence Through Digital Tools (COLDIGIT). In COLDIGIT he explores innovative tools and spaces for collective intelligence, in which the public sector can collaborate with private and third sector organizations, as well as with other civil society actors, in order to mobilize CI to address societal challenges.


