
Social media use in government health agencies: The COVID-19 impact
Abstract
Government communications typically use social media for federal agencies, national policies, and emergency cases. However, it is crucial to understand the use of these platforms within local government agencies. This investigation fills this gap and includes social media data during three months of the COVID-19 pandemic and compares it with previous trends. The research question that leads this research is: How has government social media use and communication behavior changed due to the COVID-19 pandemic? This research analyzes a study case applied to a local Mexican government agency named ISSEMyM. We analyze the data during the period between October 2017 and June 2020. Findings reveal a consistent use of Twitter and Facebook for communication by the ISSEMyM government agency. Also, it indicates an increase in engagement and communication flow over three years. We found that official local government communications remained unchanged during the whole period. We found no change in interaction, number of followers, and message structure during this period; however, the COVID-19 pandemic radically alters interactions, followers, and user engagement.
1.Introduction
The inclusion of social media (SM) platforms – Facebook, Twitter, Instagram, and YouTube – has become commonplace in government activities. Many government agencies use these online platforms to promote, engage, and interact with citizens and government suppliers. The digital government transformation is an ongoing process at different levels of public administration. There are many organizational challenges, such as creating laws and regulations to adapt to this new trend and creating new and influential positions within the government, for instance, chief information officers, community managers, and SM managers (Valle-Cruz et al. 2020; Criado et al. 2021). SM platforms are part of these organizational and technological challenges for government transformation. They include a wide range of topics, from electoral studies to engagement and implementation research. Some scholars’ research on this topic is related to the SM use in government agencies (Criado et al. 2017; Picazo-Vela et al. 2013; Sandoval-Almazán and Gil-Garcia, 2012). Other research focuses on the interaction or engagement, which results from SM tools (Hao et al. 2016; Basolo and Yerena, 2014; Ferro et al. 2013; Criado et al. 2013). Mergel’s (2012) contribution to this field of research provides a guide to fostering participation, collaboration, and transparency using SM platforms.
However, very little is known about this new kind of interaction between government agencies and SM platforms. In this regard, the arising question is: What empirical evidence of the use of SM in government agencies has been published? Several scholars have studied different perspectives in this field. They focus on SM implementation, and the impact on final users is reported. Nonetheless, government users are not seen as the primary goal of the process. For this reason, this research aims to fill this gap, reporting on the use of SM in an State agency for government personnel in Mexico. This State agency, named Instituto de Seguridad Social del Estado de México y Municipios (ISSEMyM) (Social Security Institute of the State of Mexico and Municipalities), is a state health agency of the State of Mexico, one of the most populous Mexican state. And was created to provide services to public servants. This agency has three main service areas: health services with 112 local medical units – including 14 specialty hospitals and 90 small medical units, and eight medium-sized medical centers.
The ISSEMyM is active in 125 municipalities of the State of Mexico. Additionally, it provides members with social and cultural benefits such as three vacation centers, two-day care centers, one center for senior citizens, and a music school. Finally, this agency manages and sponsors cultural centers, concerts and supports direct benefits – discounts, special prices – for government employees across the state. Even though the ISSEMyM has many functions, this research analyzes only the health responsibility.
The COVID-19 pandemic is transforming government communication as we write this paper. Complex challenges and new combinations of solutions to complex problems are being solved as part of an ongoing process. This research reports a longitudinal study from October 2017 to June 2020. We contrasted here the data collected before and during the pandemic. The SM interaction has never been as crucial as during the COVID-19 pandemic. During the three years before the pandemic, the SM activity differed from what has been observed now. It is important to consider that efforts to combine SM platforms with e-government practices in Mexico are in their initial stages (Sandoval-Almazán and Gil-Garcia, 2012; Picazo-Vela et al. 2013; Basolo and Yerena, 2014; Sandoval-Almazán and Gil-Garcia, 2013; Sandoval-Almazán et al. 2015; Sandoval-Almazán and Valle-Cruz, 2016). However, there is no longitudinal and systematic research on SM implementation in the public sector. For all this, the purpose of this research is to fill this gap. The question that leads our research is: How has government SM use and communication behavior changed due to the COVID-19 pandemic?
The first section of this paper is this ongoing introduction. In the following section, we review the existing literature on SM in governments, SM in communication management, and SM in the context of COVID-19. Next, we provide a detailed description of the research design. The subsequent sections describe and discuss the main findings regarding ISSEMyM public managers’ use of SM platforms during the pandemic. Finally, we present some conclusions, providing evidence of new approaches to SM use by government officials.
2.Literature review
SM technologies have been of interest to public administrations worldwide since the end of the previous decade. In this process, different dimensions of SM in government research have been addressed. This section aims to provide a background to the research on SM in public agencies. It is divided into three subsections: 1) SM in government, 2) SM in disaster communication, and 3) SM and COVID-19. These include changes in the relationship with public servants, new channels for government communication, collaboration in new digital public services, monitoring social demands, and attention to the sentiment analysis of government content on SM.
2.1SM in government
The breadth of research on this topic has grown dramatically since the inception of this new wave of technological innovations in the public sector (Criado et al., 2013). This literature review supports the strong evidence of the use of SM platforms on government communication, government interaction, and emergency management as essential communication channels.
SM in public administration has had an exciting journey thus far. Brainard and McNutt (2010) researched the interaction between Washington D.C. Police Department and citizens via online discussion groups. They developed new ideas regarding how police interact with citizens and found that most activities are transactional and less collaborative. Research from Mergel (2012) is a steppingstone for future works. It collects experiences and systematizes the use of SM in government. This seminal work guides collaboration, participation, and transparency at different levels and areas of government. Her research demonstrates how SM includes different communication stages – push, pull, and networked. However, results indicate that SM is somewhat underutilized by LGs, with about a 70% overall use rate (Graham & Aver, 2013).
On the other hand, Sandoval-Almazán and Gil-Garcia (2012) studied SM platforms’ implementation in Mexico’s LGs. They found how the government’s use of SM has evolved and matured in different regions of this country. Picazo-Vela et al.’s (2013) research, also in Mexico, understood how public health programs use SM to provide better and more cost-effective communication in Puebla’s semi-rural areas. Ferro and colleagues (2013) developed an evaluation framework for assessing SM in governments and tested it in the region of Piedmont, Italy. The tool helped identify problems, strengths, and weaknesses during the implementation of SM for government use in this region. Zheng and Zheng (2014) researched the Chinese government’s microblogging use and found that messages were posted for self-promotion rather than service delivery. This research studied the forms, language, and timing of information, which tended to be “formal and rigid”.
Research from Karakiza (2015) intended to understand the level of penetration of SM in government, characterizing these initiatives and finding how this information structure changed the communication flow between government and citizens.
Hao et al. (2016) analyzed more than 14,910 posts from the 96 most popular government accounts in China. They found that a way of improving interactivity between government and citizens was through original multimedia elements. Sandoval-Almazán and Valle-Cruz (2016, 2020) and Valle-Cruz and Sandoval-Almazán (2020) used innovative frameworks to measure the evolution of SM use in LGs and political campaigns. They found that most innovators came from the northern Mexican region and supported a right-wing political party. Some of these laggards are still linked to Mexico’s oldest and most conservative political party, resisting this technology implementation. Criado et al. (2017) described the use of SM in Spanish municipalities, finding considerable differences in platforms and the evolution of public activities using SM. Nduhura and Prieler (2017) contributed to the case of Rwanda. Their key findings revealed that “SM is increasingly playing a central role in how public institutions coordinate various activities, e.g., meetings and sharing information.”
Another vision of SM use in governments is through engagement and cooperation on SM. SM platforms are changing the communication on governments. On the UAE government, Darwish (2017) studied 25 agencies and examined their communication role. He found that most of them had active participation in “publicity, outreach, marketing, and transparency”, but their level of maturity was not adequate. Following this idea of communication changes, DePaula et al. (2018) proposed three categories for understanding government communication using SM: 1) Information provision includes the direct or public report and public education campaigns, as a one-direction channel and a push strategy, 2) Input seeking is a pull strategy in which governments require information from citizens, is a “two-way asymmetric model”, and 3) Online Dialogue and Offline Interaction means “tools for a dialogue” a conversation to build relationships and collaboration. Complementing this idea, Gruzd et al. (2018) concluded that by building and maintaining their active presence and following the base on SM, especially on Twitter, organizations can develop a capacity to address social concerns during disruptive events or infrastructure projects like ‘The Big Lift.’ Wukich’s (2021) investigation about three U.S. states after hurricane Florence found that citizen involvement efforts were far less common in SM. Few cities convened conversations about their risk exposure or discussed how to build stronger communities. They could create more engagement and did not utilize the total range capacity of SM features in their communication.
2.2Public health communication
This section aims to introduce the topic of SM and public health communication through different studies and scholars. We identify three groups of studies: 1) related to national policies or federal institutions, 2) research from LG and cases studies, and 3) SM and health-related crises.
Rimal and Lapinski (2009) stated that public health communication is essential for three reasons to introduce the first group. The first one, because the communication interventions “do not fall into the social vacuum”, meaning that people encounter and look for information related to health. Secondly, they mention that “it is reasonable to expect discrepancies between messages disseminated and received”. Third, communication is a dynamic process that continuously interchanges their roles. Teichman et al. (2020) evaluated the health care information by Canadian local, provincial, and federal governments during the first five months of the COVID-19 pandemic. They collected communications from government accounts on Facebook and Twitter and analyzed the data. They found cross-platform variations in strategy effectiveness and drew attention to specific, evidence-based practices that could increase engagement with government health information.
Chen et al. (2020), using data scraped from ‘Healthy China’ (official Sina Weibo account of the National Health Commission of China), found that media richness negatively predicts citizen engagement through government SM, but dialogic loop facilitated engagement. Information related to the latest news about the crisis and the government’s handling of the event positively affected citizen engagement through government Zeng and Li (2020) studied 134 CDC government accounts in regions in mainland China during 2009–2020. They concluded that effective communication with the public through two-way interactions still needed improvements. The first group of studies implied that SM was a standard in government offices. However, the use and impact were still on development, and practices with users nor citizens were incipient.
The second group of studies included LGs and case studies. For example, White et al. (2009) supported social networks in crises. Yates and Paquette (2011) reported SM use by the U.S. government in the Haitian earthquake, offering knowledge-sharing and decision-making strategies. Briones et al. (2011) interviewed Red Cross personnel for their research. This research analyzed Twitter and Facebook as a two-way dialogue with different users’ profiles and how they would help overcome obstacles related to time and staff during crises.
Several scholars have provided case studies and examples of the use of SM platforms. For instance, Belblidia (2010) reported on the use of social networks for emergency management in communities as a way of building resilience. Latonero and Shklovski (2011) reported a case study of the Los Angeles Fire Department and highlighted the importance of emergency management and SM engagement using Twitter. In this regard, Chau et al. (2020) researched Twitter impressions of the case of the earthquake in Mexico in 2017. Ogie et al. (2019) proposed crowdsourcing SM data in flood mapping. Deng et al. (2019) reported findings for the location, distance, and online engagement through SM for the Tianjin Port Explosion.
Medina and Diaz’s (2016) research suggested that LGs were reluctant to engage in crisis communication through SM. This fact supports Neely & Collins (2018) and Wukich. (2016) research indicating that government agencies still regard SM as a complementary channel for disseminating information. Cheng (2018) found that the strategy of information created by SM resulted in fewer adverse crisis reactions than the strategies of apology and sympathy. Palen and Hughes (2018) considered how non-technological factors strongly influence SM use on collective, socio-behavioral scales. This second group implied that LGs used SM in different stages. The maturity of the technology – Twitter, Facebook, Instagram – created new strategies for engagement and information communication during a crisis.
The third group of research is SM in crisis. In the health area, Hagen et al.’s (2018) research for monitoring the Zika virus crisis by public officials in the United States found a positive relationship between SM monitoring and satisfaction with the department attending the crisis. Wu and colleagues (2018) researched the SM use to promote public awareness of wildlife conservation. They examined WeChat in China through content analysis of the Pearl River delta, finding that the public was “highly doubtful about the government and experts’ conservation efforts”. A detailed analysis of the same Zika virus by Yoon et al. (2019) found that text, images, and multimedia included in tweets posted in crises increased their effectiveness.
2.3Public health communication and COVID-19
The COVID-19 pandemic generated disruption in organizations worldwide and opened the door for improvisation in government processes. Despite the lockdown, the pandemic boosted the social networks’ functioning to continue with the government to citizen interaction and government functioning. The coronavirus 2019 pandemic has not only caused significant challenges to health systems around the world. However, it has also fueled the wave of numerous rumors, jokes, and misinformation about the disease’s etiology, outcomes, prevention, and cure. Such misinformation has masked healthy behaviors and promoted unfair practices that increase the virus’s spread and ultimately lead to poor physical and mental health outcomes (Tasnim et al., 2020).
This situation emerged the urgent research about SM and COVID-19. Several scholars have published articles focusing on different areas to help with pandemic crises around the world. In SM, Chen et al. (2020) started a Twitter data set about the virus to update and download this specific information. Valle-Cruz et al. (2021) analyzed the effect of the Twitter post in the stock market in the context of two pandemics (COVID-19 and H1N1), finding that the markets reacted 0 to 10 days after the information was shared and disseminated. Cinelli et al. (2020) analyzed Twitter information and found that this platform was fertile ground for rumor propagation and created a negative infodemic. In this regard, there was evidence that people shared fake news about COVID-19 because they did not verify the veracity of the information (Pennycook et al. 2020a). The COVID-19 pandemic has boosted the dissemination of fake news and polarization worldwide (Allcott et al. 2020; Pennycook et al. 2020b). Apuke and Omar (2020) showed that altruism was the most significant factor that predicted fake news sharing of COVID-19, followed by information sharing, socialization, and information seeking. Yang et al. (2020) found the prevalence of low-credibility information on Twitter during the pandemics. sTheir analysis revealed the politicization of the pandemic through this platform. Limaye et al. (2020) supported this idea and added the SM content’s problems to build trust around conspiracy theories and fake news.
On the contrary, supporters of the use of SM in the battle against COVID-19 are Li et al. (2020). They reported their experience on government communication in the Wuhan location using SM tools. They assumed that SM platforms helped reduce the information overload and the friction among the different government levels. They concluded:
“In terms of the information asymmetry and overload issue during the emergency, SM outlet provided critical and timely information for government response in dealing with pandemic and serving the citizens’ needs. It helped the central government not only monitor the LG’s work but also the LG identify residents’ needs on time and provide critical assistance.”
Following this idea, Chen, Min et al. (2020), after analyzing the official Weibo (Chinese Twitter) account of the Healthy China Agency, found several elements to drive citizen engagement through social networks: the emotional valence of the messages: 1) Measured all. The results showed that media richness negatively predicts citizen-government engagement. 2) Dialogic or dialogic loop facilitates citizen-government engagement. 3) Information related to the latest news and the government’s handling of the pandemic positively affects this relationship. In sum, research on the impact of SM platforms in government agencies is promising. The research on emergency management and SM, particularly the case of the pandemic COVID-19, is still ambiguous and complex. However, it is crucial to understand the impact of the information dissemination through Twitter and Facebook regarding the pandemic and the digital transformation of the government structures during and after the event. This research intends to contribute to this subject.
3.Methodology
This research aims to answer the following question: How has government SM use and communication behavior changed due to the COVID-19 pandemic? It focuses on SM, including different tools and perspectives. Our goal, however, is to provide some insights into the problem: the use of SM within government agencies for public servants comparing the pandemic with no-pandemic responses. This section aims to describe the different phases of the research designed to answer the research question, where the object of study is the state agency ISSEMyM.
This research question has been answered in three main stages: 1) Data collection from the ISSEMyM’s SM; 2) Category identification and analysis, and 3) Discussion on findings.
The data collection started in October 2017 after the ISSEMyM Community Manager shared with us the official datasets. The original data format followed internal rules, and all the information was dispersed and not easy to classify. The data were classified into five categories:
1. Attention to digital media: This category included requests, questions, complaints, and petitions from the users. This component also contained different service requests, claims, and questions from users.
2. Institutional tweets. This category grouped the number of official tweets or publications from the community manager to the users.
3. Facebook interactions: This category collected the number of cases attended via Facebook. The number of hits and conversations was not included.
4. Twitter interactions: This category gathered the number of cases attended via Twitter. The number of hits and conversations was not included.
5. Institutional diffusion on SM: This category represented the cumulative number of institutional tweets and Facebook posts.
The data collection finished in June 2020. Data was divided into Twitter and Facebook users, new followers, and sent tweets and posts with official communications. Table 1 shows the total number of tweets, replies (answers), Facebook posts, and Facebook replies or interactions. It is essential to mention that some tweets were not replied because there was no need to do so. On the contrary, some Facebook posts required several answers or interactions. However, the high number of messages from both platforms was evident during the first six months of the pandemic in Mexico.
Table 1
Social network metrics by month (October 2017–June 2020)
| 2017 (October–December) | 2018–2019 | 2020 (January–June) | Total | |
|---|---|---|---|---|
| Tweets | 510 | 3712 | 890 | 5112 |
| Twitter interactions (reply) | 402 | 2799 | 1446 | 4647 |
| Facebook post | 370 | 3188 | 855 | 4413 |
| Facebook interaction (reply) | 1202 | 14105 | 14586 | 29893 |
Source: ISSEMyM community manager.
Two categories for data classification. The first category: attention to SM. This category summarized all the cases, information requests, and users’ needs received on Twitter and Facebook. The second category: Twitter and Facebook interactions were separated and counted differently. The official datasets only recorded the number of requests, claims, and queries from the users. We did not have more detailed data like gender, age, agency name, or days and hours information. Another remark for this investigation, “users” and “followers” from Twitter and Facebook are considered public servants that work in the government of the State of Mexico. Our research did not study citizens or the general public, even if they wanted to follow the agency website. Then, data were collected monthly by the ISSEMyM community manager and sent to the researcher for analysis.
4.Findings
This research aimed to understand the use of SM platforms within local health agencies and compared this behavior in the context of a crisis like COVID-19. A first approach based on our data was that SM created interactions with public servants through ISSEMyM’s Twitter and Facebook accounts. This interaction was affecting decisions. A second approach was that interaction changed radically due to emergency conditions such as the COVID-19 pandemic. Table 2 describes the number of ISSEMyM Twitter and Facebook followers from October 2017 to June 2020. This section has been divided into two subsections. The first one is devoted to Facebook interactions with the agency, and the second subsection describes the findings from Twitter.
4.1Facebook and ISSEMyM
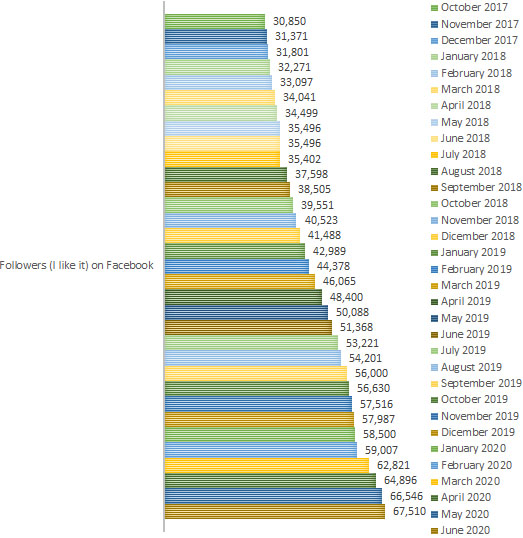
Our data analysis revealed a consistent increase in new followers on the Facebook page, around one to two thousand every month since the first measurement in 2017. Also, there was a persistent increase of one thousand new followers every December (2017, 2018, 2019). The ISSEMyM community manager mentioned that the government information reduced considerably that year and public servants’ attention usually fell. Both patterns remained constant until February 2020. The COVID-19 pandemic emergency arrived in Mexico in March 2020. Since then, numbers have gone up dramatically. The overall average from 2017 to February 2020 stood at 41,477. During the pandemic period (March-June 2020), the average was 49,024 followers. This number represents an 18-percent increase in followers during the pandemic (see Fig. 1).
Figure 1.
Numbers of new followers by month (October 2017–June 2020).
The ISSEMyM is a local agency, and one of its functions is to provide a health care system to government personal. Its services and public announcements such as COVID-19 recommendations, statistics, and warnings are significant and of public interest. Because of this, the interactions with users during this period have been crucial for reducing contagion risks. These interactions are based on the added component named: “Attention to Digital Media”. This component conglomerates all the solved cases received through SM platforms. This component had some exciting peaks in March and August 2018. A possible explanation is the Mexican presidential race that started in April and ended in July that year. During that time, it was illegal to publish government advertising via official sites, including this one. Due to this fact, public servants wanted to answer their claims in March (before the election) and August (after the presidential election). In addition, the August peak reflected an increase in Facebook activities, and the number of new followers on this platform rose too. This finding provides evidence that SM use could be seasonal or periodical.
The number of interactions drastically increased during the COVID-19 pandemic. On average, there were 616 interactions in a regular season, according to data from 2017 to February 2020. During the emergency in March 2020, however, it went up to 3312 interactions. From one month to the next, we observe a fivefold increase in interactions. The average number of interactions from March 2020 to June 2020 was 1189. The number of increases rose by 573 compared to the pre-COVID-19 period (see Fig. 2). These data complemented the number of new users. They revealed an accurate exchange of information between government personnel who used the ISSEMyM services to ask for advice or information about the virus. These interactions could have taken place through the content of the website or the Facebook page. The information was posted there by the community manager.
Figure 2.
Numbers of Facebook interactions by month (October 2017–June 2020).
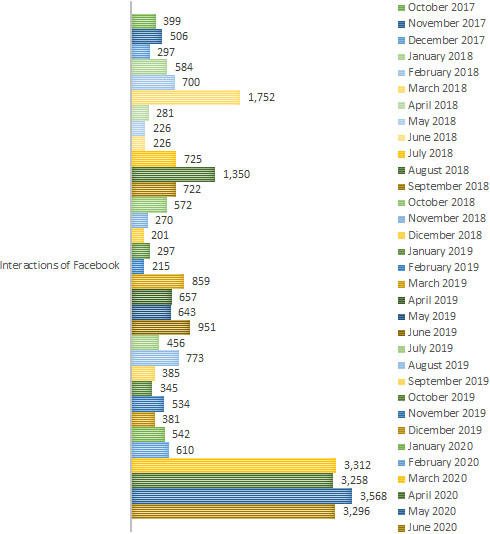
Our data reported that government personnel’s interactions remained constant during the COVID-19 period. This data was not a temporary peak as in March 2018. Instead, the heightened level of interaction remained during April, May, and June 2020. The intensity of Facebook interaction remained relatively stable from March 2020 to June 2020. Figure 2 depicts a sudden and drastic rise in the number of Facebook interactions. This rise coincides with the arrival of the pandemic in Mexico. Compare, for example, the number of interactions in January 2020 (542) and February 2020 (610) with March 2020 (3312), April 2020 (3258), May 2020 (3568), and June (3296). Another worthwhile comparison is Facebook interactions in June 2018 (226), June 2019 (951), and June 2020 (3296). In sum, Facebook results are meaningful, given the success of these platforms for the agency. Usually, it is not easy to maintain several users over time. However, increasing the number of users is crucial because it shows the usefulness of the final user’s online tools. Simultaneously, expanding the number of users produces increasing returns in branding, information diffusion, and bi-directional communication with public servants.
4.2Twitter and ISSEMyM
The case of Twitter is different (see Fig. 3). Twitter was divided into three components: 1) Institutional tweets (the number of official messages sent through this platform. 2) The interactions that the ISSEMyM community manager had sent via Twitter. 3) New followers reported by the platform. There was a consistent increase in Twitter followers on the ISSEMyM accounts every month from 2017 to February 2020. This increment could be related to the increase of new users of emergent technologies and government services. ISSEMyM’s content is almost the same for both platforms, but some differences could foster the use of this platform.
Figure 3.
Institutional tweets and twitter interactions with government personnel – January 2018 to June 2020.
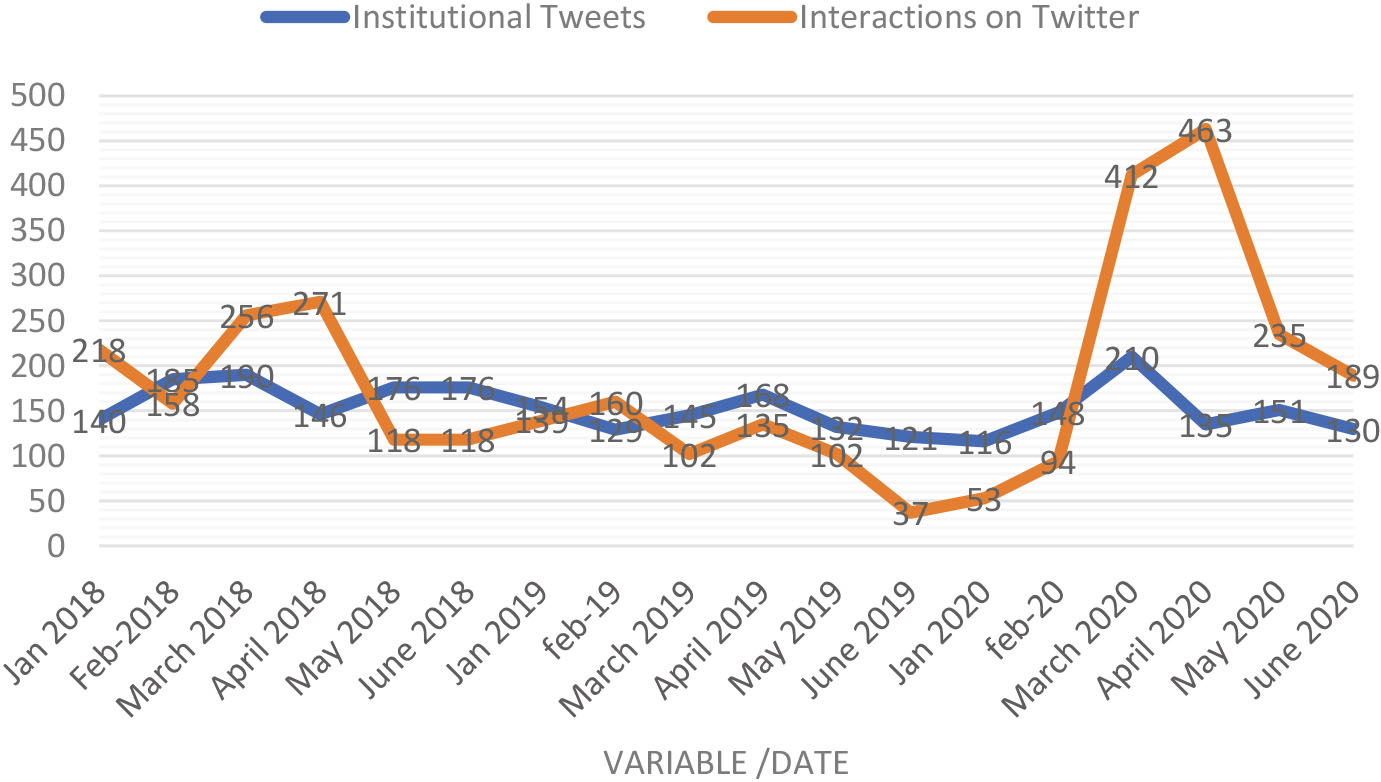
Another finding is that the growth of Twitter followers was consistent before and during the pandemic. A standard increase was around 300–400 new followers per month until February 2020. In March, April, and May 2020, the increase doubled to 1000 new followers per month and dropped in June 2020 to the expected growth of around 300 new followers. This increase in the number of followers during the pandemic is consistent with Facebook. However, the proportion of Twitter users in Mexico is less than Facebook users. Nonetheless, the finding shows consistency in the use of emergent technologies to communicate with users. Even with the pandemic, there are no substantial changes in the number of messages sent through SM platforms, despite the radical increase in the number of followers and tweets in the first months of 2020. The number of messages as tweets sent was related to government announcements or messages. This pattern is shown in a graph in Fig. 4, which compares institutional tweets with interactions. The former did not increase at the same rate as the number of interactions.
Figure 4.
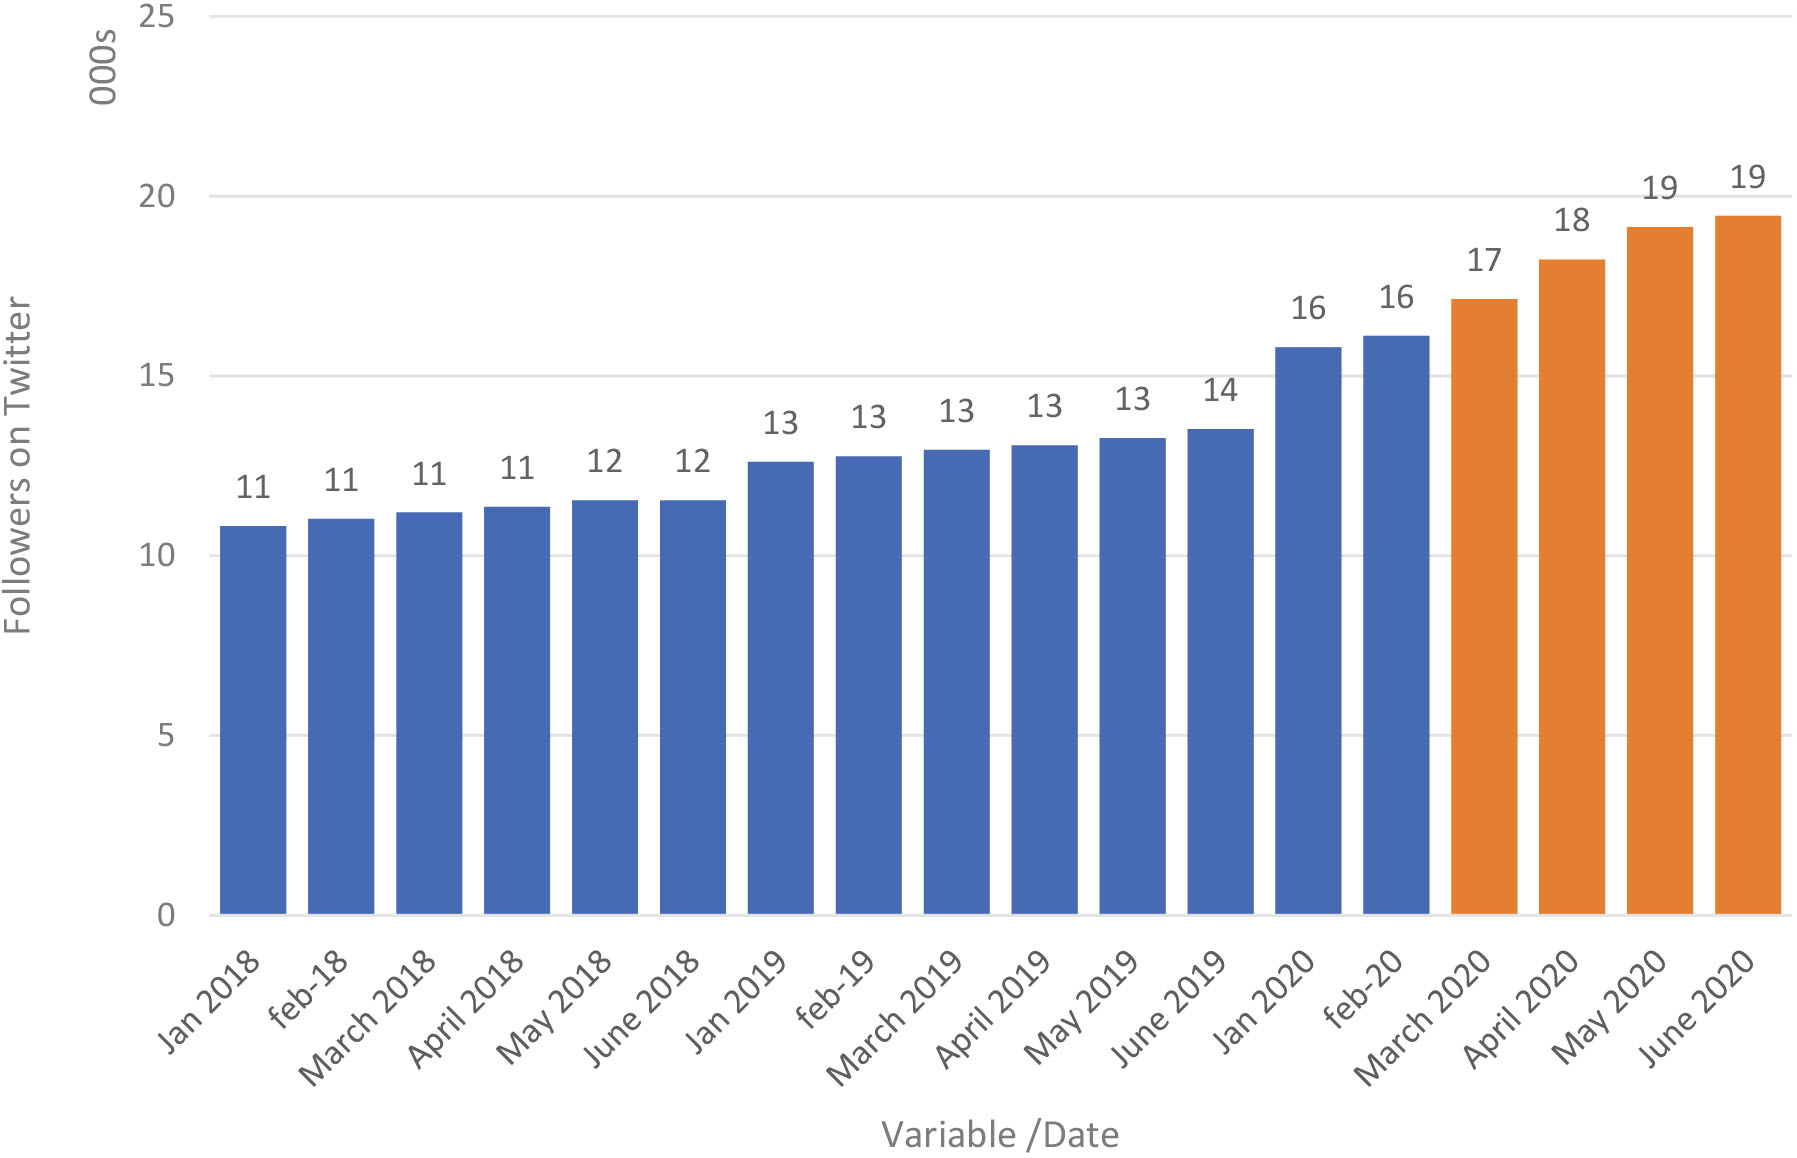
Total number of new twitter followers of the ISSEMyM: Jan 2018 to June 2020.
Furthermore, our data identified a decrease in Twitter interactions throughout 2019. This decrease was consistent with fewer institutional tweets sent in the same period (see Fig. 3). This finding shows a similar pattern to that of Facebook. This idea could support the argument that both platforms behave similarly. Both platforms reduced the number of interactions in the period before the pandemic. Then, during the pandemic, the number of interactions increased. Another alternative to test in future research is the possibility of a different behavior on both platforms of the same agency. This idea may be supported because many ISSEMyM communication strategies focus chiefly on Facebook and less on Twitter.
The number of Twitter followers rose gradually during 2018 (see Fig. 4). During 2019, this gradual rise continued. However, neither in 2018 nor 2019 does the number surpass 15,000. In 2020, the rate of increase in the total number of Twitter followers began to rise rapidly. In June of 2020, this number was nearly 20,000. This finding contradicts the argument for a sustained increase in the number of followers supported by three years of evidence and opens a second perspective; will behavior go back to normal once the emergency ends?
4.3Institutional diffusion and attention to digital media
Institutional diffusion combined all official messages through Facebook and Twitter sent to users, mainly official campaigns for vaccination, information related to diseases, or services from the ISSEMyM agency. Attention to the digital media category included all requests, questions, complaints, petitions from users through SM platforms answered by the community manager and public manager officials. Our data collected and presented in Fig. 5 points to a significant increase in attention to digital media in March 2020. The numbers rose from 703 claims in February to 3,274 claims in March. These represent more than a fourfold increase in the standard number of claims. A similar peak was observed in 2018, but it was temporary. The intensity of attention to digital media went back to normal in the following month. Nothing is comparable to March-June 2020. During the pandemic, attention to digital media climbed to more than three thousand petitions and only descended a few points in June 2020. Institutional diffusion did not change during the study period, showing a slight increase in March 2020 (506 messages). The average number of messages pre-COVID-19 was 291. A possible explanation is that government officials did not react to the pandemic using SM. They continued with their planned strategy of publications and information as usual.
Table 2
Increases in social network metrics by month (October 2017–June 2020)
| Month | Percentage increase | |||||||||||
| Posts | New facebook likes | Facebook interactions | Twitter followers | Twitter interactions | Attention to digital media | |||||||
| 2017 | ||||||||||||
| October |
|
|
|
|
|
| ||||||
| November | 9% | 1. | 7% | 1% | 1. | 1% | 26. | 8% | 17. | 9% | ||
| December | 4% | 1. | 4% | 2% | 1. | 2% | 3% | 7% | ||||
| 2018 | ||||||||||||
| January | 1. | 8% | 1. | 5% | 86. | 3% | 1. | 2% | 96. | 6% | 93. | 7% |
| February | 19. | 8% | 2. | 6% | 5% | 1. | 9% | 19. | 9% | 19. | 6% | |
| March | 9. | 8% | 2. | 9% | 62. | 0% | 1. | 6% | 150. | 3% | 109. | 4% |
| April | 1% | 1. | 3% | 5. | 9% | 1. | 4% | | 0% | | 5% | |
| May | 43. | 8% | 2. | 9% | 5% | 1. | 6% | 6% | 7% | |||
| June | 0. | 0% | 0. | 0% | 0. | 0% | 0. | 0% | 0. | 0% | 0. | 0% |
| July | 6% | | 3% | 0. | 0% | 1. | 5% | 220. | 8% | 145. | 1% | |
| August | 17. | 0% | 6. | 2% | 5% | 0. | 7% | 86. | 2% | 71. | 4% | |
| September | 5. | 1% | 2. | 4% | 4. | 2% | 1. | 6% | 5% | 2% | ||
| October | 3. | 6% | 2. | 7% | 12. | 1% | 1. | 5% | 8% | 8% | ||
| November | 3% | 2. | 5% | 67. | 6% | 0. | 9% | 8% | 2% | |||
| December | 4. | 5% | 2. | 4% | 2% | 1. | 2% | 6% | 4% | |||
| 2019 | ||||||||||||
| January | 4. | 3% | 3. | 6% | 56. | 2% | 1. | 4% | 47. | 8% | 50. | 3% |
| February | 5% | 3. | 2% | 15. | 1% | 1. | 3% | 6% | 3% | |||
| March | 8% | 3. | 8% | 3% | 1. | 4% | 299. | 5% | 160. | 5% | ||
| April | 24. | 8% | 5. | 1% | 32. | 4% | 1. | 0% | 5% | 7% | ||
| May | 5% | 3. | 5% | 4% | 1. | 6% | 1% | 9% | ||||
| June | 7% | 2. | 6% | 7% | 1. | 9% | 47. | 9% | 32. | 6% | ||
| July | 0% | 3. | 6% | 3% | 3. | 0% | 1% | 0% | ||||
| August | 1% | 1. | 8% | 10. | 7% | 2. | 1% | 69. | 5% | 66. | 1% | |
| September | 76. | 9% | 3. | 3% | 122. | 6% | 3. | 6% | 2% | 5% | ||
| October | 8% | 1. | 1% | 0% | 2. | 0% | 4% | 7. | 5% | |||
| November | 1. | 5% | 1. | 6% | 14. | 3% | 1. | 8% | 54. | 8% | 20. | 9% |
| December | 5% | 0. | 8% | 6% | 1. | 7% | 7% | 3% | ||||
| 2020 | ||||||||||||
| January | 35. | 3% | 0. | 9% | 9% | 1. | 5% | 42. | 3% | 36. | 8% | |
| February | 17. | 4% | 0. | 9% | 77. | 4% | 2. | 0% | 12. | 5% | 18. | 2% |
| March | 45. | 2% | 6. | 5% | 338. | 3% | 6. | 4% | 443. | 0% | 429. | 7% |
| April | 7% | 3. | 3% | 12. | 4% | 6. | 4% | 6% | 2. | 7% | ||
| May | 21. | 9% | 2. | 5% | 2% | 5. | 0% | 9. | 5% | 5% | ||
| June | 9% | 1. | 4% | 6% | 1. | 6% | 6% | 4% | ||||
Source: Author calculations.
Figure 5.
Institutional diffusion via social networks and attention to digital media.
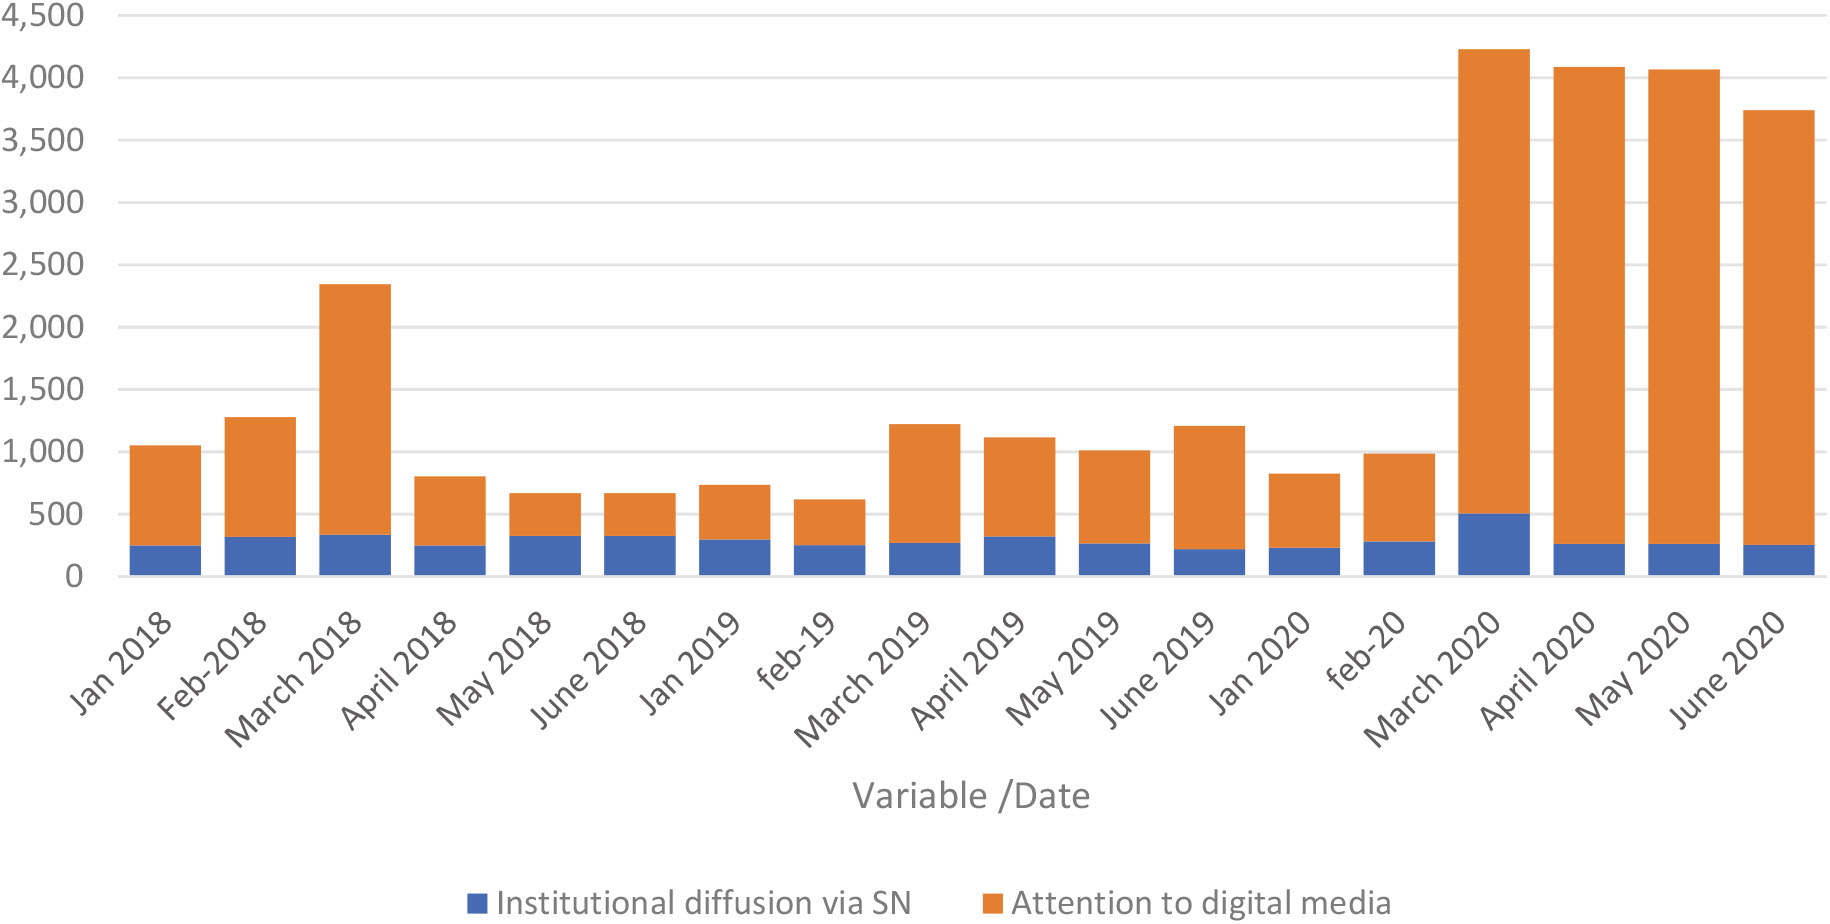
As a result of the pandemic crisis and the lockdown period, we found a dramatic increase in social networking interaction and followers. Nevertheless, the most posts can be found during March 2020, representing the most remarkable growth in social network interaction and increased followers. This behavior increased public health concerns due to the COVID-19 pandemic (see Table 2).
5.Discussion
This paper aims to understand the use of SM platforms within government agencies before the pandemic and the first three months of the lockdown. The research question that leads this investigation is: how has government SM use and communication behavior changed due to the COVID-19 pandemic? This investigation provides evidence to support the idea that SM platforms are used to manage and foster LG communication. The longitudinal data from the ISSEMyM, from 2017 to 2020, confirms the argument regarding online communication put forward by Mergel (2012) and Criado et al. (2013) and reinforces the conclusions drawn by Sandoval-Almazán and Gil-Garcia (2012) concerning the use of these platforms in LGs in Mexico. It also supports the categories from De Paula et al. (2018) about information provision as a primary goal.
However, the institutional diffusion of messages and communications using SM is still in its infancy. The data analysis points to very slight changes over time in terms of the community manager’s messages. This official diffusion depends mainly on an LG strategy. The agency does not plan to promote institutional communication. This idea reinforces the conclusions drawn by Zheng and Zheng (2014), which mentions that official messages tend to be formal and rigid.
A different view comes from the variable level of attention paid to digital media. The analyzed data show a consistent increase in user interactions through Twitter and Facebook throughout the studied period, especially at the beginning of the COVID-19 outbreak in Mexico. Data confirms Karakiza’s (2015) argument regarding creating a communication flow between government and citizens. This data also supports the conclusions reached by Nduhura and Prieler (2017) that public institutions could share information using SM.
In terms of the platform perspective, the analysis clarifies that Facebook interaction is more dominant than Twitter. This type of dominance could be explained because Facebook has more users in Mexico and is more popular. Data analysis confirms the conclusions drawn by Haro-de-Rosario et al. 2016; and Hughes et al. 2014 that SM platforms have similar interactions or behave according to the same government implementation strategies. However, it could also confirm Hao et al. (2016) conclusions regarding multimedia media elements to promote two-sided interactions. This idea could also support the conclusions of Sandoval-Almazán and Valle-Cruz (2016), who found that the most innovative LGs in Mexico are the ones that use popular technologies.
The data analysis from the ISSEMyM highlights a drastic change in terms of SM usage when the COVID-19 pandemic started. The number of interactions on both platforms rose. This idea is consistent with conclusions regarding different disaster communication events (White et al., 2009; Yates and Paquette, (2011) Deng et al., 2019). The use of SM in Mexico is not new. Picazo-Vela et al. (2013) researched public health programs in Puebla using SM and concluded that doing so led to better communication and cost-efficiency. Nduhura and Prieler (2017) concluded that SM plays a central role in public institutions’ coordination. This idea is consistent with the increase in the attention paid to digital media, which experienced a fivefold increase. Finally, Hagen et al. (2018) confirmed that using these platforms increases efficiency and satisfaction during crises. An answer to the research question: the COVID-19 pandemic altered the three components of SM in the ISSEMyM agency. It increased the number of followers on both platforms, drastically enlarged tweets and messages, and augmented interactions fivefold. The data analysis also confirms a significant difference between the expected period of interaction and the crisis event. Data is consistent with current research on the expansion of information to create an infodemic (Cinelli et al., 2020) and the everyday use of SM platforms to deliver COVID-19 messages (Chen et al., 2020)).
Our findings suggest that government communication could be improved using SM platforms (Facebook and Twitter) to communicate with citizens, not only government personnel. In emergencies, our research points that government communication flows faster than average communication, and also, followers increase looking for valuable information for decision making. Furthermore, official communications do not have an impact on the interactions and engagement of users during emergencies. Our research also differentiates crisis communication and non-crisis communication. We provide data on the behavior of users during these two periods of time, which confirms research from Yang et al. (2021), who identified three stages for government communication on Wuhan province development, outbreak, and grace period. Our data support that engagement growth during the outbreak period, and external events such as elections also affect interaction intensity.
6.Conclusions
This research aimed to understand the changes in the use of SM technologies within the ISSEMyM. The longitudinal data analysis demonstrates a consistent use of Twitter and Facebook to communicate with government users in normal circumstances and crises. The research question was: How has government SM use and communication behavior changed due to the COVID-19 pandemic?
Regarding this question, we reached eight conclusions:
1) Three year data show a consistent use of Twitter and Facebook by the ISSEMyM.
2) SM platforms use leads to engage and interact with a two-sided communication and a flow of communication among LG public managers.
3) Twitter and Facebook strategies and interactions work parallel and produce similar followers and interactions.
4) An increase in the number of interactions and attention to SM augments the number of followers on SM platforms.
5) Current institutional messages or strategies do not alter interaction, followers, and messages. More research is required to understand the relation of interaction.
6) External events such as the presidential race and the COVID-19 pandemic alter SM platforms’ interactions.
7) COVID-19 alters the increase in the number of followers.
8) The number of engagements remains at a high for three consecutive months during the crisis.
According to our research question, these conclusions provide an answer in both ways: first, external factors determine the use of SM platforms, and second, the number of interactions is the result of the internal organization of the ISSEMyM and has influenced the rate of growth of followers on Twitter and Facebook. This research contributes to SM studies within governments by providing evidence of the use of these platforms during the COVID-19 pandemic. Another contribution is to expand the field of research to analyze the use of SM to communicate with public officials within government agencies. This research also supports that systematic and organized digital attention through SM can create value for public servants. This research helps to supports the idea of government engagement. Another contribution is that SM platforms are helpful for government communication purposes within LGs. This contribution also suggests that public personnel could behave differently from public officials on SM platforms. However, we found here a difference between Facebook and Twitter, and further research will be required. The analytical generalizability – nor the statistical one – of the ISSEMyM case can help understand different cases of LGs in both ways: improving government communication and emergency management like COVID-19 or similar emergency events (Yin, 2009).
An important limitation of the study is related to its sole focus public servants. Moreover, data beyond the agency-provided numbers would be valuable. Focus groups and systematic interviews would serve to complement this investigation. Even still, the results of this research are meaningful from the perspective of public officials and citizens. This investigation only studied the health function of the ISSEMyM and its use of SM. However, further research could include more functions or the whole institution and the impact of using these platforms.
Five areas for potential future research are as follows. First, evaluate these conclusions on different government agencies in Mexico or around the world. Second, promote more research on Facebook use within government agencies to understand its challenges, benefits, and risks to organized work and the regulation of government communication. Third, more research on Twitter and Facebook data is needed, especially using content-analysis or sentiment analysis to find different paths of research from the user perspective and the answers from the government community manager. Fourth, future research into ISSEMyM public servants is vital to understand the other side of the problem. This user-side needs to evaluate the impact of the problem in terms of quality of response, access speed, easy use of the WhatsApp application, and cost reduction or time efficiency for users and government officials. Fifth, more research on the use of SM platforms for emergency management needs to consider the experience of COVID-19 pandemics to develop protocols or communication actions that follow the community managers in such events.
Finally, we consider that emergent technologies in the public sector are a recent trend for digital government research. This investigation intends to provide empirical evidence for the use of SM and highlight the differences between Twitter and Facebook for public relations in public administration. The digital transformation of the government is ongoing. The use of these tools is the first step in this direction.
References
[1] | Allcott, H., Boxell, L., Conway, J., Gentzkow, M., Thaler, M., & Yang, D. Y. ((2020) ). Polarization and public health: Partisan differences in social distancing during the Coronavirus pandemic. NBER Working Paper, (w26946). |
[2] | Apuke, O. D., & Omar, B. ((2020) ). Fake news and COVID-19: modeling the predictors of fake news sharing among SM users. Telematics and Informatics, 56: , 101475. |
[3] | Basolo, V., & Yerena, A. ((2014) ). The use of SM for citizen engagement, Proceedings of the 15th Annual International Conference on Digital Government Research – dg. O 14 (DOI: 10.1145/2612733.2612758). |
[4] | Brainard, L. A., & McNutt, J. G. ((2010) ). Virtual government-citizen relations: Informational, transactional, or collaborative?. Administration & Society, 42: (7), 836-858. |
[5] | Briones, R. L., Kuch, B., Liu, B. F., & Jin, Y. ((2011) ). Keeping up with the digital age: How the American Red Cross uses SM to build relationships. Public Relations Review, 37: (1), 37-43. |
[6] | Belblidia, M. S. ((2010) ). Building community resilience through social networking sites: Using online social networks for emergency management. International Journal of Information Systems for Crisis Response and Management, 2: (1), 24-36. doi: 10.4018/jiscrm.2010120403. |
[7] | Cinelli, M., Quattrociocchi, W., Galeazzi, A., Valensise, C. M., Brugnoli, E., Schmidt, A. L., & Scala, A. ((2020) ). The covid-19 SM infodemic. arXiv preprint arXiv:2003.05004. |
[8] | Criado, J. I., Rojas-Martín, F., & Gil-Garcia, J. R. ((2017) ). Enacting SM success in local public administrations: An empirical analysis of organizational, institutional, and contextual factors. International Journal of Public Sector Management, 30: (1), 31-47. |
[9] | Criado, J. I., Sandoval-Almazan, R., & Gil-Garcia, J. R. ((2013) ). Government innovation through SM. |
[10] | Chau, A. L., Valle-Cruz, D., & Sandoval-Almazán, R. ((2021) ). Sentiment Analysis in Crisis Situations for Better Connected Government: Case of Mexico Earthquake in 2017. In Web 2.0 and Cloud Technologies for Implementing Connected Government (pp. 162-181). IGI Global. |
[11] | Chen, E., Lerman, K., & Ferrara, E. ((2020) ). COVID-19: The first public coronavirus twitter dataset. arXiv preprint arXiv:2003.07372. |
[12] | Chen, Q., Min, C., Zhang, W., Wang, G., Ma, X., & Evans, R. ((2020) ). Unpacking the black box: How to promote citizen engagement through government SM during the COVID-19 crisis. Computers in Human Behavior, 110: , 106380. |
[13] | Cheng, Y. ((2018) ). How social media is changing crisis communication strategies: Evidence from the updated literature. Journal of Contingencies and Crisis Management, 26: (1), 58-68. |
[14] | Darwish, E. B. ((2017) ). The effectiveness of the use of SM in government communication in the UAE. Journal of Arab & Muslim Media Research, 10: (1), 41-63. |
[15] | DePaula, N., Dincelli, E., & Harrison, T. M. ((2018) ). Toward a typology of government SM communication: Democratic goals, symbolic acts and self-presentation. Government Information Quarterly, 35: (1), 98-108. |
[16] | Deng, Q., Liu, Y., Liu, X., Zhang, H., & Deng, X. ((2019) ). SM Usage During Disasters: Exploring the Impact of Location and Distance on Online Engagement. Disaster Medicine and Public Health Preparedness, 1-9. |
[17] | Ferro, E., Loukis, E., Charalabidis, Y., & Osella, M. ((2013) ). Evaluating Advanced Forms of SM Use in Government, August 17 (available at http://citeseerx.ist.psu.edu/viewdoc/download?doi=10.1.1.723.9935&rep=rep1&type=pdf; retrieved February 11, 2019). |
[18] | Graham, M., & Avery, E. ((2013) ). Government public relations and SM: An analysis of the perceptions and trends of SM use at the LG level. Public Relations Journal, 7: (4), 1-21. |
[19] | Hagen, L. et al. ((2018) ). Crisis Communications in the Age of SM: A Network Analysis of Zika-Related Tweets, Social Science Computer Review, 36: (5), pp. 523-541. doi: 10.1177/0894439317721985. |
[20] | Hagen, L., Keller, T., Neely, S., DePaula, N., & Robert-Cooperman, C. ((2018) ). Crisis communications in the age of social media: A network analysis of Zika-related tweets. Social Science Computer Review, 36: (5), 523-541. |
[21] | Hao, X., Zheng, D., Zeng, Q., & Fan, W. ((2016) ). How to strengthen the SM interactivity of e-government: Evidence from China. Online Information Review, 40: (1), 79-96. |
[22] | Haro-de-Rosario, A., Sáez-Martín, A., & del Carmen Caba-Pérez, M. ((2018) ). Using SM to enhance citizen engagement with LG: Twitter or Facebook?. New Media & Society, 20: (1), 29-49. |
[23] | Karakiza, M. ((2015) ). The impact of SM in the public sector. Procedia-Social and Behavioral Sciences, 175: , 384-392. |
[24] | Latonero, M., & Shklovski, I. ((2011) ). Emergency management, Twitter, and SM evangelism. International Journal of Information Systems for Crisis Response and Management (IJISCRAM), 3: (4), 1-16. |
[25] | Li, Y., Chandra, Y., & Kapucu, N. ((2020) ). Crisis coordination and the role of SM in response to COVID-19 in Wuhan, China. The American Review of Public Administration, 50: (6-7), 698-705. |
[26] | Limaye, R. J., Sauer, M., Ali, J., Bernstein, J., Wahl, B., Barnhill, A., & Labrique, A. ((2020) ). Building trust while influencing online COVID-19 content in the SM world. The Lancet Digital Health, 2: (6), e277-e278. doi: 10.1016/S2589-7500(20)30084-4. |
[27] | Medina, R. Z., & Diaz, J. C. L. ((2016) ). Social media use in crisis communication management: an opportunity for local communities? In Social media and local governments (pp. 321-335). Springer, Cham. |
[28] | Mergel, I. ((2012) ). SM in the public sector: A guide to participation, collaboration and transparency in the networked world. John Wiley & Sons. |
[29] | Neely, S. R., & Collins, M. ((2018) ). SM and crisis communications: a survey of LGs in Florida. Journal of Homeland Security and Emergency Management, 15: (1). |
[30] | Nduhura, D., & Prieler, M. ((2017) ). When I chat online, I feel relaxed and work better: Exploring the use of SM in the public sector workplace in Rwanda. Telecommunications Policy, 41: (7-8), 708-716. |
[31] | Ogie, R. I., Clarke, R. J., Forehead, H., & Perez, P. ((2019) ). Crowdsourced SM data for disaster management: Lessons from the PetaJakarta. org project. Computers, Environment and Urban Systems, 73: , 108-117. |
[32] | Palen, L., & Hughes, A. L. ((2018) ). SM in Disaster Communication. In Handbook of Disaster Research (pp. 497-518). Springer, Cham. URL: http://tinyurl.com/y97kwcnx. |
[33] | Pennycook, G., McPhetres, J., Zhang, Y., Lu, J. G., & Rand, D. G. ((2020) a). Fighting COVID-19 misinformation on SM: Experimental evidence for a scalable accuracy-nudge intervention. Psychological science, 31: (7), 770-780. |
[34] | Pennycook, G., McPhetres, J., Bago, B., & Rand, D. G. ((2020) b). Attitudes about COVID-19 in Canada, the U.K., and the USA: A novel test of political polarization and motivated reasoning. |
[35] | Picazo-Vela, S., Fernandez-Haddad, M., & Luna-Reyes, L. F. ((2013) , June). I.T.’s alive!!: SM to promote public health. In Proceedings of the 14th Annual International Conference on Digital Government Research (pp. 111-119). ACM. |
[36] | Rimal, R. N., & Lapinski, M. K. ((2009) ). Why health communication is important in public health. Bulletin of the World Health Organization, 87: , 247-247a. Online: https://www.scielosp.org/article/bwho/2009.v87n4/247-247a/en/. |
[37] | Sandoval-Almazan, R., & Gil-Garcia, J. R. ((2012) ). Government–Citizen Interactions Using Web 2.0 Tools: The Case of Twitter in Mexico. In Web 2.0 Technologies and Democratic Governance, (pp. 233-248). Springer, New York, NY. |
[38] | Sandoval-Almazan, R., & Gil-Garcia, J. R. ((2013) ). SM in state governments: Preliminary results about the use of Facebook and Twitter in México. In E-Government Implementation and Practice in Developing Countries (pp. 128-146). IGI Global. |
[39] | Sandoval-Almazán, R., & Valle-Cruz, D. ((2016) ). SM in LGs in Mexico: A Diffusion Innovation Trend and Lessons. In SM and LGs (pp. 95-112). Springer, Cham. |
[40] | Sandoval-Almazan, R., Cruz, D. V., & Armas, J. C. N. ((2015) , January). SM in smart cities: An exploratory research in Mexican municipalities. In 2015 48th Hawaii International Conference on System Sciences (pp. 2366-2374). IEEE. |
[41] | Tasnim, R., Islam, M. S., Sujan, M. S. H., Sikder, M. T., & Potenza, M. N. ((2020) ). Suicidal ideation among Bangladeshi university students early during the COVID-19 pandemic: Prevalence estimates and correlates. Children and Youth Services Review, 119: , 105703. |
[42] | Teichmann, L., Nossek, S., Bridgman, A., Loewen, P. J., Owen, T., Ruths, D., & Zhilin, O. ((2020) , July 27). Public Health Communication and Engagement on Social Media during the COVID-19 Pandemic. doi: 10.31219/osf.io/7hypj. |
[43] | Valle-Cruz, D., Criado, J. I., Sandoval-Almazán, R., & Ruvalcaba-Gomez, E. A. ((2020) ). Assessing the public policy-cycle framework in the age of artificial intelligence: from agenda-setting to policy evaluation. Government Information Quarterly, 37: (4), 101509. |
[44] | Valle-Cruz, D., & Sandoval-Almazan, R. ((2020) ). Diffusion of Innovations Among Mexico: The Technology Adoption of State Governments. In Digital Government and Achieving E-Public Participation: Emerging Research and Opportunities (pp. 39-62). IGI Global. |
[45] | Valle-Cruz, D., Fernandez-Cortez, V., López-Chau, A., & Sandoval-Almazán, R. ((2021) ). Does Twitter Affect Stock Market Decisions? Financial Sentiment Analysis During Pandemics: A Comparative Study of the H1N1 and the COVID-19 Periods. Cognitive Computation, 1-16. |
[46] | Wu, Y., Xie, L., Huang, S. L., Li, P., Yuan, Z., & Liu, W. ((2018) ). Using SM to strengthen public awareness of wildlife conservation. Ocean & Coastal Management, 153: , 76-83. |
[47] | Wukich, C. ((2021) ). Government SM Engagement Strategies and Public Roles. Public Performance & Management Review, 44: (1), 187-215. |
[48] | Wukich, C. ((2016) ). Government SM messages across disaster phases. Journal of Contingencies and Crisis Management, 24: (4), 230-243. |
[49] | White, C., Plotnick, L., Kushma, J., Hiltz, S. R., & Turoff, M. ((2009) ). An online social network for emergency management. International Journal of Emergency Management, 6: (3-4), 369-382. |
[50] | Yang, Y., Deng, W., Zhang, Y., & Mao, Z. ((2021) ). Promoting Public Engagement during the COVID-19 Crisis: How Effective Is the Wuhan LG’s Information Release?. International Journal of Environmental Research and Public Health, 18: (1), 118. |
[51] | Yang, K. C., Torres-Lugo, C., & Menczer, F. ((2020) ). Prevalence of low-credibility information on Twitter during the covid-19 outbreak. arXiv preprint arXiv:2004.14484. |
[52] | Yates, D., & Paquette, S. ((2011) ). Emergency knowledge management and SM technologies: A case study of the 2010 Haitian earthquake. International Journal of Information Management, 31: (1), 6-13. |
[53] | Yin, R. K. ((2009) ). Case Study Research: Design and Methods, 4th edn. Thousand Oaks, CA: SAGE. |
[54] | Yoon, J., Hagen, L., Andrews, J., Scharf, R., Keller, T., & Chung, E. ((2019) ). On the use of multimedia in Twitter health communication: Analysis of tweets regarding the Zika virus. Information Research, 24: (2). |
[55] | Zeng, R., & Li, M. ((2020) ). Social media use for health communication by the CDC in mainland China: National survey study 2009-2020. Journal of Medical Internet Research, 22: (12), e19470. |
[56] | Zheng, L., & Zheng, T. ((2014) ). Innovation through SM in the public sector: Information and interactions. Government Information Quarterly, 31: , S106-S117. |


