The effects of open government data: Some stylised facts
Abstract
There is a general expectation that open government data (OGD) can lead to the generation of value for government, business, and society. However, there appears to be a lack of scholarly literature that empirically validates what this value is or how it emerges. This paper addresses this concern by exploring what empirical evidence currently exists about the effects stemming from OGD in the case literature. Through the use of a literature review, 17 papers capturing empirical evidence were identified and, from these papers, a systematic collection of statements was extracted from which 173 were retained to construct what we term nine stylised facts. The identified stylised facts depicting features and correlations provide some insights into the de facto positive, negative and/or inconclusive effects relating to OGD as opposed to simply opinions and beliefs.
1.Introduction
As we move towards a more digital-savvy age, data hold tremendous value for governments, businesses and society. Public decision-makers’ recent interest in digital technology such as artificial intelligence, data tracing and analytics has fuelled the debate about digital government transformation (European Commission, 2020a), particularly the potential of open government data (OGD) as a foundation and driver of economic growth, competitiveness, innovation, job creation and societal progress (European Commission, 2020b).11 This potential clearly creates high expectations for what OGD can or should deliver. However, while governments face tremendous pressures from worsening economic conditions as well as from the ongoing costs of developing and maintaining data-sharing infrastructures and from storing, publishing and promoting large numbers of data sets, we still do not exactly know what purposes OGD is used for nor what value it unfolds in practice (Haberer, 2020). Thus, after more than a decade of OGD initiatives worldwide, in our view it is high time to ask: What empirical evidence do we have about the de facto effects of OGD?
In this paper, we revisit the expectations of OGD and consider that OGD cannot simply of itself show effects; these can only be established where there is empirical evidence, that demonstrates observable effects relating to or constraining OGD use. To understand the effects OGD have in practice, we build on affordance theory, which enables us to retrieve the effects relating to OGD and to discard intentions, opinions or perceptions that fuel beliefs about the potential of government-produced data, but without any empirical evidence. Applied to the phenomenon of study, affordance theory enables us to acknowledge how OGD affords and simultaneously constrains particular uses (Leonardi, 2011; Majchrzak & Markus, 2012; Pozzi et al., 2014; Zammuto et al., 2007). Thus, a positive effect refers to empirical evidence emerging from OGD-related use and a negative effect (or constraint) follows from empirical evidence that shows problems with OGD that hinder the completion of an intended use.
By systematically reviewing the case literature using an affordance theory lens, we identify nine stylised facts (SFs),22 which represent an aggregation of empirical evidence and depict typical features and correlations (Heine et al., 2005; Helfat, 2007). Thus, we aim to fill a gap in the discourse about OGD, which heretofore has mostly focused on reporting the potential (or estimated effects) rather than the actual effects (Safarov et al., 2017). By examining the empirical evidence relating to OGD, our paper makes two key contributions: first, it clarifies for practice what we really know about the effects emerging from OGD-related use or hindering the completion of an intended use; second, it further systematises the effects reported in the scientific literature and provides insights for scientists to enhance their study designs in future. Before we describe our methodology and findings, we will first outline our study’s theoretical background.
2.Theoretical background
While OGD only becomes valuable when used (Attard et al., 2016b; Janssen et al., 2012), the main challenge of OGD is releasing this value via a creation process (Attard et al., 2016b). Thus, such a process seeks to make the data more suitable and/or tractable for further use (Attard et al., 2016b) via purposeful efforts by stakeholders (Martin, 2014), which in turn allows the OGD-related effects to unfold.
As Fig. 1 illustrates, the OGD value creation process involves different stakeholders from the public and/or private sector and has three main stages: data production, data distribution and data use (also see
Figure 1.
The open government data value creation process (authors’ own representation).
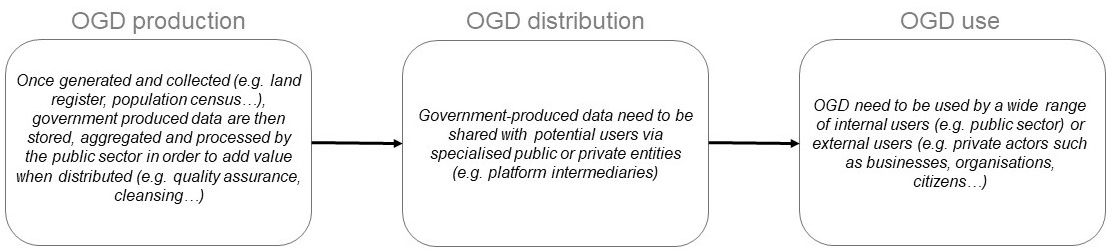
Ubaldi, 2013). While the stages and stakeholders are independent within the process, they are strongly interrelated because they reinforce one another (McBride et al., 2019). Thus, besides describing which value effects exist, it is pertinent to also look at when these effects emerge and how. To demonstrate this, it is useful to first describe the key assumptions of affordance theory since this sheds light on how perception turns into action and how it ultimately manifests itself in value.
2.1Affordance theory and open government data
Originating with the ecologist James Gibson (1979) and introduced into technology studies by, among others Hutchby (2001), affordance theory has become widely used for analysing and researching the appropriation of digital technology and for explaining IT’s effects without being either technologically or socially deterministic (e.g. Leonardi, 2013; Markus & Silver, 2008; Volkoff & Strong, 2013). Following Hutchby (2001), we understand an affordance as an opportunity for action that may or may not be actualised depending on the capabilities of the actors who interact with a given digital artefact. (Markus & Silver, 2008; Stendal et al., 2016) and goals (Volkoff & Strong, 2013; Zammuto et al., 2007). While an affordance is usually seen as a facilitator that enables a positive aptitude to accomplish an action (Leonardi, 2011; Majchrzak & Markus, 2012; Zammuto et al., 2007), it can also constrain users from completing an action (Hutchby, 2001; Leonardi, 2013; Majchrzak & Markus, 2012; Pozzi et al., 2014).
Applied to OGD, this often means that OGD is perceived as affording increased accountability, transparency and efficiency of government services as well as greater participation and engagement by citizens (Ubaldi, 2013). However, not all published data sets will yield these benefits, either because the data itself does not allow for a certain use or because only specific usergroups may be able to make sense of it. For instance, granting public access to certain government-produced data may increase a public administration’s workload, owing to more requests for supply of, or retractions of information from public records. Thus, we understand affordance as opportunity for action that users can benefit from and constraint as possible obstacle that users may encounter.
2.2Affordance theory
In line with Pozzi et al. (2014), Fig. 2 illustrates our view on affordance theory implying difference phases in the sequence of existence, perception, actualisation and the effects of affordance or constraint.
Figure 2.
Different phases of affordance theory adapted from Pozzi et al. (2014).
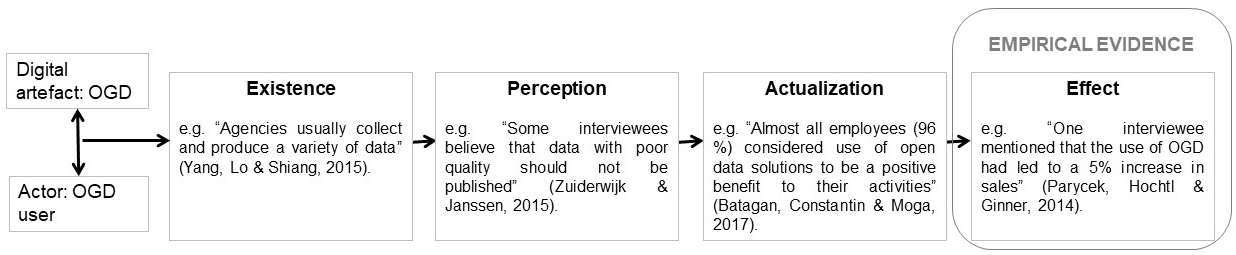
The existence phase refers to a situation where OGD creates an opportunity either for action or creates a potential obstacle, even if the intended user pays no attention to it. In order for this data to be used for more goal-oriented actions, a potential user must perceive the affordance or constraint by making a connection between the artefact and its possible use. However, as we know from other theories (e.g. TAM, UTAUT), perceptions and intentions do not always lead to expected behaviours. What is of interest is when a person takes a goal-oriented action based on published information, i.e. actualises an affordance (in affordance theory’s parlance). For value to be measured, goal-oriented actions need to translate into observable empirical evidence. Thus, we differentiate between an affordance’s effect, as empirical evidence that can be measured from OGD use, and constraint induced by an affordance, as the empirical evidence we can observe that restrains a user from realising their usage intention. For instance, poorly documented data sets can constrain a potential user from actually using OGD. It is crucial to understand the distinction between affordance and constraint as well as existence, perception, actualisation and effect, because as we move toward constructing SFs, we will consider only statements that depict empirical evidence stemming from an actualisation of OGD in practice, rather than intentions, opinions or potentials regarding possible effects resulting from the distribution of government-produced data.
3.Research method
As mentioned, SFs represent an aggregation of the empirical evidence about a phenomenon through generalised and simplified statements that depict typical features and correlations (Heine et al., 2005; Helfat, 2007). SFs are commonly derived from a structured review of the literature (Houy et al., 2015) and once aggregated, aim to represent interesting correlations that are observable in reality (Houy et al., 2015). Originating from economic research (Kaldor, 1961), a classic example of a SF used in macro-economics is the Phillips curve, which describes an empirically observed, inverse and stable relationship between inflation and unemployment. SFs have also been used in technology-related studies, for example to describe the effects of different types of remote work on performance (Neirotti et al., 2012) or how certain design features influence the diffusion of assistive technology (Bächle et al., 2018). Different from meta-analysis, which requires a constant and/or well-defined conceptualisation and measurement as basis for comparison, SFs are developed by abstracting textual statements from scientific studies (with different methodological and conceptual approaches to report on the same phenomenon) to larger chunks of knowledge, and thus are particularly suitable for analysing ill-defined concepts and phenomena (Houy et al., 2015).
3.1The identification of the case studies
To identify the relevant studies that have reported effects relating to OGD, we conducted a systematic literature review in March 2020. Following the Moher et al. (2009) PRISMA strategy (preferred reporting items for systematic reviews and meta-analyses), we searched three bibliographic databases: Web of Science (WoS), Scopus and the AIS eLibrary. We opted for WoS and Scopus because they are considered the most extensive databases on different scientific domains (Chadegani et al., 2013). Furthermore, we searched a less extensive yet more specific database, the AIS eLibrary, to complement our search with more articles from the IS domain.
To identify the most relevant scholarly publications in WoS and Scopus, we used starting conditions and specific terms in the search strings. We restricted the document type to articles written in English with the following exact keywords in the title: open government data. We used the same conditions for AIS eLibrary, except that owing to the fact that there was a lower number of papers in the specific database yet more that were specific to our research subject, we broadened our search by including all document types written in English with the following keywords in the title: open data.33
Figure 3.
The literature search and assessment process to derive stylised facts adapted from Moher et al. (2009).
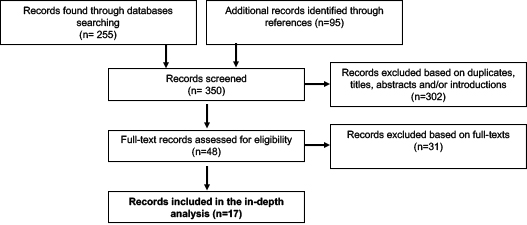
As shown in Fig. 3, the search yielded 255 records. We added an additional 95 records identified through backward searching within the references section and ended up with a list of 350 articles. We excluded duplicates and screened the articles in two iterations based on reading titles, abstracts and introductions in case the assessment based on titles and abstracts was insufficient to determine a paper’s relevance. We considered papers identified through the case literature relevant when they included some sort of empirical findings relating to OGD use or constraints on OGD use. Thus, we excluded from our analysis conceptual and theoretical papers and papers that reported no empirical findings. We retained 48 papers (40 from databases’ search and 8 from backward searching), from which we excluded 31 (29 from databases’ search and 2 from backward-searching) based on full texts because they were concerned with theory development, methodology or framework development with either no or a poor empirical basis. As a result of this process, we retained 17 articles for the in-depth analysis (11 from the databases’ search and 6 from backward searching in the references section). Table 1 summarises the case literature we used to derive the SFs.
Table 1
Studies included for the derivation of stylised facts
| ID | Author (year) | Short description | Evidence level |
|---|---|---|---|
| [1] | Janssen et al. (2012) | Is explorative. Based on data collected through interviews and a workshop, the authors derived benefits and barriers to the adoption of open data. | EL1 |
| [2] | Zuiderwijk and Janssen (2012) | Is explorative. Based on interviews and a review of reports, the open data policies of two Dutch Ministries were compared. | EL1 |
| [3] | Neuroni et al. (2013) | Examines a specific situation, i.e. Swiss executive authorities’ value expectations of OGD initiatives. Based on a quantitative survey of the Cantonal State Chancelleries and on a qualitative case study, eZürich, the research consolidated perceived prerequisites, risks and expected long-term impacts. | EL2 |
| [4] | Parycek et al. (2014) | Examines a specific situation, i.e. the implementation of the OGD strategy and portal of the City of Vienna. Based on qualitative interviews and an online survey, the analysed aspects included the organisational processes, the benefits of and the requirements for future OGD initiatives. | EL2 |
| [5] | Zuiderwijk and Janssen (2014) | Develops a framework for comparing open data policies. Elements for an initial framework were deduced by investigating the literature and by analysing reports, documents and websites about open data policies. This initial framework was then refined through observations gained from semi-structured interviews as well as e-mail and telephone contact. Using the framework, seven Dutch governmental policies at different government levels were compared. | EL3 |
|
Table 1, continued | |||
|---|---|---|---|
| ID | Author (year) | Short description | Evidence level |
| [6] | dos Santos Brito et al. (2015) | Examines a specific situation, i.e. the use of applications based on OGD, especially Meu Congresso Nacional, a website that relies on political OGD and that was broadly used by Brazilian citizens in Brazil’s 2014 elections. Based on a survey of visitors to the website, the paper analyses the benefits perceived by the general population of using of the aforementioned applications. | EL2 |
| [7] | Gonzalez-Zapata and Heeks (2015) | Examines a specific situation, i.e. the stakeholders and their different perspectives on OGD in Chile. Based on a literature review, four perspectives on OGD were identified. Further, a case study was conducted in Chile by analysing OGD-related reports, conference presentations and interviews concerning these perspectives. | EL2 |
| [8] | Nam (2015) | Examines a specific situation, i.e. a case study in Korea. Based on qualitative data from unstructured interviews with public managers and open government experts, a SWOT analysis was conducted on Korea’s Government 3.0 Drive. | EL2 |
| [9] | Yang et al. (2015) | Is explorative. Based on semi-structured interviews, a qualitative approach and inductive reasoning were used to analyse the data in order to explore the influencing factors and their impacts on OGD initiatives from four perspectives. | EL1 |
| [10] | Zuiderwijk and Janssen (2015) | Proposes a decision-making model that assists in trade-offs between the pros and cons of open data. Based on the literature and on in-depth interviews with public sector officials and data archivists, the paper identified contextual and data set-related variables. The model provides guidance for weighing the creation of public value and the risks. | EL3 |
| [11] | Lourenco (2016) | Is explorative and descriptive. Based on a qualitative content analysis approach, portal references were examined regarding its main purpose and data usage. The paper found evidence of the impacts of open government portals, asserting whether data was indeed being used, and for what purposes. | EL1 |
| [12] | Batagan et al. (2017) | Is explorative. Based on a documentary study of OGD’s benefits to improve quality of life, the paper examined the necessity and the benefits of implementation of OGD through a case study concentrating on Romanian institutions and aiming to highlight the stages of OGD solutions’ implementation. | EL1 |
| [13] | Hermanto et al. (2018) | Examines a specific situation, i.e. a review of Indonesia’s national OGD portal. Based on a documentary analysis, structured interviews were conducted with management representatives from the private sector and NGOs in order to solicit their perspectives regarding the use of OGD for professional purposes. | EL2 |
| [14] | Hossain et al. (2018) | Proposes an integrated research model based on transparency, accountability, participation and collaboration dimensions, which was empirically tested. Relying on a questionnaire, the paper sought to measure OGD’s impacts on citizen empowerment. | EL3 |
| [15] | Jetzek et al. (2019) | Proposes a model that explains how open data generate sustainable value through the information-sharing and the market mechanisms. Based on secondary quantitative data from 76 countries, the model was tested and validated. | EL3 |
| [16] | Zuiderwijk et al. (2019) | Examines the relationship between the objectives of OGD initiatives and the delivered benefits. Based on a large survey covering a wide range of OGD initiatives worldwide, the results are subjective because they mostly relied on the participants’ viewpoints and opinions; thus, in our view, they reflect a specific situation | EL2 |
| [17] | Boudreau (2020) | Examines a specific situation, i.e. the re-use of open data by various actors in society in Quebec. Based on the history of open data in Quebec and on interviews, the paper analysed government measures and community practices regarding re-use. | EL2 |
3.2The extraction of statements and the designation of evidence level
Following the stylisation process outlined by Houy et al. (2015), we first extracted original, unmodified statements from the identified case literature.44 While reading the articles, we distilled 394 statements, including excerpts from personal communication (e.g. with employees from public institutions, citizens or other stakeholders) or statements by the authors on the basis of some empirical material (e.g. survey data, case findings). In step two, we categorised these statements, applying the affordance theory lens to statements that point to the existence, perception, actualisation or effects of OGD affordance or constraint. We categorised a statement as existence when a pure informative declaration was given. We coded personal opinions, beliefs or expectations as perception. This was for instance the case when an interviewee expressed their opinion on OGD without proven experience that supports their claims’ truthfulness. We coded personal opinions supported by personal experiences as actualisation. Finally, we coded a statement as effect if it was supported by broader empirical evidence. To reduce subjectivity in the coding procedure, multiple coders assessed the statements separately and discussed inconsistencies until they reached agreement. Of the 394 statements, we coded five as existence, 126 as perception, 90 as actualisation and 173 as effect; we retained only the latter statements for further analysis.
In step three, we defined the distinct evidence levels (EL) (see Table 2) and allocated each of the remaining 173 statements to one EL in order to categorise the claims’ quality and legitimacy. We based the definition of the EL on Gregor’s (2006) classification of theoretical contributions. Of the 173 statements, we categorised 47 into EL1, 89 into EL2, 37 into EL3 and none into EL4.
Table 2
Description of the four evidence levels
| EL | Short description |
|---|---|
| EL1 | EL1 points to description with no explanation of the causal relationships or predictive generalisation. EL1 includes studies that describe characteristics of individuals, groups or situations. For instance, an explorative study on two Dutch ministries found that “opening data causes a decrease in information requests” (Zuiderwijk & Janssen, 2012) through an evaluation of policies of the Ministry of Education, Culture, and Science. This empirical evidence is in EL1 because it comes from a study that describes characteristics of a specific situation, namely the aforementioned Dutch ministry, without detailing the underlying evidence for this claim. |
| EL2 | EL2 describes early explanations of causal relationships from a specific perspective that cannot be used to predict precisely. EL2 includes studies that explained some specific situations with some empirical basis (e.g. using a survey, case study). For instance, we classified Parycek et al. (2014) study into EL2, because it makes claims based on an online survey as well as on interview data. |
| EL3 | EL3 describes substantiated explanations of causal relationships that allow one to formulate certain prescriptions. EL3 often implies a general agreement of certain effects that are then presented in or integrated into a conceptual model, method or framework. For instance, we classified statements based on Jetzek et al. (2019) into EL3, because it developed and validated an explanatory model using secondary quantitative data from 76 countries. |
| EL4 | EL4 refers to substantiated explanations and predictions based on experimental or longitudinal research designs. Unfortunately, none of the statements were classified into EL4. |
4.Results
4.1The aggregation, abstraction and construction of the stylised facts
Each SF describes a common effect relating to OGD, that is backed up by several statements extracted from the 17 studies we identified in our systematic literature review and that we assigned into a specific EL according to each claim’s quality and legitimacy. Furthermore, each SF can be positive, negative and/or inconclusive. A positive effect refers to empirical evidence emerging from OGD-related use and a negative effect (or constraint) points to empirical evidence hindering the completion of an intended use. An effect is considered to be inconclusive when the empirical evidence reports contradictory findings for example where, even if some empirical evidence points to an affordance, there is other empirical evidence that shows that an intended use was also constrained in some way. Table 3 shows the number of statements each SF is composed of as well as the median EL and the variance. We calculated the median EL and the variance considering the statements and their respective ELs and not the sources, given that the number of statements extracted from the case literature varied (i.e. certain cases reported more effects than others). According to Reiter et al. (2013), the total number of statements is a good indicator of the relevance of the empirical evidence supporting a SF, while the median EL points to the rigour of how this evidence was collected.
Table 3
The stylised facts and their associated evidence level and variance
| Stylised facts | No. of statements | Median EL | Variance | Case literature |
|---|---|---|---|---|
| SF1: Poor governance and resistance in public administration negatively affect OGD quality | 18 | 2 | 0.44 | [1], [2], [9], [10], [13], [17] |
| SF2: Poor governance and resistance in public administration negatively affect OGD distribution | 23 | 1 | 1 | [1], [5], [9], [10] |
| SF3: Supervising OGD’s accessibility has an inconclusive effect on the ability to monitor the data sets | 16 | 2 | 0.56 | [1], [3], [5], [9], [10], [17] |
| SF4: OGD has a positive effect on knowledge creation in public administration, yet an inconclusive effect regarding entrepreneurial ventures and business innovation | 17 | 2 | 0.38 | [1], [2], [3], [4], [7], [8], [9], [12], [15], [16], [17] |
| SF5: OGD has a positive effect on efficiency in public administration, yet an inconclusive effect regarding cost reduction | 25 | 2 | 0.29 | [2], [3], [4], [5], [8], [9], [12], [16], [17] |
| SF6: OGD has a generally positive effect on cooperation via the digital transformation of public administration | 26 | 2 | 0.26 | [1], [3], [4], [5], [7], [8], [9], [12], [13], [15], [16] |
| SF7: OGD has a generally positive effect on communication in public administration, yet an inconclusive effect regarding the handling of information requests from other stakeholders | 7 | 2 | 0.12 | [2], [3], [4], [6], [8], [12] |
| SF8: OGD has a specifically positive effect on public administration’ transparency and accountability | 28 | 2 | 0.46 | [1], [2], [4], [6], [8], [10], [11], [12], [14], [15], [16], [17] |
| SF9: OGD has a specifically positive effect on citizen participation and engagement | 13 | 2 | 0.38 | [2], [4], [6], [8], [11], [14], [16], [17] |
Figure 4.
The stylised facts embedded in the open government data value creation process (authors’ own representation).
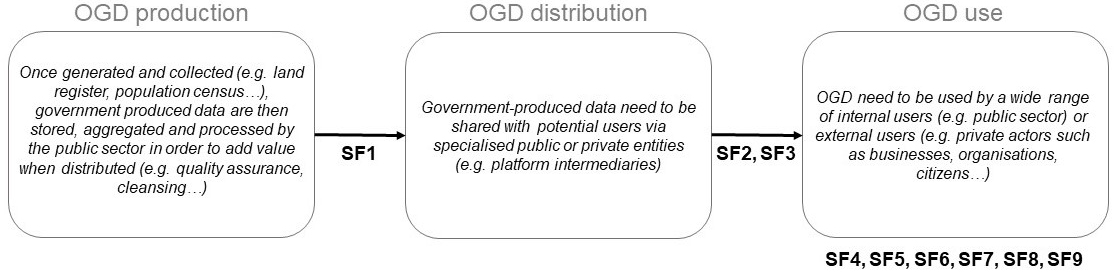
As shown in Fig. 4, we organised our findings along the value creation process, which we split into data production, data distribution and data use (see Ubaldi, 2013).
4.2From the production to the distribution of open government data
OGD production covers the generation, collection, storage, aggregation and processing of the data. OGD production is usually realised by public sector entities in view of producing valuable data for distribution and enabling potential users to make future use of the data. The aim is to make the data that is generated by public administration activities more suitable for the use by third-parties (e.g. through regular updates and data cleansing) (Attard et al., 2016b). OGD production is a prerequisite of OGD distribution and the empirical evidence related to this stage deals mainly with one topic: OGD quality.
The first SF we derived from the literature can be described as follows: poor governance and resistance in public administration negatively affect OGD quality. Many studies reported a negative effect at the institutional level, where there is a lack of knowledge on OGD and especially of the required standards. As highlighted for instance by Yang et al. (2015, p. 603), “…as some agencies do not really understand the meaning of open data, they tend to provide unstructured data such as pictures and articles rather than structured raw data”.
Another example from Zuiderwijk and Janssen (2015, p. 110) stressed that “some datasets were simply too poorly documented and had insufficient metadata to be able to be interpreted correctly”. Hence, according to the statements retained to construct the SF, as a result of a broad lack of understanding of OGD, public administrations are likely to provide data that are unstructured and incomplete rather than structured and complete (Hermanto et al., 2018; Yang et al., 2015) as well as undocumented data sets rather than data sets accompanied by metadata (Janssen et al., 2012; Zuiderwijk & Janssen, 2015). Lack of standards presents an upstream challenge to interpreting and further using the data, because lower-quality data sets prevent potential users from making optimal use of the data, which in turn undermines the effectiveness of the intended use. As Boudreau (2020, p. 10) reported, “community members found that quality problems prevented them from fully exercising their oversight role”. In another example Hermanto et al. (2018, p. 301) report NGO representatives having problems arising from incomplete data sets on which they were heavily reliant. These cases in the literature demonstrate that if the produced OGD is of low quality, it may be of little value for further use because data quality is a precondition of getting better outcomes from OGD use. Thus, to generate added value when distributed, the OGD quality is crucial, because quality enhances the possibilities of use as well as the effects (Safarov et al., 2017).
4.3From the distribution to the use of open government data
Data production is followed by data distribution. To enable further use, OGD must be distributed to potential users. OGD distribution is realised by specialised public and/or private entities in the role of platform intermediaries. OGD distribution is a direct prerequisite of OGD use, and the empirical evidence resulting from this stage deals with two topics: distributing and monitoring OGD.
SF2, which is about data distribution, can be described as follows: poor governance and resistance in public administration negatively affect OGD distribution. According to what is reported in the literature, poor governance and resistance in public administration often relate either to the data providers’ unwillingness to publicise, license or embargo certain data or to the features of OGD (e.g. data that is inappropriate for distribution because it is not anonymised). These barriers restrain OGD distribution and if OGD are not distributed to potential users, it cannot be actualised. Neither can it produce empirical evidence on the effects generated from its use. As noted by Zuiderwijk and Janssen (2015, p. 110), “approximately only eight percent of the agency’s data might be appropriate for publication” owing to legal constraints, political sensitivity or other reasons, such as a need to protect the organisation’s reputation. Such restricted distribution limits the possibilities for potential users. Thus, good OGD distribution is a precondition of obtaining useful outcomes from OGD use.
SF3, which deals with the monitoring of OGD, can be summarised as follows: supervising OGD’s accessibility has an inconclusive effect on the ability to monitor the data sets. According to the evidence gathered, for specific data sets, governments closely observe which stakeholders use which data sets for what reasons in order to keep a certain level of control so as to prevent misuse (e.g. respecting data protection or legal aspects). At the same time, the statements also show that this is not taking place systematically because the supervision of OGD’s accessibility does not provide the ability to properly monitor the data sets. For instance, interviewees in Yang et al. (2015, p. 10) indicated that “government agencies encounter difficulties in knowing who uses open data and what and how data are utilized”. We found that an inability to monitor the data sets prevents governments from systematically knowing where the demands for access to OGD comes from, how the data has been used, or if it was beneficial for users. The elements mentioned above show that monitoring of the data sets is limited. Supervising OGD (i.e. preventing accessibility to specific data sets) contradicts the essence of OGD as free, accessible, usable, modifiable and sharable (Open Knowledge Foundation, 2018). However, setting up mechanisms that gather feedback on OGD use is fruitful to gain users’ feedback about which data sets are valuable to afford full completion of the intended use.
4.4The effects of the use of open government data
As OGD becomes valuable only when used (Attard et al., 2016a; Janssen et al., 2012), OGD use can be considered the final stage of the value creation process. OGD is used by a wide range of users from the public sector (e.g. public administration, citizens) and the private sector (e.g. businesses, entrepreneurial ventures). The empirical evidence resulting from OGD use addresses six topics: knowledge creation, efficiency, cooperation, communication, transparency and accountability and citizen participation and engagement.
SF4 deals with knowledge creation and can be summarised as follows: OGD has a positive effect on knowledge creation in public administration, yet an inconclusive effect regarding entrepreneurial ventures and business innovation. According to the empirical evidence retrieved from our case literature, while the effect is positive for the public sector, the effect is inconclusive for the private sector owing to conflicting evidence. Inspiration or innovative ideas that were previously infeasible because of the inaccessibility of specific data sets now have the possibility of being realised. In the public sector, public administration can compile new ideas and services from OGD and can therefore harness them to (for example) better understand citizens’ needs. For instance, Neuroni et al. (2013, p. 1917) mention a “possibility for public administration to collect new ideas how to turn data into value through the observation of the use of OGD”. In the private sector, while Nam (2015, p. 560) reported that “many interviewees indicated social and commercial values that businesses using public data create”, the empirical evidence retrieved from the case literature also shows that it is rather difficult to be innovative and to create commercial value by means of a common good. For example, Yang et al. (2015) state that when an organisation intends to use some data, it must interact with local entities, and the data sets obtained are not always standardised. Further, as one interviewee in Janssen et al. (2012, p. 263) puts it: “…use is limited to the happy few, these who are educated and have time to explore new business opportunities”.
SF5, which portrays a transaction economics view of OGD, can be described as follows: OGD has a positive effect on efficiency in public administration, yet an inconclusive effect regarding cost reduction. SF5 is transactional, because increased efficiency is cost-related and starts from the premise that value is usually generated by reducing activities’ costs. In the public sector, increased efficiency relates to the better use of the existing resources as a result of more productive ways of working such as increased inter-agency information-sharing. However, although higher efficiency usually leads to financial savings, we found an inconclusive effect regarding cost reduction. The evidence suggests that OGD can also generate additional labour costs by increasing the burden on public administration’s core mission(s). Furthermore, OGD is free (to users), which can reduce income to an administration because the administration charges low fees. As discussed by Parycek et al. (2014, p. 88), “giving away data free of charge leads to some decline in earnings”. According to their analysis, the inconclusive effect comes from the increased efficiency, leading to financial savings by reducing the activities’ costs; on the other hand, free services and a higher burden on public administration create additional costs.
The transformational effects from using OGD on collaboration are summarised in SF6: OGD has a generally positive effect on cooperation through the digital transformation of public administration. SF6 has a transformational dimension because digital transformation is closely linked to innovative processes. According to the collected evidence, the positive effect emerges mainly from increased collaboration, coordination and interaction between the stakeholders in the public sector. The power of the collective data sets is fuelled by the easy accessibility and the ability to re-use the data for different purposes, creating links and interdependencies between the different stakeholders in the public sector Zuiderwijk and Janssen (2014, p. 23) state that: “most interviewees showed that they knew which other civil servants were working on open data policies in the other government organizations, especially at the ministerial level” and that “handling similar types of data makes it easier to collaborate in developing policies”. Hence increased cooperation may lead to more coordinated actions which in turn generate more favourable opportunities in the public sector.
SF7, which is about the effects on communication and information handling patterns, can be summarised as follows: OGD has a generally positive effect on communication in public administration, yet an inconclusive effect regarding the handling of information requests from other stakeholders. SF7 is transactional because increased efficiency usually reduces an action’s costs. OGD’s positive effect on communication in public administration shows that OGD is grounded in public administration through inter-agency information-sharing. Concerning the requests from other stakeholders such as citizens, we found no conclusive effect. For instance, Zuiderwijk and Janssen (2012, p. 88) report that “opening data causes a decrease in information requests”, but Parycek et al. (2014, p. 87) assess that “the release of OGD has no significant influence on the rate of requests from external stakeholders”. Accordingly, it seems that for other stakeholders, OGD did not prevail and that some of the continuing requests for information come from within public administration.
SF8 summarises OGD’s effects on transparency and accountability: OGD has a specifically positive effect on public administration’ transparency and accountability. SF8 has a strategic dimension, because it directly enhances the general perception of public administration. According to the collected evidence, the positive effect comes from the increased availability and visibility of information. The increased transparency enables citizens to monitor public administration and favours their accountability. For instance, Janssen et al. (2012, p. 260) report that the “availability of information about what governments are doing and why is increasingly recognized as an important precondition to the meaningful exercise of democratic accountability and deliberation”. The statements also show that increased transparency helps prevent corruption. Lourenco (2016, p. 32) found evidence that data distributed through a portal is used for a wide range of purposes, including to hold public agents accountable and to prevent possible cases of corruption. Accordingly, the elements mentioned showed that OGD increases access to government information, which in turn reduces information asymmetry, which in turn enhances transparency and accountability.
Finally, SF9 is about effects on citizen participation and engagement, which can be summarised as follows: OGD has a specifically positive effect on citizen participation and engagement. SF9 has a strategic dimension because enhanced participation and engagement improves collaboration between public value-oriented stakeholders. According to the collected evidence, SF8 and SF9 are closely linked, because the increased insights from and visibility of government activities are likely to increase citizen participation and engagement. As discussed by Hossain et al. (2018, p. 673), “actions and decisions taken by government are now more transparent to the citizens and enable them to become more enthusiastic to participate in political activities”. Thus, OGD increases transparency by making available certain information about governmental activities and this creates synergies with citizens. As a result, citizens are given opportunities to gain more insights into governmental activities which make them keener to get involved in policy or decision-making processes.
5.Discussion
While the nine SFs provide some insights into the de facto positive, negative and/or inconclusive effects relating to OGD inside and outside the public sector, the literature review also revealed the complexity of capturing such effects. Hence, while collecting evidence, we realised that not only was retrieving the effects is a complex task but also that there are still very few examples of high-quality evidence levels depicting insights into the effects relating to OGD. We believe that this situation mainly results from the difficulties in accurately identifying the effects, which we believe point to shortcomings in both research and in practice. Accordingly, with the aim of putting the SFs into perspective, we propose grouping the difficulties into three categories: time-lags, mismeasurements and study designs.
First, if significant time-lags between the implementation of OGD initiatives and observable effects exist, effects can take several years to show results. Owing to OGD’s relative novelty, potential users may require some additional time in order to learn how to use OGD effectively and thereby to produce useful outcomes from their use. In addition, time-lags may differ inside and outside of the public sector. This might explain why fewer effects have been captured in the private sector as yet. It could be that public sector employees are gradually being informed about what OGD is, while the private sector first needs to familiarise itself with the specificities of OGD (as opposed to open data originating from private sources).
Second, an explanation for the difficulties in identifying the effects is simply mismeasurement, which could lead to under-estimation or over-estimation of the de facto impacts of OGD. While there is empirical evidence on effects relating to OGD in the scientific literature, there are (as yet) no agreed measurement items to support or quantify these. The closer one examines the data behind the studies into OGD-related effects, the more it looks like mismeasurement is a key problem, notably because some effects are intangible and thus hard to quantify. However, a lack of good quantitative measures to assess the effects and value afforded by OGD in practice makes it harder to justify the ongoing costs of developing and maintaining data-sharing infrastructures as well as of inventorying, publishing and promoting large amounts of data sets. In a context where, as noted above, governments face tremendous pressures as a result of deteriorating economic conditions, a lack of clear and quantifiable measurements will make it hard to justify OGD investments.
Third, the study designs in the OGD literature may also explain why we lack knowledge about long-term or usage-based effects. Regarding the levels of evidence provided in the literature, of the 173 statements used to constitute the SFs, the vast majority (136) only point to a description without explanations or with preliminary or tentative explanations of causal relationships from a specific perspective. These cannot be used to make predictions with any precision. Although some of the statements (32) describe substantiated explanations of causal relationships, there was no single statement based on experimental or longitudinal research designs. Thus, the gathered effects revealed that while there is evidence of effects relating to OGD, there is little high-quality evidence. Furthermore, most studies identified in the case literature were based in public administrations. Possible reasons for this include that the private sector and general population might be harder to understand and/or obtain representative samples from. Public administrations may be an easier target group to define and approach. Accordingly, we believe that the discrepancies in defining and approaching the target groups may explain why the studies have focused more on the public perspective and why we still know so little about the effects relating to OGD in the private sector and in non-institutional settings.
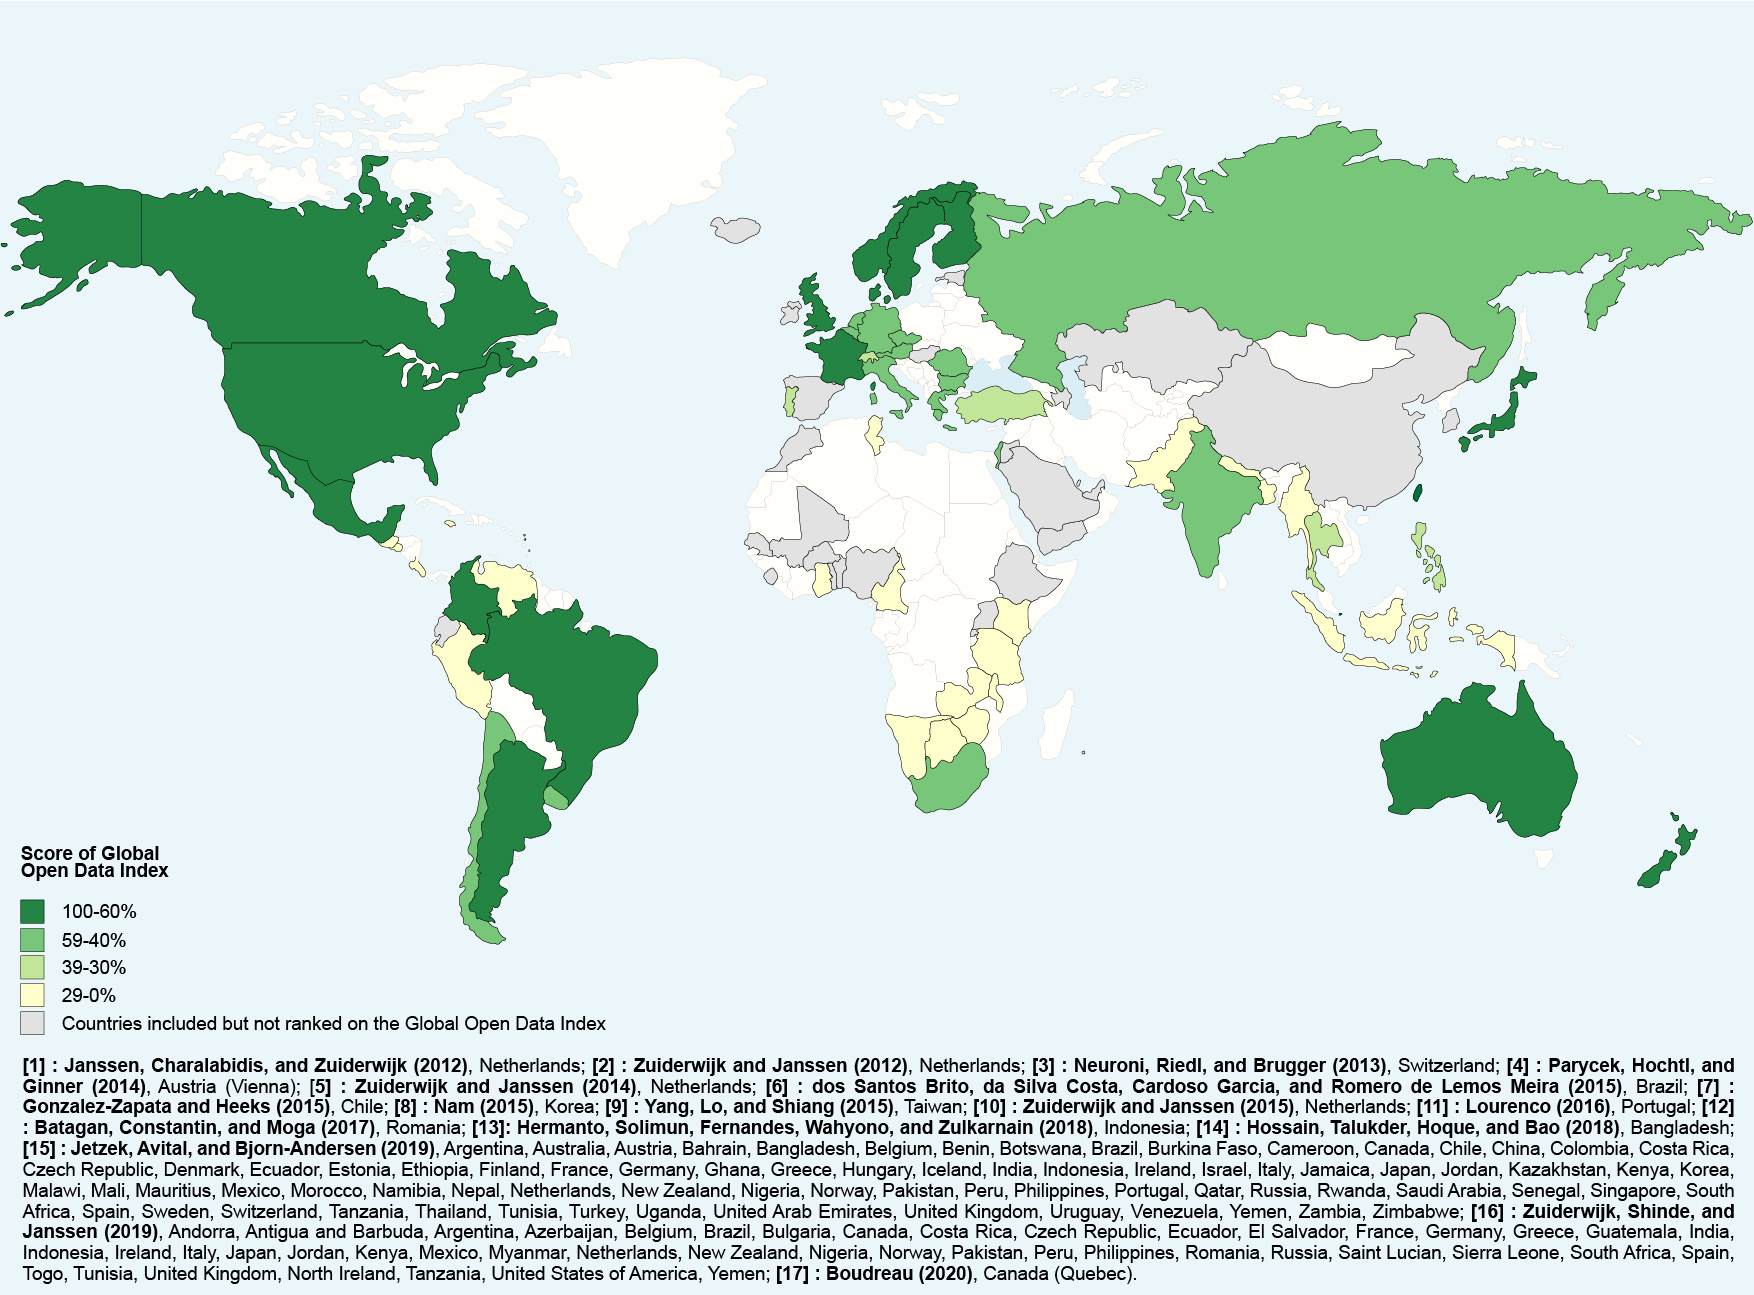
Our study has limitations. Since we conducted a literature review, an obvious study limitation is coverage; thus, we cannot be sure that we have integrated all studies with effects relating to OGD. To depict the effects relating to OGD, we constructed SFs, following affordance theory, where the contextual conditions that support or restrict the actualisation process is valuable. However, we did not provide typical features of the chosen studies’ contexts. Further, constructing SFs requires a stylisation process, implying some subjective steps. Although multiple coders moderated such subjectivity, it is not possible to wholly eliminate it. Regarding SFs, a key limitation is that they explain interesting, observable correlations rather than causations. Thus, it is not possible to tell from the constituted SFs what caused these effects nor how the reported effects can be triggered. Further, constructing SFs that depict effects relating to OGD requires that one collect empirical evidence, and therefore focus on what is available in the scientific literature. The evidence gathered from the case literature only reflects experiences from a few countries (for a visual overview over the countries thematised in the retained articles, see the Appendix).
6.Conclusion
With the goal to shed some light on the de facto effects related to OGD, we identified 17 relevant papers capturing empirical evidence and, from these papers, we extracted a systematic collection of statements, from which 173 were retained to construct nine SFs. Drawing on affordance theory, the nine SFs depict positive, negative and/or inconclusive effects relating to OGD inside and outside the public sector. Besides providing some insights into the mentioned effects, we also looked at when they emerge in order to organise our findings along the value creation process as each stage allows the OGD-related effects to be unfolded.
The SFs also indicate that public administration worldwide is starting to experience some effects relating to OGD, but only when they set the right conditions for use. Further, the described effects showed the public sector’s key role both in the conditions for obtaining better effects from OGD use as well as directly from de facto OGD use. Moreover, the median EL is relatively low, which indicates that the current studies point to description without explanations or with early explanations of causal relationships from a specific perspective. As noted, these cannot be used to make predictions with precision.
In sum, our results made clear what we really know about the effects relating to OGD and provide insights for scientists to enhance their future study designs. The results enable practitioners to revisit the expectations and claims made about the effects relating to OGD; they also provide insights for an emerging OGD research agenda by pointing out what is needed to improve OGD research, for instance the development of assessment frameworks to quantifiably measure the effects relating to OGD but also by identifying the research designs, which currently cannot precisely and predictably ascertain effects relating to OGD (e.g. through experimental or longitudinal research designs).
Above all, it may be useful to understand the extent to which the difficulties (time-lags, mismeasurements and study design) of accurately identifying the effects prevail. Concerning the time-lags, researchers may outline whether the current effects will pay off in proportionally larger effects in several years. Concerning mismeasurement, there has to date been no established framework, standards nor measurements set to quantify effects relating to OGD. The existing tools for quantifying such effects are limited, resulting in poor measurement. While there is a need to consider such limitations when making economic or societal forecasts, there is above all a need to establish frameworks, standards or a set of measurement items to be used in longitudinal survey. Researchers may focus on translating effects relating to OGD in quantifiable measures, which is a challenging task because – as noted – some of the effects are intangible, such as the increased transparency and accountability of public administration. All this considered, research that aims to more precisely outline effects relating to OGD and their values would benefit the scientific community, policy-makers and practitioners, because it will allow them to take decisions based on collected evidence rather than on opinions or hunches.
Notes
1 We use OGD to refer to non-sensitive, digitised data produced by state bodies (e.g. census data, cartographic material, statistical data) and made available to everyone with minimal mechanisms of control such as copyright, price or repurposing.
2 We use SFs to refer to constituted, generalised and simplified statements based on aggregated empirical evidence.
3 We decided against OGD as keyword because it is also extensively used to abbreviate other scientific terms such as oxygen-glucose deprivation in biochemical and biophysical research or oesophago-gastro-duodenoscopy in the medical field.
4 For further details on the extracted statements, their categorisations and the EL, see the separate supporting material.
References
[1] | Attard, J., Orlandi, F., & Auer, S. ((2016) a). Data driven governments: Creating value through open government data. In H. A. et al. (ed.), Transactions on Large-Scale Data- and Knowledge-Centered Systems XXVII, pp. 84-110. Berlin, Heidelberg: Springer. |
[2] | Attard, J., Orlandi, F., & Auer, S. ((2016) b). Value creation on open government data. Paper Presented at the 49th Hawaii International Conference on System Sciences, Koloa, USA. |
[3] | Bächle, M., Daurer, S., Judt, A., & Mettler, T. ((2018) ). Assistive technology for independent living with dementia: Stylized facts and research gaps. Health Policy and Technology, 7: (1), 98-111. |
[4] | Batagan, L.P., Constantin, D.L., & Moga, L.M. ((2017) ). Facts and prospects of open government data use. A case study in Romania. In Certoma, C., Dyer, M., Pocatilu, L., & Rizzi, F. (eds.), Citizen Empowerment and Innovation in the Data-Rich City, pp. 195-208. Cham, Switzerland: Springer. |
[5] | Boudreau, C. ((2020) ). Reuse of open data in Quebec: From economic development to government transparency. International Review of Administrative Sciences, forthcoming. |
[6] | Chadegani, A.A., Salehi, H., Yunus, M.M., Farhadi, H., Fooladi, M., Farhadi, M., & Ebrahim, N.A. ((2013) ). A comparison between two main academic literature collections: Web of science and scopus databases. Asian Social Science, 9: (5), 18-26. |
[7] | dos Santos Brito, K., da Silva Costa, M.A., Cardoso Garcia, V., & Romero de Lemos Meira, S. ((2015) ). Assessing the benefits of open government data: The case of meu congresso nacional in Brazilian elections 2014. Paper Presented at the 16th Annual International Conference on Digital Government Research, Phoenix, USA. |
[8] | European Commission. ((2020) a). AI watch artificial intelligence in public services: Overview of the use and impact of AI in public services in the EU. Retrieved from https://publications.jrc.ec.europa.eu/repository/bitstream/JRC120399/jrc120399_misuraca-ai-watch_public-services_30062020_def.pdf. |
[9] | European Commission. ((2020) b). A European strategy for data. Retrieved from https://eur-lex.europa.eu/legal-content/EN/TXT/HTML/?uri=CELEX:52020DC0066&from=EN. |
[10] | Gibson, J.J. ((1979) ). The ecological approach to visual perception. Boston: Houghton Mifflin. |
[11] | Gonzalez-Zapata, F., & Heeks, R. ((2015) ). The multiple meanings of open government data: Understanding different stakeholders and their perspectives. Government Information Quarterly, 32: (4), 441-452. |
[12] | Gregor, S. ((2006) ). The nature of theory in information systems. MIS Quarterly, 30: (3), 611-642. |
[13] | Haberer, B. ((2020) ). Implications of open government data for the digital economy. Paper Presented at the 28th European Conference on Information Systems, Marrakech, Morocco. |
[14] | Heine, B.-O., Meyer, M., & Strangfeld, O. ((2005) ). Stylised facts and the contribution of simulation to the economic analysis of budgeting. Journal of Artificial Societies and Social Simulation, 8: (4). |
[15] | Helfat, C.E. ((2007) ). Stylized facts, empirical research and theory development in management. Strategic Organization, 5: (2), 185-192. |
[16] | Hermanto, A., Solimun, S., Fernandes, A.A.R., Wahyono, W., & Zulkarnain, Z. ((2018) ). The importance of open government data for the private sector and NGOs in Indonesia. Digital Policy Regulation and Governance, 20: (4), 293-309. |
[17] | Hossain, M.N., Talukder, M.S., Hoque, M.R., & Bao, Y.K. ((2018) ). The use of open government data to citizen empowerment: An empirical validation of a proposed model. Foresight, 20: (6), 665-680. |
[18] | Houy, C., Fettke, P., & Loos, P. ((2015) ). Stylized facts as an instrument for literature review and cumulative information systems research. Communications of the Association for Information Systems, 37: (1), 225-256. |
[19] | Hutchby, I. ((2001) ). Technologies, texts and affordances. Sociology, 35: (2), 441-456. |
[20] | Janssen, M., Charalabidis, Y., & Zuiderwijk, A. ((2012) ). Benefits, adoption barriers and myths of open data and open government. Information Systems Management, 29: (4), 258-268. |
[21] | Jetzek, T., Avital, M., & Bjorn-Andersen, N. ((2019) ). The sustainable value of open government data. Journal of the Association for Information Systems, 20: (6), 702-734. |
[22] | Kaldor, N. ((1961) ). Capital accumulation and economic growth. In Hague, D.C. (ed.), Theory of Capital, pp. 177-222. London: Palgrave Macmillan. |
[23] | Leonardi, P.M. ((2011) ). When flexible routines meet flexible technologies: Affordance, constraint, and the imbrication of human and material agencies. MIS Quarterly, 35: (1), 147-167. |
[24] | Leonardi, P.M. ((2013) ). When does technology use enable network change in organizations? A comparative study of feature use and shared affordances. MIS Quarterly, 37: (3), 749-775. |
[25] | Lourenco, R.P. ((2016) ). Evidence of an open government data portal impact on the public sphere. International Journal of Electronic Government Research, 12: (3), 21-36. |
[26] | Majchrzak, A., & Markus, M.L. ((2012) ). Technology affordances and constraints in management information systems (MIS). In Kessler, E. (ed.), Encyclopedia of Management Theory, Los Angeles: Sage Publications. |
[27] | Markus, M.L., & Silver, M.S. ((2008) ). A foundation for the study of IT effects: A new look at DeSanctis and poole’s concept of structural features and spirit. Journal of the Association for Information Systems, 9: (10/11), 609-632. |
[28] | Martin, C. ((2014) ). Barriers to the open government data agenda: Taking a multi-level perspective. Policy & Internet, 6: (3), 217-240. |
[29] | McBride, K., Aavik, G., Toots, M., Kalvet, T., & Krimmer, R. ((2019) ). How does open government data driven co-creation occur? Six factors and a ‘perfect storm’; insights from Chicago’s food inspection forecasting model. Government Information Quarterly, 36: (1), 88-97. |
[30] | Moher, D., Liberati, A., Tetzlaff, J., & Altman, D.G. ((2009) ). Preferred reporting iterms for systematic reviews and meta-analyses: The PRISMA statement. PLoS Med, 6: (7), e1000097. |
[31] | Nam, T. ((2015) ). Challenges and concerns of open government: A case of government 3.0 in Korea. Social Science Computer Review, 33: (5), 556-570. |
[32] | Neirotti, P., Paolucci, E., & Raguseo, E. ((2012) ). Telework configurations and labour productivity: Some stylized facts. International Journal of Engineering Business Management, 4: (7), 1-10. |
[33] | Neuroni, A.C., Riedl, R., & Brugger, J. ((2013) ). Swiss executive authorities on open government data: Policy making beyond transparency and participation. Paper Presented at the 46th Hawaii International Conference on System Sciences, Wailea, USA. |
[34] | Open Knowledge Foundation. ((2018) ). The open definition. Retrieved from https://opendefinition.org/. |
[35] | Open Knowledge Foundation. ((2020) ). Global open data index. Retrieved from https://index.okfn.org/place/. |
[36] | Parycek, P., Hochtl, J., & Ginner, M. ((2014) ). Open government data implementation evaluation. Journal of Theoretical and Applied Electronic Commerce Research, 9: (2), 80-99. |
[37] | Pozzi, G., Pigni, F., & Vitari, C. ((2014) ). Affordance theory in the IS discipline: A review and synthesis of the literature. Paper Presented at the 20th Americas Conference on Information Systems, Savannah, USA. |
[38] | Reiter, M., Fettke, P., & Loos, P. ((2013) ). A contribution to theory building for the successful implementation of ERP and BRP – An application of the method of stylized facts. Paper Presented at the 46th Hawaii International Conference on System Sciences, Wailea, USA. |
[39] | Safarov, I., Meijer, A., & Grimmelikhuijsen, S. ((2017) ). Utilization of open government data: A systematic literature review of types, conditions, effects and users. Information Polity, 22: (1), 1-24. |
[40] | Stendal, K., Thapa, D., & Lanamäki, A. ((2016) ). Analyzing the concept of affordances in information systems. Paper Presented at the 49th Hawaii International Conference on System Sciences, Koloa, USA. |
[41] | Ubaldi, B. ((2013) ). Open government data: Towards empirical analysis of open government data initiatives. OECD Working Papers on Public Governance, (22), 1-60. |
[42] | Volkoff, O., & Strong, D.M. ((2013) ). Critical realism and affordances: Theorizing IT-associated organizational change processes. MIS Quarterly, 37: (3), 819-834. |
[43] | Yang, T.M., Lo, J., & Shiang, J. ((2015) ). To open or not to open? Determinants of open government data. Journal of Information Science, 41: (5), 596-612. |
[44] | Zammuto, R.F., Griffith, T.L., Majchrzak, A., Dougherty, D.J., & Faraj, S. ((2007) ). Information technology and the changing fabric of organization. Organization Science, 18: (5), 749-762. |
[45] | Zuiderwijk, A., & Janssen, M. ((2012) ). A comparison of open data policies and their implementation in two Dutch ministries. Paper Presented at the 13th Annual International Conference on Digital Government Research, College Park Maryland, USA. |
[46] | Zuiderwijk, A., & Janssen, M. ((2014) ). Open data policies, their implementation and impact: A framework for comparison. Government Information Quarterly, 31: (1), 17-29. |
[47] | Zuiderwijk, A., & Janssen, M. ((2015) ). Towards decision support for disclosing data: Closed or open data? Information Polity, 20: (2–3), 103-117. |
[48] | Zuiderwijk, A., Shinde, R., & Janssen, M. ((2019) ). Investigating the attainment of open government data objectives: Is there a mismatch between objectives and results? International Review of Administrative Sciences, 85: (4), 645-672. |
Appendices
Appendix
Countries thematised in the retained articles and their maturity scores in the Global Open Data Index of the Open Knowledge Foundation (2020).