
Optimized Multi-Modular Services: Empowering Earth Observation Data Processing
Abstract
The significance of earth observation data spans diverse fields and domains, driving the need for efficient management. Nevertheless, the exponential increase in data volume brings new challenges that complicate processing and storing data. This article proposes an optimized multi-modular service for earth observation data management in response to these challenges. The suggested approach focuses on choosing the optimal configurations for the storage and processing layers to improve the performance and cost-effectiveness of managing data. By employing the recommended optimized strategies, earth observation data can be managed more effectively, resulting in fast data processing and reduced costs.
1Introduction
Earth observation (EO) data acquired from satellites play a key role in various domains, including environmental monitoring (Giuliani et al., 2020), land cover analysis (Singh et al., 2018), water resource management (Guzinski et al., 2014), or global climate change studies (Guo et al., 2015). Despite the broad utilization of EO data, the storing, management, and processing pose significant challenges owing to its continuous expansion caused by daily observations from numerous satellites. This exponential growth presents a multifaceted set of complexities that demand innovative solutions for effective handling and exploitation.
To tackle the challenges EO data poses, a range of technologies have been developed and implemented to simplify their management. Innovative formats like Cloud Optimized GeoTIFF (COG) (Yu et al., 2021) have been proposed to address the complexity of storing multidimensional EO data. The new formats offer significant advantages, such as optimized storage in cloud environments, enabling faster access, efficient retrieval, and seamless processing of vast amounts of EO data. The COG format’s primary advantages can be summarized in two key aspects. First, COG utilizes a tiled structure that covers square areas of the primary raster image, enabling clients to request specific data sections through HTTP range requests. Second, the format supports data compression methods, such as JPEG, Deflate, LZW (Lempel-Ziv-Welch), Packbits, LZMA (Lempel-Ziv-Markov chain-Algorithm), or Zstandard, optimizing data transfer over the internet and reducing storage utilization for more efficient handling of EO data.
EO Data Cubes (DCs) represent a novel paradigm, mitigating Big Data challenges and granting access to vast spatio-temporal datasets in analysis-ready formats (Giuliani et al., 2019). The consistent and systematic delivery of Analysis Ready Data will significantly reduce the burden on EO data users (Giuliani et al., 2017). EODC integrates data from diverse remote sensing platforms and ground-based sensors within the cube framework, fostering evidence-based decision-making and facilitating interdisciplinary research, transcending traditional boundaries to address pressing global challenges such as deforestation, urbanization, and climate change mitigation.
To overcome the challenges posed by the extensive processing of large-scale EO data, the EO community effectively employs high-performance computing (HPC) techniques (Lee et al., 2011), enabling quicker data analysis, improved modelling accuracy, and advanced simulations. Distributed computing frameworks like Dask Python framework (Rocklin, 2015) offer many advantages in EO workflows to parallelize tasks and scale them vertically and horizontally. These solutions facilitate the concurrent processing of extensive EO data, effectively distributing the computational load across numerous nodes. This makes Dask an indispensable choice for tackling large-scale data processing and analysis tasks with enhanced speed and resource utilization.
It is crucial to address storage and processing aspects to manage EO data optimally and efficiently. Adopting innovative solutions like COG is essential in the data storing layer to ensure efficient EO data storage. However, it’s important to note that the COG format supports various data compression methods, which can impact storage savings and processing speed differently. A high compression factor can significantly reduce the data size, but it may require more time to decompress the data during processing. On the other hand, a weak compression factor may not reduce the data size and, therefore, the network transfer time much, thus saving less storage space. Still, it may result in faster processing times (Astsatryan et al., 2020). Finding the optimal compression method becomes challenging, as striking the right balance between storage savings and processing speed is essential. It requires precise consideration and testing to determine the compression method that best suits the specific requirements of handling EO data adeptly and efficiently. Storing EO data in data repositories with the most suitable compression method will result in storage savings, reduced network transfer time, and faster processing.
Several vital factors must be considered to ensure efficient performance in EO data processing using distributed computing. These factors encompass the cluster’s configuration, determining the number of worker nodes and their specific characteristics, such as CPUs and RAM size. Additionally, various objectives become critical for clients. Those needing their computational cloud infrastructure must rely on resources from global cloud providers, which come with associated costs based on the chosen options. Thus, when aiming to select an optimal cluster configuration, it becomes essential to strike a balance between multiple criteria (Keshavarz-Ghorabaee et al., 2018; Žižović et al., 2019). This entails finding the best trade-off between various factors to achieve efficient processing while considering cost, performance, and other relevant considerations. Besides this, another challenge is setting up the cluster itself, which is in addition to the effort of selecting the cluster design that is most appropriate in terms of computing complexity. As a result, rapid and automated cloud-based provisioning and scaling solution for HPC is required.
Efficient management of EO data requires evaluating both storage and processing layers. Making informed decisions regarding data compression and cluster configuration setup for storage and processing layers is essential. The article presents an optimized multi-modular service for enhancing EO data processing based on optimization methods for efficiently handling EO data. The proposed service addresses the data compression challenges and cluster configuration setup by employing optimization methods. Specifically, the Decision-making module evaluates storage and processing layers to make informed decisions regarding data compression and cluster configuration, considering cost, performance, and computing complexity.
The article is organized into three main sections. Firstly, Section 2 provides an overview of the proposed multi-modular service. Following this, Section 3 delves into the details of the Decision-making module. Finally, Section 4 serves as the article’s conclusion.
2Multi-Modular Service
This section outlines the proposed multi-modular service, detailing its architecture and delving into each component individually. The section encompasses the tasks performed by the service, such as providing optimal configuration recommendations, integrating with data repositories, and enabling scalable data processing.
The architecture of the suggested multi-modular service is shown in Fig. 1.
Fig. 1
Architecture of the multi-modular service.
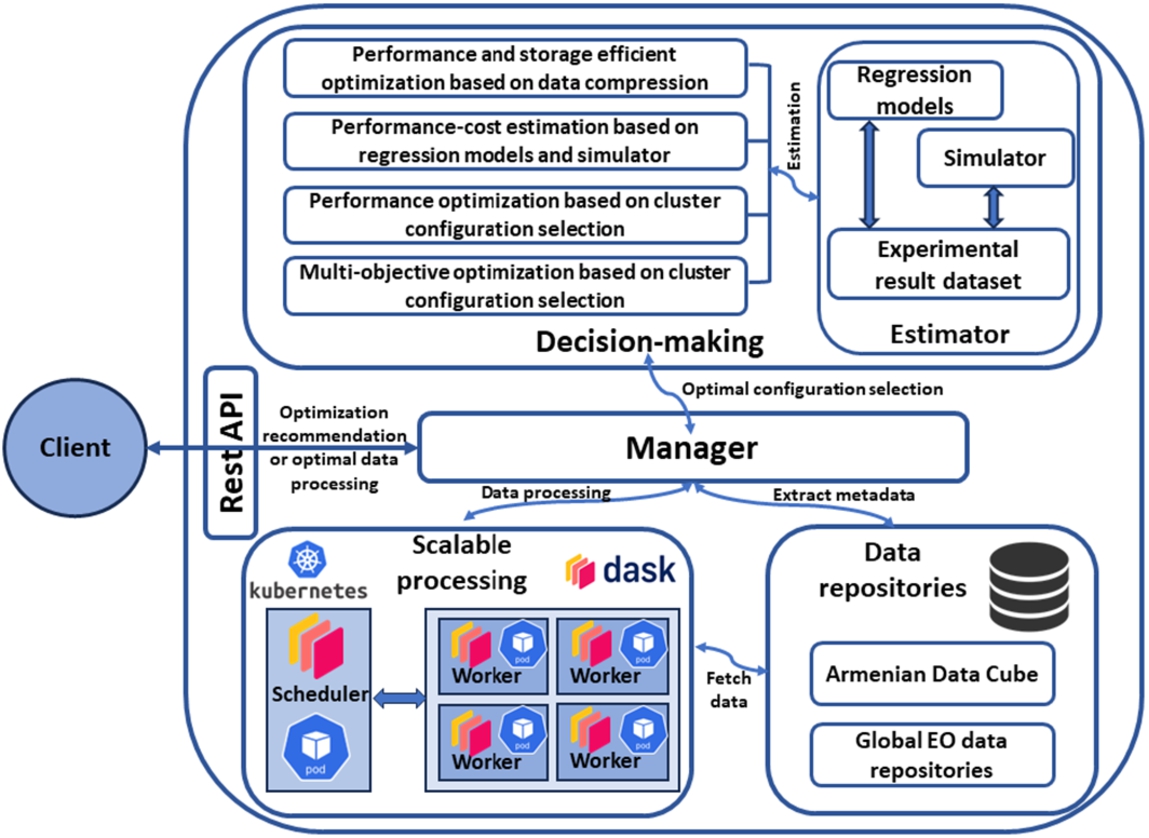
It consists of several modules, including Manager, Data repositories, Scalable processing, and Decision-making with the Estimator submodule. A client can access optimization methods for EO data provided by the service through the REST API.
2.1Manager
The Manager module is responsible for handling the client’s requests. The client communicates with the Manager module via Rest API and can make multiple requests to the Manager for various tasks, including:
• Data compression recommendation: Soliciting suggestions for the most suitable data compression methods for the repository storage,
• Execution time and resource cost estimation: Seeking insights into the anticipated execution time or the cost implications of deploying specific computational resources for a given task,
• Cluster configuration optimization: Paving the way for optimizing cluster configurations, factoring in multiple objectives such as performance and cost, ensuring an astute selection,
• Enabling scalable data processing: Harnessing the potential of the cluster configuration to facilitate scalable data processing, aligning with the prescribed specifications.
The Manager module is the central element that handles the service’s overall functionality. It collaborates harmoniously with other modules through seamless information exchange to efficiently manage and execute client requests. This collaborative effort encompasses:
• Synergy with the decision-making module: Engaging in synergy with the module to attain optimal configurations, ensuring the most effective strategies are employed,
• Seamless integration with the data repository module: Establishing seamless integration with the Data Repository module to access crucial metadata regarding the requisite data for processing,
• Dynamic interplay with the scalable computing module: Establishing dynamic interplay with the module to process data according to the specified cluster configuration, ensuring scalability and efficiency in data processing operations.
In essence, the Manager module serves as a cohesive core orchestrating the interplay between various modules, thereby enabling the efficient execution of client requests and enhancing the overall functionality of our service. Table 1 presents the main input parameters for accessing the Manager module.
Table 1
Main input parameters.
| Parameter | Description |
| Study area | Coordinates of the interested area |
| Period | Period of interest, start and end dates |
| Function | EO data processing function |
These parameters assess the input data’s size and processing complexity by considering the number of operations. The module utilizes these parameters to send requests to Data repositories. It then uses the metadata these repositories provide to estimate the data size required for processing. Specifically, the “Study area” parameter filters tiles and identifies the client’s selected region. In contrast, the “Period” parameter determines the number of images available for the specified time frame, and the “Function” parameter aids in identifying which bands should be utilized in the processing. The cluster configuration chosen for the data processing is one of the extra factors in estimating the execution time of a particular task. The input parameters for trained regression models and a simulator are the main parameters and the description of the cluster configuration, which includes several nodes and their characteristics (CPU and RAM). These tools estimate the time it will take to complete the specified task using these settings. The cost of processing is calculated by considering a variety of variables, such as the execution time, the number of cluster nodes, and the cost rate per node, which is sourced from global cloud providers. It is also feasible to start data processing by providing the same parameters. This information is used to deploy the selected cluster, and the data processing is carried out on this cluster using the provided main parameters.
To get the optimal cluster configuration taking into account single or multiple objectives additional parameters are required, which is described in Table 2.
Table 2
Recommended parameters.
| Data center | Number of nodes (number of CPU cores, RAM, and the processor frequency) |
| Selected objective | Performance, cost, or both |
| Constraints | Execution time and available budget |
Using this provided information, in combination with knowledge of the typical computing instances offered by the global cloud providers, the service generates a range of possible cluster configurations. By the objectives provided by the client and the range of potential clusters generated, these objectives are evaluated using trained regression models and the simulator tool. Subsequently, an optimization algorithm is applied to the estimation dataset. This process filters the possible cluster options, taking into account the objectives and constraints. Only the optimal clusters, aligned with the estimated objectives, are returned to the client. Afterward, the client can choose one of the clusters, considering the estimated goals, and request data processing with the selected cluster configuration. This approach ensures the client can make informed decisions regarding cluster selection and data processing based on their specific requirements and objectives.
2.2Data Repositories
The EO data is securely stored within the Data Repositories module, which boasts an API designed for efficient data retrieval. Furthermore, these repositories offer an API primarily tailored to deliver metadata rather than the entire dataset. This metadata is a lightweight alternative to the voluminous actual data and contains crucial information about the selected geographical area, including the satellite image’s spatial characteristics. Leveraging this metadata, it becomes possible to precisely ascertain the extent of processable data required to fulfill a client’s request. This innovative approach empowers effective data management without necessitating the transmission of the entire dataset. As a result, it conserves valuable bandwidth and minimizes the computational resources required. By leveraging this capability, the service can dynamically compute the exact data size needed and adeptly cater to the client’s requests, all with the invaluable assistance of the metadata. The service is intended to handle repositories that provide either the SpatioTemporal Asset Catalog (STAC) API (Hanson, 2019) or the Web Coverage Service (WCS) of the Open Geospatial Consortium (Baumann, 2010).
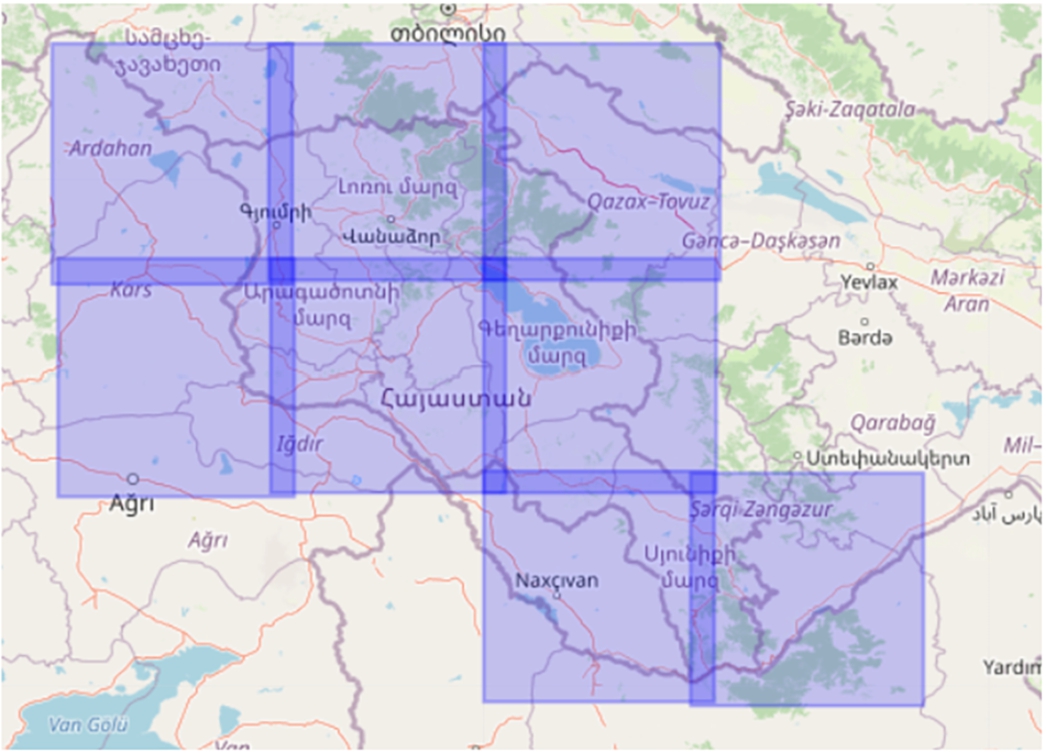
The Armenian Datacube (Asmaryan et al., 2019), which stores EO data collected by several satellites over the area of Armenia, is now compatible with the service. The DC houses a comprehensive collection of analysis-ready data, encompassing Landsat 7/8 and Sentinel-2 imagery covering Armenia. This extensive coverage includes a total of 11 Sentinel-2 scenes (38TLL, 38TML, 38TNL, 38TLK, 38TMK, 38TNK, 38SMJ, 38SNJ, 38SPJ, 38SNH, 38SPH), as well as 9 Landsat 7/8 scenes (171031, 170031, 169031, 171032, 170032, 169032, 168032, 169033, 168033), all thoughtfully curated to facilitate various geospatial analyses. Armenia’s geographical expanse fits snugly within a defined rectangular boundary, with its upper-left coordinates (38.32335165219022, 42.98858178626198) and lower-right coordinates (41.551890393271684, 47.320774961261485) meticulously delineated in the Earth coordinate system. This precise geographical reference ensures that users can readily access the pertinent data for their research and analytical endeavours within Armenia’s confines. Figure 2 shows Sentinel-2 tiles covering the territory of Armenia.
Fig. 2
Sentinel-2 tile example for the territory of Armenia.
The service can also communicate with other global EO data sources offering the APIs mentioned above. The service is engineered to effortlessly interface with a broad spectrum of globally recognized EO data repositories, among which prominent platforms like Google Earth Engine and Amazon AWS Earth stand out (Zhao et al., 2021; Rizvi et al., 2018). These repositories are renowned for housing an extensive range of invaluable EO datasets, offering a treasure trove of geospatial information. These repositories contain an extensive catalog of datasets, including but not limited to Landsat, Sentinel, MODIS, and various other EO data sources. These datasets encompass an array of spatial and temporal resolutions, making them versatile assets for researchers, scientists, and analysts in diverse fields. The configuration files provide flexibility to tailor interactions with these repositories.
Leveraging configuration files lets you fine-tune and adapt the repositories the users need. These files are meticulous record keepers, storing crucial information such as the API’s foundational URL and its type, WCS, or STAC. These settings play a pivotal role in enabling the service to establish connections and communicate with many data sources seamlessly. This streamlined approach facilitates rapid and efficient retrieval and processing of EO data, catering to various customer requirements with agility and precision.
EO data repositories adopt a grid-based organization, with each grid tile corresponding to a precise location on the Earth’s surface. The dimensions of these tiles vary depending on the satellite source. For instance, Sentinel-2 tiles typically conform to a square shape and maintain a consistent, fixed size. Specifically, the dimensions of a single Sentinel-2 tile span approximately 100 kilometers by 100 kilometers, effectively covering a substantial land area of 10,000 square kilometers. This standardized tile structure enhances the accessibility and analysis of EO data, facilitating efficient utilization of diverse geospatial applications (Astsatryan et al., 2015a).
2.3Scalable Processing
The Scalable processing module handles the EO data processing responsibilities. It uses client-requested choices such as region of interest, time, particular bands required for the processing function to collect the necessary EO data from data sources and the Dask cluster configuration including a number of worker nodes and their characteristics. Upon receiving the necessary input, the module seamlessly initiates a Dask cluster and triggers the processing workflow. This process involves the module intelligently harnessing the Python API provided by the Dask gateway package to discern a worker node’s precise attributes, including crucial factors like core count and available RAM capacity. Subsequently, utilizing this powerful API, the module dynamically creates a Dask cluster while ensuring the number of worker nodes aligns precisely with the quantity specified by the client.
The Manager supplies the necessary parameters for building this cluster, including data from the Decision-making module on the ideal number of nodes and each node’s computing characteristics. The Scalable processing module then uses the specified Dask cluster to process the data. This module guarantees quick, automated provisioning and scaling of cloud resources, enabling effective management of computing resources by processing demands. Recent implementation (Astsatryan et al., 2023) provides automatic scalability and fast resource provisioning by using the Dask distributed package with the remote management tools deployed on a Kubernetes cluster (Poniszewska-Marańda and Czechowska, 2021), which is a powerful system for managing containerized applications and services at scale. It provides a robust platform for automating containerized workloads’ deployment, scaling, and management. This configuration allows the module to manage resources and scale flexibly in response to workload. A pod in the Kubernetes cluster corresponds to one worker node in the Dask cluster. According to the module’s setup, each pod can access particular processing resources, such as CPU and RAM. This matching of worker nodes to pods guarantees that processing activities may be divided and carried out concurrently across the available resources, making effective and parallel use of the computing capacity of the Kubernetes cluster.
The module can adjust to changing workloads and processing needs using Dask automatic scaling and resource allocation features. The module may spawn more pods with the right resources to tackle the workload as the quantity or complexity of processing jobs grows using the recommendation of the Decision-making module. This scaling strategy guarantees that the module can effectively analyse EO data while maximizing the usage of the computational resources capabilities of the underlying Kubernetes cluster and enables the module to handle large-scale EO data processing tasks effectively while optimizing the computational resources for faster and more responsive data processing.
Data processing relies on computational resources from both CloudLab (Duplyakin et al., 2019) and the Armenian cloud infrastructure (Astsatryan et al., 2015c). CloudLab is a research testbed for experimenting with advanced cloud computing technologies, catering to researchers and academics. It offers diverse resources, custom experiment topologies, and precise network control for developing and testing cloud-related innovations. The Armenian cloud infrastructure, built on OpenStack (Sefraoui et al., 2012), serves Armenia’s computing needs, providing virtualized resources and enabling cloud-based applications and services. It supports research and business use cases while offering flexibility and scalability.
3Decision-Making
This section describes the decision-making module, which provides data storage and performance optimization recommendations. Additionally, it showcases experimental results that highlight the effectiveness of the module.
The Decision-making module provides improved methods for managing EO data for storage and processing layers. The optimization is achieved by selecting the optimal setup. The Estimator sub-module, which includes a simulator and trained regression models constructed on historical experimental datasets, works with the Decision-making module to produce these most suitable configuration suggestions. A comprehensive historical experimental dataset has been compiled from a series of experiments spanning various input data sizes, ranging from 1 GB to 1 TB (across 11 data points). These experiments were conducted across a diverse range of cluster configurations, from setups with 1 CPU and 2 GB of RAM to those with 64 CPUs and 128 GB of RAM, following a power-of-2 progression (a total of 35 configurations). Each cluster maintained a total CPU count of 128, with the number of nodes varying from 1 to 128. Each experiment was repeated ten times to ensure robustness, and the average result was recorded. This iterative approach enhances the reliability of the findings by accounting for variability and uncertainties, thereby improving the statistical validity of the results. In total, 3850 experiments were conducted. Additionally, the dataset incorporates input data compressed using four lossless compression methods supported by data processing frameworks. For each potential cluster configuration, input data sizes ranging from 8 GB to 256 GB were evaluated, totalling 6 points. Each experiment was repeated five times to enhance accuracy, resulting in 4200 experiments. The Decision-making module offers performance optimization recommendations to clients. To obtain this information, clients make requests to the Manager, which, in turn, interacts with the Decision-making module as a part of the multi-modular service.
The Decision-making module provides a dual set of valuable recommendations, each catering to distinct aspects of data management and distributed processing:
• Optimal data compression selection: The module is pivotal in efficiently preserving EO data in its first capacity. It expertly evaluates and prescribes the most suitable data compression methodology. This ensures that EO data is stored in a manner that conserves storage space and guarantees peak performance during subsequent distributed processing operations.
• Cluster optimization guidance: The module steps into cluster selection and optimization in its second role. It offers sage advice on choosing the ideal cluster configuration for the specific distributed processing task. By considering a range of factors, such as computational requirements and workload, it guides users towards the cluster that promises optimal performance and resource utilization.
3.1Storage Optimization
Data compression methods are crucial for reducing storage needs, speeding up network transfers, and improving performance during distributed data processing. The two primary categories of data compression methods are lossy and lossless (Kavitha, 2016). Lossless compression methods maintain the complete integrity of the original data, in contrast to lossy compression, which makes certain data fidelity concessions to achieve larger compression ratios. Lossless approaches are the best option for EO data since these data frequently contain delicate features necessary for precise scientific analysis and interpretation. Data compression methods make it possible to improve speed while still preserving storage space. However, finding the optimal trade-off to balance performance improvement and storage saving is challenging.
In pursuit of pinpointing the most suitable data compression method tailored to specific use cases, the findings of an insightful study (Astsatryan et al., 2021) recommend a comprehensive assessment methodology. This assessment encompasses the estimation of data processing execution times, a meticulous consideration of an array of data compression techniques, and the diverse spectrum of distributed computing clusters characterized by varying node counts and resource allocations. These evaluations are skillfully executed through employing polynomial regression models, as detailed in Eq. (1).
(1)
The Decision-making module then suggests an optimal data compression method for effective data storage based on the prediction results. The evaluation of the study focuses on determining how well-distributed computing environments handle data.
To determine the most suitable compression technique for EO data, it is essential to evaluate the size of the EO data under various compression methods and analyse the time required for processing the data through the specified compressed techniques using diverse cluster configurations, considering variations in the number of nodes. In making an assessment, the Lalayan (2023) study considers the data compression methods supported by the COG format and distributed computing frameworks. Several lossless compression methods for EO data, such as Dask and Spark popular frameworks, including Deflate, LZW, Packbits, and Zstandard, produce a different compression ratio. As a result, the decompression duration differs between these various methods. This examination evaluates the effects of the Dask and Spark environments on the speed of data processing and compares the compressed data size with the mentioned methods. Study shows that Dask and Spark both offer comparable data processing performance. Figure 3 illustrates the execution time of 16, 32, and 64 GBs of input data considering various data compression methods in the Dask cluster with 32 nodes.
Fig. 3
Execution time with various data sizes and compression methods.
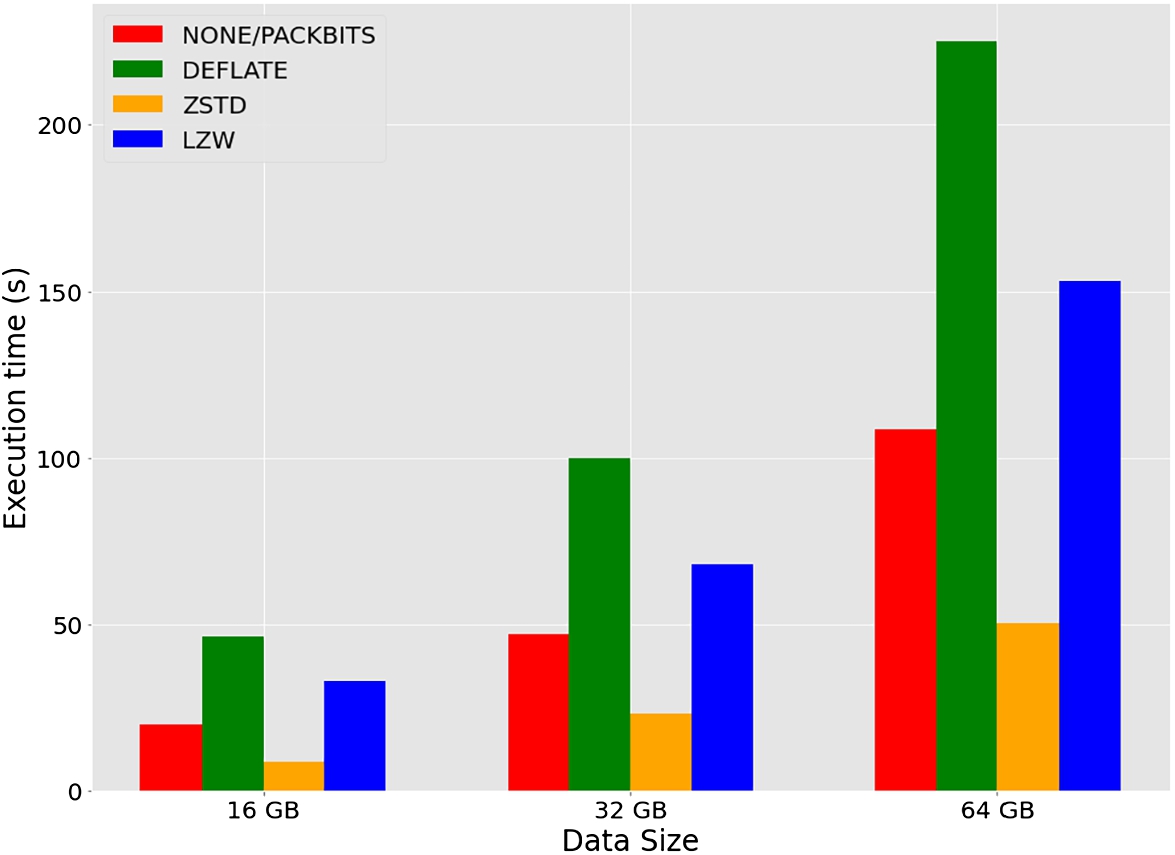
However, combining the Dask environment with the Zstandard compression method yields the best performance results. This combination produces the most beneficial compression factor compared to all other potential lossless compression methods. It considerably reduces execution times by around 4.72 times in Dask and 3.99 times in Spark compared to default methods. This result demonstrates the value of combining the Zstandard compression method with the Dask environment to produce higher data processing performance.
3.2Performance Optimization
Distributed computing techniques efficiently solve the issues of managing large-scale EO data processing. Clusters of various sizes are required for tasks of different complexities, encompassing a range of processing functions and input data volume. Smaller clusters may successfully handle light data processing, while the bigger ones are necessary for large-scale data processing tasks. These intricacies complicate choosing the optimal cluster design, which involves the number of nodes and the characteristics of each node (such as core count and RAM capacity). It is crucial to evaluate the task’s execution time across a range of potential cluster configurations to choose the optimal cluster for attaining performance-efficient distributed computing of EO data.
A series of studies produced estimates for a specific EO data processing task across multiple clusters. These evaluations included a range of data processing difficulty levels and were carried out on pre-selected clusters. These evaluation results were catalogued in a dataset to use as a basis for building simulation tools and regression models. These models and tools are then used to forecast processing times for certain activities with different levels of complexity inside particular clusters.
Several experiments were carried out to provide estimates for the execution times of various EO data processing tasks across various clusters. These experiments were conducted on clusters chosen from a predetermined limited set, covering multiple levels of data processing complexities. The results of these tests were gathered and kept in a dataset. To estimate the execution time for a particular task of a specified complexity inside different clusters, several prediction models and simulator tools are used, which were built using the dataset.
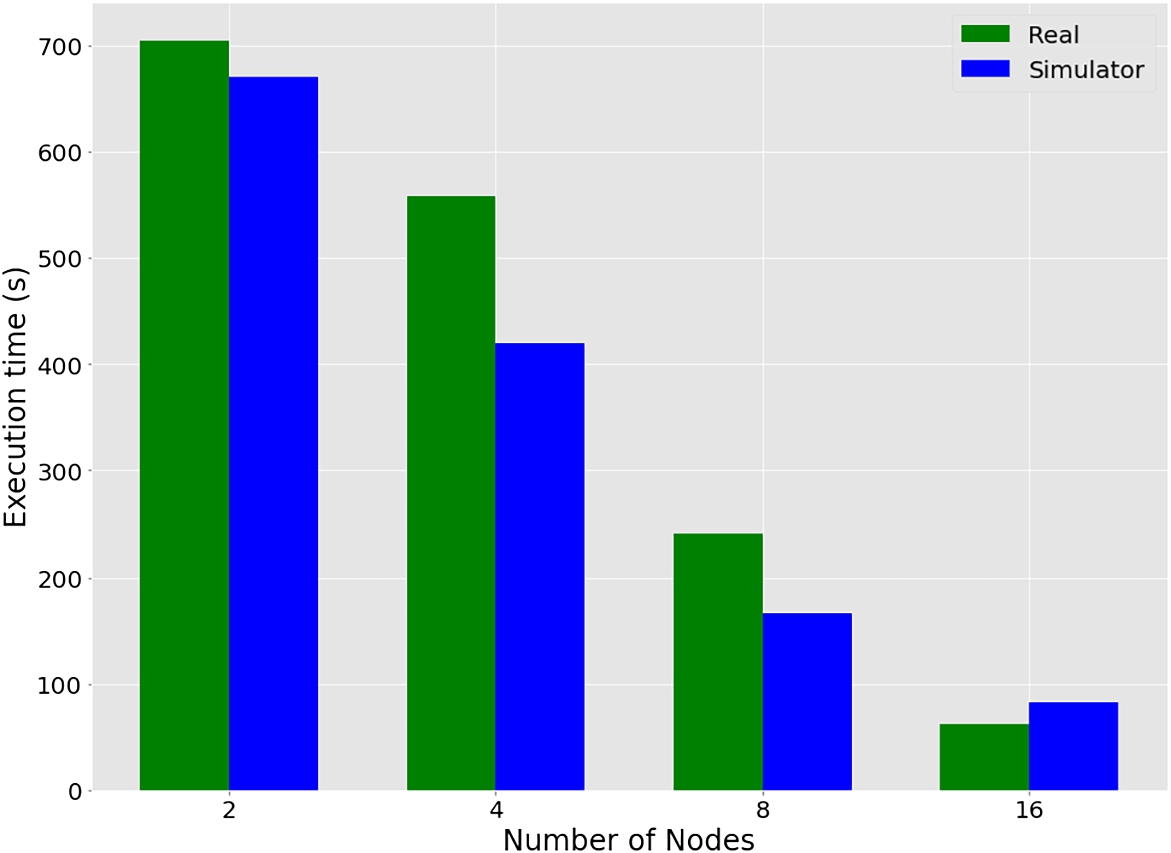
The estimator sub-module includes trained regression models and a simulator used during the evaluation. To predict the execution time of the specific EO data processing task, a simulator specifically built for those procedures and based on the CloudSim simulator (Buyya et al., 2009) is used. The size of the input data, which relies on the period, region, and bands, as well as the complexity of the designated function, are two criteria considered throughout the estimating process. The simulator also takes into account the client-described cloud infrastructure. The evaluation results demonstrate the high accuracy of the simulator in comparison to actual experiments. Figure 4 reflects the comparison of the actual and simulator execution times using different numbers of nodes in the cluster. Each node has eight cores and 16 GB RAM.
Fig. 4
Real vs simulator execution time periods.
It is worth mentioning that the simulator obtains an
The optimal cluster configuration for the particular task can be found by examining the data produced from the simulator and finding the best trade-off balance between performance efficiency and cost-effectiveness. This allows decision-makers to make well-informed decisions when choosing the best cluster configuration to meet their unique processing needs while successfully controlling related expenses. The proposed simulator and trained regression models offer methods to assess the execution time and computation cost of a task for a limited set of potential Dask clusters, which can be deployed within the client’s described cloud infrastructure. To tackle the challenge of selecting the most suitable cluster configuration, the study (Lalayan et al., 2023) suggests a multi-objective optimization method for optimal EO data processing, considering both performance and cost objectives. The solution involves generating a set of possible configurations for the distributed data processing framework, evaluating the objectives, and finding the Pareto frontier, the set of options where no alternative is superior in every objective at once. This is determined by analysing and comparing several solutions based on established objectives. By recognizing the trade-offs between different objectives, choosing a solution that fits interests in the decision-making process is possible. Clients can take into account their own execution time and financial constraints in addition to the previously described procedures. The possible configuration set will be filtered by considering this information. Providing clients with a more concentrated set of feasible alternatives that align with their particular needs entails finding the subset of solutions that balance execution time and financial limitations. By employing this approach, the optimal cluster configuration that aligns with their specific needs and constraints can be used, ensuring an efficient balance between data processing performance and computation cost for EO data processing tasks. The evaluation of the experiments shows that the performance can rise by as much as 1.66 times while costs can decrease by a factor of 2.38 in some scenarios using the suggested method.
4Conclusion
The paper proposed a multi-modular service for enhancing EO data processing that combines numerous separate optimization research investigations and studies. This service provides optimal configuration selection to efficiently handle EO data at both the storage and processing layers. Pre-trained regression models and a simulator are employed for assessing the goals, demonstrating a high level of accuracy when compared to the actual values. In the storage layer, the service provides recommendations for optimal data compression methods to save storage and improve data processing performance. According to the evaluations, selecting the optimal data compression method may improve the efficiency of distributed computing, with Zstandard being the compression method of optimal choice for EO satellite images. The optimal cluster configurations are evaluated and selected using the Pareto multi-objective optimization technique by considering performance and cost objectives. Based on the recommended distributed computing cluster, the service performs scalable processing of EO data by establishing the cluster in the Dask environment, allowing for efficient parallel computation and analysis.
It is planned to enhance the precision of the estimating module while concurrently reducing error rates within the optimization module. Moreover, the service is planned to be enhanced by incorporating Spatial Online Analytical Processing, integrating various data processing functions (Rivest et al., 2005), and integrating machine learning techniques, thus expanding its capabilities and functionalities. These strategic initiatives are poised to empower the EO community to monitor the environment effectively and comprehensively.
Acknowledgements
The research was supported by the Science Committee of the Republic of Armenia and the University of Geneva Leading House by the projects entitled “Scalable data processing platform for EO data repositories” (Nr. 22AA-1B015), “Self-organized Swarm of UAVs Smart Cloud Platform Equipped with Multi-agent Algorithms and Systems” (Nr. 21AG-1B052), “Software System for Implementing Fault Tolerant Surveillance and Targeted Tasks Performance of a Collective Artificial Intelligent and Self-Organized Swarm of Drones” (Nr. 20TTAT-RBe016), and “ADC4SD: Armenian Data Cube for Sustainable Development”
References
1 | Asmaryan, S., Muradyan, V., Tepanosyan, G., Hovsepyan, A., Saghatelyan, A., Astsatryan, H., Grigoryan, H., Abrahamyan, R., Guigoz, Y., Giuliani, G. ((2019) ). Paving the way towards an Armenian Data Cube. Data, 4: (3), 117. https://doi.org/10.3390/data4030117. |
2 | Astsatryan, H., Hayrapetyan, A., Narsisian, W., Saribekyan, A., Asmaryan, Sh., Saghatelyan, A., Muradyan, V., Guigoz, Y., Giuliani, G. Ray, N. ((2015) a). An interoperable web portal for parallel geoprocessing of satellite image vegetation indices. Earth Science Informatics, 8: , 453–460. https://doi.org/10.1007/s12145-014-0165-3. |
3 | Astsatryan, H., Hayrapetyan, A., Narsisian, W., Asmaryan, S., Saghatelyan, A., Muradyan, V., Giuliani, G., Guigoz, Y., Ray, N. ((2015) b). An interoperable cloud-based scientific GATEWAY for NDVI time series analysis. Computer Standards & Interfaces, 41: , 79–84. https://doi.org/10.1016/j.csi.2015.02.001. |
4 | Astsatryan, H., Sahakyan, V., Shoukourian, Y., Dongarra, J., Cros, P.-H., Dayde, M., Oster, P. ((2015) c). Strengthening compute and data intensive capacities of Armenia. In: 2015 14th RoEduNet International Conference – Networking in Education and Research (RoEduNet NER), pp. 28–33. https://doi.org/10.1109/RoEduNet.2015.7311823. |
5 | Astsatryan, H., Kocharyan, A., Hagimont, D., Lalayan, A. ((2020) ). Performance optimization system for hadoop and spark frameworks. Cybernetics and Information Technologies, 20: (6), 5–17. https://doi.org/10.2478/cait-2020-0056. |
6 | Astsatryan, H., Lalayan, A., Kocharyan, A., Hagimont, D. ((2021) ). Performance-efficient recommendation and prediction service for Big Data frameworks focusing on data compression and in-memory data storage indicators. Scalable Computing: Practice and Experience, 22: , 401–412. https://doi.org/10.12694/scpe.v22i4.1945. |
7 | Astsatryan, H., Lalayan, A., Giuliani, G. ((2023) ). Scalable data processing platform for earth observation data repositories. Scalable Computing: Practice and Experience, 24: (1), 35–44. https://doi.org/10.12694/scpe.v24i1.2041. |
8 | Baumann, P. ((2010) ). Beyond rasters: introducing the new OGC web coverage service 2.0. In: 18th ACM SIGSPATIAL International Symposium on Advances in Geographic Information Systems, ACM-GIS 2010, pp. 320–329. https://doi.org/10.1145/1869790.1869835. |
9 | Buyya, R., Ranjan, R., Calheiros, R.N. ((2009) ). Modeling and simulation of scalable Cloud computing environments and the CloudSim toolkit: challenges and opportunities. In: 2009 International Conference on High Performance Computing & Simulation, pp. 1–11. https://doi.org/10.1109/HPCSIM.2009.5192685. |
10 | Duplyakin, D., Ricci, R., Maricq, A., Wong, G., Duerig, J., Eide, E., Stoller, L., Hibler, M., Johnson, D., Webb, K., Akella, A., Wang, K., Ricart, G., Landweber, L., Elliott, C., Zink, M., Cecchet, E., Kar, S., Mishra, P. ((2019) ). The design and operation of CloudLab. In: Proceedings of the USENIX Annual Technical Conference (ATC), pp. 1–14. |
11 | Giuliani, G., Chatenoux, B., De Bono, A., Rodila, D., Richard, J.-P., Allenbach, K., Dao, H., Peduzzi, P. ((2017) ). Building an earth observations data cube: lessons learned from the Swiss Data Cube (SDC) on generating Analysis Ready Data (ARD). Big Earth Data, 1: (1–2), 100–117. https://doi.org/10.1080/20964471.2017.1398903. |
12 | Giuliani, G., Camara, G., Killough, B., Minchin, S. ((2019) ). Earth observation open science: enhancing reproducible science using data cubes. Data, 4: , 147, https://doi.org/10.3390/data4040147. |
13 | Giuliani, G., Egger, E., Italiano, J., Poussin, C., Richard, J.-P., Chatenoux, B. ((2020) ). Essential variables for environmental monitoring: what are the possible contributions of earth observation data cubes? Data, 5: (4). https://doi.org/10.3390/data5040100. |
14 | Guo, H.-D., Zhang, L., Zhu, L.-W. ((2015) ). Earth observation big data for climate change research. Advances in Climate Change Research, 6: (2), 108–117. Special issue on advances in Future Earth research. https://doi.org/10.1016/j.accre.2015.09.007. |
15 | Guzinski, R., Kass, S., Huber, S., Bauer-Gottwein, P., Jensen, I.H., Naeimi, V., Doubkova, M., Walli, A., Tottrup, C. ((2014) ). Enabling the use of earth observation data for integrated water resource management in Africa with the water observation and information system. Remote Sensing, 6: (8), 7819–7839. https://doi.org/10.3390/rs6087819. |
16 | Hanson, M. ((2019) ). The open-source software ecosystem for leveraging public datasets in Spatio-Temporal Asset Catalogs (STAC). In: AGU Fall Meeting Abstracts, Vol. 2019: , pp. 23–29. |
17 | Kavitha, P. ((2016) ). A survey on lossless and lossy data compression methods. International Journal of Computer Science & Engineering Technology, 7: (3), 110–114. |
18 | Keshavarz-Ghorabaee, M., Amiri, M., Zavadskas, E.K., Turskis, Z., Antucheviciene, J. ((2018) ). Simultaneous Evaluation of Criteria and Alternatives (SECA) for multi-criteria decision-making. Informatica, 29: (2), 265–280. https://doi.org/10.15388/Informatica.2018.167. |
19 | Lalayan, A.G. ((2023) ). Data compression-aware performance analysis of dask and spark for earth observation data processing. Mathematical Problems of Computer Science, 59: , 35–44. https://doi.org/10.51408/1963-0100. |
20 | Lalayan, A., Astsatryan, H., Giuliani, G. ((2023) ). A multi-objective optimization service for enhancing performance and cost efficiency in earth observation data processing workflows. Baltic Journal of Modern Computing, 11: (3), 420–434. https://doi.org/10.22364/bjmc.2023.11.3.05. |
21 | Lee, C., Gasster, S., Plaza, A., Chang, C.-I., Huang, B. ((2011) ). Recent developments in high performance computing for remote sensing: a review. IEEE Journal of Selected Topics in Applied Earth Observations and Remote Sensing, 4: , 508–527. https://doi.org/10.1109/JSTARS.2011.2162643. |
22 | Poniszewska-Marańda, A., Czechowska, E. ((2021) ). Kubernetes cluster for automating software production environment. Sensors, 21: (5), 1910. https://doi.org/doi.org/10.3390/s21051910. |
23 | Rivest, S., Bédard, Y., Proulx, M.-J., Nadeau, M., Hubert, F., Pastor, J. ((2005) ). SOLAP technology: merging business intelligence with geospatial technology for interactive spatio-temporal exploration and analysis of data. ISPRS Journal of Photogrammetry and Remote Sensing, 60: (1), 17–33. https://doi.org/10.1016/j.isprsjprs.2005.10.002. |
24 | Rizvi, S.R., Killough, B., Cherry, A., Gowda, S. ((2018) ). Lessons learned and cost analysis of hosting a full stack Open Data Cube (ODC) application on the Amazon Web Services (AWS). In: IGARSS 2018 – 2018 IEEE International Geoscience and Remote Sensing Symposium, pp. 8643–8646. https://doi.org/10.1109/IGARSS.2018.8518084. |
25 | Rocklin, M. ((2015) ). Dask: parallel computation with blocked algorithms and task scheduling. In: Python in Science Conference, pp. 126–132. https://doi.org/10.25080/Majora-7b98e3ed-013. |
26 | Sefraoui, O., Aissaoui, M., Eleuldj, M. ((2012) ). OpenStack: toward an open-source solution for cloud computing. International Journal of Computer Applications, 55: (3), 38–42. https://doi.org/10.5120/8738-2991. |
27 | Singh, S.K., Laari, P.B., Mustak, S., Srivastava, P.K., Szabó, S. ((2018) ). Modelling of land use land cover change using earth observation data-sets of Tons River Basin, Madhya Pradesh, India. Geocarto International, 33: (11), 1202–1222. https://doi.org/10.1080/10106049.2017.1343390. |
28 | Yu, J., Yang, H., Sun, H., Wang, Y., Chen, K., Yu, Y., You, Y. ((2021) ). Realtime remote sensing image publishing system based on COG technology. In: 2021 28th International Conference on Geoinformatics, pp. 1–5. https://doi.org/10.1109/IEEECONF54055.2021.9687665. |
29 | Zhao, Q., Yu, L., Li, X., Peng, D., Zhang, Y., Gong, P. ((2021) ). Progress and trends in the application of Google Earth and Google Earth Engine. Remote Sensing, 13: (18), 3778. https://doi.org/10.3390/rs13183778. |
30 | Žižović, M.M., Albijanić, M., Jovanović, V., Žižović, M. ((2019) ). A new method of multi-criteria analysis for evaluation and decision making by dominant criterion. Informatica, 30: (4), 819–832. https://doi.org/10.15388/Informatica.2019.231. |


