
Performance Evaluation of Different Dispatching Rules and Heuristics in a Fully Automated Parking System
Abstract
Conventional parking lots struggle to meet demand, prompting the rise of Fully Automated Parking Systems (FAPS), offering eco-friendly alternatives with advanced technology. However, operational challenges persist, especially in planning and scheduling. Real-time responsiveness necessitates dispatching rules and heuristics. This study comprehensively explores FAPS operational dynamics, assessing various rule combinations’ impact on customer wait times and system utilization. Utilizing a six-month MATLAB simulation, results favour the Nearest-Available-Slot (NAS) allocation rule coupled with First-Come-First-Served (FCFS) sequencing, emphasizing allocation’s pivotal role in system efficiency. Future research will refine allocation strategies to further optimize FAPS operational performance.
1Introduction
The exponential growth of vehicles exacerbates urban traffic congestion and parking challenges. As cities face diminishing space amid population growth and increased motorization rates, the construction of multi-story parking systems becomes imperative (Buehler et al., 2017; Pypno, 2008). These systems alleviate space constraints by utilizing vertical structures. Over the past two decades, advancements in technology have propelled the widespread adoption of Fully Automated Parking Systems (FAPS) worldwide. FAPS integrate software systems with mechanical lifts and pallets to efficiently store and retrieve vehicles in multi-level modular garages, achieving up to 84% space utilization (Serpen and Dou, 2015). Apart from optimizing space, FAPSs offer time and energy savings by eliminating the need for searching available parking slots. Despite their advantages, high setup costs and prolonged service times during rush hours pose challenges. The extended waiting times can be attributed to technical issues, poor planning, and customer-related concerns. Without well-coordinated schedules and operational planning to complement mechanical and technological advancements, customer dissatisfaction due to prolonged wait times cannot be mitigated.
While the design of FAPS presents its own set of challenges, ensuring efficient operation is equally crucial for optimizing system performance. This study focuses on developing dispatching rule-based algorithms to efficiently manage vehicle allocation and retrieval in FAPSs. These operational challenges involve complex tasks such as assignment sequencing and real-time task management, which are inherently combinatorial and uncertain. To address these issues, the study employs dispatching rules and heuristics, supported by a simulation model that considers dynamic and stochastic factors. Through rigorous testing, the study identifies the most efficient operating rules among various strategies for FAPS. Overall, this research contributes to optimizing FAPS operations and fills a crucial gap in the literature on operational planning and control in FAPSs. It underscores the importance of integrating customer behaviour and real-time dynamics into the development of dispatching rules, with statistical analysis providing robust support throughout the study.
The structure of the paper is outlined as follows: In Section 2, the problem is elucidated, and contributions to the existing literature gap are underscored. Section 3 delineates the candidate dispatching rules and heuristics. Section 4 introduces the research methodology, including modelling assumptions and system parameters. Section 5 presents the results of the simulation study, assessing the performance of dispatching rules and heuristics, along with a performance analysis. Finally, Section 6 provides a summary of the research and draws general conclusions.
2The Problem Statement and Literature Review
The technological advancements of the last two decades and the benefits of FAPS have made FAPS more attractive all over the world. Still, these systems have some issues that should be handled. As a relatively new and promising topic, problems of these systems are getting more attention from researchers (Y. Chen et al., 2021; Debnath and Serpen, 2015; Mirzaei et al., 2017; Serpen and Dou, 2015; Wu et al., 2019; Yalcin et al., 2018; Zhang et al., 2020). The FAPS design is one of the challenging issues due to the conflict between space utilization and simplicity of operations. The concern of this research is the management of operations, including operational planning and control.
2.1FAPS Design Problems
Different building shapes, transport systems, and several possible slot (cell) layouts can be arranged to maximize capacity and minimize retrieval time in FAPSs. However, there is a conflict between space efficiency and operational convenience. For example, a circular design is more convenient operationally than a rectangular one, but the space efficiency is much below a rectangular building. Some researchers have presented the space utilization efficiency of different FAPS designs (Nayak et al., 2013; Serpen and Dou, 2015). Parking and retrieval operations conducted by robots are more complex than rectangular garages. Conversely, operations are executed more easily in circular buildings as robots can easily reach all parking lots (Nayak et al., 2013). To summarize, on the one hand, there is space efficiency, and on the other hand, there is operational simplicity. Therefore, the FAPS design is challenging due to the conflict between space utilization and operation management. The systems in the rectangular structure are preferred in practice because they use the entire area more effectively.
2.2FAPS Operational Planning Problems
Fig. 1
The basic process flow diagram of FAPSs.
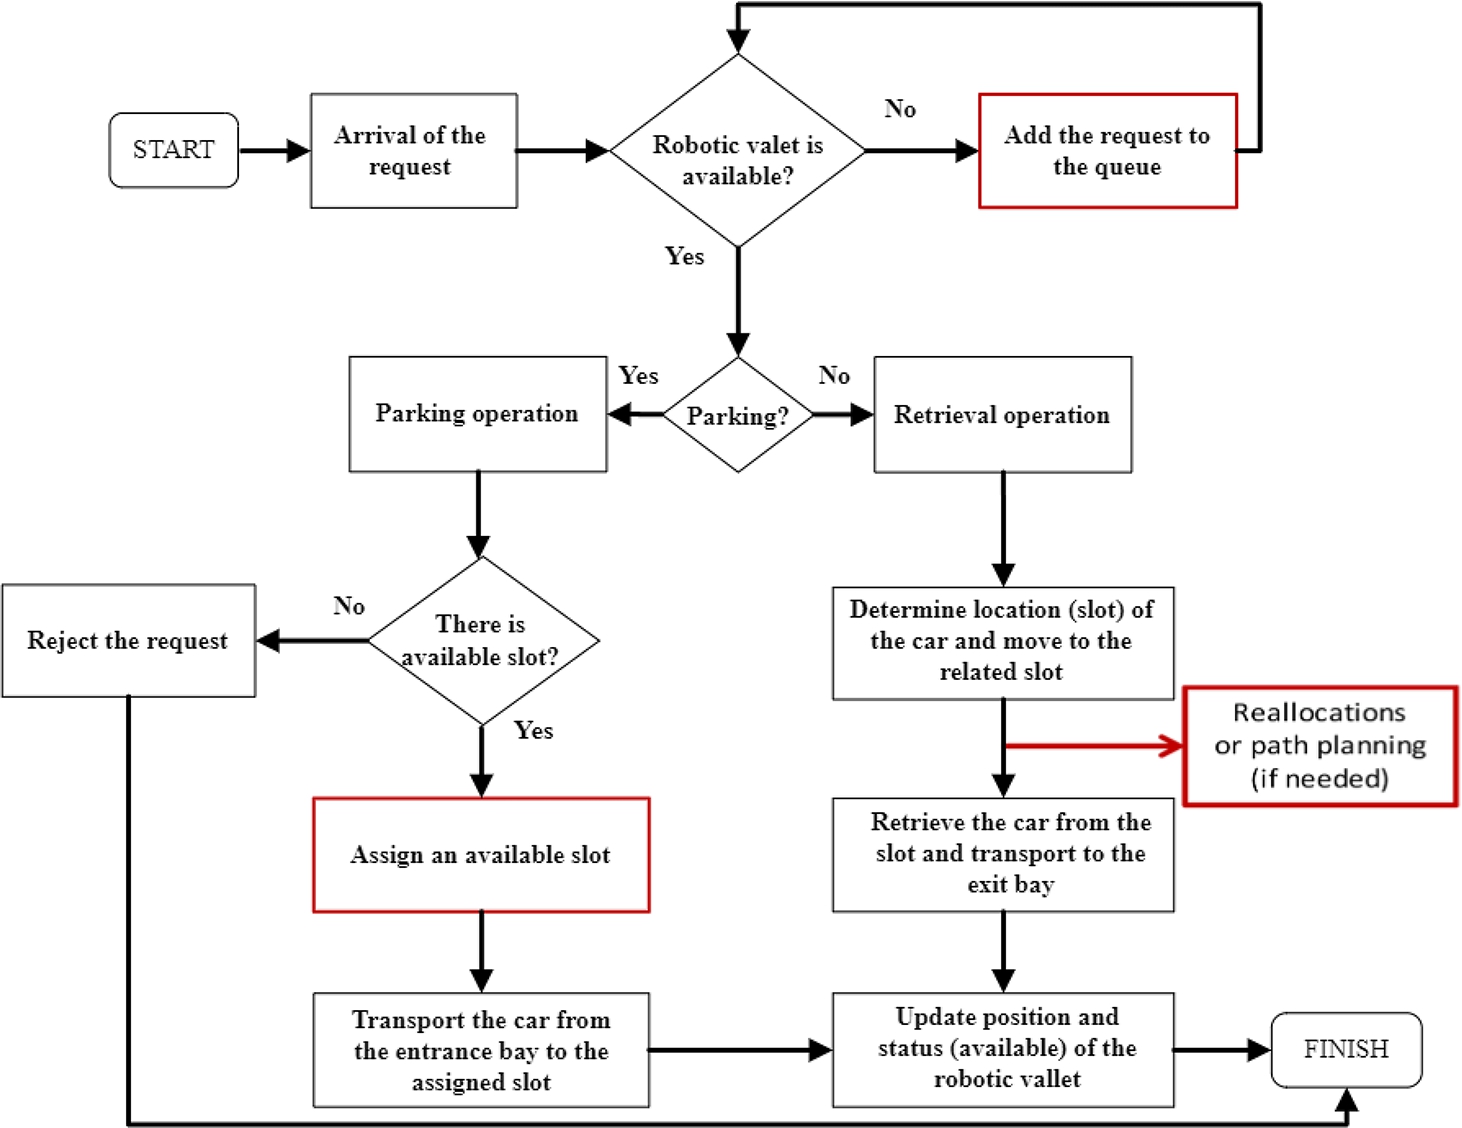
The car parking and retrieval process executed in FAPS can be summarized as follows: drivers leave their cars in the entrance bay. Then, vehicles are transported to one empty slot by the robot (carrier) without a driver based on arbitrary or predetermined rules. Later, when the customers return and want to retrieve their cars, they are taken from their parking slots and moved to the exit bay. The basic process flow diagram, which comprises the main operations and constitutes the core of the algorithms, is presented in Fig. 1.
Sequencing of the requests: Car storage and retrieval operations in Fully Automated Parking Systems (FAPS) typically follow a First-Come-First-Served (FCFS) approach. However, alternative heuristic or dispatching rules could potentially enhance performance, contingent upon specific system features and customer profiles. Unfortunately, limited research has been conducted on sequencing problems. Chen and Sun (2017) compared FCFS with cross-access strategies regarding customer waiting time, while Chen et al. (2021) analysed the effects of prioritizing customers who pre-book appointments, using similar performance criteria.
The allocation of cars: The car allocation problem involves determining the most suitable slot for storing each vehicle, often employing a nearest-available-slot approach. This allocation decision significantly influences subsequent operations and must be treated as an optimization problem rather than a simple decision. Although Chen et al. (2021) examined the impact of a dedicated storage policy, they did not address the optimal allocation of individual cars. A study resembling this research was conducted by Y. Chen et al. (2021), Serpen and Debnath (2019), where they utilized a genetic algorithm to determine the optimal parking location for each car in a rotary parking system, minimizing overall parking and pickup times.
Table 1
Summary of the research on FAPS’ operational planning problems.
| Reference | Focus | Key findings |
| Y. Chen et al. (2021), Mirzaei et al. (2017), Serpen and Debnath (2019), Wu et al. (2019), Yalcin et al. (2018), Zhang et al. (2020) | FAPS design issues | Technological advancements have made FAPS more attractive worldwide. |
| Chen and Sun (2017), Serpen and Dou (2015) | FAPS design efficiency | Different designs (circular vs. rectangular) impact space efficiency and operations. |
| Chen and Sun (2017) | Sequencing problems | Compared FCFS and cross-access strategies for customer waiting time analysis. |
| Chen et al. (2021) | Sequencing problems | Analysed the impact of priority for pre-booked customers on performance criteria. |
| Wu et al. (2019) | Allocation of cars | Employed a genetic algorithm to minimize parking and pickup times for rotary systems. |
| Kuda et al. (2022) | Demand-supply imbalance | Investigated the imbalance between FAPS demand and supply. |
| The present study | Sequencing and allocation problem | The performance evaluation of dispatching rules designed to optimize the sequencing of requests and the allocation of FAPSs. |
As evident from the literature summarized in Table 1, prior studies predominantly concentrate on the design and technological aspects of Fully Automated Parking Systems (FAPS). However, scant attention has been paid to operational challenges such as low efficiency and extended service times. In contrast, this study shifts the focus towards operational optimization, specifically addressing sequencing and optimal allocation decisions for tower-type FAPSs. Notably, the primary contribution lies in approaching these issues from a customer-centric perspective. To the best of our knowledge, the only study addressing the demand-supply imbalance in FAPSs is conducted by Kuda et al. (2022).
3Candidate Dispatching Rules and Heuristics for FAPS’s operations
Fully Automated Parking Systems (FAPSs) are akin to warehouses equipped with Automated Storage and Retrieval Systems (AS/RS). Both systems feature automated carriers transporting items between entry-exit points and predetermined locations without operator intervention (Roodbergen and Vis, 2009). Despite these parallels, their operational environments diverge significantly. Warehouses encompass diverse material flows and activities, including receiving, storage, order picking, and shipping, alongside ancillary tasks like breakbulk consolidation, sorting, sequencing, batching, and routing (Bartholdi and Hackman, 2011; Manzini, 2012). In contrast, FAPSs involve a simpler process flow focused on allocation, parking, and retrieval, with limited managerial decision-making, resulting in lower system control and flexibility. This reduced flexibility is compounded by the nature of the entities handled in FAPSs.
Table 2
Comparison of fully automated warehouses and parking systems.
| Warehouses | FAPSs | |
| Entities (items) | Identical and bulk | Single and non-identical |
| Customer profile | Supply chain members | End-customers |
| Number of operations (relatively) | High | Low |
| Uncertainty | Low | High |
| Dynamicity | Medium | High |
Unlike the products/materials in the warehouses, the nature of each vehicle stored in the FAPSs is entirely different. It can be expressed that the most critical point where FAPSs and warehouses are inherently separated from each other is the control of entities and events in these systems. There is complete or partial control over how many products/materials will arrive and when the products will be picked up and shipped. However, there is no chance to decide how many vehicles will arrive in the system, how long each car will be parked, and when it will depart.
Table 3
Candidate dispatching and heuristic rules.
| Dispatching rules | Description | |
| Request sequencing rules | First Come First Served (FCFS) | No matter the type of request, the priority always belongs to the first-come. |
| *Parking Requests First (PRF) | No matter arriving time of requests, the priority always belongs to parking requests. If there is no parking request and more than one retrieval request, one of the retrieval rules is utilized. | |
| *Retrieval Requests First (RRF) | No matter arriving time of requests, the priority always belongs to retrieval requests. If there is more than one retrieval request simultaneously, one of the retrieval rules is utilized. | |
| Nearest Request First (NRF) | No matter type and arrival time of requests, the priority always belongs to the request nearest to the robot’s last position. | |
| Allocation rules | Random Available Slot (RAS) | The car that will be parked is allocated randomly to any available slot in the garage. |
| Nearest Available Slot | The car that will be parked is allocated to the nearest available slot in the garage. | |
| Farthest Available Slot (FAS) | The car that will be parked is allocated to the farthest available slot in the garage. | |
| Retrieval rules | First Come First Served (FCFS) | The priority belongs to the first arrived one amongst the other awaiting retrieval requests. |
| Nearest One First (NOF) | The priority belongs to the nearest one amongst the other awaiting retrieval requests. | |
| Farthest One First (FOF) | The priority belongs to the farthest one amongst the other awaiting retrieval requests. |
∗Additional rules are required for sequencing retrieval requests within themselves.
This paper manages this uncertainty in an ideal way and provides an adequate level of control through the different dispatching rules. In addition to being one of the most important sources of uncertainty, the customer structure/profile is also an essential factor that pressures FAPSs. FAPSs are in direct connection with the end customers. The customer’s request must be quickly and properly responded to as soon as it is realized. In the case of this dynamic and uncertain structure, it is not easy to perform operations effectively and efficiently. Table 2 summarizes the difference in characteristics of the warehouse and fully automated parking systems.
Consequently, numerous effective policies and strategies are proposed in the literature to address warehouse operations like storage and retrieval processes. However, even though FAPSs are like automated warehouse systems in terms of design, their unique operations and entity structure make it impossible to utilize some good-working operational policies and rules in warehouses. There is no chance of batching the items (vehicles) in FAPSs since each item should be handled separately. Here, it can be thought that parking operations are conducted as a single order having a single item. Thus, only some sequencing rules fitting parking lot operations like FIFO and NIF could be used as dispatching rules in these systems. Similarly, there are numerous ways to determine appropriate storage locations in warehouses, such as random storage, closest open location storage, dedicated storage, full turnover storage, and class-based storage. Still, the first two worked in FAPSs because they handled independent and unique items (vehicles).
Considering the system and process characteristics of FAPSs, the candidate dispatching rules described in Table 3 can be used for operational problems. These proposed rules are compiled for specific tower-type FAPSs with a single depth shelve, a single entry-exit bay, and a single transporter lift that can move vertically and horizontally in two dimensions. In the case of different system features (e.g. multiple entry-exit points and transporters, multi-depth selves), there will be a need for different dispatching rules to meet plan and control requirements. Depending on the process flow (see Fig. 1), the next request to be handled, whether parking or retrieval, must be decided. Due to the specific attribute (single entry-exit point) of the system considered in the study, it is impossible to rearrange the sequence of parking requests because they are already in a physical queue formed based on first-come, first-served (FCFS). Therefore, there is only one decision related to parking requests in this situation: the assignment of a parking slot for each car parked. On the other side, customers do not wait in a physical queue when they retrieve their vehicles. Thus, an additional sequencing rule (except for FCFS) can be set to determine the next retrieval in case of more than one retrieval request in the queue. Once the next retrieval request is selected, the car can be picked up from its parking slot and left at the exit bay.
4Research Methodology and Modelling Assumptions
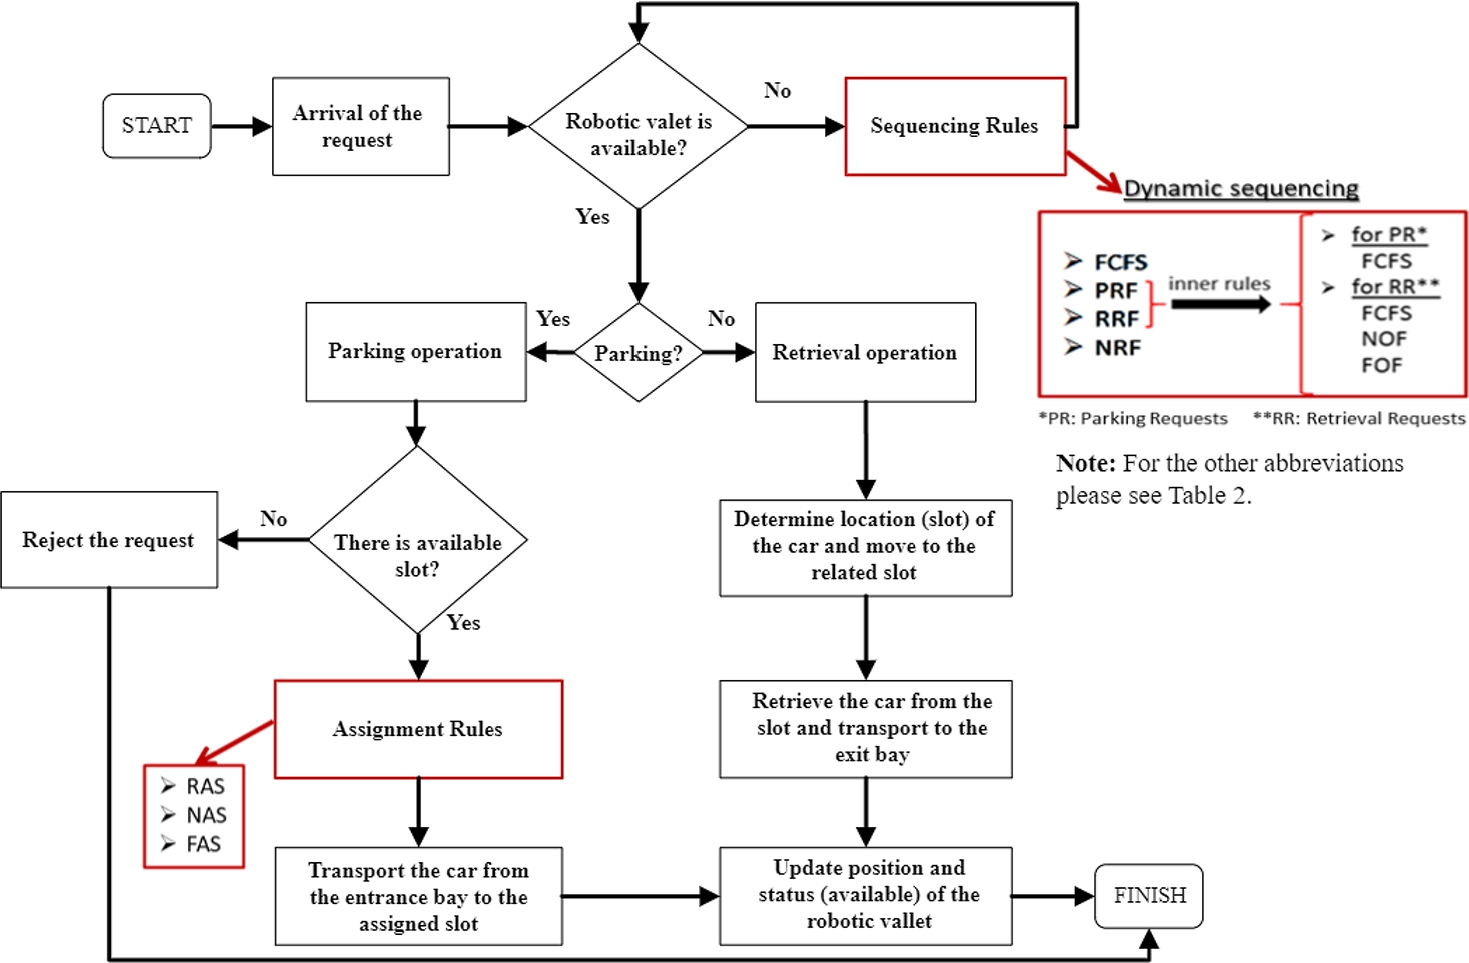
The system features, such as the shape of the building, the number of entry-exit points, etc., are the parameters related to the building structure. In contrast, utilized transport systems like puzzle type, tower type with single or multiple depth selves, etc., correspond to technical specifications. Another parameter should be considered when designing and operating the system. This parameter is the customer profile related to customer density and customer behaviours, such as the arrival/departure patterns, parking duration, etc. All these system parameters should be considered carefully when addressing operational decision problems. The proposed rules that help to sequence the requests and assign cars to an appropriate place are embedded in the main control algorithm, as shown in Fig. 2, to ensure the planning and control of FAPSs.
Fig. 2
Main control algorithm and embedded heuristics and rules.
It was mentioned that two performance metrics would be used to evaluate the success, namely the average waiting time of the customers (customer satisfaction) and the total distance covered in the system (efficiency of the system). In this context, “the total distance travelled in the system”, which has a deterministic structure and directly affects the customers’ waiting time, is considered “the objective function” when deciding on the optimal location. Let’s assume that
(1)
(2)
Equations (1) and (2) ensure to measure performance criteria related to the distance travelled and the time spent for each transaction. The total distance travelled in the system and the total transaction time can be calculated by Eqs. (3) and (4), respectively. Where
(3)
(4)
(5)
(6)
The performance criterion related to customer satisfaction is measured by the customer waiting time. However, previous studies mainly related considered customer waiting times to solely retrieval transactions (Debnath and Serpen, 2015; Serpen and Debnath, 2019). In this study, we consider and plan both parking and retrieval transactions at the same time. Based on previous studies, we used the following two equations to calculate customer waiting times through the parking (7) and retrieval (8) operations, respectively. Here,
(7)
(8)
In detail,
(9)
(10)
(11)
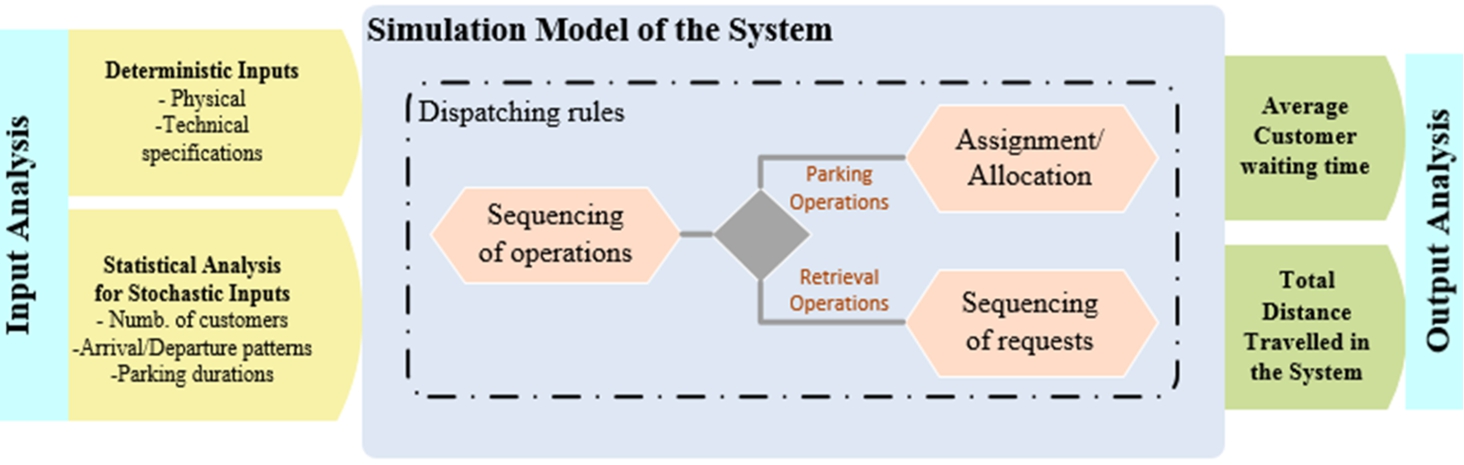
In the next step, a simulation model is constituted to test the developed algorithm’s validity and evaluate the performance of dispatching rules, as the simulation is probably the most convenient tool for analysing such dynamic and stochastic systems. The developed simulation model and its important components are presented in Fig. 3. Based on the problem structure, on the one hand, physical and technical features of the considered FAPS and customer profile details are inputs of the simulation model. However, the next operation that will be handled and the place where the car will be placed constitute decision variables of the system. Finally, the efficiency of the candidate dispatching rules will be evaluated depending on performance measurements (system’s output), like average customer waiting time and the average distance travelled in the system.
Fig. 3
The main components of the developed simulation model.
Considering the importance of the system parameters, it becomes more critical to consider their deterministic and stochastic natures when providing inputs to the simulation model. Therefore, the following section and subsections provide detailed information about the assumptions and other specifications of the FAPS considered in the experimental case study.
4.1System Parameters of the Experimental Study
It is possible to examine the parameters related to FAPSs in two categories as deterministic and stochastic system parameters. For the first group of parameters, the related values are (mostly) certain, and the acquisition of data is relatively easy. However, the second group of parameters is difficult to collect, and the collected raw data is not suitable for direct use. There is a need for additional analyses to produce proper data for the system. Hence, the parameters of the FAPS considered in the experimental study are examined in two subsections as follows.
4.1.1Deterministic System Parameters
The physical and technical features of the system are the members of the first group parameters. The size and layout of the slots and building, the speed of the transporters and other mechanical equipment, and the capacity of the system – the number of slots, are parameters that should be identified properly. These kinds of parameters have deterministic values, which are decided during the design and installation phase. The other design assumptions related to the system considered for the experimental study can be summarized as follows. The FAPS has:
✓ Rectangular design;
✓ Multi-story structure;
✓ Single entrance/ exit point;
✓ Single aisle;
✓ Single depth slot layout;
✓ Single transporter (robot) moving vertically on the z-axis and horizontally on the x-axis;
✓ Conveyors move horizontally on the y-axis.
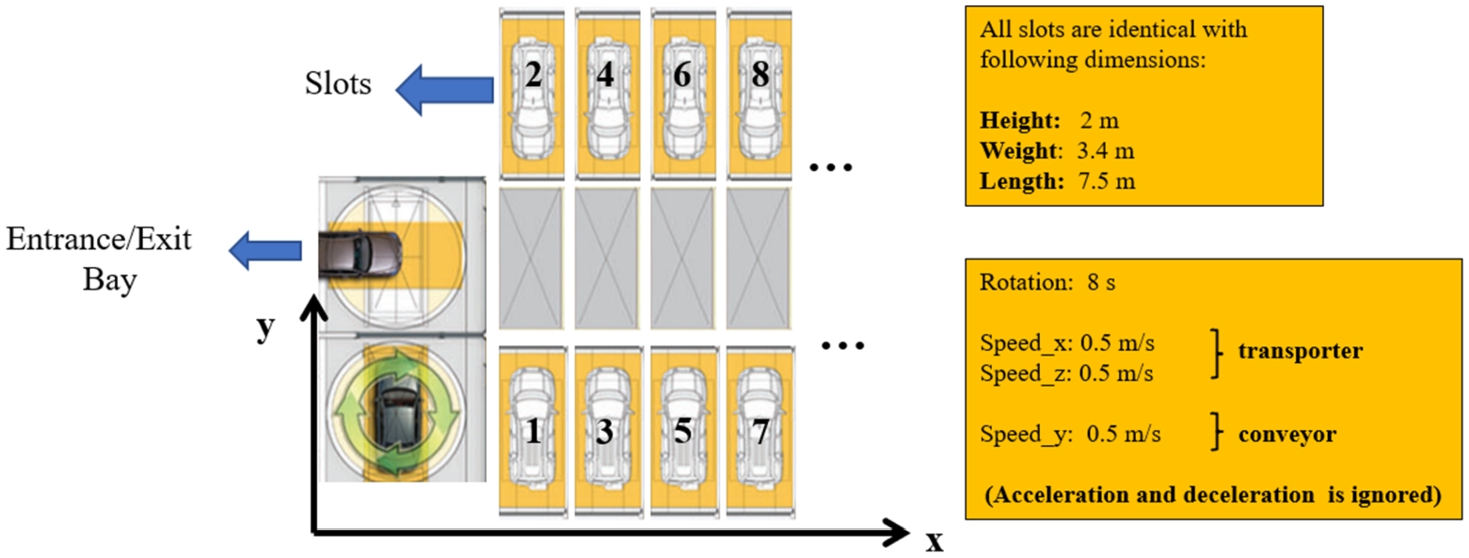
The following floor structure representation (Fig. 5) might help to comprehend the system’s dimensions. The horizontal moves carried out on each floor are considered on the
Fig. 4
Floor structure and slot layout of the considered FAPS.
4.1.2Stochastic System Parameters
In addition to the physical and technical data, data including required information about the customer also should be provided before investigating system performance. Therefore, a detailed customer analysis should be carried out when designing the system and setting technical parameters. An accurate analysis is a key factor that leads to the efficient design and operating system. The number of customers, arrival and departure times, parking durations of the customers take probabilistic values within a day. For example, in rush hours, when people commute to and from work, the parking and retrieval demand would be quite high, whereas other hours would be relatively balanced but never known exactly. Similarly, the parking durations differ from customer to customer and are generally not predictable. Therefore, to construct a reliable simulation model of the system and ultimately give credible results, actual data about the customer’s behaviours should be obtained and analysed. With this motivation, real data is provided from a FAPS located in Izmir/Alsancak. The provided data consists of customer records belonging to the first 3 months (January, February, and March) of 2017, and the following statistical information is extracted from these records.
1. The number of customers;
2. The arrival and departure patterns of these customers, and
3. How long they parked their cars (parking durations).
Primarily, these records are filtered and cleaned to ensure proper data sets, which enable us to carry out overall analyses and, consequently, statistical analyses. Input Analyser of Arena® Simulation Software is utilized to determine the relevant statistical distributions of the customer profile. The software applies different goodness-of-fit tests like Chi-Square and Kolmogorov-Smirnov to the given data file and determines the distribution that will best fit the data. All applicable distributions are fitted to the data, and then the distributions are sorted based on their corresponding square errors (Chung, 2003; Gingu and Zapcui, 2015; Rockwell Automation, 2022). In this way, the most suitable distribution functions for the case of Izmir are discovered. The detail of all analyses is clarified in the following subsections. The software (Arena input analyser) applies the goodness of fit tests for all possible distributions and suggests the best-fit distribution function of the data based on square error. The detail of best-fit functions for the case of Alsancak FAPS are introduced in Table 4.
Analysis of Customer Numbers. The system at issue was used by more than 30 000 customers, according to the data for three months. Daily customer arrivals (demand) in the examined data varied from 92 to 578. This great variability leads to investigating the cause of this situation and to finding out if variability depends on some variables.
Fig. 5
The number of customers based on days of the week.
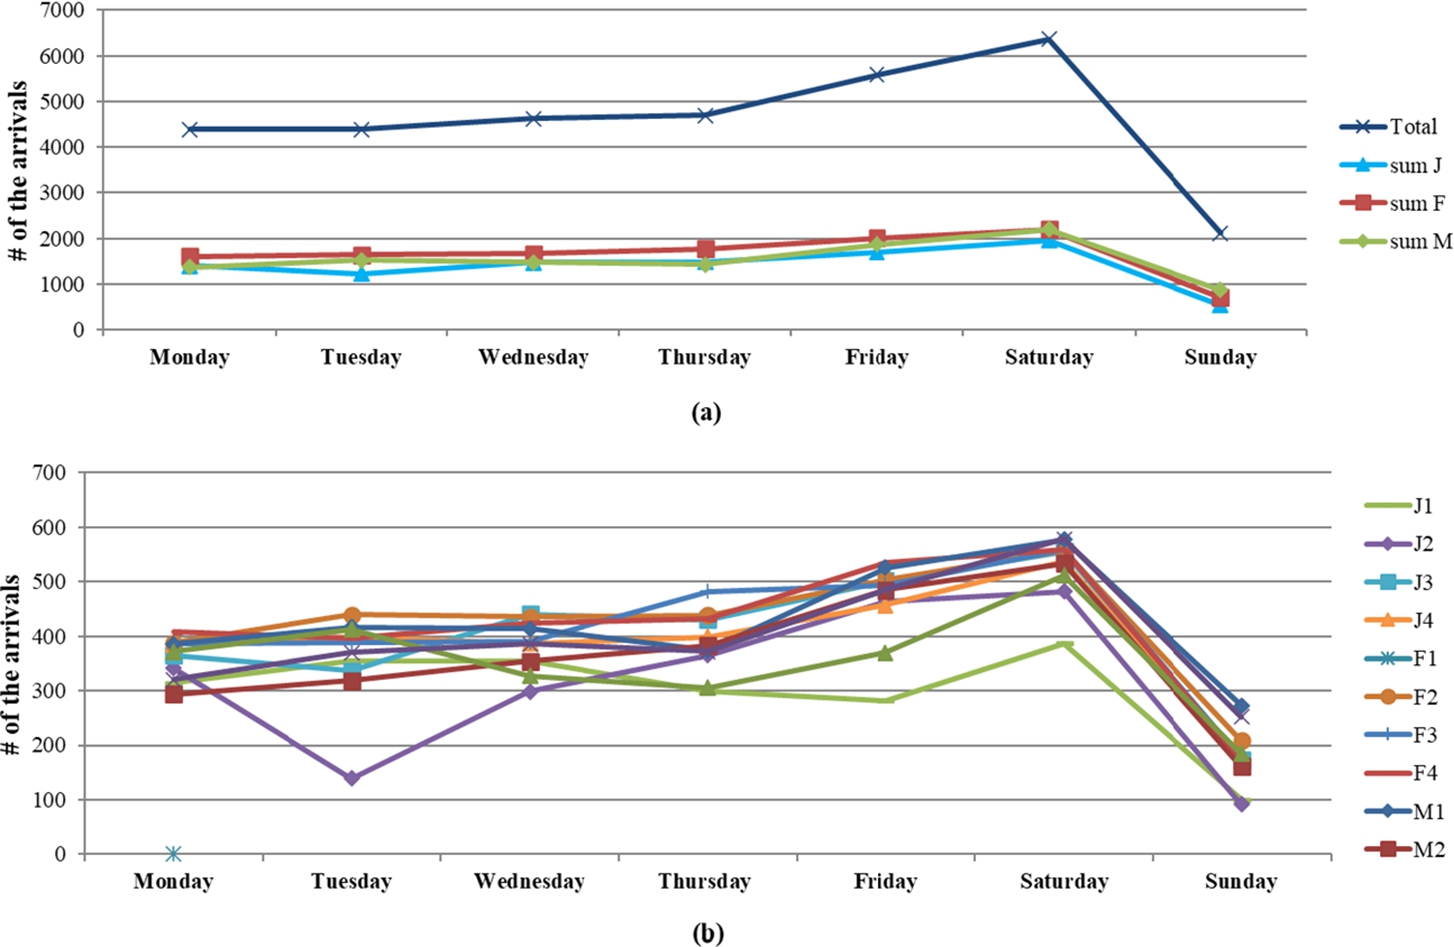
The first analysis carried out on charts (Fig. 5a) showed that there is no great difference between months in terms of the number of customers. However, the same data, when visualized depending on the day of the week, indicates that the number of customers differentiates according to the days of the week. A similar week pattern is observed within the three months (Fig. 5b), except for very limited cases. In the graphs J represents January, F: February, M: March and J1 represents 1st week of January, J2: 2st week of January, etc. It is explicitly seen that there is a pattern for the week, in which the number of customers is varied on different days.
The next step is statistically analysing the number of customers varied on days of the week to determine the probability distribution functions that belong to each day. With the help of the Input Analyser of Arena® software, it is possible and easy to determine the best distribution function that represents the data set belonging to each day. The distribution functions are produced by using 12 samples (12 weeks’ data) of each day to represent the variance of customer numbers depending on the days of the week. Based on the given data, the number of customer arrivals fits the triangular distribution (Monday, Thursday, Saturday) and the beta distribution (Tuesday, Wednesday, Friday) for six days of the week, and only Sunday fits the normal distribution. Parameters of all distribution functions are provided by the software. The statistical test (Kolmogorov–Smirnov goodness-of-fit) results indicate a good fit for all cases according to acceptable SSE values. SSE is defined as the sum of
Analysis of Arrival and Departure Patterns of Customers.
Fig. 6
Arrival and departure pattern of the customers based on days of the week.
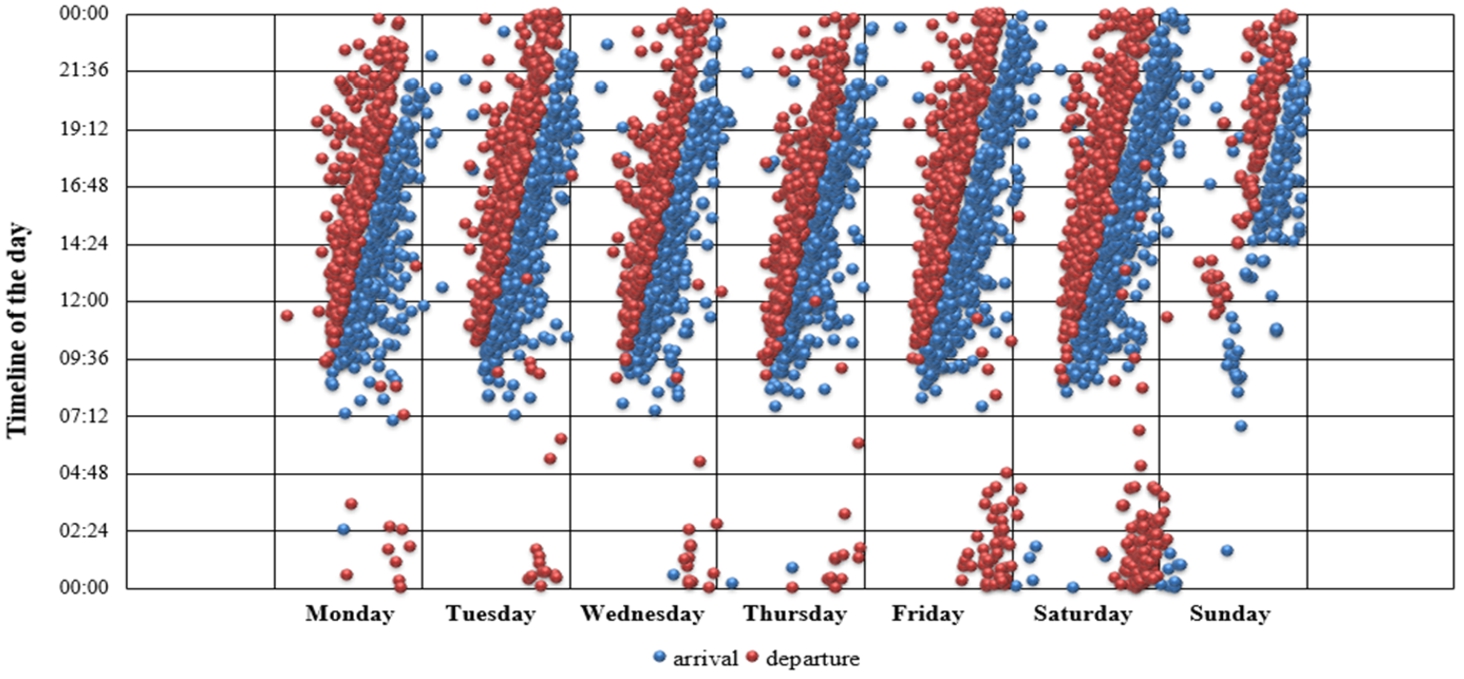
Customer arrivals and departures are not balanced in a day due to rush hours. Based on the commute to work, mostly, the number of parking requests is higher than retrieval requests in the early morning and vice versa towards evening. This situation is valid for the downtown areas where the car parking problem is an important issue. Of course, there are exceptions to these behaviours due to residents settled near the FAPS and who park their cars after work. Considering all these situations, the density of requests within a day should be analysed carefully. In this respect, based on the data provided from the Alsancak FAPS, customer arrival and departure times belonging to one week are visualized in Fig. 6. In addition to the pattern that depends on work hours, a different parking and retrieval pattern arises on Friday and Saturday nights because customers’ behaviour is changed at the weekend. Parking requests are increased after 19:00, and some of the retrieval’s requests sag to after midnight between 00:00–04:00. Sunday has a quite different pattern from the arrival and departure patterns observed on other days. Less number of customers and more balanced but more irregular arrival/departures are observed throughout the day. In addition to the pattern that depends on work hours, a different parking and retrieval pattern arises on Friday and Saturday nights because customers’ behaviours are changed on weekends. Parking requests increase after 19:00, and some of the retrieval’s requests sag after midnight between 00:00–04:00. On the other hand, Sunday has a quite different pattern from the arrival and departure patterns observed on other days. Less number of customers are observed with more irregular arrival and departures.
To uncover underlying patterns and trends, we analysed the relevant dataset using Arena® Input Analyzer. It’s important to note that, unlike traditional queuing theory, we do not consider inter-arrival times for FAPSs. This is because FAPS environments do not exhibit homogeneous customer distributions throughout the day, leading to varying arrival patterns. Instead, our approach focuses on analysing empirical arriving and departure data to model customer behaviour. This allows us to develop dispatching rules that better reflect real-world scenarios and enhance system efficiency (Büchel and Corman, 2020; Guo et al., 2016; Ingvardson and Nielsen, 2018). Therefore, for enhanced practicality, this study considers the time of day rather than inter-arrival times of customers, analysing the number of requests arriving at these specific moments. Table 4 demonstrates that all distribution functions exhibit a good fit based on SSE values. As previously outlined, the parameters and predicted variables of these distribution functions pertain to continuous time intervals spanning from 00:00 to 24:00. It is noteworthy that while the same distributions exhibit different parameters, there exists a diverse range of arrival distribution patterns such as Gamma, Beta, and Triangular. This underscores the necessity of incorporating customer attributes into the simulation model based on different days of the week.
Table 4
The best-fit distribution function for customer’s behaviours.
| Distributions’ parameters | Distribution function | 6SSE | ||
| Distribution functions of customer numbers that are used in the experimental study | Monday | 1Triangular | 0.056548 | |
| Tuesday | 2Beta | 0.057014 | ||
| Wednesday | 2Beta | 0.044574 | ||
| Thursday | Triangular | 0.016156 | ||
| Friday | 2Beta | 0.044131 | ||
| Saturday | 1Triangular | 0.083642 | ||
| Sunday | 3Normal | 0.045688 | ||
| Distribution functions of arrival patterns of the days | Monday | 4Gamma | 0.003987 | |
| Tuesday | 2Beta | 0.004665 | ||
| Wednesday | 3Gamma | 0.004272 | ||
| Thursday | 2Beta | 0.006749 | ||
| Friday | 1Triangular | 0.004850 | ||
| Saturday | 4Gamma | 0.008231 | ||
| Sunday | 1Triangular | 0.030448 | ||
| Distribution functions of departure patterns of the days | Monday | 2Beta | 0.005597 | |
| Tuesday | 3Normal | 0.003739 | ||
| Wednesday | 3Normal | 0.015429 | ||
| Thursday | 3Normal | 0.006464 | ||
| Friday | 3Normal | 0.011663 | ||
| Saturday | 2Beta | 0.015944 | ||
| Sunday | 1Triangular | 0.030448 | ||
| Distribution functions of parking durations of customers depending on days of the week | Monday | 5Lognormal | 0.004684 | |
| Tuesday | 5Lognormal | 0.001334 | ||
| Wednesday | 4Gamma | 0.013259 | ||
| Thursday | 5Lognormal | 0.000498 | ||
| Friday | 5Lognormal | 0.003551 | ||
| Saturday | 4Gamma | 0.011073 | ||
| Sunday | 5Lognormal | 0.004846 |
1Triangular distribution: lower limit a, upper limit b and mode c, where
2Beta distribution:
3Normal distribution: μ = mean, σ = standard deviation.
4Gamma distribution:
5Lognormal:
6SSE: Sum of Square Error =
Analysis of Parking Durations. Parking duration is a critical factor influencing both customer departure patterns and the efficiency of allocation decisions within the system. Figure 7 depicts customer behaviours concerning parking durations, revealing that the majority of customers park their cars for less than 10 hours, with many not exceeding 5 hours. While some cases extend beyond 20 hours, they are less frequent. Furthermore, distinct duration patterns emerge for different days of the week. Statistical analysis of these patterns enables the derivation of probability distribution functions and their respective parameter values, as presented in Table 4.
Fig. 7
Parking duration of the customers based on days of the week.
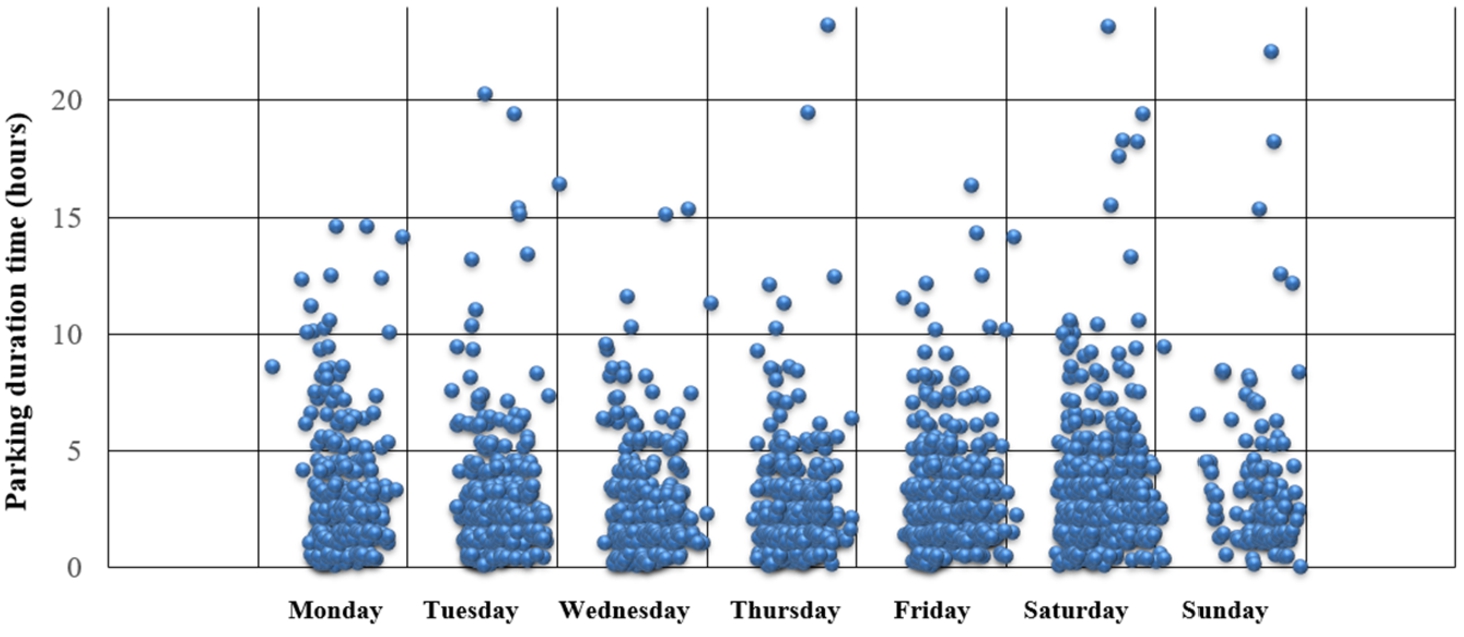
There are two distribution functions which are Lognormal and Gamma, that can represent parking duration patterns for all days of the week with quite low SSE’s values. The mean of the samples (μ) and standard deviation (σ) are the parameters of Lognormal, whereas shape (k) and scale parameters (θ), where
4.2Verification and Validation of the Simulation Model
So far, all analyses have been carried out to provide the required inputs for the simulation model that will be employed to compare the performance of different dispatching rules. The simulation model is built on physical-technical details and actual customer data. However, at this point, there is an important decision about the simulation modelling approach. There is no doubt that discrete event simulation is suitable for FAPSs as variables change at discrete times and by discrete steps. There are two simulation modelling approaches which are terminating or non-terminating simulation modelling. Terminating systems have initial starting conditions, a natural terminating event. However, non-terminating systems generally can either have a terminating event but keep entities in the system between periods and not have a terminating event and run continuously (Chung, 2003). Considering customer behaviours and discovered data patterns, it could be concluded that FAPSs should be modelled as a terminating system. However, we know that FAPSs are commonly open
• The non-terminating simulation model of the system is developed.
• The capacity of the considered system and the density of the customers are balanced. That means that customer arrivals generally do not exceed the capacity at any time.
• The customers waiting for parking in the queue do not leave the system or are not rejected unless the capacity is full.
• The stochastic parameters of the model, which are related to customers, are varied depending on the days of the week.
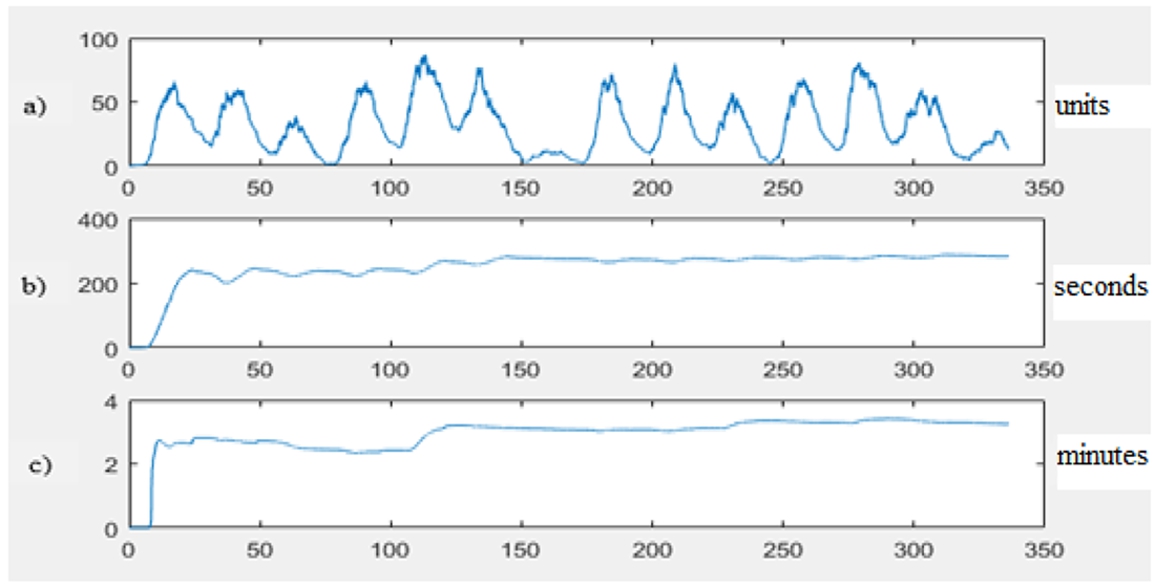
The simulation model is developed in MATLAB environments based on these facts and assumptions. Although the actual simulation study will be conducted for 6 months, the model is run for two weeks (14 days) here to check the pattern of system parameters and verify the simulation model. The state variables that denote the number of cars in the system (a), the average time spent per operation (b), and the average customer waiting time per operation is depicted hourly through the simulation run length in Fig. 8. In addition to the number of cars in the system, Fig. 8(a) also indicates arrival and departure patterns. The relevant graph also shows that the model’s customer behaviours are reflected successfully with the help of the distribution functions. Besides, the same Fig. 8 proves that the system never turns to the starting condition at any time, which means the FAPS is a non-terminating system. Fig. 8(b)–(c) reveal that the system reaches a steady state after 100 h (4 days) after the zero initial states. This period is entitled a warm-up period, and the effect of this period should be eliminated from the overall system (Özgün and Barlas, 2009). Thus, the simulation run length should be determined appropriately to ensure accurate results free of starting conditions. Previous research suggests at least a ten-times warp-up period for non-terminating simulation models (Chung, 2003).
Fig. 8
An overview of the system at the end of the 14 days simulation run. a) the number of cars in the system, b) the average time spent per operation, c) the average customer waiting time per operation.
A long simulation run enhances the quality of the results. Hence, the simulation run length is determined as six months (180 days) as approved by the system manager. To improve the quality and reliability of the outcomes, 10 replications, each of six months’ length comprising the January-June period, are performed based on the customer data provided. The performance of the dispatching rules proposed operations is evaluated based on the average of these 10 replications introduced in Table 5.
Table 5
All possible combinations of the proposed dispatching rules and their performance results.
5Results and Discussions of the Simulation Study
When dealing with a multi-objective problem, it entails considering a diverse set of solutions rather than favouring just a single solution. No single solution within this set can be deemed universally better than another, as each solution may outperform the others in certain aspects or objectives while lagging in others. This collection of solutions is referred to as non-dominated solutions. When these solutions are graphically depicted in the objective-functions space, they collectively form what is commonly known as the Pareto front (Carneiro de Albuquerque et al., 2012).
Table 6
Performance values of two objectives used for Pareto chart analysis.
| Simulation of the 6-month period | Average wait per operation | Trans dist. (m) per operation | |||
| RAS | 1 | FCFS | x | 2.75 | 91.82 |
| 2 | NRF | x | 3.15 | 93.30 | |
| 3 | PRF | FCFS | 3.71 | 92.22 | |
| 4 | NOF | 3.07 | 92.36 | ||
| 5 | FOF | 3.44 | 92.15 | ||
| 6 | RRF | FCFS | 3.31 | 93.35 | |
| 7 | NOF | 3.32 | 93.51 | ||
| 8 | FOF | 3.19 | 93.19 | ||
| NAS | 9 | FCFS | x | 1.70 | 70.48 |
| 10 | NRF | x | 1.80 | 71.41 | |
| 11 | PRF | FCFS | 2.39 | 70.96 | |
| 12 | NOF | 2.20 | 71.02 | ||
| 13 | FOF | 2.82 | 71.41 | ||
| 14 | RRF | FCFS | 1.82 | 71.58 | |
| 15 | NOF | 1.81 | 71.43 | ||
| 16 | FOF | 1.77 | 71.28 | ||
| FAS | 17 | FCFS | x | 4.44 | 111.53 |
| 18 | NRF | x | 6.15 | 113.62 | |
| 19 | PRF | FCFS | 5.21 | 111.49 | |
| 20 | NOF | 4.61 | 111.52 | ||
| 21 | FOF | 5.58 | 111.38 | ||
| 22 | RRF | FCFS | 6.08 | 113.73 | |
| 23 | NOF | 6.28 | 114.10 | ||
| 24 | FOF | 6.27 | 113.83 | ||
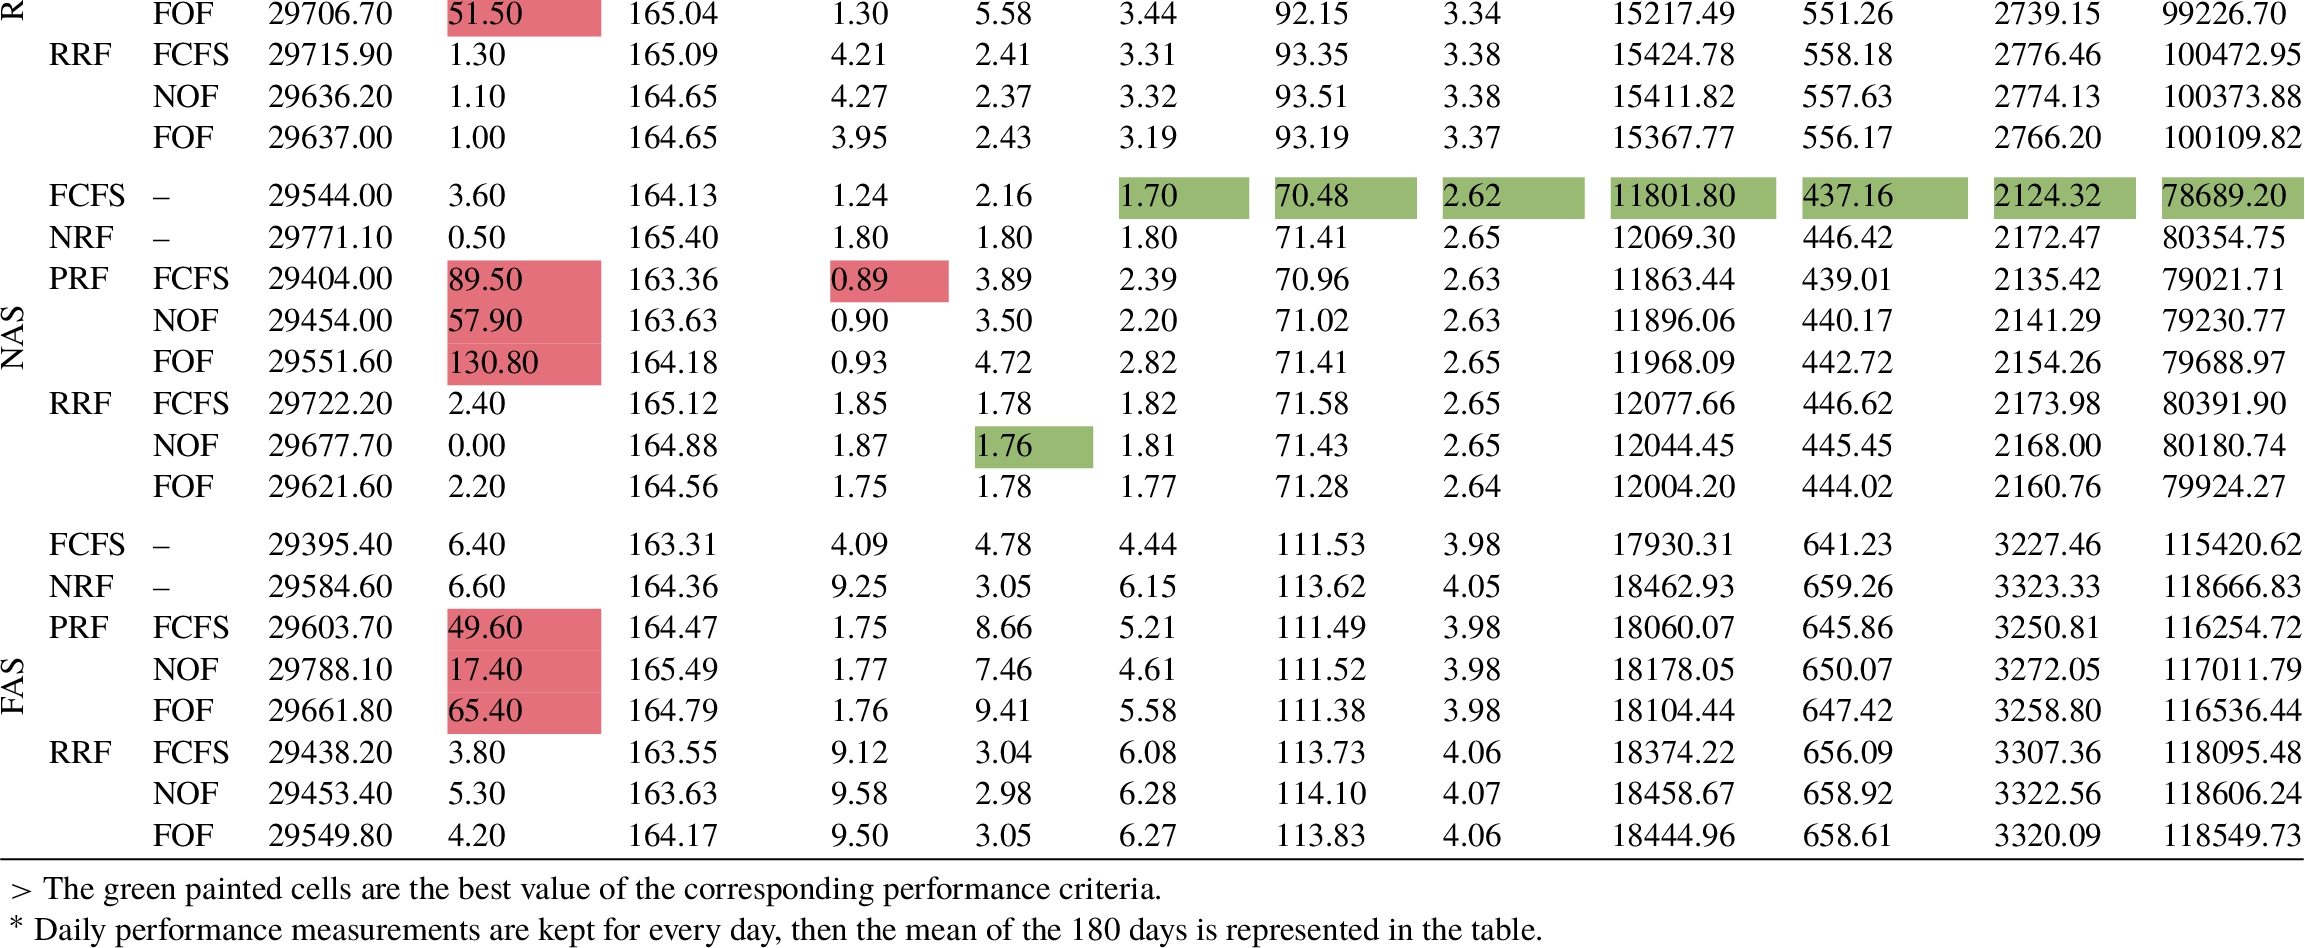
In our case, for all performance criteria related to customers’ waiting time and system utilization, the rules with the minimum values are preferable to others. According to the Table 5, the inner rules that support PRF and RRF rules do not significantly impact the performance. On the other hand, the average results demonstrate that the combination of the allocation rule and FCFS sequencing rule outperforms all other combinations. The average waiting time and distance travelled per operation are selected as performance criteria (objective functions) and represent the performance of the 24 rules combination summarized in Table 6. The Pareto graph of these two objective functions is depicted in Fig. 9.
Fig. 9
The Pareto chart based on two objectives for 24 rule combination.
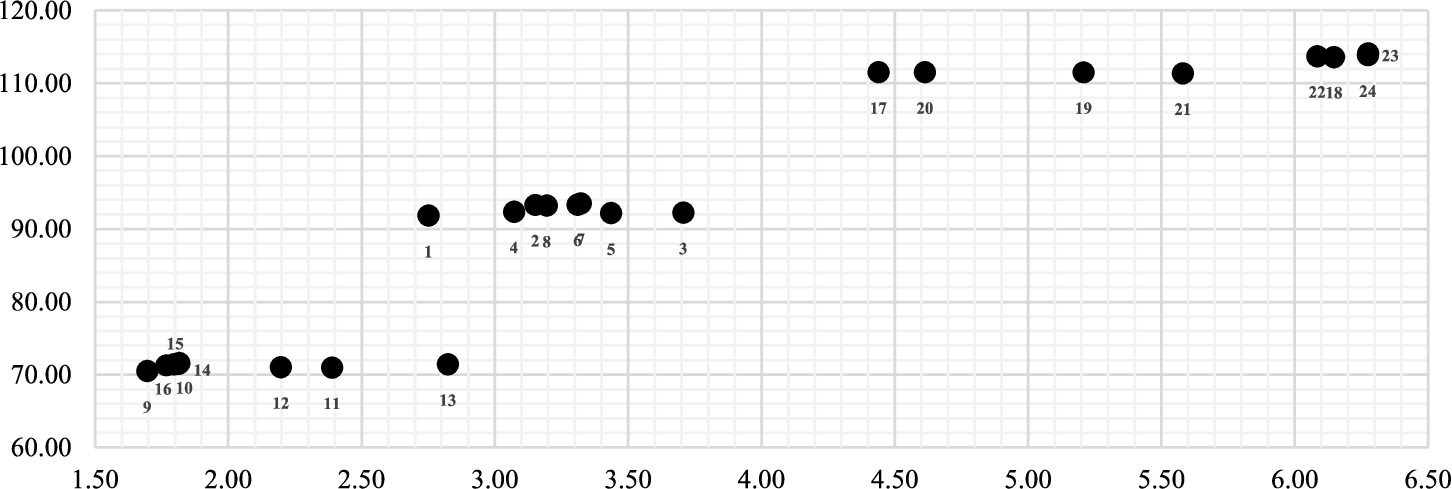
Figure 9 shows how the performance of RAS, NAS, and FAS, which are allocation strategy (rule), stacks up. According to the figure, the combination of NAS Pareto-optimal strategy and FCFS used with NAS appears as a Pareto-optimal combination. The difference between these three allocation strategies can be neglected since the difference can be derived from the stochastic nature of the system parameters. Thus, it should be investigated whether the difference between the three allocation rules seen in Fig. 9 is statistically significant. For this purpose, the two main performance metrics, average waiting time per operation and average transfer distance per operation, are analysed.
Fig. 10
The results of Friedman’s Two-Way Analysis for allocation rules.
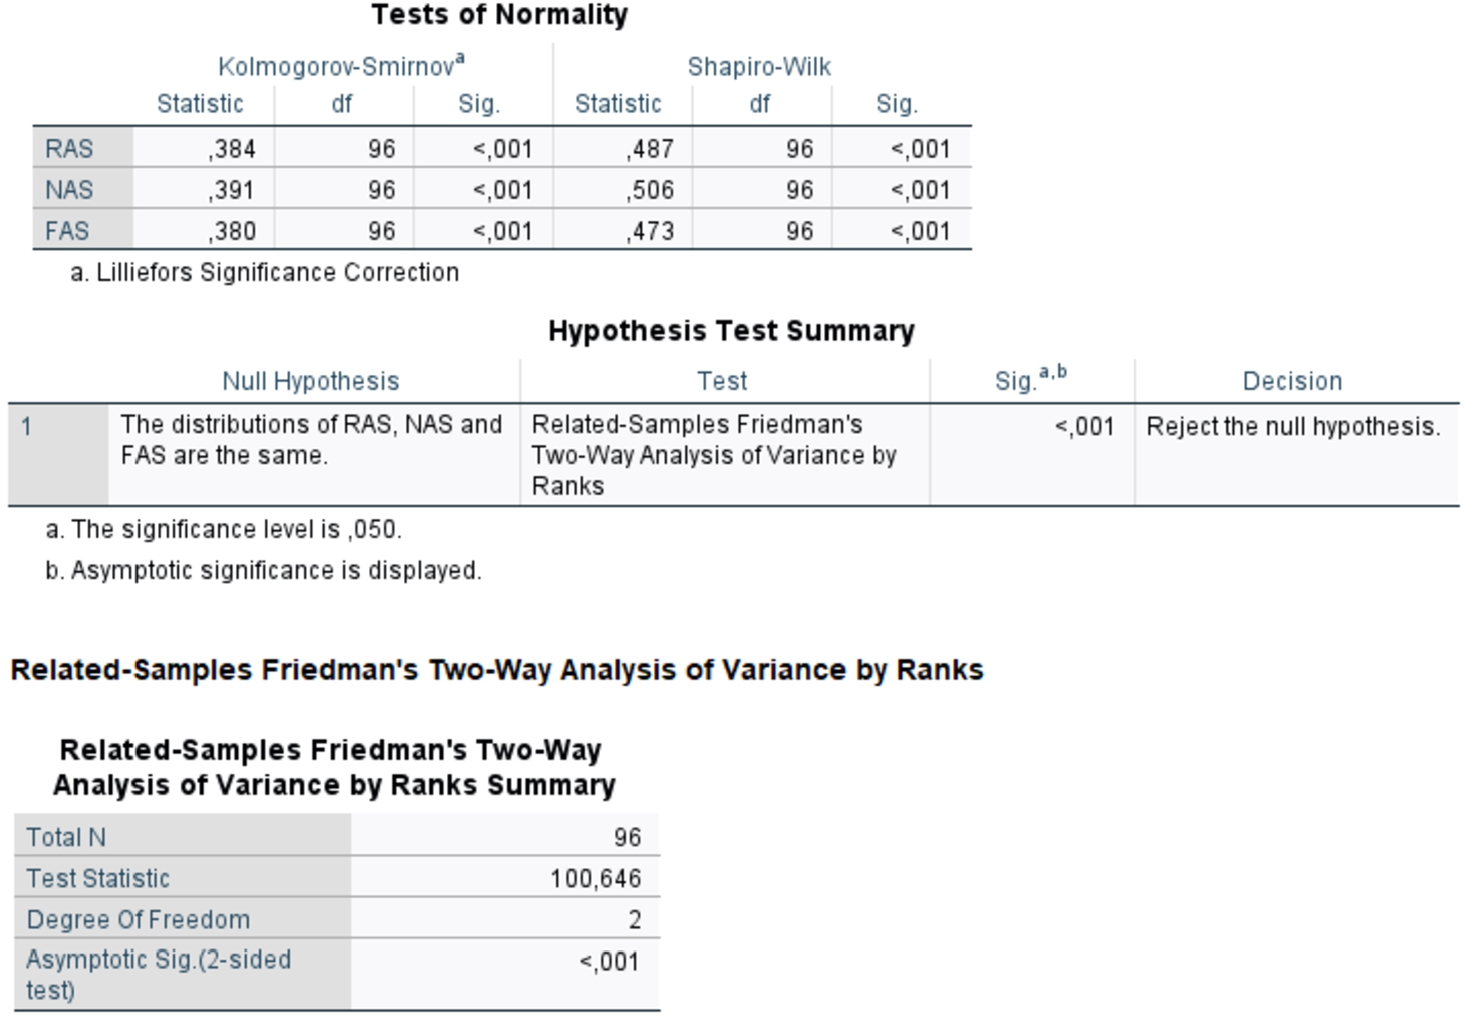
The sample size for all examples is 96 (see Table 5), so the Shapiro-Wilk test should be used. For all variables, the significance level
5.1Comparison of Allocation and Sequencing Rules’ Performances
The best results were obtained by applying NAS and FCFS dispatching rules for allocation and sequencing decisions. Therefore, additional analysis is conducted in this section to determine whether one of these rules is responsible for good performance results. First, the results are analysed according to allocation dispatching rules. In this regard, the results are compiled under the allocation rules of RAS, NAS, and FAS to eliminate the impact of all sequencing decision rules.
Table 7
The overall performance of allocation rules.
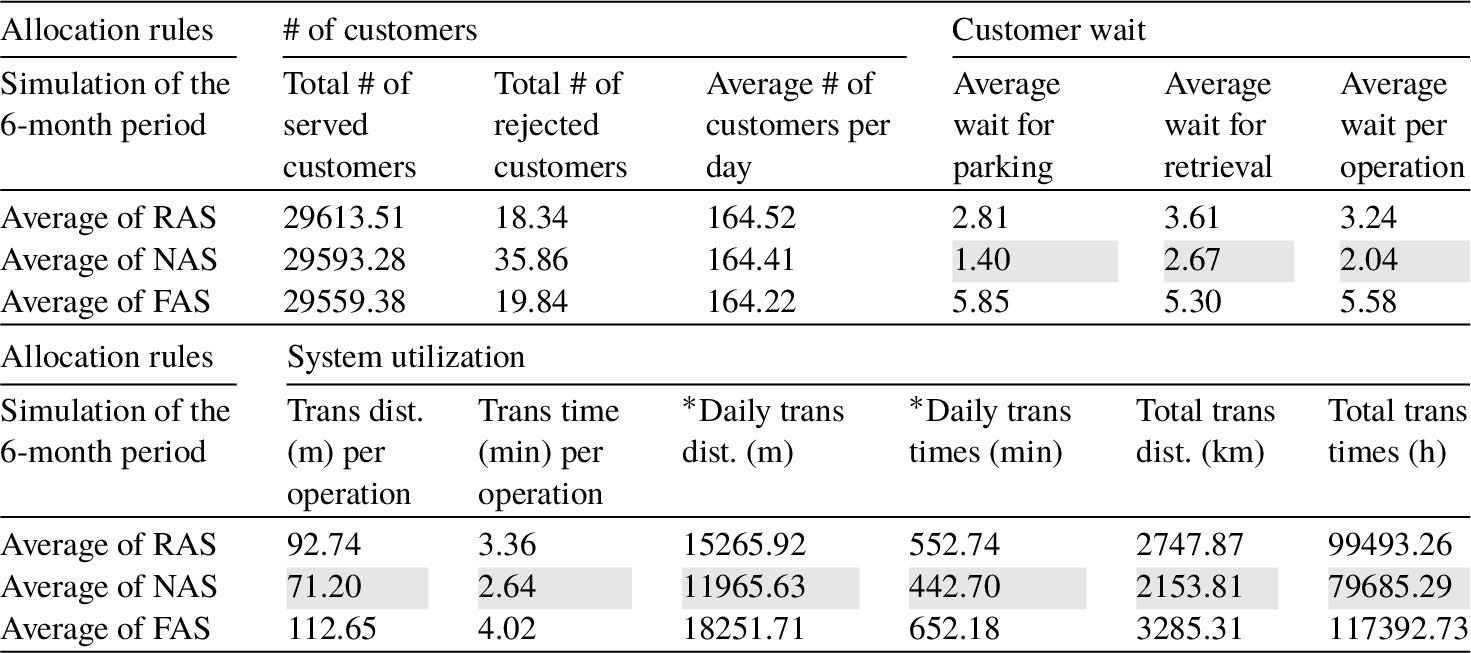
The values for each allocation rule are calculated by averaging across all 8 sequencing rule combinations. Table 7 presents the computed average values, indicating the overall performance of each allocation strategy. Results demonstrate that the FAS strategy is the least efficient, while the NAS strategy stands out as the most effective. Additionally, the superiority of strategies is evident, with NAS>RAS>FAS, as each outperforms the others across all performance criteria. In contrast, when a similar process is carried out for sequencing rules, and the average performance values are computed as in Table 8, it is seen that no sharp line exists among sequencing strategies. The compiled results again clearly reveal that the PRF sequencing rule increases the number of rejected customers compared with other sequencing rules.
Table 8
The overall performance of sequencing rules.
| Sequencing rules | # of customers | Customer wait | ||||
| Simulation of the 6-month period | Total # of served customers | Total # of rejected customers | Average # of customers per day | Average wait for parking | Average wait for retrieval | Average wait per operation |
| Average of FCFS | 29514.43 | 4.73 | 163.97 | 2.53 | 3.39 | 2.96 |
| Average of NRF | 29601.17 | 3.27 | 164.45 | 4.97 | 2.42 | 3.70 |
| Average of PRF | 29592.28 | 60.78 | 164.40 | 1.32 | 5.96 | 3.67 |
| Average of RRF | 29605.78 | 2.37 | 164.48 | 5.12 | 2.40 | 3.76 |
| Sequencing rules | System utilization | |||||
| Simulation of the 6-month period | Trans dist. (m) per operation | Trans time (min) per operation | ∗Daily trans dist. (m) | ∗Daily trans times (min) | Total trans dist. (km) | Total trans times (h) |
| Average of FCFS | 91.27 | 3.31 | 14939.28 | 541.70 | 2689.07 | 97506.18 |
| Average of NRF | 92.78 | 3.36 | 15268.48 | 552.80 | 2748.33 | 99504.54 |
| Average of PRF | 91.61 | 3.32 | 15070.46 | 546.19 | 2712.68 | 98314.79 |
| Average of RRF | 92.89 | 3.36 | 15289.84 | 553.52 | 2752.17 | 99633.89 |
As another issue, unlike the allocation rules, it is impossible to mention the exact superiority of sequencing rules. However, if the performance criteria are examined under two separate groups, it may be possible to refer to an exact order for system utilization criteria as FCFS > PRF > NRF > RRF. But the same situation is not valid for customer waiting times, and the best performance values belong to different sequencing rules. Besides, there are no significant differences between the performances of sequencing strategies, even between the best and worst performance values related to each criterion.
Table 9
Impact ofallocation and sequencing rules/strategies on performance improvement.
| Variation of allocation rules | Variation of sequencing rules | |||
| Min imp. (%) | Max imp. (%) | Min imp. (%) | Max imp. (%) | |
| Customer wait | 37 | 63 | 1 | 21 |
| System utilization | 15 | 36 | 0 | 2 |
To figure out the limited impact of the sequencing strategies on the performance of the system, the improvement variation provided by implementing sequencing rules could be compared with the allocation rules. In the situation presented in Table 9, the best possible improvement achievable by changing the sequencing strategy is around 21%, while implementing the best allocation strategy can yield up to 63%. Although it has been discussed literally in the problem statement section, this result numerically proves the importance and great impact of the allocation decisions for FAPSs. That means if the assignment/allocation problem of FAPSs is studied more intensively, a significant improvement can be created in the operational efficiency of FAPSs. In this respect, future research directions can be shaped based on this fact.
5.2Analysis of Dispatching Rules Under Different Conditions
This section investigates the performance of the dispatching rules utilized for allocation and sequence decisions under different conditions such as arrival rates, parking duration, and arrival patterns. The values of parameters, except for the investigated one, are kept constant to ensure reliable results. The analysis of different customer arrival rates demonstrates that the NAS allocation rule performs better as the customer arrival rate increases. As customer parking durations increase, the differences in performance between allocation rules decrease, but NAS remains the best-performing rule. The arrival pattern of customers throughout the day also significantly impacts system performance, highlighting the importance of well-tailored allocation strategies to improve customer satisfaction. Details of the experiments are presented in each relevant case.
5.2.1Performance Analysis Based on Mean Arrivals
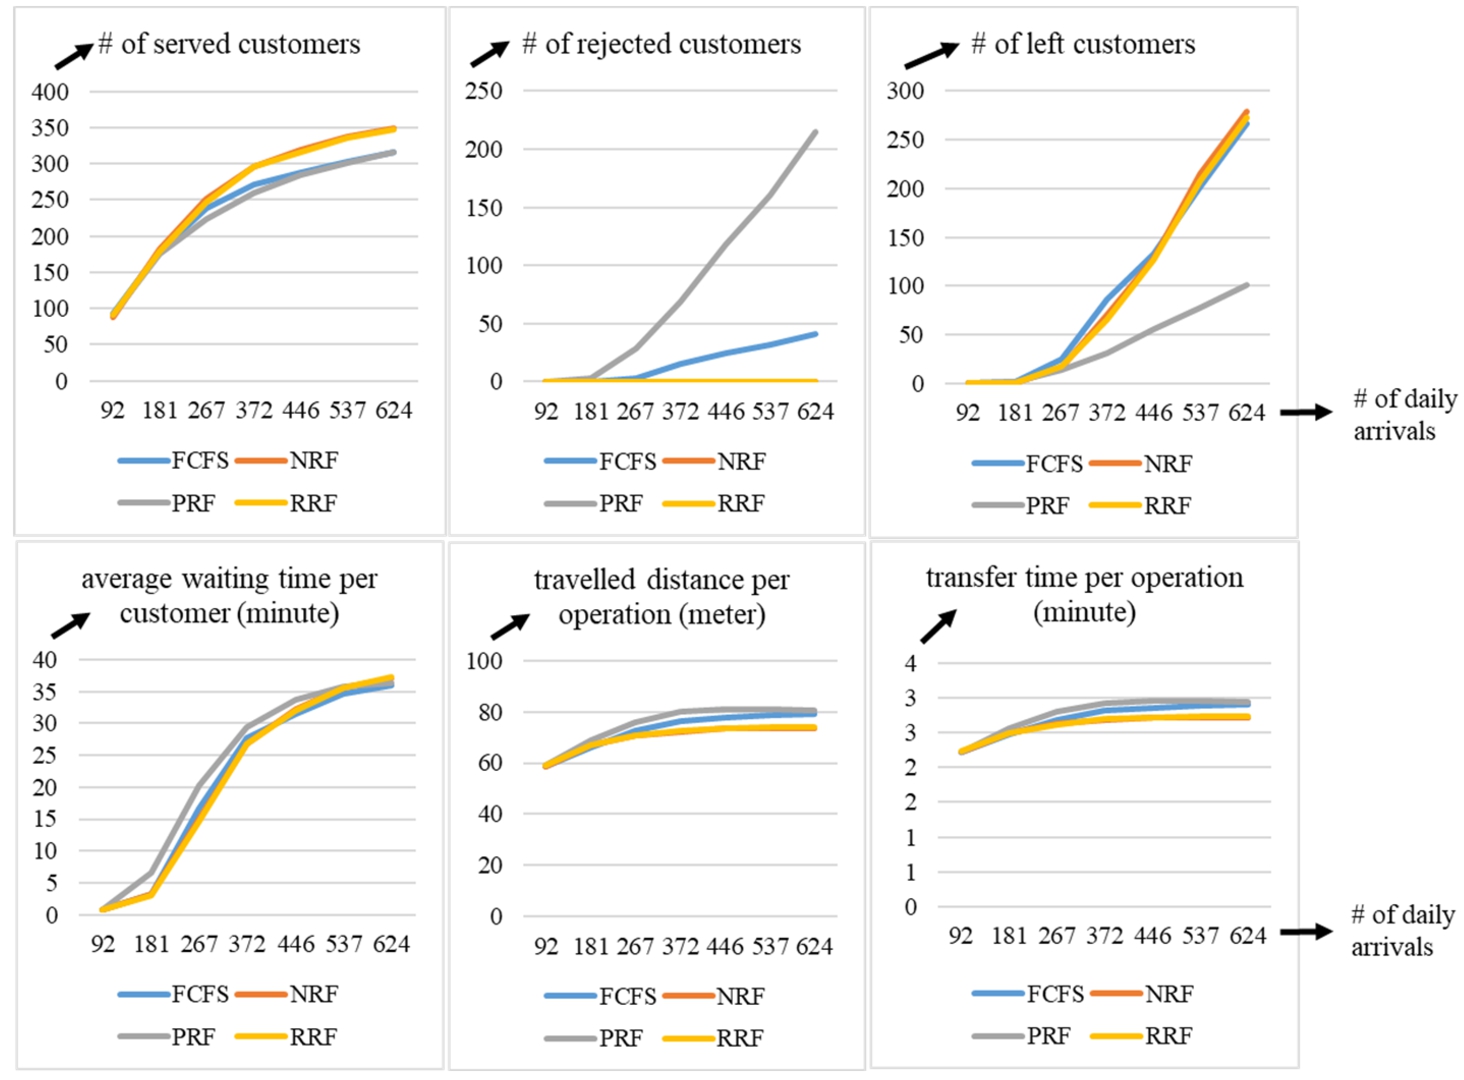
When examining the performance of the allocation and dispatching rules, thoroughly the same distribution functions related to the arrival pattern and parking durations are used in the simulation study. However, the average number of customers who arrive each day is altered systematically to analyse the impact of customer arrival on the performance of rules. The performance of allocation and sequencing rules depending on daily customer arrivals varied from 90 to 640 are illustrated in Fig. 11 and Fig. 12.
The relative performance of allocation rules RAS, NAS, and FAS in terms of capacity utilization (e.g. the total number of customers served, rejected, and left the system due to long queues) and system efficiency is seen in Fig. 11. The results show that NAS outperforms the other as the customer arrival rate increases. On the other side, there is no distinct superiority between dispatching rules (Fig. 12), but the aggregate performance of FCFS is better than the other.
Fig. 11
Performance of Allocation Rules in terms of capacity utilization and system efficiency.
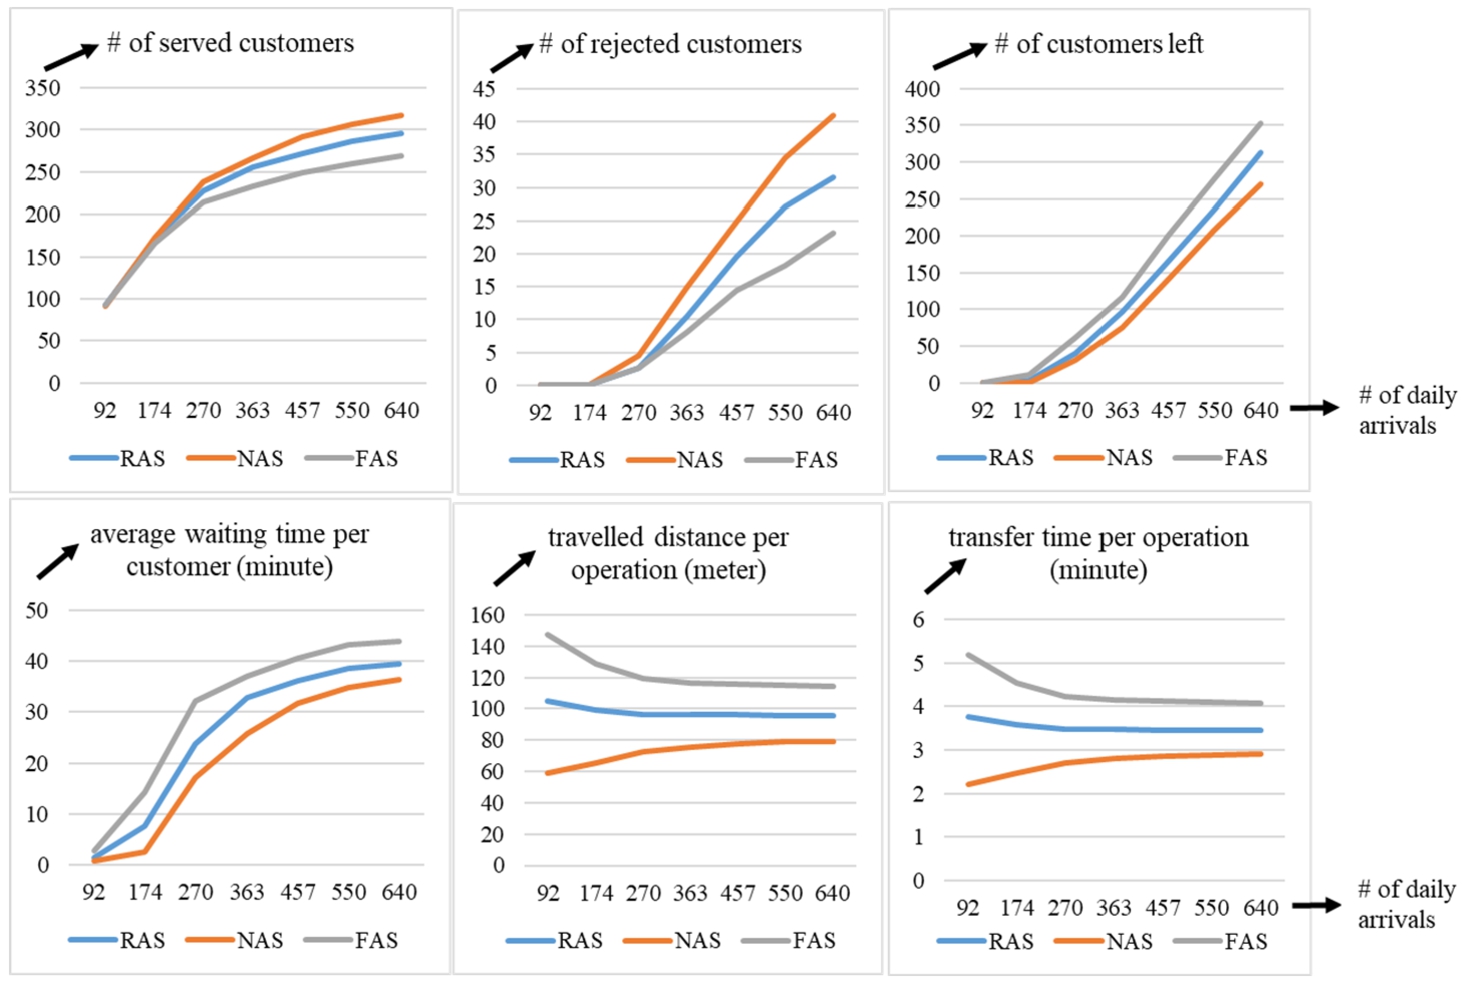
Fig. 12
Performance of Sequencing Rules in terms of capacity utilization and system efficiency.
5.2.2Performance Analysis Based on Mean Duration
In the evaluation of allocation and dispatching rules, consistent distribution functions are employed for arrival patterns and rates in the simulation study. The average parking duration per customer is systematically adjusted to assess the influence of parking durations on rule performance. Figures 13 and 14 depict the performance of allocation and sequencing rules across duration patterns, ranging from 0.7 to 12.6 hours on average per customer.
Fig. 13
Performance of Allocation Rules in terms of capacity utilization and system efficiency.
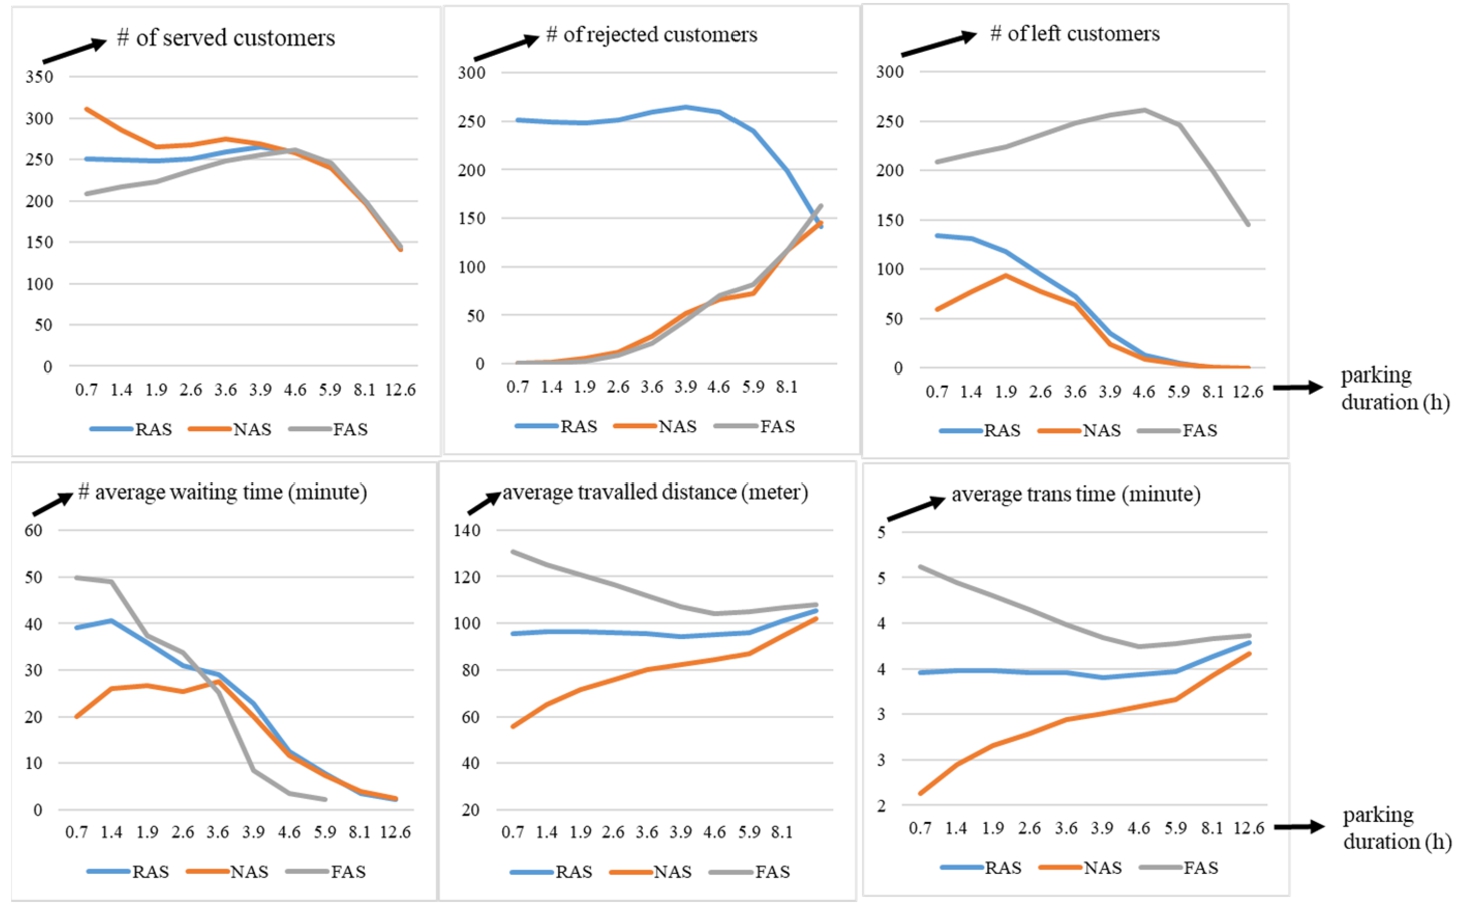
Fig. 14
Performance of Sequencing Rules in terms of capacity utilization and system efficiency.
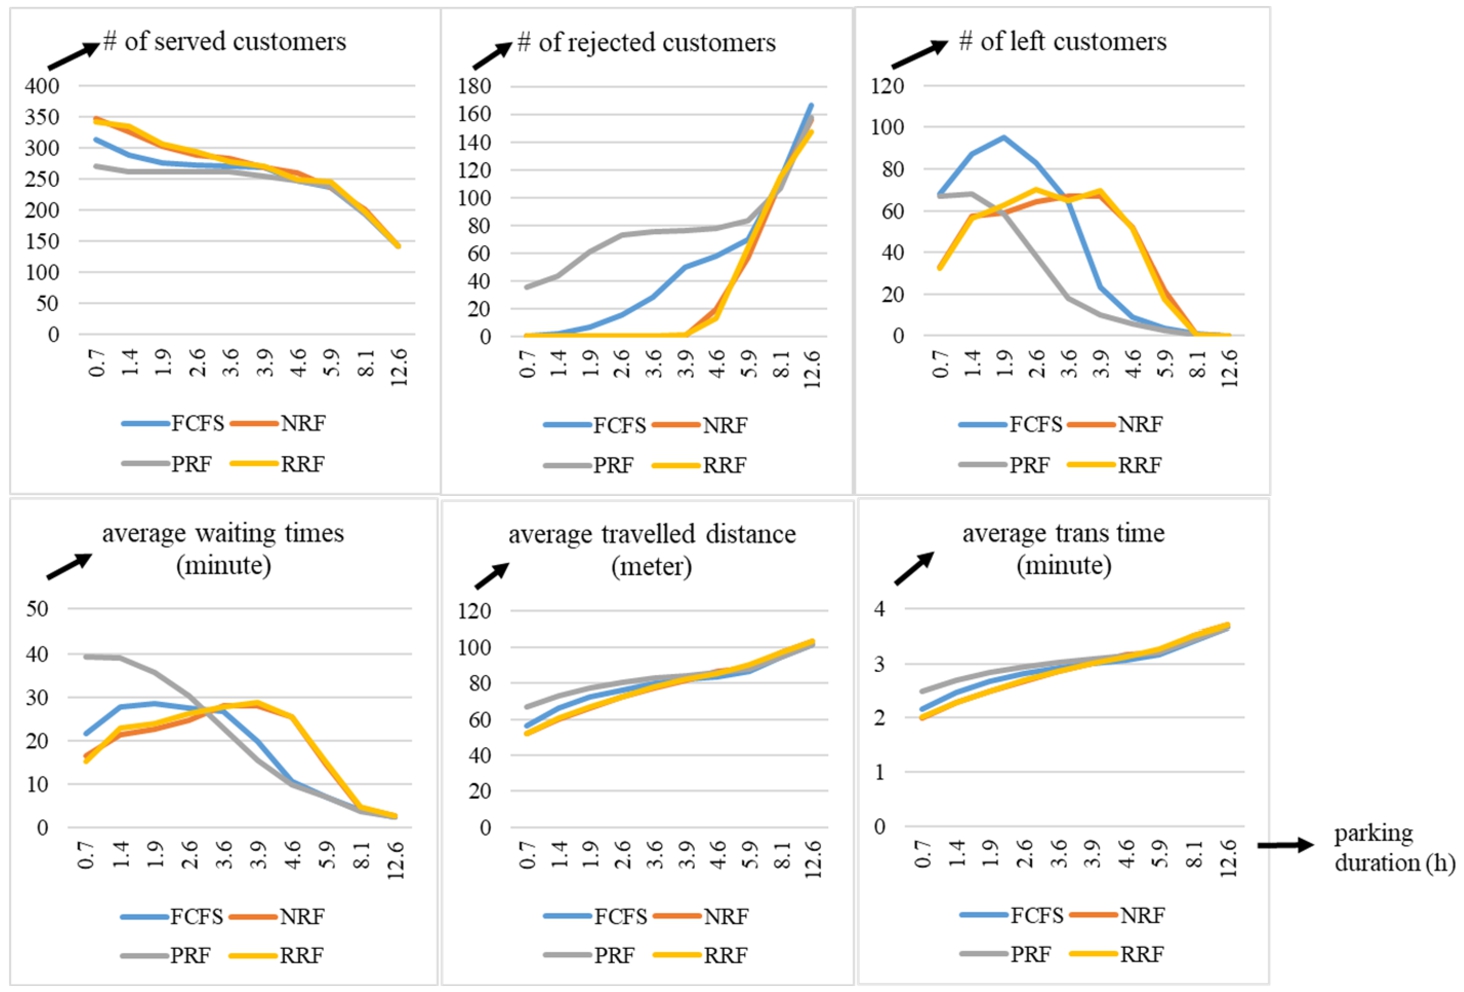
The relative performance of allocation rules RAS, NAS, and FAS in terms of capacity utilization (e.g. the total number of customers served, rejected, and left the system due to long queues) and system efficiency in Fig. 13. The results show that NAS outperforms the other in all performance criteria. However, as the customer’s parking duration increases, the difference between the allocation strategies decreases. When dispatching rules are investigated in Fig. 14, FCFS and NRF outperform the other rules, especially in terms of capacity utilization, the difference between the rules is decreased as customers leave their cars for a long time.
5.2.3Performance Analysis Based on Duration Pattern
The distribution functions related to system inputs are preserved, and only the mean values have been modified so far. In the following subsection, the parameter values of the functions are altered to provide the same mean value but with different standard deviations. The performance of the rules is discussed as the standard deviation (std) of the function is increased/decreased. The beta distribution function has a good fit for customer parking durations. The functions and their parameter values are given in Fig. 15.
Fig. 15
The distribution function used for parking durations and its parameter values.
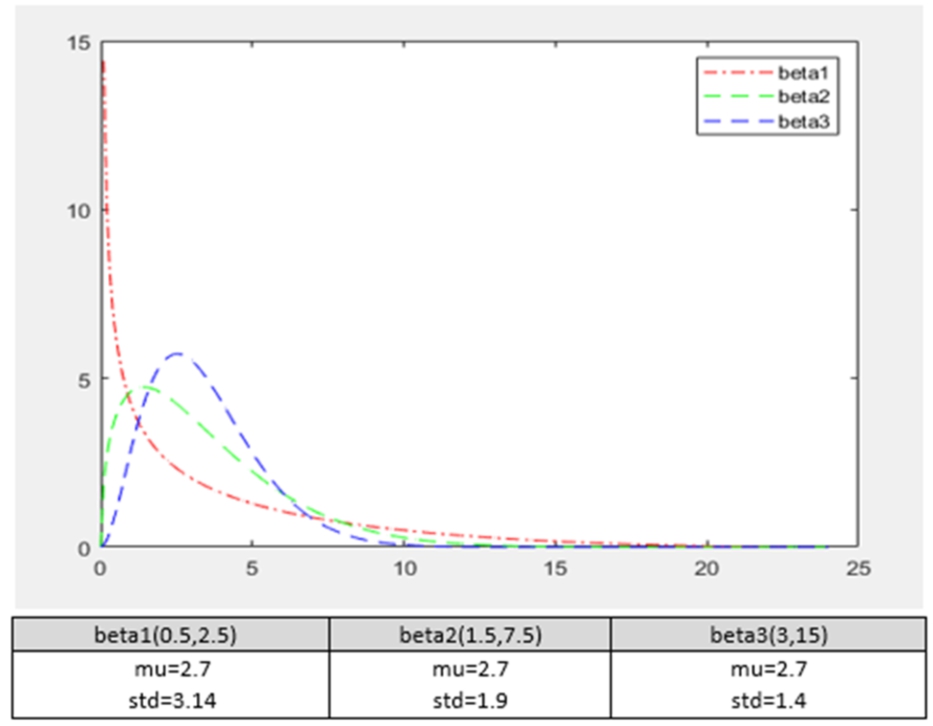
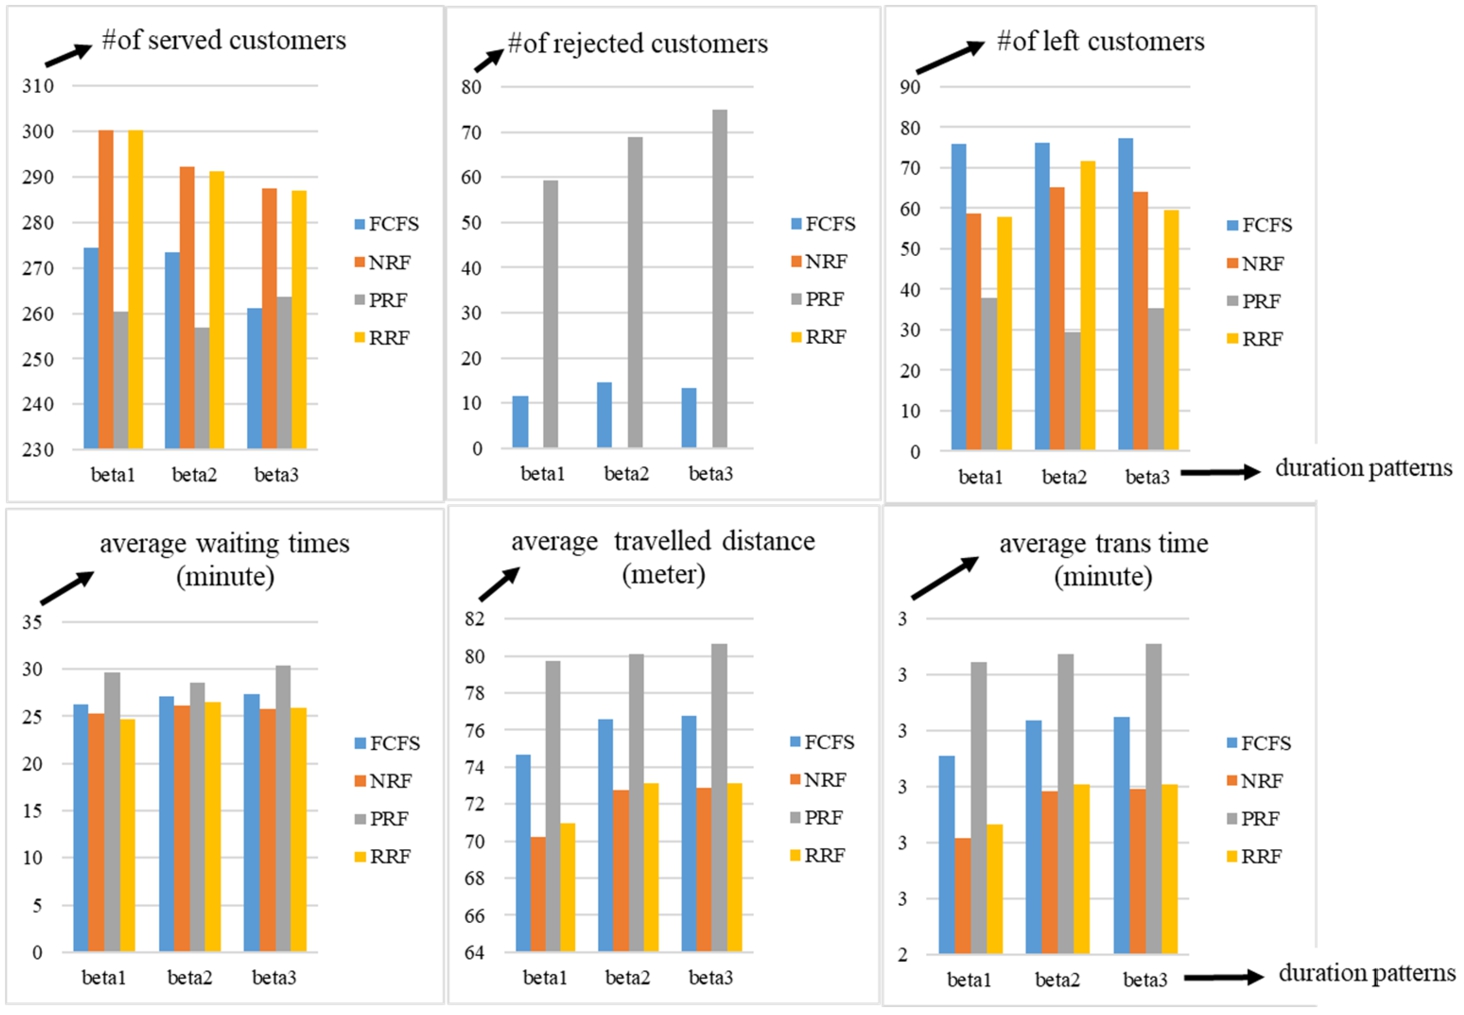
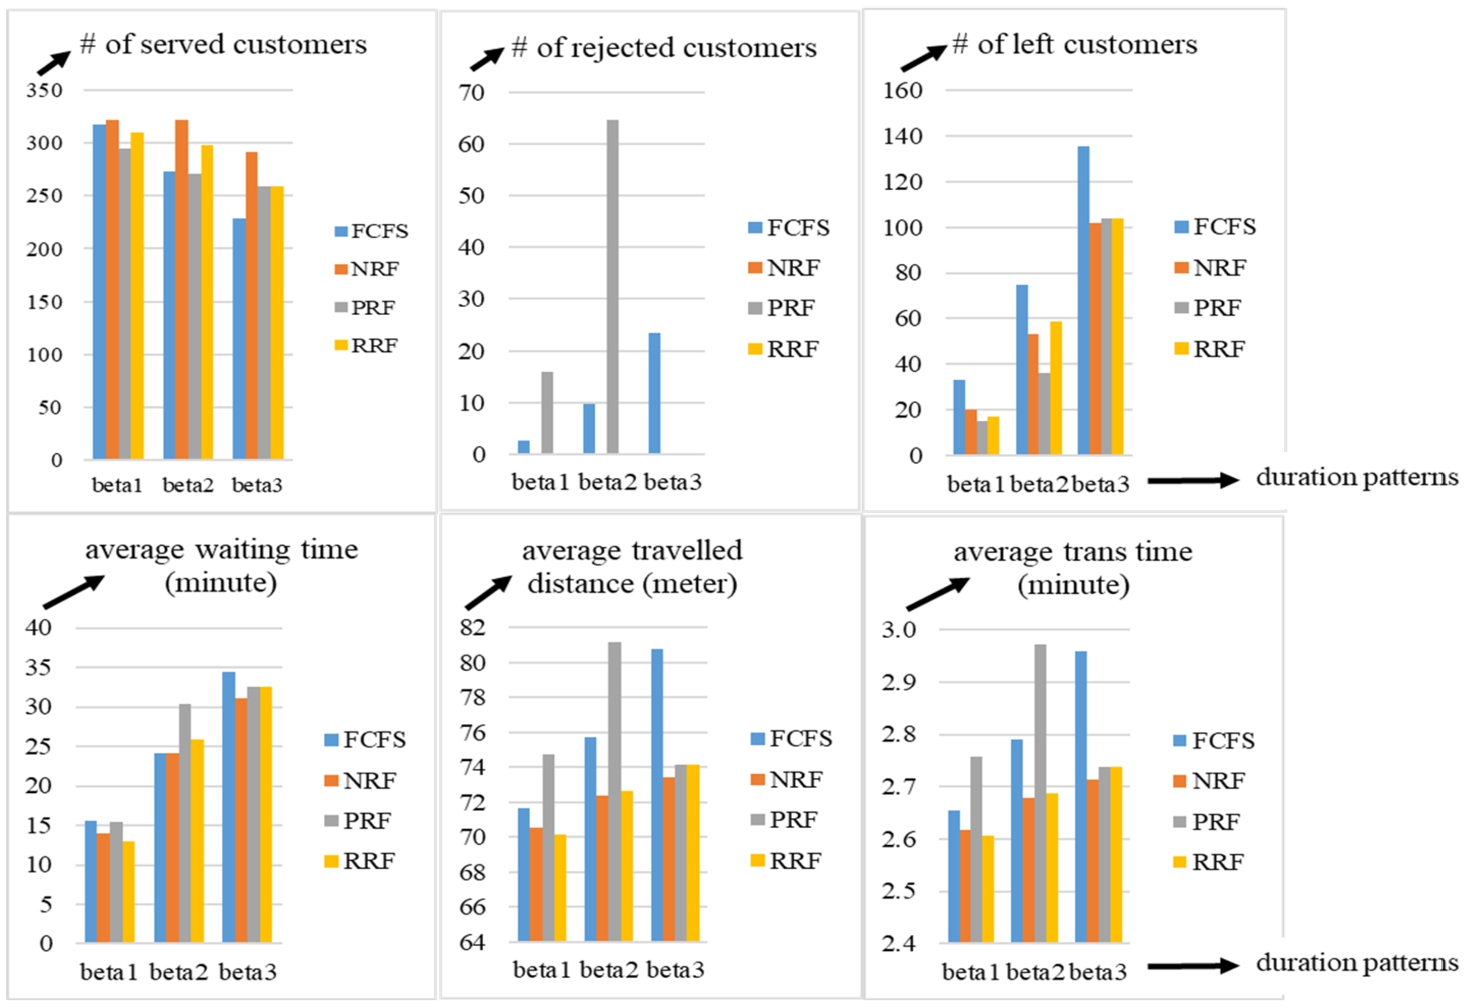
As seen in Fig. 16, all rules have better performance in case of the customer’s parking durations have a wide range and are relatively steady. But the impact of the deviations is higher on capacity utilization efficiency while relatively lower on system efficiency. Also, Fig. 17 shows that the efficiency of the sequencing rules is affected by the deviation in parking duration more than the allocation rules.
Fig. 16
Performance of Allocation Rules in terms of capacity utilization and system efficiency.

Fig. 17
Performance of Sequencing Rules in terms of capacity utilization and system efficiency.
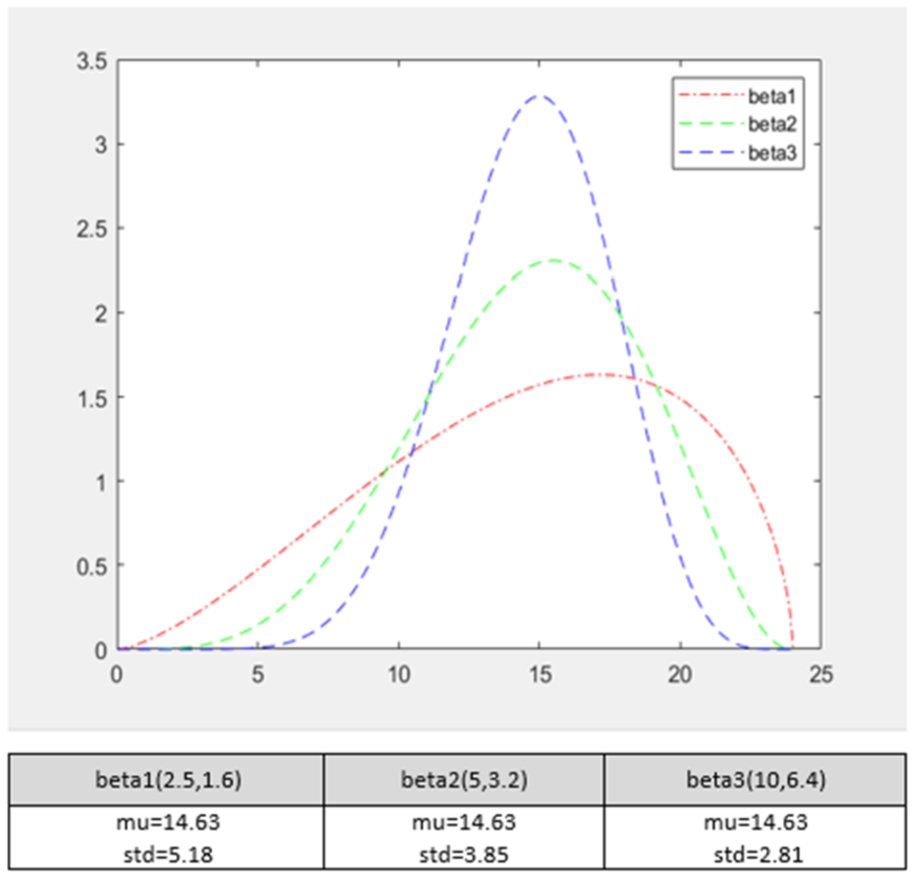
5.2.4Performance Analysis Based on Arrival Patterns
Finally, the last analysis of the customer arrival pattern within a day is carried out. The arrival pattern of the customers fits the Beta distribution, too. The considered functions and their parameter values are given in Fig. 18. Here, the performance of the rules is analysed for a relatively regular arrival pattern (beta1) and a rush-hour pattern (beta3). As shown in Fig. 19, the efficiency of the allocation is highly affected by the arrival pattern of the customer. Moreover, the arrival pattern directly affects customer satisfaction level since the system cannot respond to requests as the arrival rate of the customer increases in a small-time interval. The same effect is observed for sequencing rules with a difference, these groups of rules have more impact on system efficiency as the arrivals are getting the rush pattern as seen in Fig. 20.
Fig. 18
The distribution function used for parking durations and its parameter values.
6Conclusion and Future Work
The interest in FAPSs is increasing worldwide, but academic/scientific studies on this subject are still limited, and there is a research need in this area. In the scope of this paper, a generic algorithm is developed to provide planning and control of operations in fully automated parking systems. Different dispatching rules that can be utilized for assignment/allocation and request sequencing decisions are identified. Also, a simulation model is designed to test the performance of the distribution rules and heuristics.
Fig. 19
Performance of Allocation Rules in terms of capacity utilization and system efficiency.
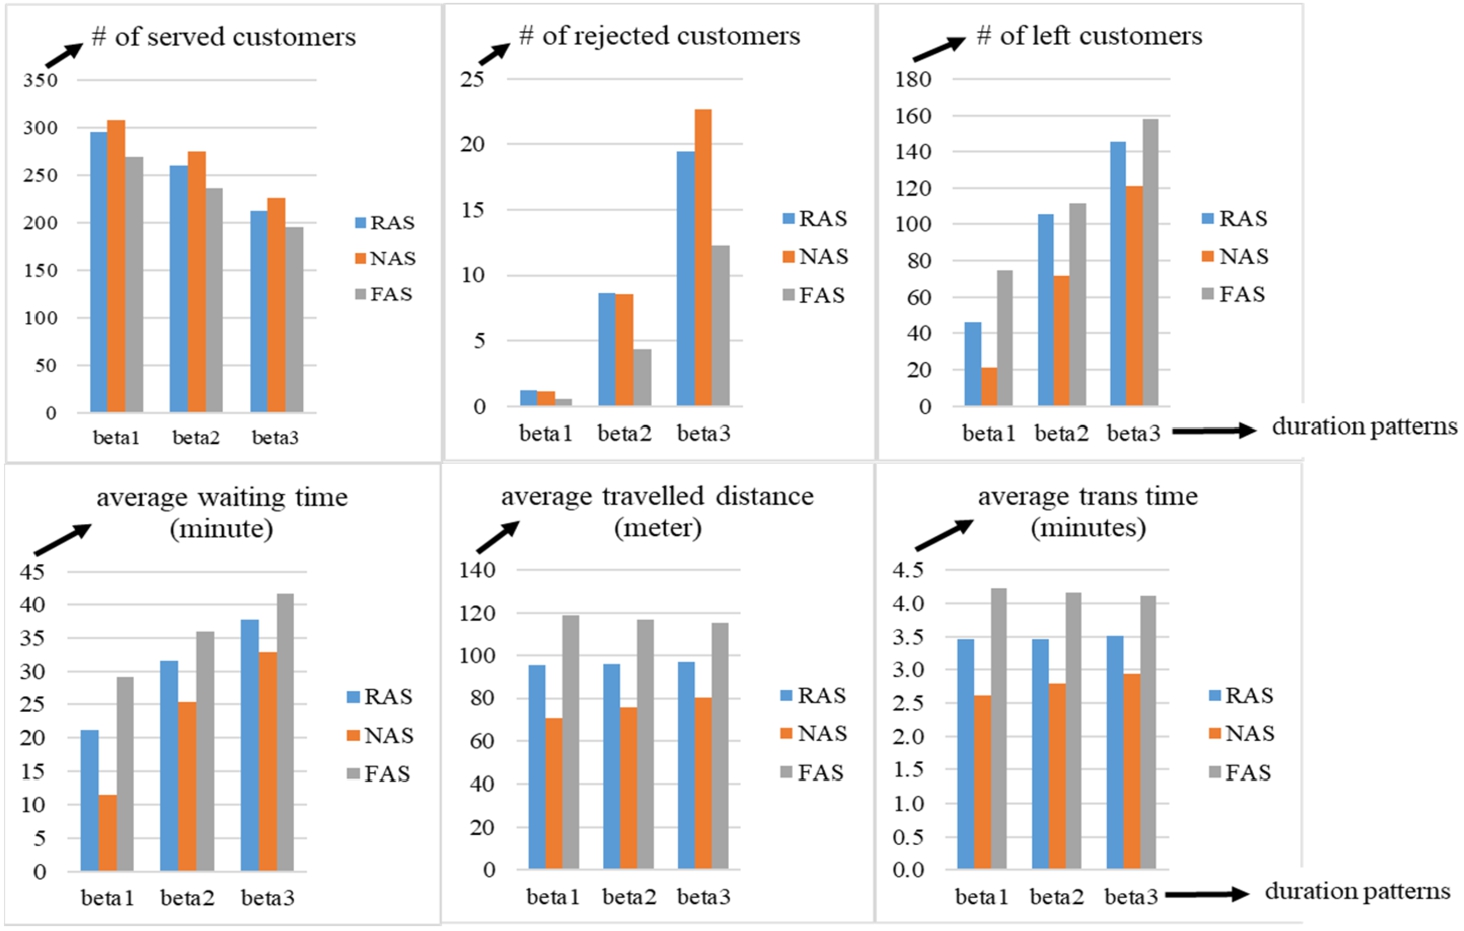
Fig. 20
Performance of Sequencing Rules in terms of capacity utilization and system efficiency.
This study’s key contributions include the integration of customer behaviour into dispatching rules through a sophisticated simulation model for Fully Automated Parking Systems. It introduces novel dispatching rules and evaluates their impact on system performance, highlighting the importance of allocation decisions. However, limitations exist concerning the scope of dispatching rules, generalizability to different FAPSs, external factors, and the absence of real-world implementation, suggesting opportunities for future research to address these constraints and enhance FAPS operational efficiency.
In conclusion, this study provides valuable insights into the dispatching rules used in fully automated parking systems. The combination of the NAS allocation rule and FCFS sequencing rule exhibits superior performance in terms of customer waiting times and system utilization. The research emphasizes the critical role of allocation decisions in determining operational efficiency, urging future research to focus on optimization in this area. By optimizing allocation strategies, FAPSs can achieve significant improvements in their overall performance, ultimately enhancing customer satisfaction and system effectiveness. With this motivation, a novel allocation procedure is planned to be developed in future studies. The proposed approach could be performed on the same case, and the results obtained from the case can be discussed in detail.
Appendices
A
AAppendix
Table A1
Nomenclature of mathematical equations.
| Starting position (coordinates) of the carrier/transporter | Set of all transactions | ||
| Position of the carrier at the end of the transportation process | Total number of transactions within the considered period | ||
| Velocity of the carrier on the x, y, z axis, respectively | |||
| t | Starting time of the transaction | ||
| End time of the transaction | Number of customers arrived (parking transaction) | ||
| Distance travelled by the transporter to perform the transaction i | Number of customers departed (retrieval transaction) | ||
| Time spent on the transaction i | Waiting time of transaction i for parking | ||
| Total distance travelled in the system. | Waiting time of transaction i for retrieval | ||
| Total time spent for the transactions | The request time of transaction i | ||
| Mean distance travelled per transaction (operation) | The actualization time of transaction i | ||
| Mean time spent per transaction (operation) | Waiting time for parking operation | ||
| Set of parking transactions | Waiting time for retrieval operation | ||
| Set of retrieval transactions | W | Average waiting time per transaction |
References
1 | Bartholdi, J.J., Hackman, S.T. ((2011) ). Warehouse & Distribution Science Release 0.94, https://www.warehouse-science.com. |
2 | Büchel, B., Corman, F. ((2020) ). Review on statistical modeling of travel time variability for road-based public transport. Frontiers in Built Environment, 6. https://doi.org/10.3389/fbuil.2020.00070. |
3 | Buehler, R., Pucher, J., Gerike, R., Götschi, T. ((2017) ). Reducing car dependence in the heart of Europe: lessons from Germany, Austria, and Switzerland. Transport Reviews, 37: (1), 4–28. https://doi.org/10.1080/01441647.2016.1177799. |
4 | Carneiro de Albuquerque, B.F., Sasian, J., Luis de Sousa, F., Montes, A.S. ((2012) ). Method of glass selection for color correction in optical system design. Optics Express, 20: (13), 13592–13611. https://doi.org/10.1364/oe.20.013592. |
5 | Chen, Q., Sun, H. ((2017) ). Simulation research on storage-retrieval strategies of stereo garages. In: 2017 6th International Conference on Industrial Technology and Management, ICITM, Cambridge, 2017, pp. 75–79. https://doi.org/10.1109/ICITM.2017.7917899. |
6 | Chen, Q., Wang, Z.G., Gong, Y.M., De Koster, R., Chen, W.Y. ((2021) ). Performance evaluation of compact automated parking systems with mobile application and customer service priority. International Journal of Production Research, 59: (10), 2926–2959. https://doi.org/10.1080/00207543.2020.1743895. |
7 | Chen, Y., Yi, G., Li, J. ((2021) ). Scheduling study of stereo garage access problem based on hybrid cross-entropy algorithm. In: 2021 4th International Conference on Robotics, Control and Automation Engineering (RCAE), Wuhan, China, 2021, pp. 433–437. https://doi.org/10.1109/RCAE53607.2021.9638828. |
8 | Chung, C. ((2003) ). Simulation Modeling Handbook: A Practical Approach. CRC Press, Boca Raton, London, New York, Washington. |
9 | Debnath, J.K., Serpen, G. ((2015) ). Real-time optimal scheduling of a group of elevators in a multi-story robotic fully-automated parking structure. Procedia Computer Science, 61: , 507–514. https://doi.org/10.1016/j.procs.2015.09.202. |
10 | Eymen, U.E. ((2007) ). SPSS 15.0 Veri Analiz Yöntemleri. İstatistik Merkezi Yayın No: 1. http://eytepe.com/2017/03/15/spss-ile-veri-analiz-yontemleri/. |
11 | Gingu, E.I., Zapcui, M. ((2015) ). Input modelling using statistical distributions and arena software. Annals of the Academy of Romanian Scientists: Series on Mathematics and its Applications, 7: (1), 63–70. |
12 | Guo, W., Zhang, Y., Xu, M., Zhang, Z., Li, L. ((2016) ). Parking spaces repurchase strategy design via simulation optimization. Journal of Intelligent Transportation Systems, 20: (3), 255–269. https://doi.org/10.1080/15472450.2015.1063424. |
13 | Ingvardson, J., Nielsen, O. ((2018) ). Passenger arrival and waiting time distributions dependent on train service frequency and station characteristics: a smart card data analysis. Transportation Research Part C: Emerging Technologies, 90: , 292–306. https://doi.org/10.1016/j.trc.2018.03.006. |
14 | Kuda, F., Mikšíková, S., Ulčák, D. ((2022) ). Analysis of malfunctions in selected parking systems in the Czech Republic. Sustainability, 14: (3), 1826. https://doi.org/10.3390/SU14031826. |
15 | Manzini, R. ((2012) ). Warehousing in the Global Supply Chain: Advanced Models, Tools and Applications for Storage Systems. Springer-Verlag, London, pp. 1–483. ISBN 978-1-4471-2273-9. https://doi.org/10.1007/978-1-4471-2274-6. |
16 | Mirzaei, M., De Koster, R.B.M., Zaerpour, N. ((2017) ). Modelling load retrievals in puzzle-based storage systems. International Journal of Production Research, 55: (21), 6423–6435. https://doi.org/10.1080/00207543.2017.1304660. |
17 | Nayak, A.K., Akash, H.C., Prakash, G. ((2013) ). Robotic valet parking system. In: 2013 Texas Instruments India Educators’ Conference, TIIEC, Bangalore, India, 2013, pp. 311–315. https://doi.org/10.1109/TIIEC.2013.62. |
18 | Neuhäuser, M. ((2012) ). Nonparametric Statistical Tests: A Computational Approach. CRC Press, Taylor & Francis Group. ISBN 9781138114104. https://books.google.com/books/about/Nonparametric_Statistical_Tests.html?hl=tr&id=CUfBswEACAAJ. |
19 | Özgün, O., Barlas, Y. ((2009) ). Discrete vs. continuous simulation: when does it matter? In: Proceedings of the 27th International Conference of The System Dynamics Society, Albuquerque, NM, USA., July 26–30, 2009. https://proceedings.systemdynamics.org/2009/proceed/papers/P1199.pdf. |
20 | Pypno, C. ((2008) ). Multi-storey automated over ground garage for cars-solution of parking problems in big urban areas. Transport Problems, 3: , 59–63. |
21 | Rockwell Automation ((2022) ). Arena. https://www.arenasimulation.com/search/eyJyZXN1bHRfcGFnZSI6InNlYXJjaCIsImtleXdvcmRzIjoiaW5wdXQgYW5hbHlzaXMifQ. |
22 | Roodbergen, K.J., Vis, I.F.A. ((2009) ). A survey of literature on automated storage and retrieval systems. European Journal of Operational Research, 194: (2), 343–362. https://doi.org/10.1016/J.EJOR.2008.01.038. |
23 | Serpen, G., Debnath, J. ((2019) ). Design and performance evaluation of a parking management system for automated, multi-story and robotic parking structure. International Journal of Intelligent Computing and Cybernetics, 12: (4), 444–465. https://doi.org/10.1108/IJICC-02-2019-0017. |
24 | Serpen, G., Dou, C. ((2015) ). Automated robotic parking systems: real-time, concurrent and multi-robot path planning in dynamic environments. Applied Intelligence, 42: (2), 231–251. https://doi.org/10.1007/S10489-014-0598-X/FIGURES/20. |
25 | Wu, G., Zou, B., Xu, X. ((2019) ). Shuttle-based operating policies for multiple-lift compact automated parking systems based on queuing networks. Cluster Computing, 22: , 6449–6460. https://doi.org/10.1007/s10586-018-2246-4. |
26 | Yalcin, A., Koberstein, A., Schocke, K.O. ((2018) ). An optimal and a heuristic algorithm for the single-item retrieval problem in puzzle-based storage systems with multiple escorts. International Journal of Production Research, 57: (1), 143–165. https://doi.org/10.1080/00207543.2018.1461952. |
27 | Zhang, J., Gao, Z.Y., Yu, Y.G., Wang, T. ((2020) ). Travel time model for a tower-based automated parking system. International Journal of Production Research, 59: (18), 5422–5437. https://doi.org/10.1080/00207543.2020.1780334. |


