
Causal Inference Applied to Explaining the Appearance of Shadow Phenomena in an Image
Abstract
Due to the complexity and lack of transparency of recent advances in artificial intelligence, Explainable AI (XAI) emerged as a solution to enable the development of causal image-based models. This study examines shadow detection across several fields, including computer vision and visual effects. Three-fold approaches were used to construct a diverse dataset, integrate structural causal models with shadow detection, and apply interventions simultaneously for detection and inferences. While confounding factors have only a minimal impact on cause identification, this study illustrates how shadow detection enhances understanding of both causal inference and confounding variables.
1Introduction
When considering any image, beyond seeing it as a container of objects, among other things, it is natural for a human being to give it meaning or to infer the explanation of some event of interest captured in it, but how can such an inference be reached through artificial intelligence? Causal inference can be applied in many areas of science and technology, such as economics, epidemiology, image processing, and autonomous driving, which are areas where it is crucial to make accurate decisions. Currently, there are widely studied methods that, through correlation, recognize and classify objects using datasets such as (Deng et al., 2009) which has sufficient size and information to ensure high accuracy in such tasks (Zeiler and Fergus, 2014). However, in the last decade, as pointed out by Saeed and Omlin (2021), explainable AI (XAI) has been proposed to respond to the need raised by important contributions in artificial intelligence, which have led to an increasing complexity of algorithms and lack of transparency of models, and to advance the adoption of AI in critical domains. Then, to obtain the explanation we are looking for about an event captured in an image, we would have to consider causal relationships that can either be inferred through expert knowledge (Martin, 2018) or intervene such data sets through experimentation, as indicated in He and Geng (2008), taking into account that, in probabilistic language, not having a way to distinguish between giving value to a variable and observing it, prevents modelling cause and effect relationships (Perry, 2003). Thus, taking modelling as an essential step to achieve causal inference, Xin et al. (2022) discusses the role of causal inference to improve the interpretability and robustness of machine learning methods, and highlights opportunities in the development of machine learning models with causal capacity adapted for the analysis of mobility considering images or sequential data. In the punctual case on causal inference applied to images, Lopez-Paz et al. (2017) propose to use neural causality coefficients (NCCs) that are calculated by applying convolutional neural networks (CNNs) to the pixels of an image, so that the appearance of causality between variables suggests that there is a causal link between the real-world entities themselves, Lebeda et al. (2015) have proposed a statistical approach – transfer entropy – to discover and quantify the relationship between camera motion and the motion of a tracked object to predict the location of the tracked object, Fire and Zhu (2013) presented a Bayesian grammar (C-AOG) model for human-perceived causal relationships that can be learned from a video, and Pickup et al. (2014) use the causality method, supplemented with computer vision and machine learning techniques, to determine whether a video is playing forward or backward by observing the “arrow of time” in a temporal sequence.
This paper consists of four sections, in Section 1 we state the motivation of the study, present some antecedents that have made important contributions in the area of causal inference applied to images and define our contribution as a starting point to address a problem area already detected by several authors. In Section 2, we present the method used to generate the data, define the causal model and validate it with the NOTEARS algorithm, and then query the model by means of interventions. In Section 3, we analyse the results obtained in the applied causal discovery and causal inference processes and, finally, in Section 4, we conclude that the graphical representation of a causal model makes it simpler to understand the problem, although for the validation using NOTEARS we had to make restrictions based on expert knowledge. Likewise, we recognize the importance of the structure of the dataset for causal inference in contrast to the structure of a machine learning dataset and, finally, thanks to the interventions and queries of the causal model, it was possible to deduce, with a high level of certainty, the cause of the shadow projection.
1.1Related Work
Regarding the explainability of events or phenomena captured in an image or video, taking modelling as an essential step to achieve causal inference, Xin et al. (2022) discusses the role of causal inference to improve the interpretability and robustness of machine learning methods, and highlights opportunities in the development of machine learning models with causal capability adapted for mobility analysis considering images or sequential data. In the punctual case on causal inference applied to image analysis, Lopez-Paz et al. (2017) propose to use neural causality coefficients (NCCs) that are calculated by applying convolutional neural networks (CNNs) to the pixels of an image, so that the appearance of causality between variables suggests that there is a causal link between the real-world entities themselves, Lebeda et al. (2015) have proposed a statistical approach – transfer entropy – to discover and quantify the relationship between camera motion and the motion of a tracked object to predict the location of the tracked object, Fire and Zhu (2013) presented a Bayesian grammar (C-AOG) model for human-perceived causal relationships that can be learned from a video, and Pickup et al. (2014) use the causality method, supplemented with computer vision and machine learning techniques, to determine whether a video is playing forward or backward by observing the “arrow of time” in a temporal sequence.
1.2Our Contribution
By taking into account the underlying causes of shadow formation, causal inference can provide more accurate predictions and improve the overall realism of virtual environments. By virtue of this, given the relevance of this topic and the need for experimentation on specific cases that would potentially be contributory to evolving fields such as 3D graphics where shadow detection is an area where causal inference can be applied to improve accuracy and efficiency in this process, as opposed to traditional techniques such as ray tracing which is computationally expensive in terms of handling complex scenes with many objects (Levoy, 1990), this challenge is equally recognized in novel solutions such as that of Li et al. (2018) which computes derivatives of scalar functions on a rendered image with respect to arbitrary scene parameters such as camera location, scene geometry, materials and lighting parameters using an edge sampling algorithm. Our study provides a benchmark for addressing one aspect of this problem using causal inference to detect and deduce the cause of a shadow cast on the surface of a 3D scene.
2Materials and Method
Our objective was to explain, by means of causal inference, the appearance of a shadow cast on the surface defined on the lower face of a 3D scene in which, in addition to being illuminated, a sphere is present. For this we established 3 steps; in the first one we generated
2.1Data
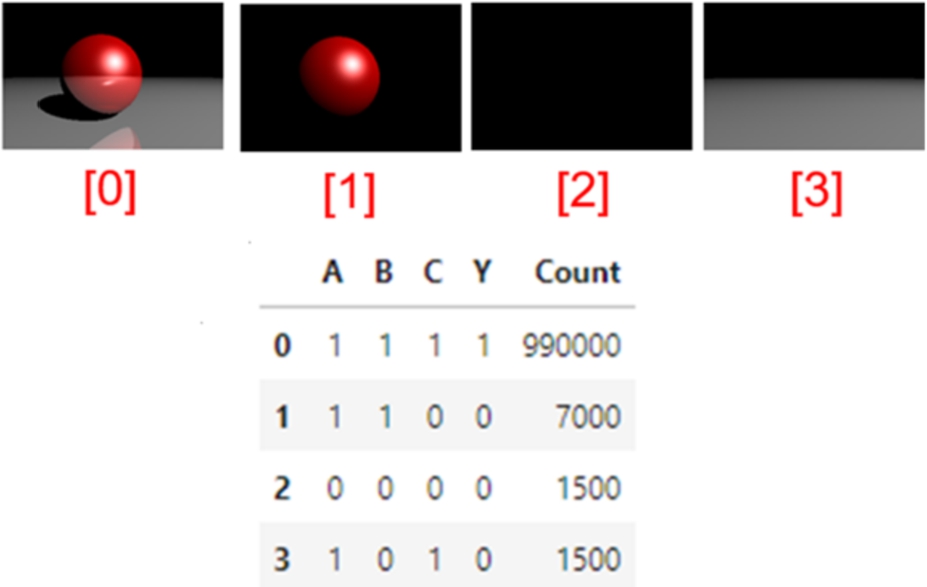
As already stated, we considered 4 observable features for the confirmation of the dataset, Table 1 shows the label used for each of them and the values they can take, with 1 indicating that the feature is present in the scene and 0, otherwise.
Table 1
Labellingof the observed features.
| Feature | Label | Posible values |
| Light | A | |
| Sphere | B | |
| Surface | C | |
| Shadow | Y |
Figure 1 shows the dataset based on a hypothetical scenario similar to that used by Pearl and Mackenzie (2018) to demonstrate the importance of probabilities emphasizing that a causal model involves more than drawing arrows, for behind these are probabilities.
Fig. 1
Observations considered in the data set.
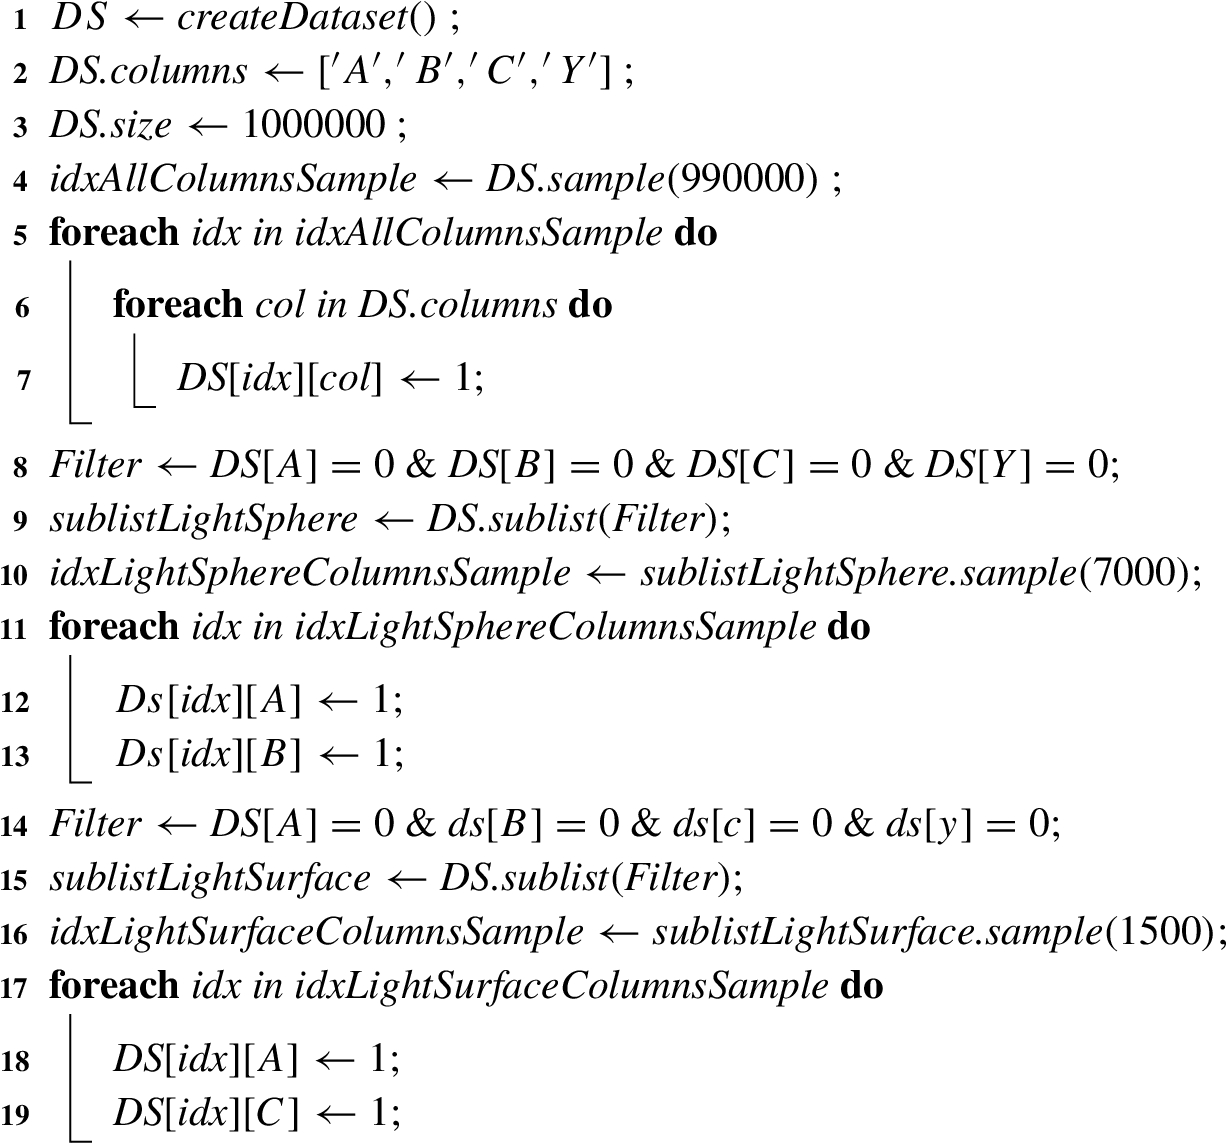
Thus, by means of Algorithm 1, the data of
Algorithm 1
Data generation
2.2Structured Causal Model SCM
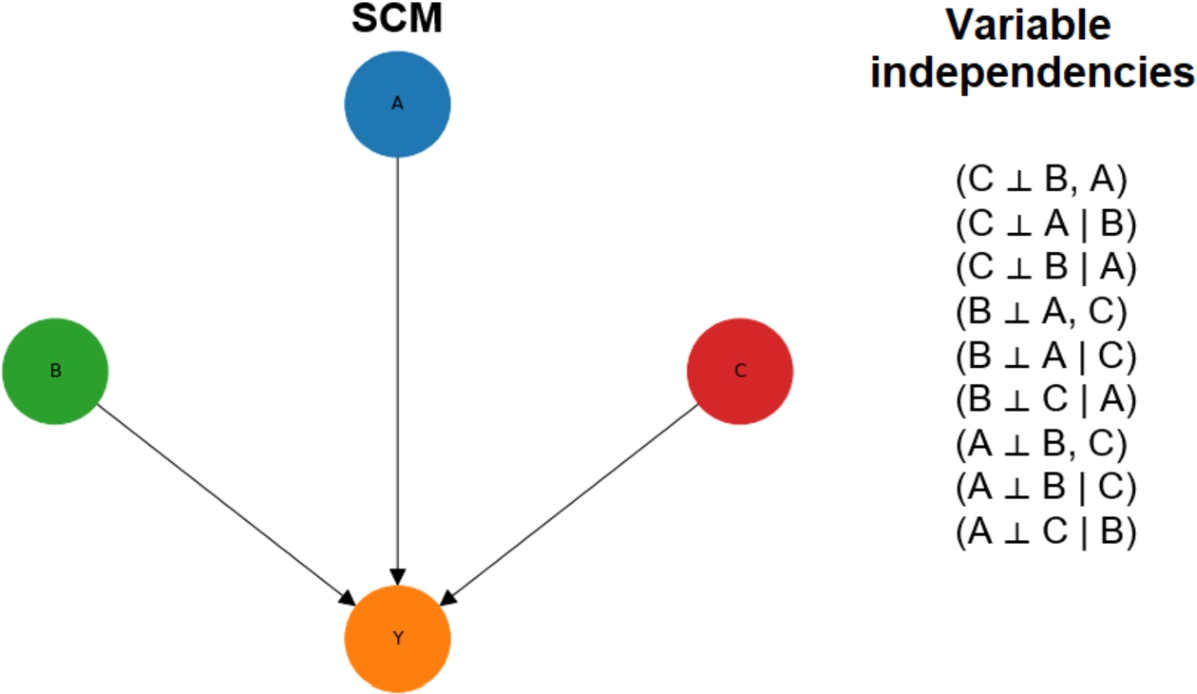
According to Pearl et al. (2019), an SCM is a way of describing the relevant features of the world and how they interact with each other. Specifically, a structural causal model describes how nature assigns values to variables of interest. Causal inference usually requires specialized knowledge and untestable hypotheses about the causal network linking treatment, outcome, and other variables. By summarizing knowledge and hypotheses in an intuitive way, graphs help clarify conceptual issues and improve communication between researchers (Hernán and Robins, 2020). Accordingly, we model an SCM in which each node corresponds to each observable feature and all edges point to a single collider node -Y-. Figure 2 shows the SCM and the independence of the variables that comprise it.
Fig. 2
SCM and variables independencies.
2.3Causal Inference
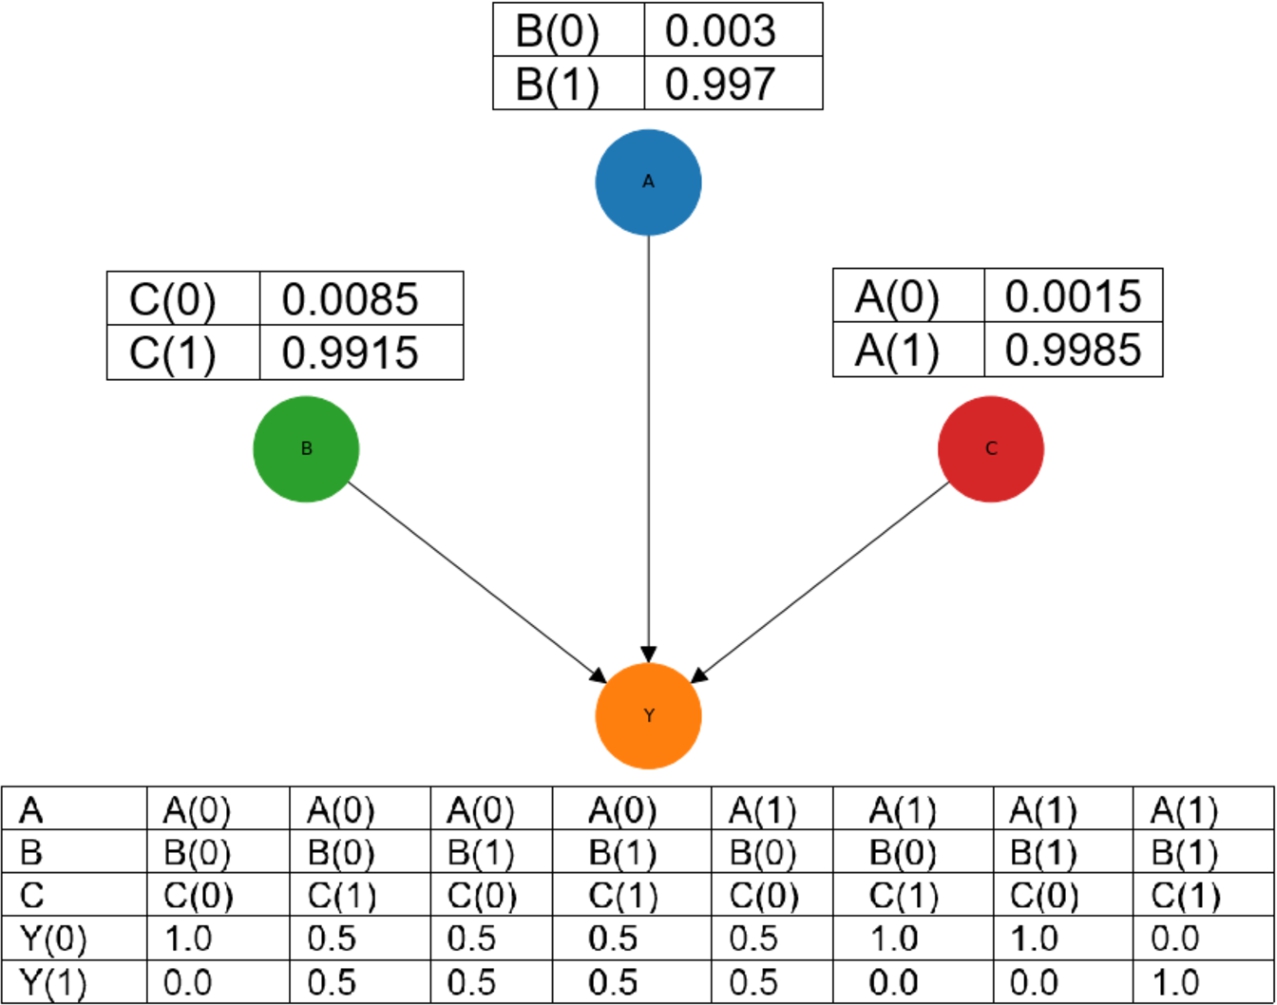
Once the model is built, we calculate the conditional probability distributions (CPD) which are defined for a set of discrete and mutually dependent random variables to show the conditional probabilities of a single variable with respect to the others (Murphy, 2012). These are calculated by applying the chain rule as illustrated in (1), where
(1)
As shown in Fig. 3, we calculate the probability of each possible value of each variable knowing the values taken by the other variables.
Fig. 3
CPD for each variable of the model.
Then, to strengthen our hypothesis, we asked the model what would happen if no sphere had been detected, in other words, we intervened the model by not detecting the sphere in order to obtain the probability of detecting the shadow. To provide clarity on what role the SCM variables play in the causal inference process we follow, among others, Chiappa and Isaac (2019), Guo et al. (2020) and Dague and Lahey (2019) who explain that a causal inference process is determined by a treatment, a set of confounders and an outcome. Table 2 shows the role of each MCS variable in the causal inference process.
Table 2
Role of SCM variables in the Causal Inference process.
| Label | Variable |
| Treatment | B |
| Confounders | [A, C] |
| Outcome | Y |
Subsequently, considering this intervention, we calculated for the whole set of cases
(2)
Finally, to contrast the treatment results and thus obtain the estimate of how far the hypothesis was from being null, i.e. that there was no relationship between the sphere and the shadow, for a 95% confidence interval, we calculated a table of z-scores by applying (3) where
(3)
2.4Shadow Detection
Within the realm of shadow detection in images, prominent methods include adaptive thresholding, threshold segmentation (Bradski, 2000), and clustering-based segmentation (Felzenszwalb) (Van der Walt et al., 2014). We extended the latter by integrating a causal inference module. This advancement not only facilitated shadow detection but also enabled the identification of their root causes within specific scenarios. This comprehensive approach demanded parameters encompassing a comprehensive record of perceptible elements within the image (light, sphere, surface, and shadow), alongside the causal inference model.
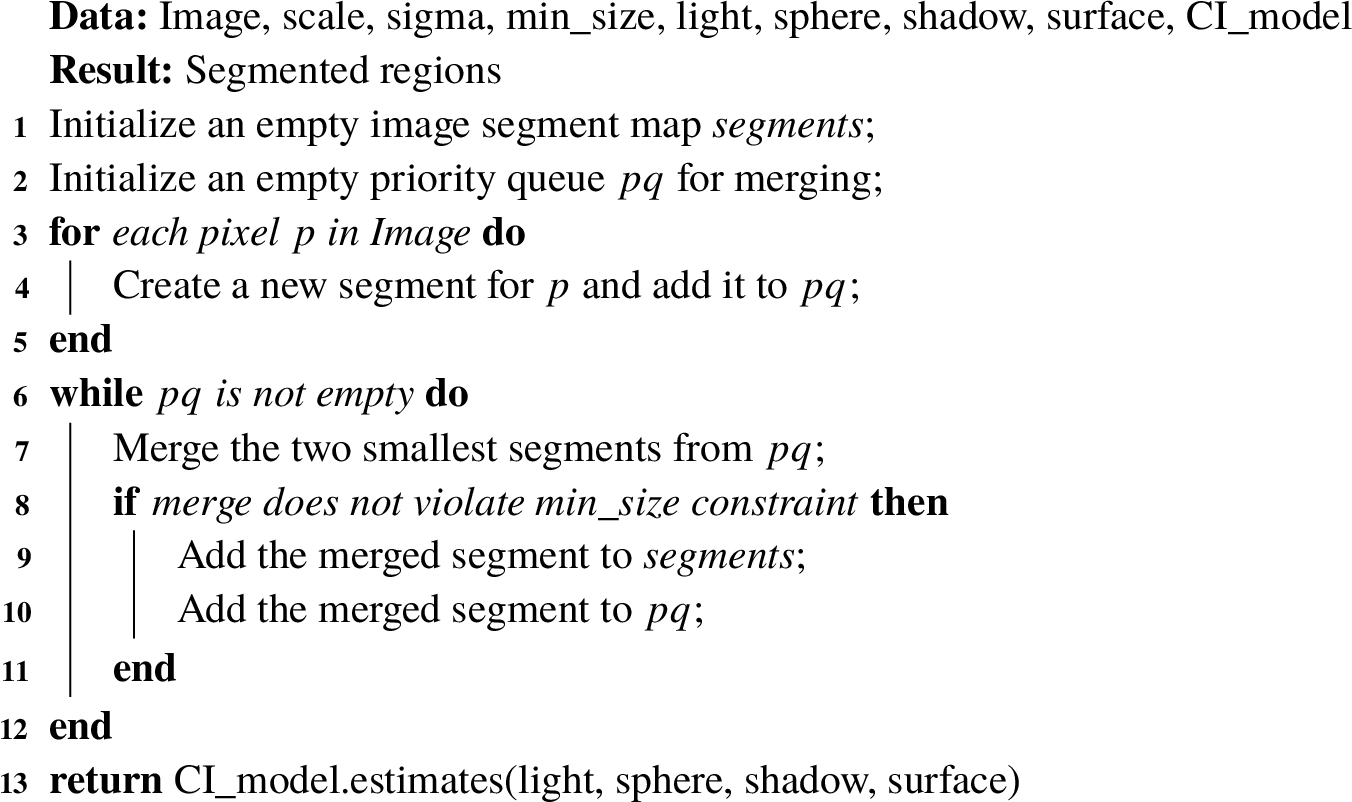
Illustrating this process, Algorithm 2 outlines the intricate interplay between shadow detection and causal inference within the shadow phenomenon.
Algorithm 2
Algorithm for detection and causal inference of shadow phenomena
3Results
3.1Causal Model
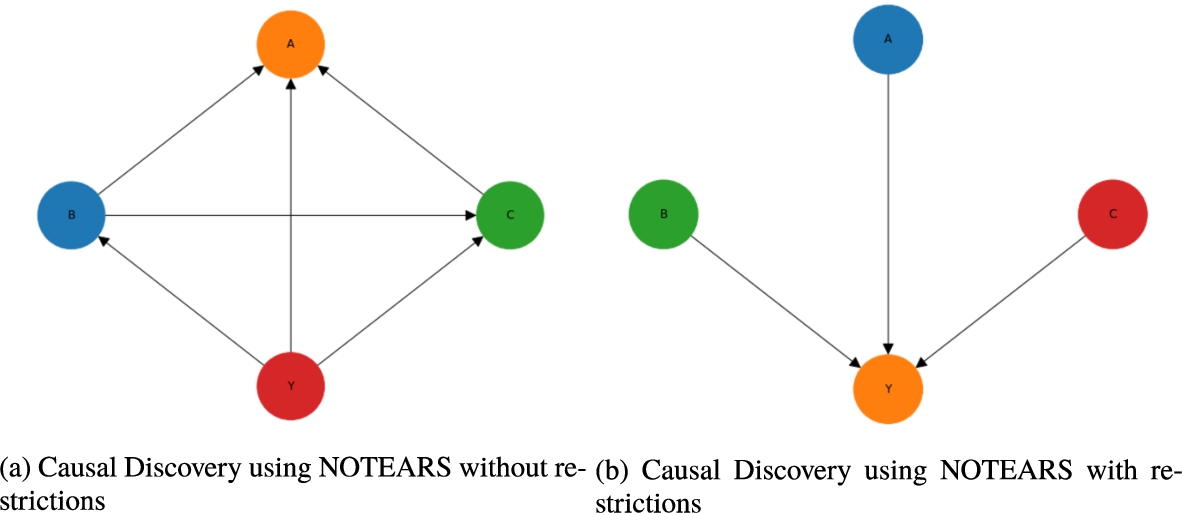
The structural causal model (SCM) was designed based on expert knowledge as Hernán and Robins (2020) pointed out, but validated in two attempts by means of causal Discovery using NOTEARS. In the first attempt, the algorithm took almost 5 minutes to generate the model shown in Fig. 4(a), which we consider quite long for the size of the dataset, resulting in a model that was not very coherent according to the expert knowledge. On the other hand, in the second attempt, we added a constraint to the algorithm to consider that A, B and C are independent as already shown in Fig. 2. The algorithm, as can be seen in Fig. 4(b), generated the model in less than 10 seconds and with the expected consistency.
Fig. 4
NOTEARS causal discovery models with and without restrictions.
3.2Causal Inference
From the conditional probability distribution (CPD) it was possible to query the model under the hypothesis formulated. In Table 3, it can be seen that by eliminating the sphere there would be a 99.5% probability that no shadow would be cast; furthermore, it can be seen that the hypothesis gains strength by obtaining a p-value of less than 0.05 (the default threshold value) indicating that the null hypothesis is false, and a positive average treatment effect (ATE) value suggests that
Table 3
Causal inference from intervention
| Outcome | Probability | ATE | z | Confidence interval | |
| Y(0) | 0.995 | 0.993 | 11874 | 0.00001 | 95% |
| Y(1) | 0.005 |
3.3Shadow Detection and Causality
To establish a contrast, we employed an identical image and introduced a confounding element by aligning the background colour with the shade’s hue projected onto the surface. Subsequent execution encompassed the Felzenszwalb method integrated with the causal inference module, as well as the adaptive thresholding and threshold segmentation techniques. The outcomes of this comprehensive approach are visualized in Fig. 5.
Fig. 5
Shadow detection result.
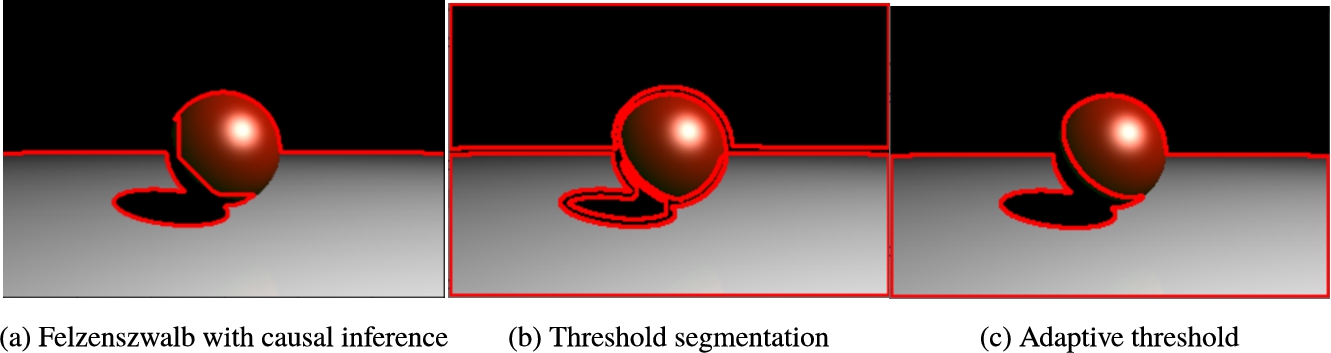
In the context of shadow detection, the outcomes are evident. Among the approaches, the combination of the Felzenszwalb method with causal inference (refer to Fig. 5(a)) showcased the most promising results. It achieved an acceptable shadow detection accuracy of
It’s important to emphasize that the presence of confounding factors significantly influenced the accuracy of the detection results. However, when considering the determination of the shadow’s causality, the impact of confounding factors became negligible. Notably, only the Felzenszwalb method (refer to Fig. 5(a)) yielded a substantial result in this regard.
4Conclusions and Future Work
We’ve shown how to employ causal inference to strengthen a hypothesis and, as a result, deduce the cause of a shadow phenomenon with high certainty. This is accomplished by utilizing interventions and inquiries within the causal model. We start with a set of photos from a 3D scenario in which four occurrences were examined as part of a structural causal model validated with the NOTEARS algorithm for causal detection. By contrasting their performance, we also demonstrated that adding a causal inference module to a shadow detection approach is feasible and advantageous. This opens the door for similar connections in other diverse and complex ways. A causal model’s visual representation improves understanding of the problem and the roles that events play in its resolution. Despite testing the causal model with NOTEARS, there was some worry about the need to set limits based on expert knowledge. A dataset with a more intricate structure is required for causal inference when compared to typical datasets utilized for machine learning applications. Confounding factors had a considerable impact on the detection method’s accuracy but not on the causal inference model. In the future, we hope to create a second version of this project. We intend to improve causal inference in this iteration by incorporating machine learning techniques. This combined approach will determine the origin of shadows sensed in complex graphical settings.
Data Availability Statement
The data presented in this study are available on request from the corresponding authors.
Acknowledgements
Jairo I. Velez: I thank the University of Zaragoza and Banco Santander (Universidad de Zaragoza-Santander Universidades) for providing me with one of the grants for Ibero-Americans in doctoral studies, thus making this research possible.
References
1 | Ankan, A., Panda, A. ((2015) ). pgmpy: probabilistic graphical models using python. In: Proceedings of the 14th Python in Science Conference (SCIPY 2015). Citeseer. |
2 | Beaumont, P., Horsburgh, B., Pilgerstorfer, P., Droth, A., Oentaryo, R., Ler, S., Nguyen, H., Ferreira, G.A., Patel, Z., Leong, W. (2021). CausalNex. https://github.com/quantumblacklabs/causalnex. |
3 | Bradski, G. ((2000) ). The OpenCV Library. Dr. Dobb’s Journal of Software Tools, 120: , 122–125. |
4 | Chiappa, S., Isaac, W.S. ((2019) ). A causal Bayesian networks viewpoint on fairness. In: Kosta, E., Pierson, J., Slamanig, D., Fischer-Hübner, S., Krenn, S. (Eds.), Privacy and Identity Management. Fairness, Accountability, and Transparency in the Age of Big Data. Privacy and Identity 2018, IFIP Advances in Information and Communication Technology, Vol. 547: . Springer, Cham. https://doi.org/10.1007/978-3-030-16744-8_1. |
5 | Dague, L., Lahey, J.N. ((2019) ). Causal inference methods: lessons from applied microeconomics. Journal of Public Administration Research and Theory, 29: (3), 511–529. https://doi.org/10.1093/jopart/muy067. |
6 | Deng, J., Dong, W., Socher, R., Li, L.-J., Li, K., Fei-Fei, L. ((2009) ). ImageNet: a large-scale hierarchical image database. In: 2009 IEEE Conference on Computer Vision and Pattern Recognition, pp. 248–255. https://doi.org/10.1109/CVPR.2009.5206848. |
7 | Fire, A., Zhu, S.-C. ((2013) ). Using causal induction in humans to learn and infer causality from video. Proceedings of the Annual Meeting of the Cognitive Science Society, 35: , 2297–2302. https://escholarship.org/uc/item/4ng247kx. |
8 | Guo, R., Cheng, L., Li, J., Hahn, P.R., Liu, H. ((2020) ). A survey of learning causality with data: problems and methods. ACM Computing Surveys, 53: (4), 1–37. https://doi.org/10.1145/3397269. |
9 | He, Y.B., Geng, Z. ((2008) ). Active learning of causal networks with intervention experiments and optimal designs. Journal of Machine Learning Research, 9: , 2523–2547. |
10 | Hernán, M.A., Robins, J.M. ((2020) ). Causal Inference: What If, I ed. Chapman & Hall/CRC, Boca Raton, pp. 312. 978-1420076165. https://www.hsph.harvard.edu/miguel-hernan/causal-inference-book/. |
11 | Lebeda, K., Hadfield, S., Bowden, R. ((2015) ). Exploring causal relationships in visual object tracking. In: 2015 IEEE International Conference on Computer Vision (ICCV), Santiago, Chile, 2015, pp. 3065–3073. https://doi.org/10.1109/ICCV.2015.351. |
12 | Levoy, M. ((1990) ). Efficient ray tracing of volume data. ACM Transactions on Graphics (TOG), 9: (3), 245–261. https://doi.org/10.1145/78964.78965. |
13 | Li, T.-M., Aittala, M., Durand, F., Lehtinen, J. ((2018) ). Differentiable Monte Carlo ray tracing through edge sampling. ACM Transactions on Graphics, 37: (6). 1–11. https://doi.org/10.1145/3272127.3275109. |
14 | Lopez-Paz, D., Nishihara, R., Chintala, S., Sch¨lkopf, B., Bottou, L. ((2017) ). Discovering causal signals in images. In: 2017 IEEE Conference on Computer Vision and Pattern Recognition (CVPR), Honolulu, HI, USA, 2017, pp. 58–66. https://doi.org/10.1109/CVPR.2017.14. |
15 | Martin, O. ((2018) ). Bayesian Analysis with Python, 2nd ed. Packt Publishing, Birmingham, Mumbai. 978-1-78588-380-4. |
16 | Murphy, K.P. ((2012) ). Machine Learning: A Probabilistic Perspective, Vol. 16: . The MIT Press, Massachusetts, pp. 1–1098. 978-0-262-01802-9. |
17 | Pearl, J., Mackenzie, D. ((2018) ). The Book of Why, I ed. Basic Books, New York. 0465097618. |
18 | Pearl, J., Glymour, M., Jewell, N.P. ((2019) ). Causal Inference in Statistics A Primer. John Wiley & Sons Ltd, West Sussex, pp. 159. 9781119186847. |
19 | Perry, M.J. ((2003) ). Causality: models, reasoning, and inference. In: The Encyclopedia of Ancient History, Vol. 19: , pp. 675–685. https://doi.org/10.1002/9781444338386.wbeah13034. |
20 | Pickup, L.C., Pan, Z., Wei, D., Shih, Y., Zhang, C., Zisserman, A., Scholkopf, B., Freeman, W.T. ((2014) ). Seeing the arrow of time. In: Proceedings of the IEEE Computer Society Conference on Computer Vision and Pattern Recognition, Columbus, OH, USA, 2014, pp. 2043–2050. https://doi.org/10.1109/CVPR.2014.262. |
21 | Saeed, W., Omlin, C. ((2021) ). Explainable AI (XAI): a systematic meta-survey of current challenges and future opportunities. Knowledge-Based Systems, 263: , 110273. https://doi.org/10.1016/j.knosys.2023.110273. |
22 | van der Walt, S., Schönberger, J.L., Nunez-Iglesias, J., Boulogne, F., Warner, J.D., Yager, N., Gouillart, E., Yu, T. ((2014) ). scikit-image: image processing in Python. PeerJ, 2: , e453. https://doi.org/10.7717/peerj.453. |
23 | Wong, L. (2016). Causalinference. https://causalinferenceinpython.org/. |
24 | Xin, Y., Tagasovska, N., Perez-Cruz, F., Raubal, M. ((2022) ). Vision paper: causal inference for interpretable and robust machine learning in mobility analysis. In: SIGSPATIAL’22: Proceedings of the 30th International Conference on Advances in Geographic Information Systems. Association for Computing Machinery, New York, NY, USA. https://doi.org/10.1145/3557915.3561473. |
25 | Zeiler, M.D., Fergus, R. ((2014) ). Visualizing and understanding convolutional networks. In: Fleet, D., Pajdla, T., Schiele, B., Tuytelaars, T. (Eds.), Computer Vision – ECCV 2014, Lecture Notes in Computer Science, Vol. 8689: . Springer, Cham, pp. 818–833. https://doi.org/10.1007/978-3-319-10590-1_53. |
26 | Zheng, X., Aragam, B., Ravikumar, P., Xing, E.P. ((2018) ). Dags with NO TEARS: continuous optimization for structure learning. In: NIPS’18: Proceedings of the 32nd International Conference on Neural Information Processing Systems, 2018 December, pp. 9472–9483. |


