
Deep Learning Model for Cell Nuclei Segmentation and Lymphocyte Identification in Whole Slide Histology Images
Abstract
Anti-cancer immunotherapy dramatically changes the clinical management of many types of tumours towards less harmful and more personalized treatment plans than conventional chemotherapy or radiation. Precise analysis of the spatial distribution of immune cells in the tumourous tissue is necessary to select patients that would best respond to the treatment. Here, we introduce a deep learning-based workflow for cell nuclei segmentation and subsequent immune cell identification in routine diagnostic images. We applied our workflow on a set of hematoxylin and eosin (H&E) stained breast cancer and colorectal cancer tissue images to detect tumour-infiltrating lymphocytes. Firstly, to segment all nuclei in the tissue, we applied the multiple-image input layer architecture (Micro-Net, Dice coefficient (DC)
1Introduction
A host-tumour immune conflict is a well-known process happening during the tumourigenesis. It is now clear that tumours aim to escape host immune responses by a variety of biological mechanisms (Beatty and Gladney, 2015; Zappasodi et al., 2018; Allard et al., 2018). Thus the importance of tumour-infiltrating lymphocytes (TILs) in pathology diagnosis, prognosis, and treatment increases. Quantification of the immune infiltrate along tumour margins in the tumour microenvironment has gathered researchers’ attention as a reliable prognostic measure for various cancer types (Basavanhally et al., 2010; Galon et al., 2012; Huh et al., 2012; Rasmusson et al., 2020). With the emergence of whole slide imaging (WSI) and recent Federal Drug Administration’s (FDA) approval for WSI usage in clinical practice, various techniques have been proposed to detect lymphocytes in digital pathology images focusing on the algorithms based on colour, texture, and shape feature extraction, morphological operations, region growing, and image classification.
Recent works. In general, prior studies were limited to lymphocyte detection and therefore relied on unsupervised approaches such as in Basavanhally et al. (2010), where lymphocytes were automatically detected by a combination of region growing and Markov random field algorithms. Before detection, applying tissue epithelium-stroma classification reduced the noise irrelevant for the lymphocyte nuclei detection by 18 texture features (Kuse et al., 2010).
As opposed to individual nuclei detection, models proposed in Turkki et al. (2016) and Saltz et al. (2018) have been trained to identify TIL-enriched areas rather than stand-alone lymphocytes. In a study by Saltz et al. (2018), authors have developed a convolutional neural network (CNN) classifier capable of identifying TIL-enriched areas in WSI slides from TCGA (The Cancer Genome Atlas) database. Similarly, in Turkki et al. (2016), lymphocyte-rich areas were identified by training an SVM classifier on a set of features extracted by the VGG-F neural network from CD45 IHC-guided superpixel-level annotations in digitized H&E specimen.
Such a high-level tissue segmentation approach has been widely used for cancer tissue segmentation tasks, such as stroma-epithelium tissue classification (Morkunas et al., 2018). However, lymphocyte infiltration quantification accuracy would benefit from a more granular level analysis using object segmentation models. Convolutional encoder-decoder based model architectures (convolutional autoencoders CAEs) have been established as an efficient method for medical imaging tasks. U-Net autoencoder model, proposed in Ronneberger et al. (2015), has become a golden standard model for medical areas ranging from cell nuclei segmentation to tissue analysis in computed tomography (CT) scans (Ma et al., 2019). The deep, semantic feature maps from the U-Net decoder are combined with shallow, low-level feature maps from the encoder part of the model via skip connections, thus maintaining the fine-grained features of the input image. This renders U-Net applicable in medical image segmentation, where precise detail recreation is of utmost importance. Specifically for lymphocyte detection, approaches utilizing fully convolutional neural networks on the digital H&E slides were published by Chen and Srinivas (2016) and Linder et al. (2019). Both approaches investigate convolutional autoencoders using histology sample patches with annotated lymphocyte nuclei. Detection and classification, but not segmentation of nuclei in H&E images, were done using spatially constrained CNN in Sirinukunwattana et al. (2016). Notably, the classification into four cell types (epithelial, inflammatory, fibroblast, and miscellaneous) was performed on patches centred on nuclei considering their local neighbourhood. A more recent adaptation – the Micro-Net model – incorporates an additional input image downsampling layer that circumvents the max-pooling process, thus maintaining the input features ignored by the max-pooling layer. This way, more detailed contextual information is passed into the output layer, enabling better segmentation of adjacent cell nuclei (Raza et al., 2019).
The Hover-Net model published in Graham et al. (2019) enables simultaneous cell nuclei segmentation and classification by three dedicated branches of the model – segmenting, separating, and classifying. Hover-Net was applied to two datasets and achieved 0.573 and 0.631 classification f-score. In Janowczyk and Madabhushi (2016), AlexNet was employed to identify centres of lymphocyte nuclei. The network was trained on cropped lymphocyte nuclei as a positive class, and the negative class was sampled from the most distant regions with respect to the annotated ground truth. The trained network produces the posterior class membership probabilities for every pixel in the test image; subsequently, potential centres of lymphocyte nuclei are identified by disk kernel convolution and thresholding. In Alom et al. (2019), the same dataset was utilized to evaluate different advanced neural networks for a variety of digital pathology tasks, including lymphocyte detection. The authors proposed a densely connected recurrent convolution network (DCRCNN) to directly regress the density surface with peaks corresponding to lymphocyte centres. When compared to AlexNet, the DCRCNN improves the f-score by 1%, yet it is worth mentioning that both (Janowczyk and Madabhushi, 2016; Alom et al., 2019) do not demonstrate method generalization – in the respective studies, the same dataset was used for training and testing.
Our study focuses on the customization of cell segmentation autoencoder architecture and aims to investigate a two-step cell segmentation and subsequent lymphocyte classification workflow using digital histology images of H&E stained tumour tissues. Robust separation of clumped cell nuclei is a common challenge in whole slide image analysis (Guo et al., 2018). To tackle this nuclei segmentation challenge, our cell nuclei segmentation model renders an additional active contour layer, which increases the segmentation efficiency of adjacent cell nuclei. Apart from overlapping nuclei, image magnification is another critical factor for nuclei segmentation models. Publicly available annotated nuclei datasets contain histological samples scanned at
The paper is organized as follows. In Section 2.1, we describe the datasets used in the study. In Section 2.2, we introduce the segmentation method based on autoencoder neural network architecture, followed by the classification of segmented nuclei. In Section 3, we present experimental results comparing different cell nuclei segmentation as well as lymphocyte discrimination approaches. In particular, Section 3.3 covers the evaluation of our method on the publicly available annotated data set of breast cancer H&E images. We formulate conclusions in Section 4.
2Materials and Methods
2.1The Datasets
Images. In our study, we used 4 whole-slide histology sample images prepared with H&E staining (2 WSI slides from breast cancer patients and 2 WSIs from colorectal cancer). These slides were produced in the National Center of Pathology, Lithuania (NCP), and digitized with the Aperio ScanScope XT Slide Scanner at
1 WSI slide was obtained from The Cancer Genome Atlas database, tile ID: TCGA_AN_A0AM (Grossman et al., 2016), and used for both segmentation and classification testing.
Two additional public datasets were used for classification testing purposes. The CRCHistoPhenotypes dataset (CRCHP) contains colorectal adenocarcinoma cell nuclei. 1143 nuclei are annotated as inflammatory (used for lymphocyte category in our experiments), and 1040 annotated as epithelial (used for other cell type category) (Sirinukunwattana et al., 2016). The breast cancer dataset (JAN) published by Janowczyk and Madabhushi (2016) consists of 100 images (
Table 1
Two datasets were used for segmentation and classification tasks. Segmentation experiments were performed on
| Segmentation set | Tumour type | Raw set | Final augmented set | Origin |
| BC | 192 | 3648 | NCP | |
| CRC | 82 | 1558 | NCP | |
| Training | total | 274 | 5206 | NCP |
| BC | 54 | 54 | NCP | |
| CRC | 16 | 16 | NCP | |
| Validation | total | 70 | 70 | NCP |
| BC | 96 | 96 | TCGA | |
| Testing | total | 96 | 96 | TCGA |
| Classification set | Nucleus type | Raw set | Final augmented set | Origin |
| lymphocyte nuclei | 11032 | 50950 | NCP | |
| other nuclei | 10922 | 55825 | NCP | |
| Training | total nuclei | 21954 | 106775 | NCP |
| lymphocyte nuclei | 2588 | 2588 | NCP | |
| other nuclei | 2751 | 2751 | NCP | |
| Validation | total nuclei | 5339 | 5339 | NCP |
| BC lymphocytes | 903 | 903 | TCGA | |
| CRC lymphocytes | 1143 | 1143 | CRCHP | |
| total lymphocytes | 2046 | 2046 | ||
| BC other | 1195 | 1195 | TCGA | |
| CRC other | 1040 | 1040 | CRCHP | |
| total other | 2235 | 2235 | ||
| Testing I | total nuclei | 4281 | 4281 | |
| BC lymphocytes | 2949 | 2949 | JAN | |
| BC other | 1921 | 1921 | JAN | |
| Testing II | total nuclei | 4870 | 4870 | JAN |
Segmentation dataset. To train and validate the segmentation model, we randomly selected 344 tiles of
Table 2
Image augmentation techniques and parameters used for training dataset expansion.
| Augmentation | Parameters |
| Transposition, rotation axis flipping | Perpendicular rotation angles |
| CLAHE (Zuiderveld, 1994) | Cliplimit = 2.0, tilegridsize = (8, 8) |
| Brightness adjustment | HSV colourspace, hue layer increased by 30 |
| RGB augmentation | Random pixel value adjustments up to 0.1 |
| RGB2HED colour adjustments (Ruifrok and Johnston, 2001) | Colour values adjusted within range
|
The segmentation dataset is summarized in Table 1, and the techniques used to augment training patches are summarized in Table 2.
Fig. 1
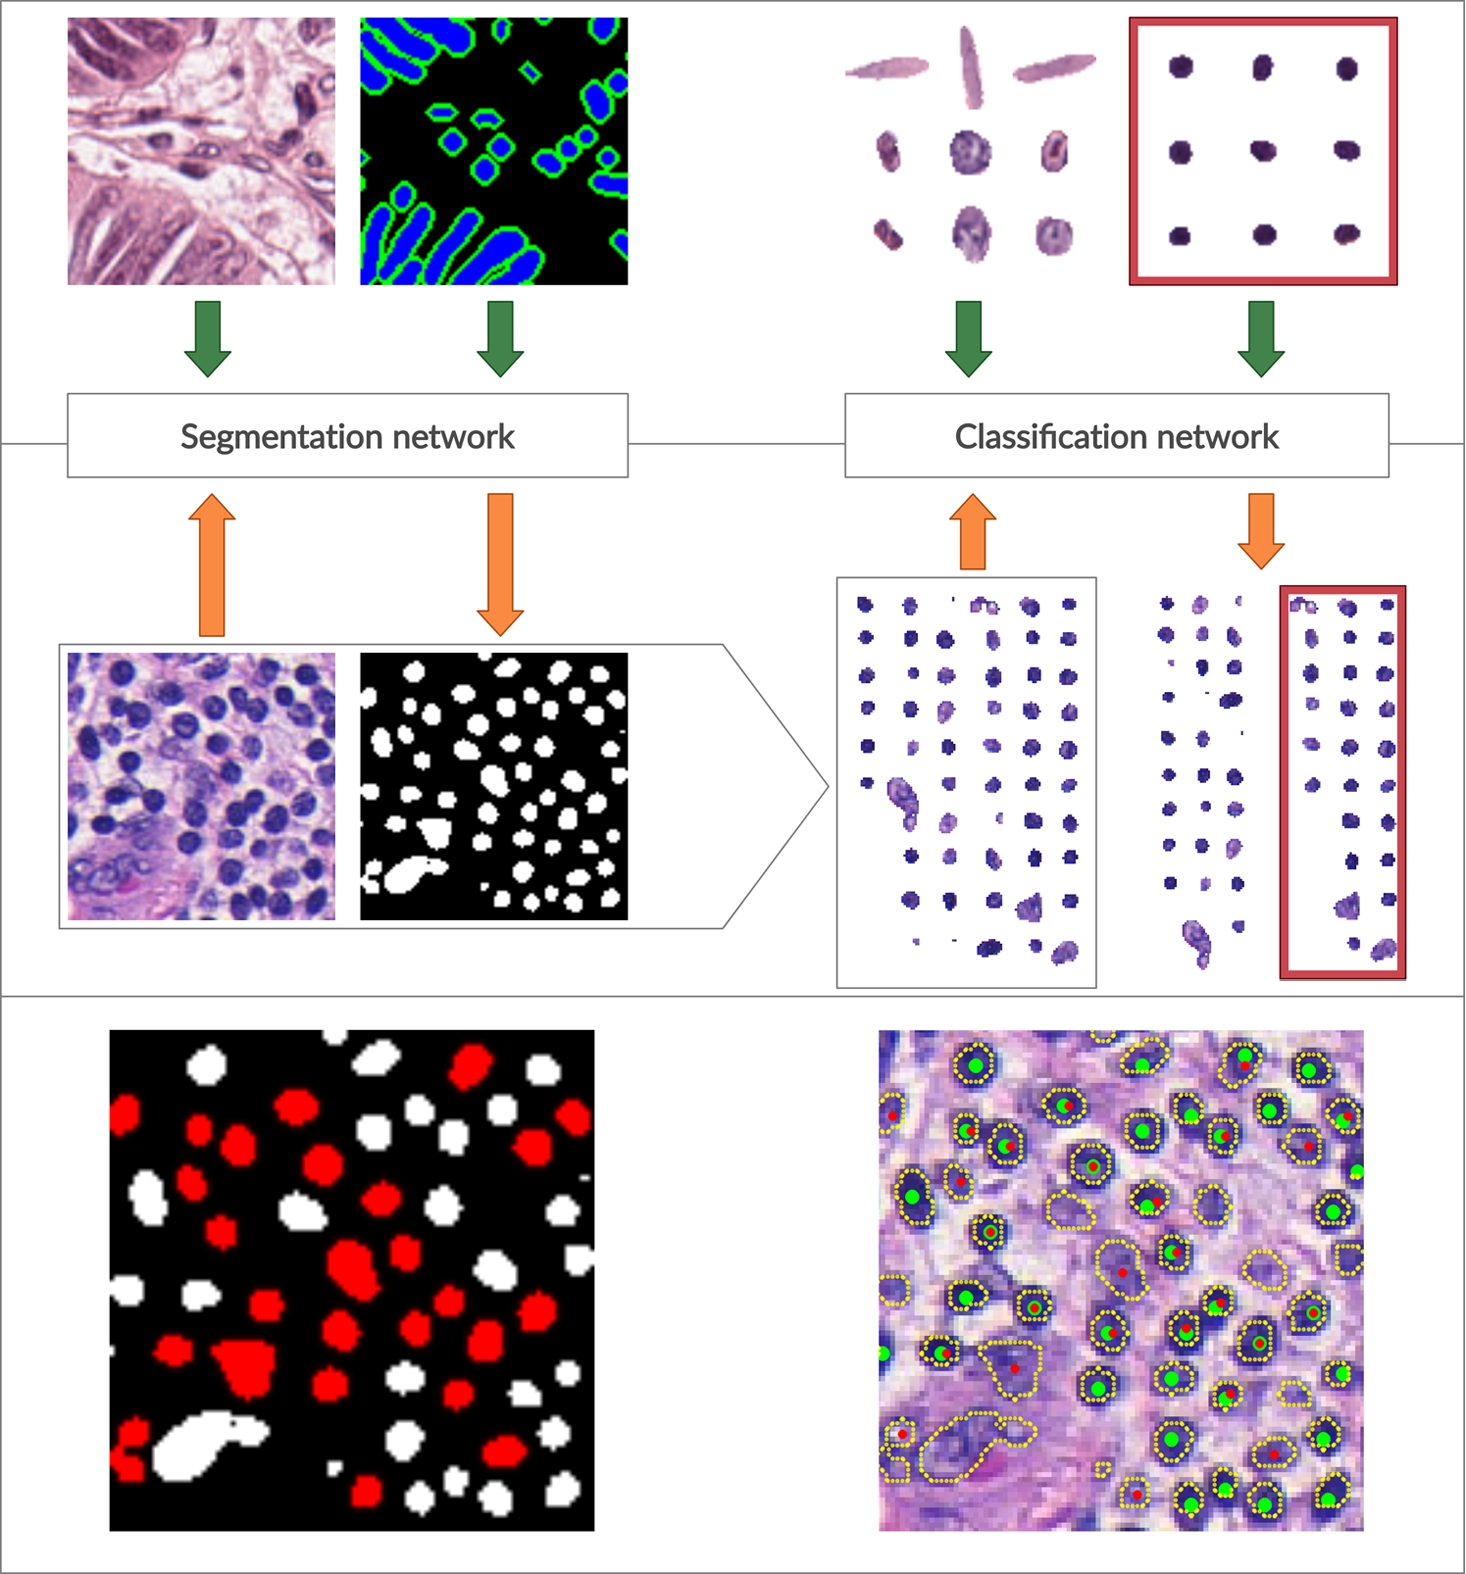
Overall schema of the proposed workflow. On top, a training phase for both segmentation and classification models is shown. The segmentation network is trained on original image patches and manually annotated ground truth images. The classification model is trained on cropped nuclei to discriminate lymphocytes (in the red box) from other nuclei. In the middle, a testing phase is shown. The trained segmentation model accepts new images and produces segmentation masks (for clarity, the active contour layer in the resulting segmentation mask is not shown). Resulting segmentation masks are used to crop out detected cell nuclei that are fed into the classifier model and sorted into lymphocytes and non-lymphocyte nuclei. In the bottom panel, on the left, we have representative segmentation results (lymphocyte nuclei are coloured in red for clarity), and on the right, we have an original image with detected nuclei contours outlined and detected lymphocyte nuclei depicted with red dots. Green dots indicate lymphocyte ground truth.
Classification dataset. To train and validate the classification models, we generated a dataset from the same image patches used to train the segmentation model. Particularly, manually generated segmentation masks were used to crop-out all types of cell nuclei from raw images. Each extracted nucleus was centred in a blank
2.2The Proposed Method
The overall schema of the proposed workflow is summarized in Fig. 1.
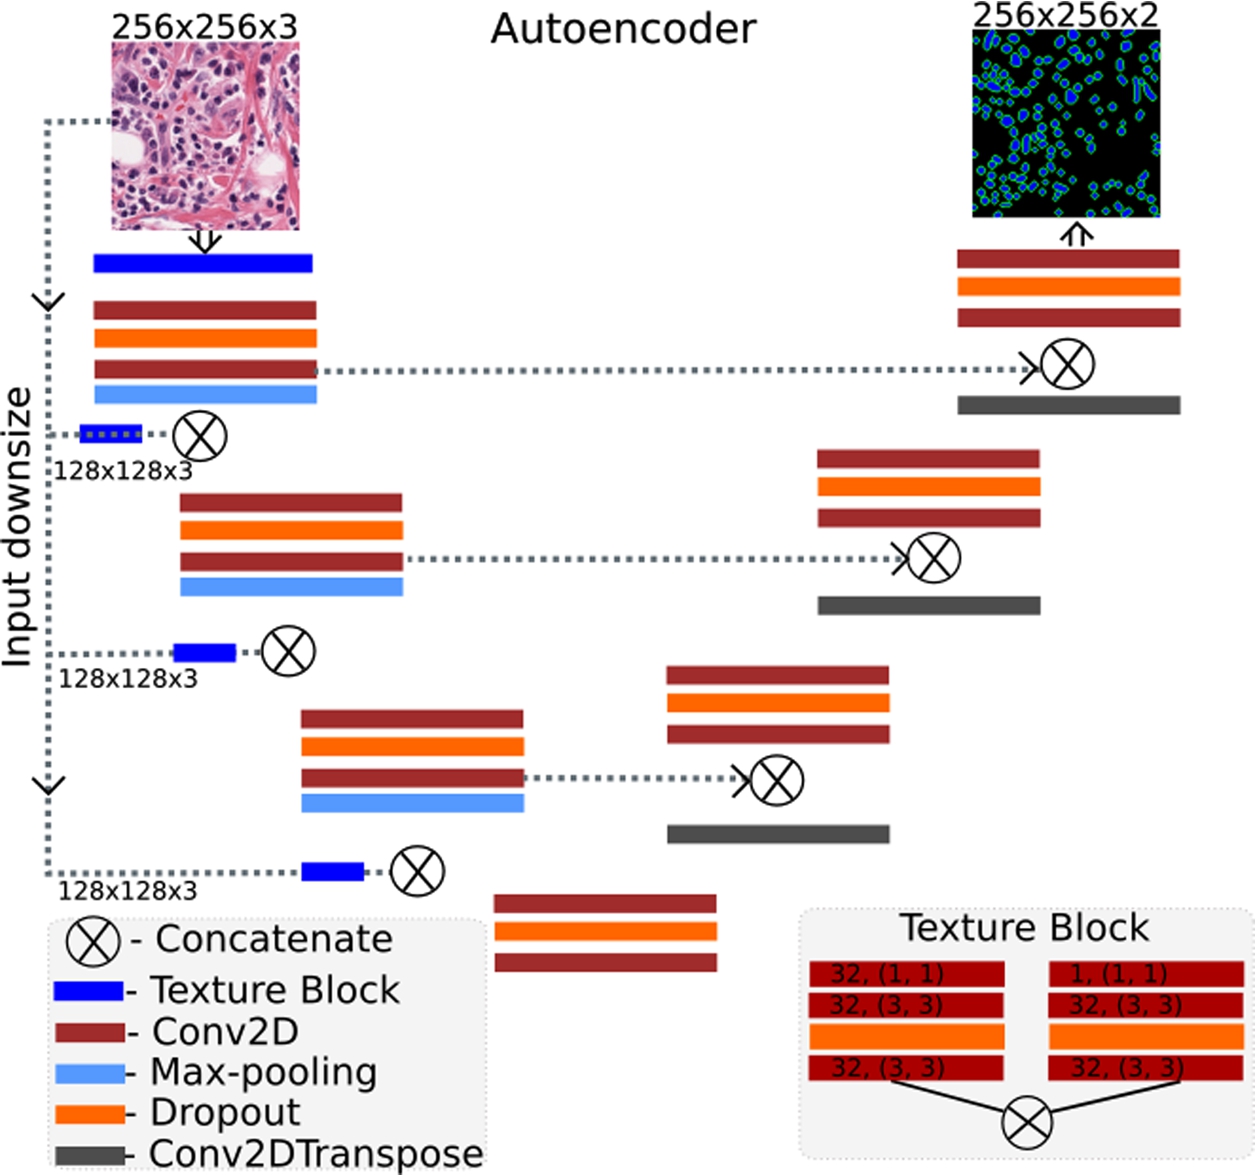
Fig. 2
The architecture of the proposed deep learning model.
2.2.1Modified Micro-Net Model
The autoencoder architecture for nuclei segmentation is shown in Fig. 2. The model consists of 3 encoder and 3 decoder blocks consisting of 2 convolution layers (
We used elu activation after each convolution layer and sigmoid activation for the output layer. Adam optimizer was used with initial learning rate
Fig. 3
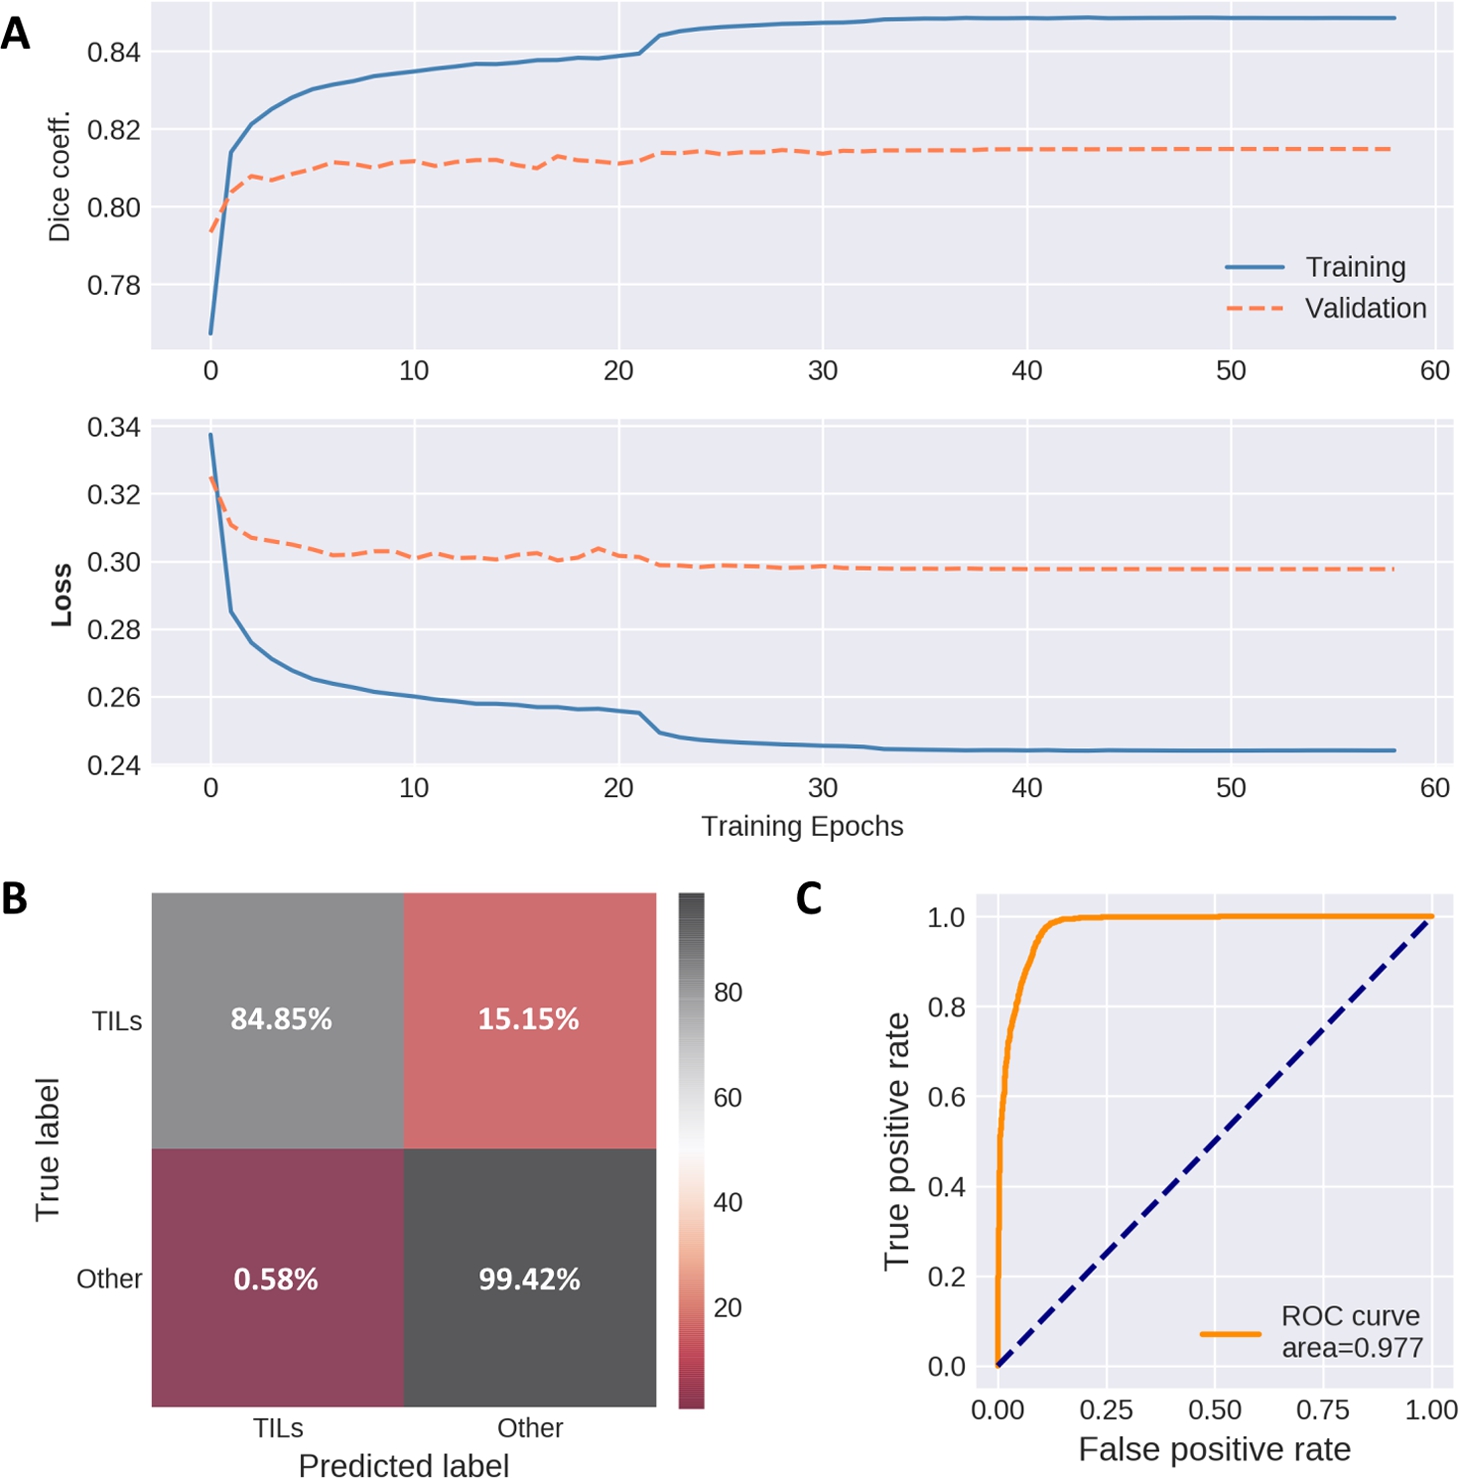
The performance metrics of segmentation and classifier models. A: training and validation metrics (top-Dice coefficient, below-loss values per epoch) of segmentation autoencoder, B: confusion matrix depicting cell nuclei classifier performance on the testing set (true positive lymphocyte predictions and true negatives marked in grey, false predictions – in red), C: ROC curve obtained from nuclei classifier testing data.
Model converged after 36 epochs (see Fig. 3A) using batch size of 1 (input image dimensions:
(1)
(2)
(3)
2.2.2Multilayer Perceptron
The multilayer perceptron model was employed to solve the binary classification problem of lymphocyte identification. Our experiment’s model consists of three dense layers (number of nodes: 4096, 2048, 1024), with softmax as the output layer activation function. For each layer, we used relu activation, followed by batch normalization. The dropout layer (dropout rate 0.4) was used in the middle layer instead of batch normalization to avoid model overfitting. We used Adam optimizer with initial learning rate
3Results
3.1Nuclei Segmentation
3.1.1Hyperparameter Tuning
The optimal model architecture was experimentally evaluated using a hyperparameter grid search. To test segmentation robustness, we evaluated both pixel-level and object-level metrics. The dice coefficient was used to track pixel-level segmentation performance, while object-level segmentation quality was evaluated by calculating intersection over union (IoU). We treated the predicted nuclei as true positive if at least 50% of the predicted nuclei area overlapped with the ground truth nuclei mask. In order to prevent multiple predicted objects mapping to the same ground truth nucleus, ground truth nucleus mask could only be mapped to a single predicted object. Results of hyperparameter tuning are provided in Table 3. Hyperparameter space was investigated by changing dropout rates, convolution filters per network layer, and activation functions. Due to multiple image down-sampling and concatenation operations in CNN architecture, models with parameter size higher than 500 000 have exceeded memory limitations. Our experiments indicate that expansion of model layer width (tested kernel sizes 16, 32, 48) did not dramatically affect the model prediction metrics – which suggests that texture block component may ensure consistent feature extraction in a wide range of model width.
Table 3
Performance metrics of convolutional autoencoders (CAE) used for the hyperparameter grid search for nuclei segmentation. Dice coefficients (mean Dice coefficient ± standard deviation). Mean and standard deviation values were calculated from stand-alone dice coefficients for each tile from the testing set. DO – drop out rate, BN – batch normalization.
| Act func | Output act func | Kernel size | DO | BN | Dice coefficient | Accuracy | Precision | Recall | f-score |
| U-Net | |||||||||
| elu | sigmoid | 64 | 0.2 | − |
|
|
|
|
|
| Micro-Net model | |||||||||
| tanh | sigmoid | 64 | − | − |
|
|
|
|
|
| Our model | |||||||||
| elu | sigmoid | 16 | 0.2 | − |
|
|
|
|
|
| elu | sigmoid | 32 | 0.2 | − |
|
|
|
|
|
| elu | sigmoid | 48 | 0.2 | − |
|
|
|
|
|
| elu | sigmoid | 16 | 0.3 | − |
|
|
|
|
|
| elu | sigmoid | 32 | 0.3 | − |
|
|
|
|
|
| elu | sigmoid | 48 | 0.3 | − |
|
|
|
|
|
| elu | sigmoid | 32 | − | + |
|
|
|
|
|
| relu | sigmoid | 32 | − | + |
|
|
|
|
|
| elu | softmax | 32 | − | + |
|
|
|
|
|
| relu | softmax | 32 | − | + |
|
|
|
|
|
3.1.2Model Performance Speed
Instead of basing our optimal model selection rationale solely on the Dice coefficient and object-level testing metrics, we evaluated the gridsearch models based on its loading and image prediction time relative to the original Micro-Net model. Since no significant changes were observed between dropout rates, we chose a custom model of a 0.2 dropout rate, elu activation function, and sigmoid activation function with differing layer widths of 16, 32, and 48 kernels. The testing results provided in Table 4 indicate that the lowest relative image prediction and model loading time was observed for segmentation autoencoder consisting of 32 convolutional kernels per layer, 0.2 dropout rate using elu activation function and sigmoid activation function for output layer with total parameter size lower than 280.000. In comparison to U-Net autoencoder (>1.9 M parameters), which has reached
Table 4
A comparison table of autoencoder parameter size and performance speed. Model loading and prediction times were obtained relative to the original Micro-Net model. The best performing model is highlighted in bold.
| Model | Parameters | Relative loading time | Relative prediction time |
| Micro-Net | 73 467 842 | 1 | 1 |
| Custom-16 | 131 746 | 0.212 | 0.314 |
| Custom-32 | 279 506 | 0.212 | 0.288 |
| Custom-48 | 507 138 | 0.268 | 0.359 |
3.1.3Active Contour Layer
To evaluate the impact of the active contour layer on nuclei separation, we trained convolutional autoencoder using single-layered nuclei masks and compared the results with an identical model trained on two-layered annotations. During this experiment, we used the best-scoring model architecture from the hyperparameter search experiment. Nuclei segmentation using masks supplemented with the active contour layer has outperformed the model with single-layered masks both on pixel-level and object-level measurements, as shown in Table 5. Active-contour increased object segmentation accuracy and f-score by 1 percent (
Table 5
The active contour layer effect on nuclei segmentation autoencoder performance. Pixel-level Dice coefficients (mean Dice coefficient ± standard deviation) were obtained from a testing set consisting of 96
| Mask layers | Dice coefficient | Accuracy | Precision | Recall | f-score |
| 2-layered |
|
|
|
|
|
| 1-layered |
|
|
|
|
|
3.2Nuclei Classification
3.2.1Hyper Parameter Tuning and Model Comparison
The cell classification problem was approached with several different statistical models. Random Forest was chosen as a baseline machine learning algorithm. We used Python implementation of a random forest classifier from the sklearn machine learning library (Feurer et al., 2015) (using the Gini impurity criterion as split quality measurement and 10 estimators). Random forest classifier was trained on linearized nuclei images (
Table 6
The hyperparameter grid search results for cell nuclei classifier (mean ± standard deviation). The model performance was evaluated on the testing set. Mean and standard deviation values were obtained by running each experiment 5 times.
| Models | Accuracy | Precision | Recall | f-score |
| Random forest |
|
|
|
|
| Multilayer perceptron | ||||
|
|
|
|
|
|
|
|
|
|
|
|
| Convolutional neural network | ||||
| Kernels per layer: 16 |
|
|
|
|
| Kernels per layer: 32 |
|
|
|
|
The confusion matrix for our cell classification model demonstrates that out of 2046 labelled lymphocytes, 310 were falsely misclassified as other cell types, while 13 false-positive observations were registered out of 2235 nuclei labelled as other cell types as shown in Fig. 3B. Receiver-operating curve (ROC) shown in Fig. 3C indicates the low false-positive rate of our lymphocyte classifier.
Of note, the proposed two-step lymphocyte detection model can potentially be adapted to detect more cell types by replacing existing lymphocyte classifier with a model trained on several classes.
3.3Workflow Evaluation
Fig. 4
Exemplary 5 testing images from breast cancer lymphocyte dataset (Janowczyk and Madabhushi, 2016) with corresponding lymphocyte identification model outputs. From left to right: 1st column- original testing image from the lymphocyte dataset. 2nd column: nuclei segmentation masks predicted by autoencoder. 3rd column: Expert pathologist’s annotation supplied in the dataset. 4th column: lymphocyte classifier result (if the nucleus was predicted as a lymphocyte, its centre was labelled with a green dot). 5th column: lymphocyte classifier result after Reinhard stain normalization.
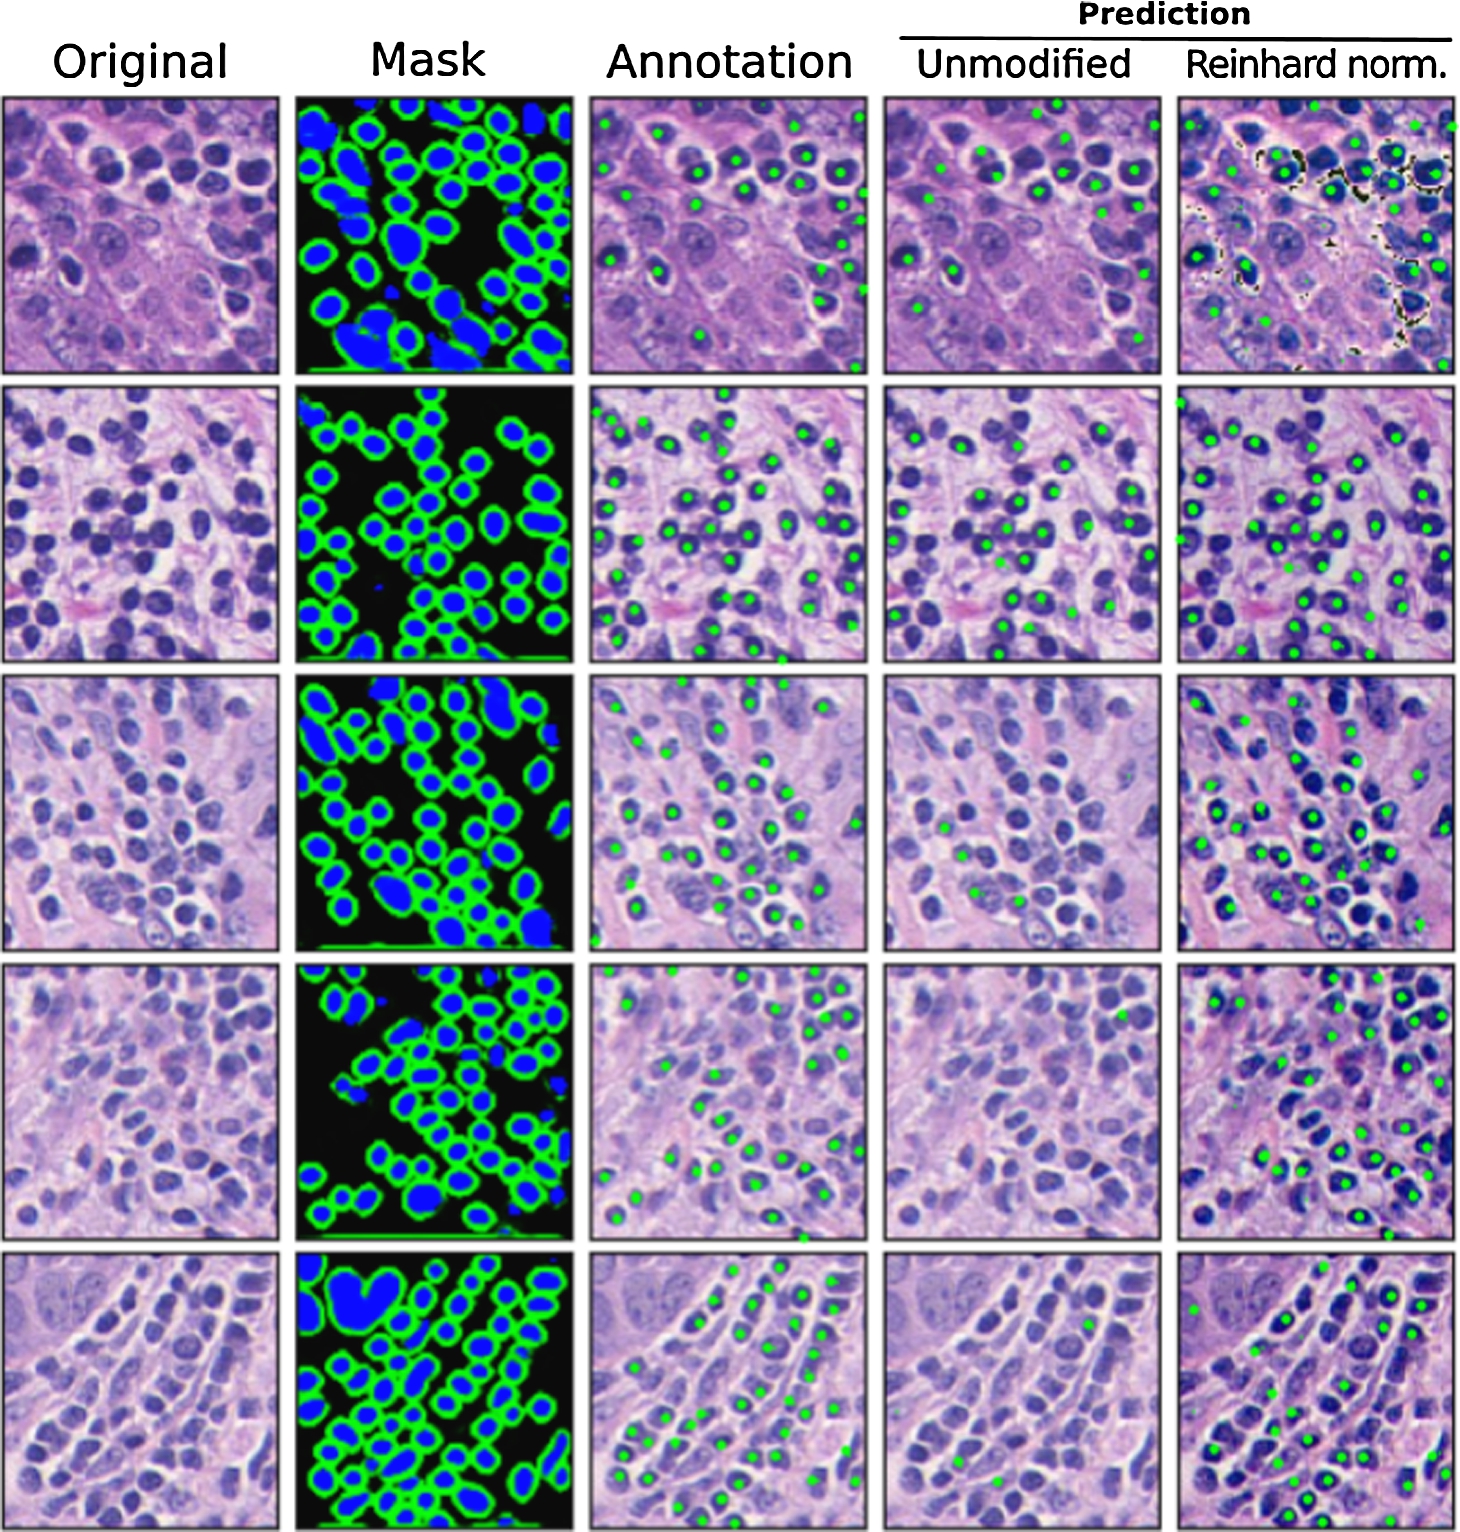
The proposed lymphocyte identification workflow has been tested on the lymphocyte dataset published by Janowczyk and Madabhushi (2016).22 The dataset is composed of 100 breast cancer images stained with hematoxylin and eosin and digitized using
The first analysis results – nuclei segmentation – are shown in the second column of Fig. 4. Nuclei segmentation masks generated by autoencoder demonstrate consistent cell nuclei detection efficiency regardless of image staining intensity. This can be explained by two factors. Due to robust image colour augmentation during autoencoder training, the CAE model learned to generalize the input image by texture, rather than colour. Secondly, our modified Micro-Net model architecture incorporates texture convolutional blocks shown in Fig. 2, which facilitate relevant feature extraction for the autoencoder.
The confusion matrix in Fig. 5A shows a low false-positive lymphocyte misclassification rate. However, the high false-negative rate suggests that the lymphocyte classification model is sensitive to image stain intensity. This is well reflected in Fig. 4 Unmodified image column, where lymphocyte detection efficiency conspicuously decreases as image staining intensity fades. This is not a surprising result, given that a multilayer perceptron was trained on lymphocytes cropped from histology samples prepared in a different laboratory, where image staining is more consistent across different histology samples. This result illustrates the main limitations of the lymphocyte classification model: cropped nuclei images lose image background information, which otherwise could be leveraged in differentiating nucleus stain intensity versus its background colour intensity.
3.3.1The Effect of Colour Normalization on Overall Model Performance
To address high staining variability between different histological samples, the lymphocyte testing dataset was normalized using the Reinhard stain normalization method. Reinhard algorithm adjusts the source image’s colour distribution to the colour distribution of the target image by equalizing the mean and standard deviation pixel values in each channel (Reinhard et al., 2001).
(4)
(5)
(6)
Fig. 5
Testing metrics for breast cancer lymphocyte dataset. A: confusion matrix for testing images with original sample staining; B: confusion matrix for testing images with Reinhard stain normalization applied on image stain.
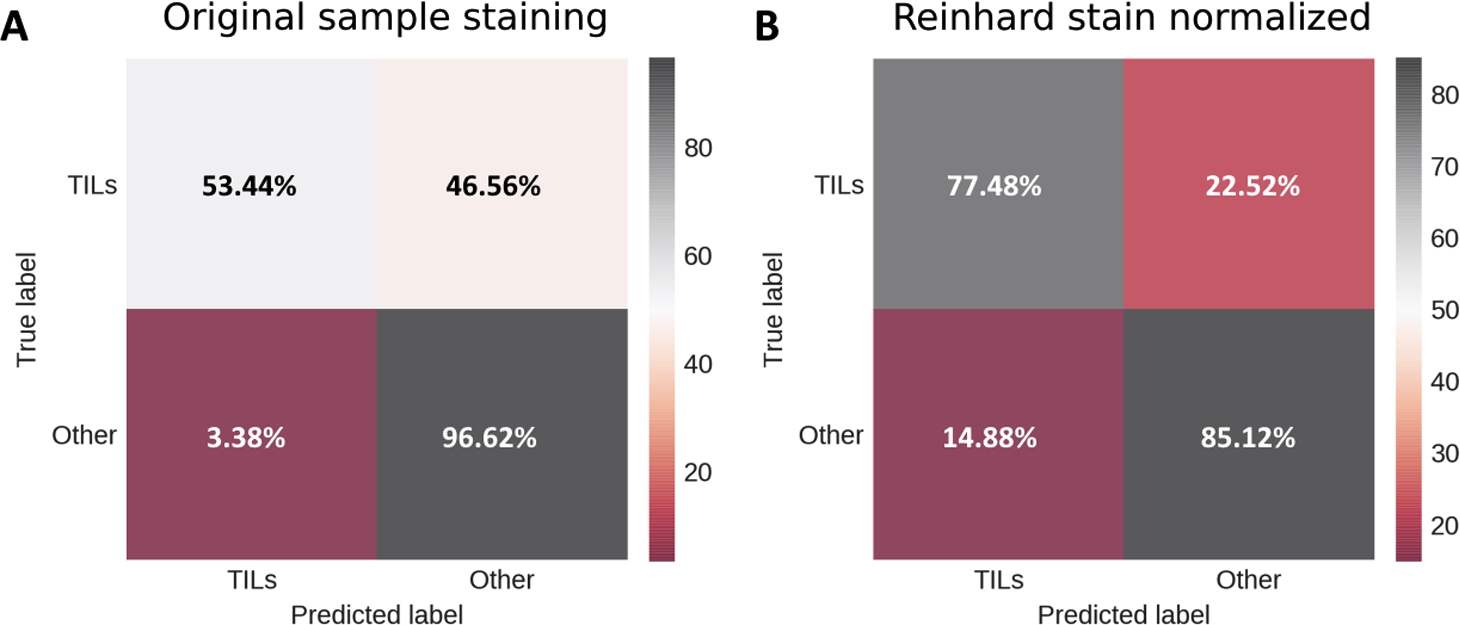
Stain normalization effect on cell lymphocyte detection was evaluated by comparing testing metrics before stain normalization and after Reinhard algorithm implementation. The confusion matrix in Fig. 5B indicates a lower false-negative rate for lymphocytes. Stain normalization has increased accuracy, precision, recall, and f-score values by approximately 10%, as shown in Table 7. These results indicate that the stain normalization step is an effective pre-processing part which can mitigate high staining intensity variance between histology samples. Observed improvement of lymphocyte classification accuracy by applied relatively simple Reinhard stain normalization suggests this part of our workflow can be further explored. Structure-preserving image normalization methods (Vahadane et al., 2016; Mahapatra et al., 2020) demonstrate promising results; also, certain medical image denoising techniques (Meiniel et al., 2018; Pham et al., 2020) could appear useful in future work.
Table 7
A comparison table depicting the effect of stain normalization on lymphocyte identification efficiency is presented. For comparison, we give here the results of the studies that utilized the same dataset. It is important to note that we only used this dataset to test our method, while studies referenced in the table used part of this dataset for training as well.
| Accuracy | Precision | Recall | f-score | |
| Proposed method, original staining | 0.71 | 0.76 | 0.75 | 0.70 |
| Proposed method, wt stain normalization | 0.81 | 0.80 | 0.81 | 0.80 |
| Janowczyk and Madabhushi (2016) | – | 0.89 | – | 0.90 |
| Alom et al. (2019) | 0.90 | – | – | 0.91 |
Both Janowczyk and Madabhushi (2016) and Alom et al. (2019) used the same dataset to train and evaluate their proposed models; therefore, to deal with overfitting, authors had to apply some sort of cross-validation. 5-fold cross-validation was used in Janowczyk and Madabhushi (2016), and Alom et al. (2019) reserved 10% of the dataset for testing purposes. In contrast, we used the whole dataset exclusively for the proposed model evaluation, thus completely eliminating the possibility of overfitting. Our result (f-score = 0.80) indicates good model generalization and comparable performance to both the above-mentioned methods.
4Conclusions
In this paper, we propose an end-to-end deep learning-based algorithm for cell nuclei segmentation and consecutive lymphocyte identification in H&E stained
• Our proposed autoencoder structure component – convolutional texture blocks – can achieve Dice nuclei segmentation score similar to that of the Micro-Net model (our model achieved 1% higher testing Dice coefficient).
• Additional active contour layer in nuclei annotation masks increases nuclei segmentation accuracy by 1.5%.
• Lymphocyte classification by multilayer perceptron network achieves
Nuclei segmentation autoencoder architecture investigated in this paper has lower model complexity compared to U-Net and Micro-Net models, which brings the advantage of lower computational resource usage. Our suggested pipeline shows good generalization properties, eliminates overfitting, and can be easily extended for multi-class nuclei identification by replacing the nuclei classification MLP model and re-employing the same pre-trained segmentation autoencoder.
Notes
1 Link to GitHub repository of the project: https://github.com/HELLze/Nuclei-segmentator-classifier.
2 Link to the dataset: http://www.andrewjanowczyk.com/use-case-4-lymphocyte-detection/.
Acknowledgements
The authors are thankful for the HPC resources provided by the IT APC at the Faculty of Mathematics and Informatics of Vilnius University Information Technology Research Centre.
References
1 | Abadi, M., Barham, P., Chen, J., Chen, Z., Davis, A., Dean, J., Devin, M., Ghemawat, S., Irving, G., Isard, M., Kudlur, M., Levenberg, J., Monga, R., Moore, S., Murray, D.G., Steiner, B., Tucker, P., Vasudevan, V., Warden, P., Wicke, M., Yu, Y., Zheng, X. ((2016) ). TensorFlow: a system for large-scale machine learning. In: Proceedings of the 12th USENIX Conference on Operating Systems Design and Implementation, pp. 265–283. |
2 | Allard, B., Aspeslagh, S., Garaud, S., Dupont, F., Solinas, C., Kok, M., Routy, B., Sotiriou, C., Stagg, J., Buisseret, L. ((2018) ). Immuno-oncology-101: overview of major concepts and translational perspectives. Seminars in Cancer Biology, 52: , 1–11. https://doi.org/10.1016/j.semcancer.2018.02.005. |
3 | Alom, Z.Md., Aspiras, T.H., Taha, T.M., Asari, V.K., Bowen, T.J., Billiter, D., Arkell, S. (2019). Advanced deep convolutional neural network approaches for digital pathology image analysis: a comprehensive evaluation with different use cases. CoRR. http://arxiv.org/abs/1904.09075. |
4 | Basavanhally, A.N., Ganesan, S., Agner, S., Monaco, J.P., Feldman, M.D., Tomaszewski, J.E., Bhanot, G., Madabhushi, A. (2010). Computerized image-based detection and grading of lymphocytic infiltration in HER2+ breast cancer histopathology. IEEE Transactions on Biomedical Engineering, 57(3). https://doi.org/10.1109/TBME.2009.2035305. |
5 | Beatty, G.L., Gladney, W.L. ((2015) ). Immune escape mechanisms as a guide for cancer immunotherapy. Clinical Cancer Research, 21: (4), 687–692. https://doi.org/10.1158/1078-0432.CCR-14-1860. |
6 | Bradski, G. (2000). The OpenCV Library. Dr. Dobb’s Journal of Software Tools. |
7 | Chen, J., Srinivas, C. (2016). Automatic lymphocyte detection in H&E images with deep neural networks. CoRR. http://arxiv.org/abs/1612.03217. |
8 | Cui, Y., Zhang, G., Liu, Z., Xiong, Z., Hu, J. ((2019) ). A deep learning algorithm for one-step contour aware nuclei segmentation of histopathology images. Medical & Biological Engineering & Computing, 57: , 2027–2043. https://doi.org/10.1007/s11517-019-02008-8. |
9 | Feurer, M., Klein, A., Eggensperger, K., Springenberg, J.T., Blum, M., Hutter, F. ((2015) ). Efficient and robust automated machine learning. In: Advances in Neural Information Processing Systems. https://doi.org/10.1007/978-3-030-05318-5_6. |
10 | Galon, J., Pagès, F., Marincola, F.M., Angell, H.K., Thurin, M., Lugli, A., Zlobec, I., Berger, A., Bifulco, C., Botti, G., Tatangelo, F., Britten, C.M., Kreiter, S., Chouchane, L., Delrio, P., Arndt, H., Asslaber, M., Maio, M., Masucci, G.V., Mihm, M., Vidal-Vanaclocha, F., Allison, J.P., Gnjatic, S., Hakansson, L., Huber, C., Singh-Jasuja, H., Ottensmeier, C., Zwierzina, H., Laghi, L., Grizzi, F., Ohashi, P.S., Shaw, P.A., Clarke, B.A., Wouters, B.G., Kawakami, Y., Hazama, S., Okuno, K., Wang, E., O’Donnell-Tormey, J., Lagorce, C., Pawelec, G., Nishimura, M.I., Hawkins, R., Lapointe, R., Lundqvist, A., Khleif, S.N., Ogino, S., Gibbs, P., Waring, P., Sato, N., Torigoe, T., Itoh, K., Patel, P.S., Shukla, S.N., Palmqvist, R., Nagtegaal, I.D., Wang, Y., D’Arrigo, C., Kopetz, S., Sinicrope, F.A., Trinchieri, G., Gajewski, T.F., Ascierto, P.A., Fox, B.A. ((2012) ). Cancer classification using the immunoscore: a worldwide task force. Journal of Translational Medicine, 10: , 205. https://doi.org/10.1186/1479-5876-10-205. |
11 | Graham, S., Vu, Q., Ahmed Raza, S.E., Azam, A., Tsang, Y., Kwak, J.T., Rajpoot, N. ((2019) ). Hover-Net: simultaneous segmentation and classification of nuclei in multi-tissue histology images. Medical Image Analysis, 58: , 101563. |
12 | Grossman, R.L., Heath, A.P., Ferretti, V., Varmus, H.E., Lowy, D.R., Kibbe, W.A., Staudt, L.M. ((2016) ). Toward a shared vision for cancer genomic data. New England Journal of Medicine, 375: (12), 1109–1112. https://doi.org/10.1056/nejmp1607591. |
13 | Guo, X., Yu, H., Rossetti, B., Teodoro, G., Brat, D., Kong, J. ((2018) ). Clumped nuclei segmentation with adjacent point match and local shape-based intensity analysis in fluorescence microscopy images. In: Proceedings of the Annual International Conference of the IEEE Engineering in Medicine and Biology Society, EMBS. https://doi.org/10.1109/EMBC.2018.8512961. |
14 | Huh, J.W., Lee, J.H., Kim, H.R. ((2012) ). Prognostic significance of tumor-infiltrating lymphocytes for patients with colorectal cancer. Archives of Surgery, 147: (4), 366–372. https://doi.org/10.1001/archsurg.2012.35. |
15 | Janowczyk, A., Madabhushi, A. ((2016) ). Deep learning for digital pathology image analysis: a comprehensive tutorial with selected use cases. Journal of Pathology Informatics, 7: , 29. https://doi.org/10.4103/2153-3539.186902. |
16 | Kingma, D.P., Ba, J. ((2014) ). Adam: a method for stochastic optimization. In: International Conference on Learning Representations. |
17 | Kuse, M., Sharma, T., Gupta, S. ((2010) ). A classification scheme for lymphocyte segmentation in H&E stained histology images. In: Recognizing Patterns in Signals, Speech, Images and Videos, ICPR 2010, Lecture Notes in Computer Science, Vol. 6388: . Springer, Berlin, Heidelberg. |
18 | Linder, N., Taylor, J.C., Colling, R., Pell, R., Alveyn, E., Joseph, J., Protheroe, A., Lundin, M., Lundin, J., Verrill, C. ((2019) ). Deep learning for detecting tumour-infiltrating lymphocytes in testicular germ cell tumours. Journal of Clinical Pathology, 72: (2), 157–164. https://doi.org/10.1136/jclinpath-2018-205328. |
19 | Ma, X., Hadjiiski, L., Wei, J., Chan, H.-P., Cha, K., Cohan, R., Caoili, E., Samala, R., Zhou, C., Lu, Y. ((2019) ). U-Net-based deep-learning bladder segmentation in CT urography. Medical Physics, 46: (4), 1752–1756. |
20 | Mahapatra, D., Bozorgtabar, B., Thiran, J.-P., Shao, L. ((2020) ). Structure preserving stain normalization of histopathology images using self-supervised semantic guidance. In: Martel, A.L. et al. (Eds.), Medical Image Computing and Computer Assisted Intervention – MICCAI 2020. MICCAI 2020, Lecture Notes in Computer Science, Vol. 12265: . Springer, Cham. https://doi-org-443.webvpn.fjmu.edu.cn/10.1007/978-3-030-59722-1_30. |
21 | Meiniel, W., Olivo-Marin, J., Angelini, E.D. ((2018) ). Denoising of microscopy images: a review of the state-of-the-art, and a new sparsity-based method. IEEE Transactions on Image Processing, 27: (8), 3842–3856. https://doi.org/10.1109/TIP.2018.2819821. |
22 | Morkunas, M., Treigys, P., Bernatavičiene, J., Laurinavičius, A., Korvel, G. ((2018) ). Machine learning based classification of colorectal cancer tumour tissue in whole-slide images. Informatica, 29: (1), 75–90. https://doi.org/10.15388/Informatica.2018.158. |
23 | Oliphant, T. ((2006) ). NumPy: A Guide to NumPy. Trelgol Publishing, USA. |
24 | Pham, C.T., Thao Tran, T.T., Gamard, G. ((2020) ). An efficient total variation minimization method for image restoration. Informatica, 31: (3), 539–560. https://doi.org/10.15388/20-INFOR407. |
25 | Rasmusson, A., Zilenaite, D., Nestarenkaite, A., Augulis, R., Laurinaviciene, A., Ostapenko, V., Poskus, T., Laurinavicius, A. ((2020) ). Immunogradient indicators for antitumor response assessment by automated tumor-stroma interface zone detection. The American Journal of Pathology, 190(6): , 1309–1322. https://doi.org/10.1016/j.ajpath.2020.01.018. |
26 | Raza, S.E.A., Cheung, L., Shaban, M., Graham, S., Epstein, D., Pelengaris, S., Khan, M., Rajpoot, N.M. ((2019) ). Micro-Net: a unified model for segmentation of various objects in microscopy images. Medical Image Analysis, 52: , 160–173. https://doi.org/10.1016/j.media.2018.12.003. |
27 | Reinhard, E., Ashikhmin, M., Shirley, P. ((2001) ). Color transfer between images. IEEE Computer Graphics and Applications, 21: (5), 34–41. https://doi.org/10.1109/38.946629. |
28 | Ronneberger, O., Fischer, P., Brox, T. ((2015) ). U-net: convolutional networks for biomedical image segmentation. In: Navab, N., Hornegger, J., Wells, W., Frangi, A. (Eds.), Medical Image Computing and Computer-Assisted Intervention – MICCAI 2015. MICCAI 2015, Lecture Notes in Computer Science, Vol. 9351: . Springer, Cham. https://doi.org/10.1007/978-3-319-24574-4_28. |
29 | Ruifrok, A.C., Johnston, D.A. ((2001) ). Quantification of histochemical staining by color deconvolution. Analytical and Quantitative Cytology and Histology, 23: (4), 291–299. |
30 | Saltz, J., Gupta, R., Hou, L., Kurc, T., Singh, P., Nguyen, V., Samaras, D., Shroyer, K.R., Zhao, T., Batiste, R., Van Arnam, J., Shmulevich, I., Rao, A.U.K., Lazar, A.J., Sharma, A., Thorsson, V. ((2018) ). Spatial organization and molecular correlation of tumor-infiltrating lymphocytes using deep learning on pathology images. Cell Reports, 23: (1), 181–193. https://doi.org/10.1016/j.celrep.2018.03.086. |
31 | Sirinukunwattana, K., Raza, S.E.A., Tsang, Y.W., Snead, D.R.J., Cree, I.A., Rajpoot, N.M. ((2016) ). Locality sensitive deep learning for detection and classification of nuclei in routine colon cancer histology images. IEEE Transactions on Medical Imaging, 35: (5), 1196–1206. https://doi.org/10.1109/TMI.2016.2525803. |
32 | Turkki, R., Linder, N., Kovanen, P., Pellinen, T., Lundin, J. ((2016) ). Antibody-supervised deep learning for quantification of tumor-infiltrating immune cells in hematoxylin and eosin stained breast cancer samples. Journal of Pathology Informatics, 7: , 38. https://doi.org/10.4103/2153-3539.189703. |
33 | Vahadane, A., Peng, T., Sethi, A., Albarqouni, S., Wang, L., Baust, M., Steiger, K., Schlitter, A.M., Esposito, I., Navab, N. ((2016) ). Structure-preserving color normalization and sparse stain separation for histological images. IEEE Transactions on Medical Imaging, 35: (8), 1962–1971. https://doi.org/10.1109/TMI.2016.2529665. |
34 | Zappasodi, R., Merghoub, T., Wolchok, J.D. ((2018) ). Emerging concepts for immune checkpoint blockade-based combination therapies. Cancer Cell, 33: (4), 581–598. https://doi.org/10.1016/j.ccell.2018.03.005. |
35 | Zuiderveld, K. ((1994) ). Contrast limited adaptive histogram equalization. In: Graphics Gems, pp. 474–485. https://doi.org/10.1016/b978-0-12-336156-1.50061-6. |


