
The Analysis of the Characteristics and Evolution of the Collaboration Network in Blockchain Domain
Abstract
Blockchain is a decentralized database, which can protect the safety of trade and avoid double payment. Due to the widespread attention of researchers, the studies of this field have increased sharply in recent years. It is meaningful to reveal the development level and trends based on this literature. This paper adopts bibliometric methods to study the collaboration characteristics from the levels of author, institution and country. Furthermore, several kinds of collaboration networks and their centrality analysis are also presented, which not only display the development level and collaboration degree but also the evolution of author collaboration modes in different phases.
1Introduction
The concept of Bitcoin was first proposed by Nakamoto (2008). As the core technology of Bitcoin transactions, blockchain has become a popular research topic in recent years. Blockchain is a new application of several key computer technologies such as the distributed data storage, peer-to-peer transmission, consensus mechanism and cryptographic hash algorithm. It can easily achieve the purpose of decentralization by integrating the above core techniques to remove third parties from transactions and the principle of cryptography is applied to string and protect transaction record, which reduces the reliance on the third parties during the transaction and completes a transaction in a more safe way by reducing the risk of information leakage (Dabbagh et al., 2019; Yu and Sheng, 2020).
The benefit and development potential of blockchain technology directly causes fruitful research outputs in this field. Especially in recent years, with the wide application of blockchain technology, investigations on blockchain which just focus on the cryptocurrency in the early stage begin to spread in various scientific fields like financial (Bouri et al., 2017; Huang et al., 2018), cloud computing service (Tosh et al., 2017; Liang et al., 2017), energy (Mengelkamp et al., 2018) and traffic (Yang et al., 2018; Kang et al., 2018). Facing a large number of studies, it is essential to apply scientific and systematic methods to summarize and analyse the development of this field.
Bibliometric is an accurate and systematic analysis method to explore the development trend and evaluate the research outputs of a specific scientific field with statistical and mathematical tools (Yu et al., 2020). It contains many aspects, such as collaboration analysis, subject category research, term analysis and citation analysis. The social network analysis (SNA) is considered as a quantitative method to study the dynamic evolution of a social network structure, the collaborative relationship among actors in the network and the characteristics of network metrics (Zhou et al., 2020). The combination of bibliometric analysis and SNA can provide a more comprehensive and in-depth understanding of a field.
There are several articles which use the bibliometric analysis methods to study numerous researches in the field of blockchain. Paulavičius et al. (2019) provided a comprehensive comparative analysis of the most popular blockchain platforms, and paid special attention to the development of consensus protocols. Dabbagh et al. (2019) found out the most popular investigation areas, authoritative journals, influential publications and fund organizations. In addition, they revealed some valuable insights that researchers have put their attention to blockchain rather than Bitcoin in recent years and publication numbers may continue to increase during the next year. These results provided a comprehensive guide to researchers, including not only the publication of research outcomes but also the reference of research direction. Hölbl et al. (2018) identified development status and trends of blockchain technology in the medical field. This paper chose just 33 studies for in-depth analysis, which provided potential research direction for future application of blockchain in medicine. They drew the conclusion that the application scope of blockchain in the medical field is relatively small, mainly concentrated in the data sharing, medical record and restricted access. Blockchain still has huge development potential in medical field such as drug prescription management. Articles mentioned above summarized and analysed the breadth and depth of the development of blockchain technology respectively. However, there is a lack of the SNA from collaboration perspective. There are fewer studies that use the bibliometric and SNA to discuss the development trends and collaboration network of the blockchain field. In addition to the basic bibliometric analysis, Firdaus et al. (2019) constructed the collaboration network from institution and country perspective. Their research provided a comprehensive assessment of research activities in the blockchain field. Merediz-Solà and Bariviera (2019) provided the first widespread bibliometric research of Bitcoin publications. They found out the top researchers, primary journals, keywords and prolific countries of this field. In addition, they also conducted co-occurrence analysis of keywords, journals in two main application areas of Bitcoin articles and articles with a high number of total citations. These results show the development status and trends of Bitcoin. However, these articles lack systematic and comprehensive scientific collaboration analysis in the field of blockchain, especially the collaboration characteristics and collaboration network analysis.
Scientific collaboration is playing an increasingly important role in conducting interdisciplinary research and outputting meaningful research results by integrating the knowledge of researchers with different research backgrounds (Yu et al., 2019). With the continuous development of science technology and electronic communication technology, inter-institution and international collaboration on the basis of author collaboration has become more and more common. Based on the status quo, scientific collaboration is widely used in various fields. Therefore, discovering the characteristics of collaboration, researching and analysing the mode and structure of collaboration network is beneficial for the comprehensive and in-depth understanding of a field (Yu et al., 2018), which is the main focus of this paper. This paper uses the bibliometric method to display the characteristics of collaboration in the field of blockchain from three levels (author, institution and country). SNA is applied to show the evolution of collaboration network and collaboration mode Çavuşoğlu and Türker (2014). As an important part of SNA, the centrality analysis is used to illustrate the characteristics of actors in the network from a micro perspective (Lara-Cabrera et al., 2014).
The outline of this article is below: Section 2 describes the process of data collection and data preprocessing. The collaboration characteristic in the blockchain domain is presented in Section 3. The analysis of author, institution and country collaboration networks based on the SNA are presented in Section 4. Section 5 is the discussion of this paper. Section 6 concludes this paper.
2Data Collection
The Web of Science (WoS) database is used as the data source of this article. The research of blockchain is closely related to the information technology. It means that conference databases are also important for our research. Therefore, all types of data are extracted from four databases of WoS Core Collection (SCI/SSCI/CPCI-S/CPCI-SSH). With reference to researches which have used the bibliometric method to study blockchain technology (Miau and Yang, 2018), this article identifies the following search term: Topic Search (TS) = (“blockchain*” OR “bitcoin” OR “ethereum” OR “cryptocurrenc*” OR “smart contract”).
There are 4455 papers from 2012 to 2019 extracted from the databases, including 111 papers without the information of author’s address. Because it is the basic information for bibliometrics and SNA, this paper deletes it for the future analysis. Finally, a total of 4344 papers from January 1, 2012 to November 22, 2019 in WoS database are selected for the future analysis, which contain 10671 authors, 99 countries and 3286 institutions. There are two types of data extracted from WoS, plain text and csv format respectively. The csv format’s data is converted in the Excel for the bibliometrics analysis. The plain text format’s data are imported in the Bib-excel (Persson et al., 2009) and Vos-viewer (Van Eck and Waltman, 2010) for the data preprocessing.
In the future analysis of collaboration characteristic and network, the time span is divided into three phases so that the development and evolution of the field of blockchain can be presented clearly. This paper merges the England, Scotland, Northern Ireland and Wales into UK in the future bibliometric and country’s collaboration network analysis. In the bibliometrics and SNA analysis of institution, this article defines that the branch campus of one university is the same institution. However, the subsidiary or branch company in different areas, cities and countries of one enterprise is defined as different institutions, which is considered as the collaboration of different institutions. Besides, there are plenty of authors belonging to several institutions, which is defined to the collaboration among different institutions and the contribution of every institution is equal.
3Collaboration Characteristic in the Blockchain Domain
This section focuses on the collaboration characteristic from author, institution and country levels.
3.1Lotka’s Law
Fig. 1
Lotka’s law distribution.
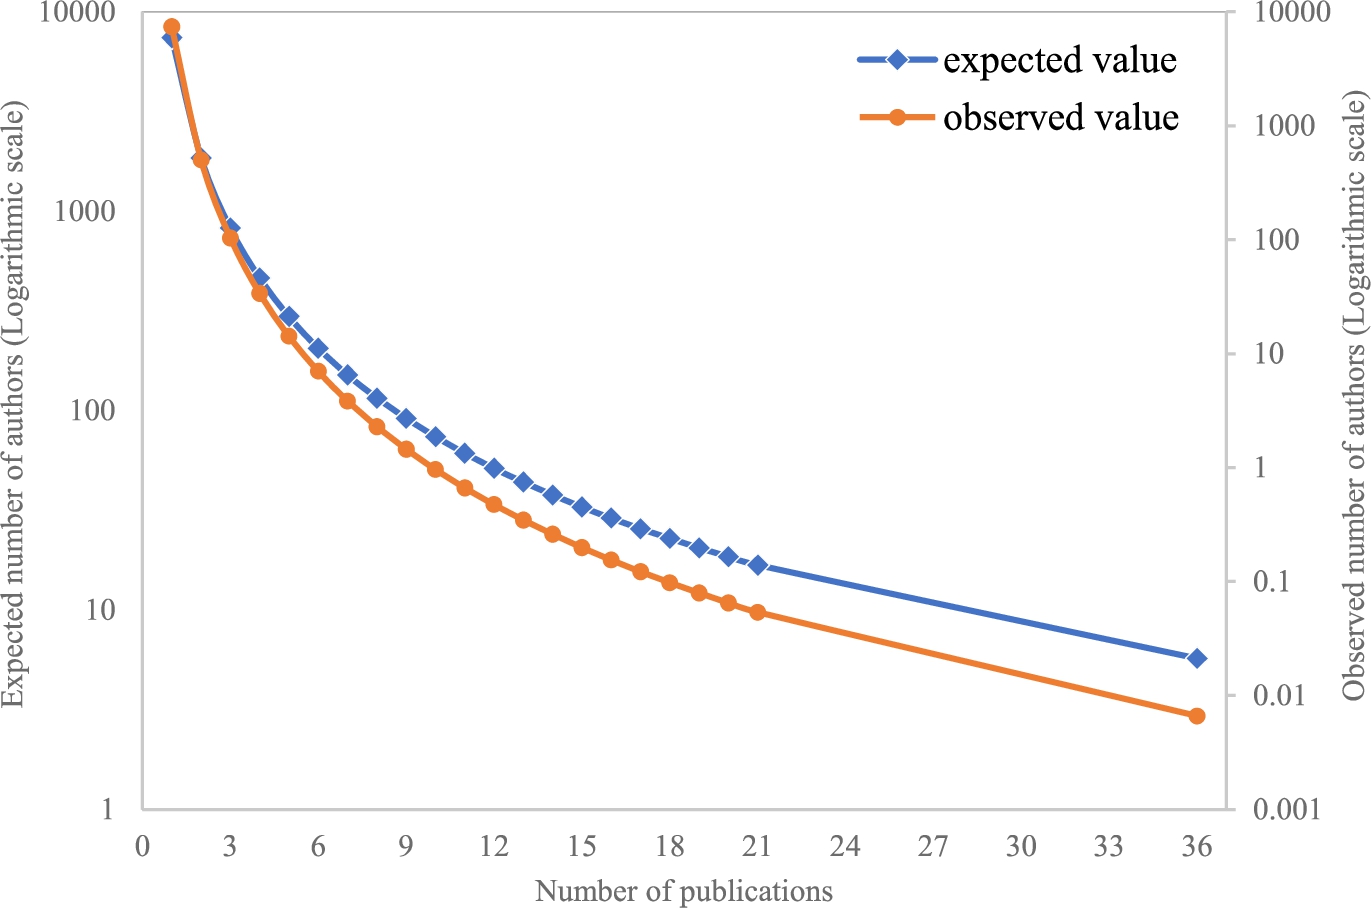
Lotka’s law (Lotka, 1926) displays the distribution relationship between author output and number of authors. It obeys a hyperbolic distribution (Dabi et al., 2016), which can be expressed by the formula:
The difference distribution between expected value and observed value is presented in Fig. 1. According to our data analysis, the number of authors who just publish one paper account for 75.62% of the total. However, the number of authors who have published at least 10 articles is only 0.61% of total. This phenomenon can be explained that the distribution of observed value is skewed to the right, which demonstrates that the publication numbers of prolific authors in this field are below than the expected level. In other words, this field is not yet a mature field and still in the stage of continuous development.
3.2Annual Collaboration Characteristics Analysis
In order to show the overall development degree of scientific literature and evaluate the level of collaboration from three levels in the blockchain field, this article exhibits the distribution of annual publication volume. Figure 2 displays the overall development trend based on the publication numbers (PN), total citation (TC) and author numbers (AN).
Fig. 2
The development trend of blockchain field.
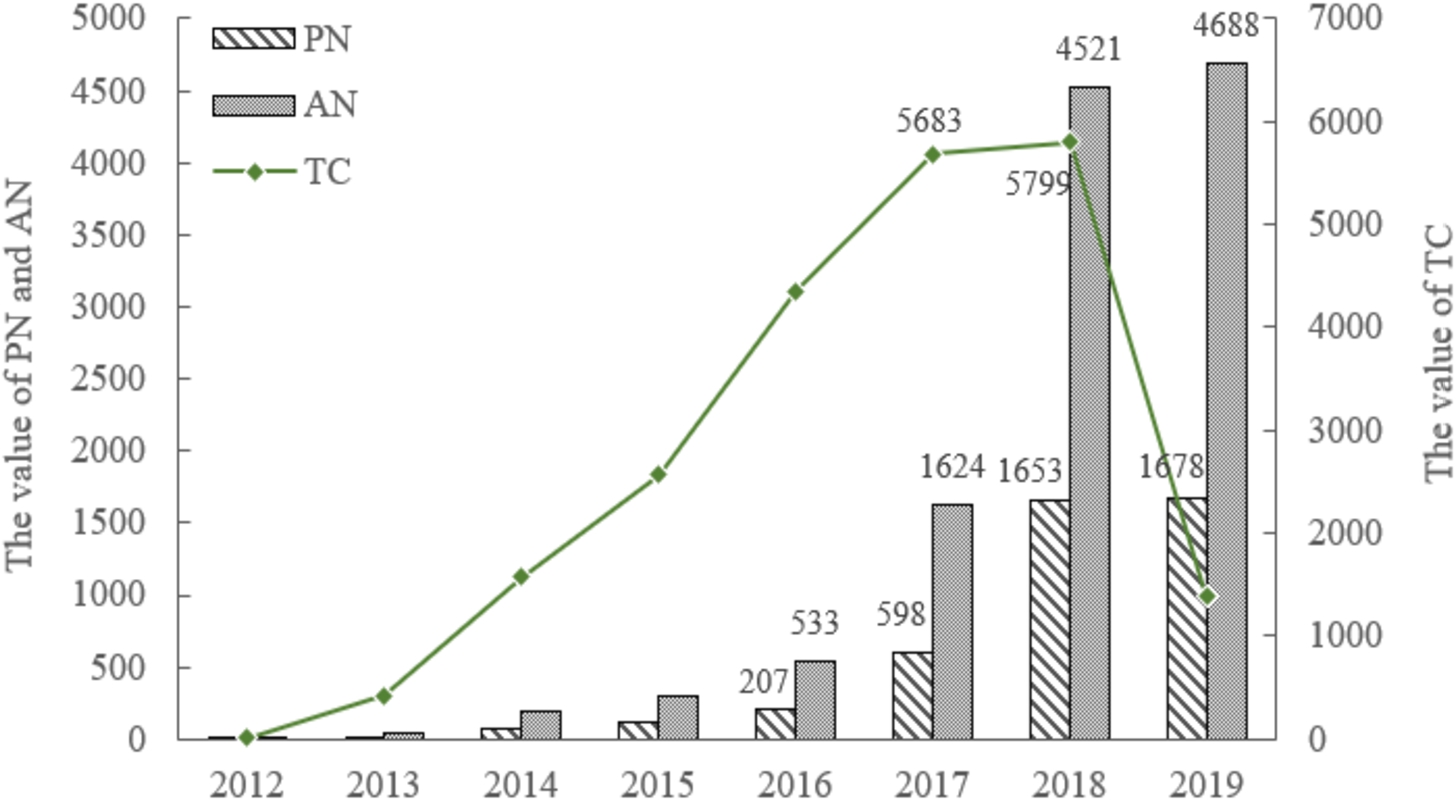
It can be seen from Fig. 2, the values of three indicators are growing drastically. It is not difficult to predict that the incremental trend will be maintained in the next few years. In the period of first 3 years, there are no great differences between PN and AN. The remarkable increase in this field is beginning from 2016 to 2017. At the same time, the gap between PN and AN value is gradually enlarging, which indicate that more authors begin to publish their papers by collaborating with others. The average number of authors per article changed from 2575 in 2016 to 2716 in 2017. As more and more researchers put their focus on the field of blockchain from 2018 to 2019, PN and AN have exceeded last two phases. As we all know, the TC value accumulates over time, so it is easy to understand that the citation of articles in recent years will be lower than those of previous articles. However, the TC value has two peaks in 2017 and 2018, which are 5683 and 5799 respectively, indicating that the recent papers have accepted more attention compared with papers published in the early stage.
To evaluate the degree of collaboration from the quantitative perspective, this paper chooses three main collaboration forms (author, institution and country) to study the trend of collaboration in the field of blockchain. The trend of different kinds of collaboration is presented in Fig. 3. The ICPN, IICPN and MAPN represent international-collaboration, inter-institution collaboration and multi-author publication numbers. The SAPN, SIPN and NICPN represent the single-author publication numbers, single-institution publication numbers and non-international publication numbers. Besides, the ICR, IICR and MACR stand for the collaboration rate of country, institution and author.
Fig. 3
The trends of different kinds of collaboration.
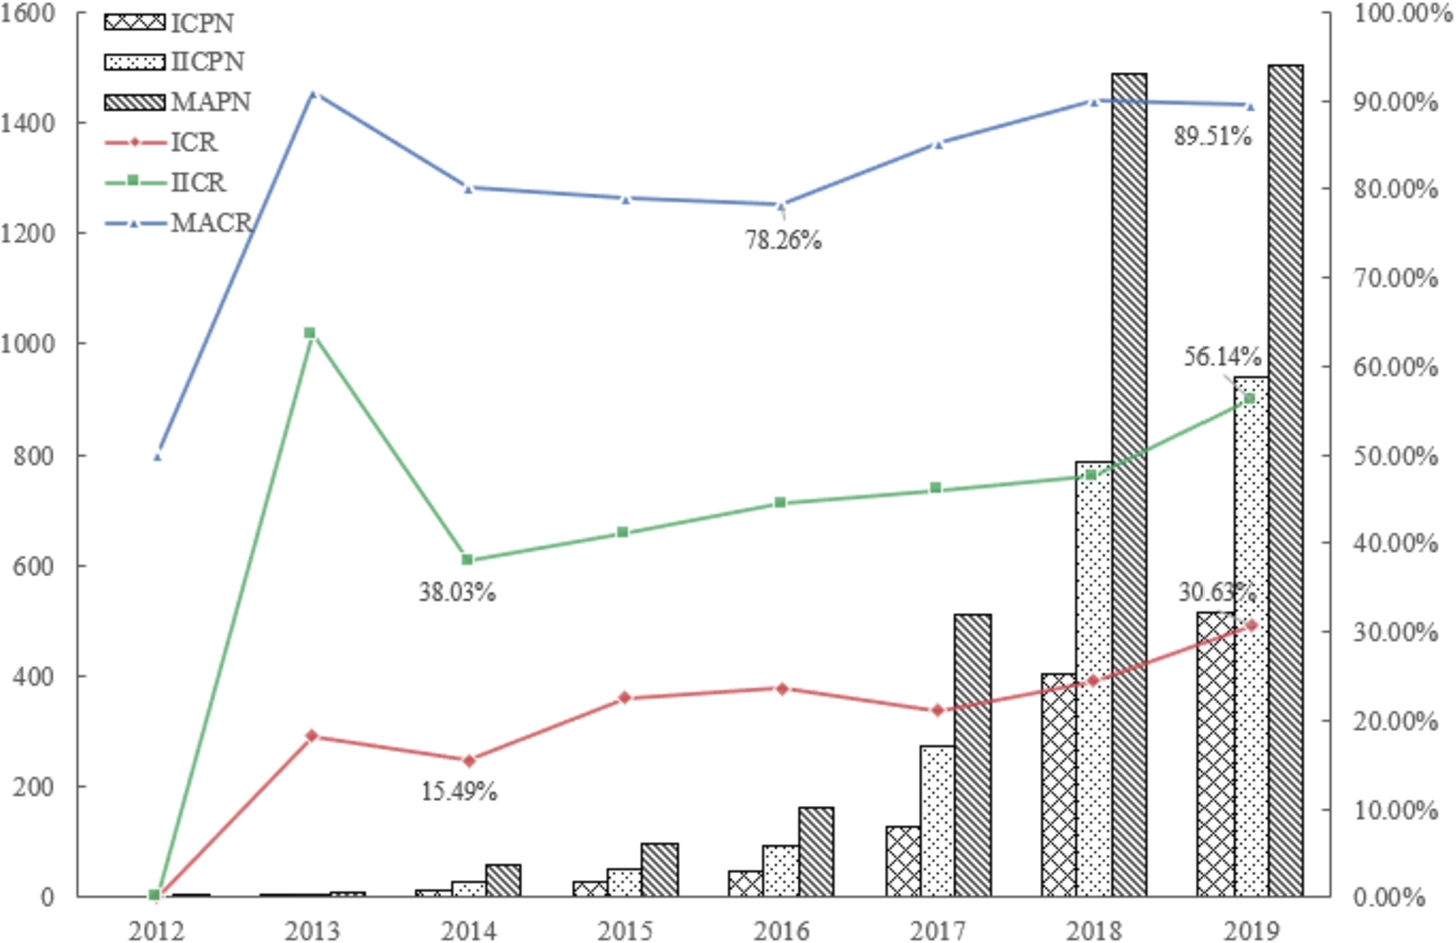
It can be seen from Fig. 3, the number of articles in three forms of collaboration increases sharply especially between 2016 and 2019. The rate of author collaboration increases from 50% in 2015 to 89.51% in 2019. The average author collaboration rate is 80.42%. It may reflect the interdisciplinary characteristics of blockchain field. Sometimes authors from different research backgrounds are required to solve interdisciplinary problems, which promotes the collaboration among authors. The collaboration rate of country always remains at around 20% and does not exceed 30% until 2019. The average country collaboration rate is 19.52%. In addition, the rate of institution collaboration increases from 38.03% in 2014 to 56.14% in 2019. The average institution collaboration rate is 42.12%. It is not difficult to notice that the collaboration in the blockchain field has gradually become a trend in three different levels.
3.3Collaboration Intensity Analysis
In order to display the evolution of collaboration intensity more clearly and intuitively, the time period of this article is divided into three stages according to the development trend and collaboration characteristics.
The quantitative results of collaboration intensity are presented in Table 1. It can be seen that the trend of collaboration continues to strengthen whatever the level is. Especially in the last stage, collaboration in three levels has a sharp increase. The collaboration of three authors is the most common mode of author collaboration in this field, which has 1033 papers accounting for 23.8% of all papers. Then, five and more authors’ collaborative mode also has a relatively high proportion, which has 1024 papers accounting for 23.6% of all papers. Countries and institutions have a similar collaboration mode. Collaboration between two countries and two institutions is the primary collaboration mode of them respectively. This phenomenon demonstrates that authors in this field are inclined to establish large-scale collaborative relationships.
Table 1
The collaboration intensity distribution from three levels.
| Author characteristics | Total
| Time period | ||
| 2012–2015 | 2016–2017 | 2018–2019 | ||
|
|
|
| ||
| Number of authors | ||||
| One | 505 | 41 | 164 | 300 |
| Two | 997 | 63 | 310 | 624 |
| Three | 1033 | 48 | 270 | 715 |
| Four | 785 | 30 | 203 | 552 |
| Five and more | 1024 | 24 | 245 | 755 |
| Number of countries | ||||
| One | 3236 | 166 | 951 | 2119 |
| Two | 847 | 34 | 190 | 621 |
| Three | 190 | 6 | 42 | 142 |
| Four and more | 71 | 0 | 7 | 64 |
| Number of institutions | ||||
| One | 2202 | 125 | 670 | 1407 |
| Two | 1234 | 53 | 313 | 868 |
| Three | 550 | 20 | 128 | 402 |
| Four and more | 358 | 8 | 81 | 269 |
3.4Analysis of the Collaboration Characteristics of the Prolific Authors
Table 2 lists top 15 most productive authors in the field of blockchain. Considering the abbreviations phenomenon of author’s name, this article sorts out the real rank of most productive authors based on their full name and address information. It can be seen from Table 2 that Du Xiaojiang who ranks 1st publishes 20 papers and is followed by Choo Kim-Kwang Raymond, Bouri Elie, Park Jae-Hyun and Marchesi Michele. Two of the top 5 most productive authors come from the USA. To identify the influence of these prolific authors in this field, this paper calculates the average citations of their outputs. Shi Elaine who ranks 13 has the highest average citation, which is followed by Roubaud David who ranks 8. Bouri Elie has the highest average citation among top 5 prolific authors (22.6).
Most of the productive authors publish their papers by collaborating with others and these collaborators mostly belong to different institutions and different countries according to the collaborative indicators of Table 2. The average institutional and national collaboration rate of top 15 prolific authors are 73.18% and 71.19%, which is much higher than the average collaboration rate of this field. It indicates that the prolific authors tend to collaborate across institutions and even countries.
According to Table 2, 14 (93.33%) prolific authors belong to university. In addition, authors from the USA account for a big proportion among productive authors. Prolific authors are mainly from the area of Europe and America. Authors from Asia and other regions just account for a small proportion.
Table 2
The 15 most productive authors of blockchain papers.
| Rank | Name | Institution | Country/ Territory | TP | TC | TC/TP | SAPN | MAPN | IICPN | SIPN | NICPN | ICPN |
| 1 | Du Xiaojiang | Temple Univ | USA | 20 | 151 | 7.6 | 0 | 20 | 20 | 0 | 0 | 20 |
| 2 | Choo Kim-Kwang Raymond | Univ Texas San Antonio | USA | 19 | 142 | 7.5 | 0 | 19 | 16 | 3 | 3 | 16 |
| 3 | Bouri Elie | Holy Spirit Univ Kaslik | Lebanon | 16 | 361 | 22.6 | 0 | 16 | 16 | 0 | 0 | 16 |
| 4 | Park Jae-Hyun | Seoul Natl Univ Sci & Technol | South Korea | 15 | 177 | 11.8 | 1 | 14 | 8 | 7 | 11 | 4 |
| 5 | Marchesi Michele | Univ Cagliari | Italy | 15 | 87 | 5.8 | 1 | 14 | 4 | 11 | 3 | 12 |
| 6 | Niyato Dusit | Nanyang Technol Univ | Singapore | 15 | 75 | 5 | 0 | 15 | 15 | 0 | 0 | 15 |
| 7 | Tsai Wei-Tek | Beihang Univ | China | 15 | 48 | 3.2 | 0 | 15 | 13 | 2 | 5 | 10 |
| 8 | Roubaud David | Montpelier Business Sch | France | 14 | 377 | 26.9 | 0 | 14 | 14 | 0 | 0 | 14 |
| 9 | State Radu | Univ Luxembourg | Luxembourg | 14 | 10 | 0.7 | 0 | 14 | 7 | 7 | 8 | 6 |
| 10 | Yu, F. Richard | Carleton Univ | Canada | 14 | 51 | 3.6 | 0 | 14 | 14 | 0 | 0 | 14 |
| 11 | Zheng Zibin | Sun Yat Sen Univ | China | 14 | 235 | 16.8 | 0 | 14 | 8 | 6 | 10 | 4 |
| 12 | Salah Khaled | Khalifa Univ | United Arab Emirates | 13 | 159 | 12.2 | 0 | 13 | 6 | 7 | 9 | 4 |
| 13 | Shi Elaine | Cornell Univ | USA | 13 | 536 | 41.2 | 0 | 13 | 10 | 3 | 10 | 3 |
| 14 | Xu Xiwei | CSIRO | Australia | 13 | 221 | 17 | 0 | 13 | 13 | 0 | 1 | 14 |
| 15 | Deters Ralph | Univ Saskatchewan | Canada | 12 | 46 | 3.8 | 0 | 12 | 2 | 10 | 1 | 11 |
3.5Analysis of the Characteristic Collaboration of the Prolific Institution
Table 3
The 15 most productive institutions of blockchain papers.
| Rank | Institutions | Country/ Territory | TP | SIPN | IICPN | ||||||
| SIP | TC | TC/SIP | SIP (%) | IICP | TC | TC/IICP | IICP (%) | ||||
| 1 | Chinese Acad Sci | China | 75 | 5 | 3 | 0.6 | 6.7 | 70 | 331 | 4.7 | 93.3 |
| 2 | London Univ | UK | 74 | 29 | 107 | 3.7 | 39.2 | 45 | 303 | 6.7 | 60.8 |
| 3 | Beijing Univ Posts & Telecommun | China | 73 | 14 | 48 | 3.4 | 19.2 | 59 | 220 | 3.7 | 80.8 |
| 4 | UCLA | USA | 68 | 13 | 26 | 2 | 19.1 | 55 | 604 | 11 | 80.9 |
| 5 | IBM | USA | 53 | 20 | 43 | 2.2 | 37.7 | 33 | 191 | 5.8 | 62.3 |
| 6 | Peking Univ | China | 48 | 9 | 12 | 1.3 | 18.8 | 39 | 104 | 2.7 | 81.2 |
| 7 | Nanyang Technol Univ | Singapore | 44 | 4 | 17 | 4.3 | 9.1 | 40 | 245 | 6.1 | 90.9 |
| 8 | Pennsylvania Commonwealth System of Higher Education | USA | 44 | 4 | 50 | 12.5 | 9.1 | 40 | 258 | 6.5 | 90.9 |
| 9 | CSIRO | Australia | 43 | 2 | 20 | 10 | 4.7 | 41 | 394 | 9.6 | 95.3 |
| 10 | Eth Zurich | Switzerland | 42 | 10 | 142 | 14.2 | 23.8 | 32 | 329 | 10.3 | 76.2 |
| 11 | Univ New South Wales Sydney | Australia | 42 | 2 | 7 | 3.5 | 4.8 | 40 | 408 | 10.2 | 95.2 |
| 12 | Tsinghua Univ | China | 41 | 7 | 125 | 17.9 | 17.1 | 34 | 31 | 0.9 | 82.9 |
| 13 | Univ of Texas System | USA | 41 | 5 | 10 | 2 | 12.2 | 36 | 170 | 4.7 | 87.8 |
| 14 | Univ Elect Sci & Technol China | China | 40 | 8 | 15 | 1.9 | 20.0 | 32 | 169 | 5.3 | 80.0 |
| 15 | UCL | UK | 38 | 13 | 38 | 2.9 | 34.2 | 25 | 179 | 7.2 | 65.8 |
Table 3 lists top 15 productive institutions. Chinese Acad Sci ranks first with 75 papers, followed by London Univ with 74 papers, Beijing Univ Posts & Telecommun with 73 papers, UCLA with 68 papers, IBM with 53 papers. China and the USA each have two institutions in top 5. Chinese Acad Sci and Beijing Univ Posts & Telecommun have a high rank among top 5 productive institutions, but the average citations are lower than other three institutions.
Tsinghua Univ has the highest average citation among publications of single institution, which is followed by Eth Zurich and Pennsylvania Commonwealth System of Higher Education. Eth Zurich has the highest average citation among publications of institution collaboration, which is followed by Univ New South Wales Sydney and CSIRO.
Prolific institutions tend to publish their papers by collaborating with others. The average collaboration rate of top 15 prolific institutions is 82.26%, which is much higher than the general level of this field. In addition, most of the publications published in the form of institutional collaboration have higher citations compared with publications with single institution. There are two Australian institutions with the highest collaboration rates, which are CSIRO and Univ New South Wales Sydney. 11 (73.33%) of top 15 prolific institutions are university, the other 4 (26.67%) institutions are enterprises or organizations. There are 5 (33.33%) prolific institutions in China and 4 (26.67%) prolific institutions in USA.
3.6Analysis of the Collaboration Characteristics of the Prolific Countries/Territories
Table 4 lists top 10 prolific countries. Prolific countries in the top 5 are USA, China, UK, Germany and South Korea. There are six countries in the top 10 which also belong to the G7 group (Canada, France, Germany, Italy, Japan, the UK, and the USA). The USA has published 974 papers in the blockchain field and ranks 1st among the most productive countries. Articles published by the USA also have the high average citation. The average citations of non-international publications and international publications are 8.06 and 8.07 respectively. It indicates that papers of the USA not only have a large number of articles but also a great influence. China ranks second, however, the average citations of non-international publications and international publications are 2.74 and 4.73 respectively. China has a large numbers of articles but these articles have a relatively small influence in this field.
The average collaboration rate of prolific countries is 45.31%, which is higher than the general level of this field. It is noticeable that some countries have the high level of international collaboration like Australia, Canada and France. Their articles published in the form of international collaboration also have high average citations. There are three Asian countries among top 10 prolific countries. Their collaboration rates are lower than other 7 countries.
Table 4
The 10 most productive countries/territories of blockchain papers.
| Rank | Country/ Territory | TP | NICPNa | ICPNb | ||||||
| NICP | TC | TC/NICP | NICP (%) | ICP | TC | TC/ICP | ICP (%) | |||
| 1 | USA | 974 | 586 | 4721 | 8.06 | 60.2 | 388 | 3130 | 8.07 | 39.8 |
| 2 | China | 967 | 598 | 1639 | 2.74 | 61.8 | 369 | 1745 | 4.73 | 38.2 |
| 3 | UK | 437 | 218 | 1811 | 8.31 | 49.9 | 219 | 1384 | 6.32 | 50.1 |
| 4 | Germany | 229 | 130 | 619 | 4.76 | 56.8 | 99 | 709 | 7.16 | 43.2 |
| 5 | South Kores | 214 | 156 | 489 | 3.13 | 72.9 | 58 | 475 | 8.19 | 27.1 |
| 6 | India | 205 | 134 | 135 | 1.01 | 65.4 | 71 | 257 | 3.62 | 34.6 |
| 7 | Australia | 203 | 76 | 514 | 6.76 | 37.4 | 127 | 800 | 6..30 | 62.6 |
| 8 | Canada | 182 | 79 | 138 | 1.75 | 43.4 | 103 | 696 | 6.76 | 56.6 |
| 9 | Italy | 180 | 101 | 418 | 4.14 | 56.1 | 79 | 469 | 5.94 | 43.9 |
| 10 | France | 165 | 71 | 153 | 2.15 | 43.0 | 94 | 948 | 10.09 | 57.0 |
a Non-international-collaborative publication number.
b International-collaborative publication number.
4Analysis of Collaboration Network in the Field of Blockchain
This paper uses SNA method to study the collaboration network from three levels (author, institution and country). The characteristics of author collaboration network can be found by analysing the evolution of overall author collaboration. The evolution of influential author collaboration network based on authors who have more than 45 citations can help readers to know about the author collaboration mode among influential authors. The core institution and influential countries can be found out by centrality analysis and collaboration network analysis. The clustering of institution collaboration network shows the main research topics of institutions.
4.1Author Collaboration Network Analysis
4.1.1The Analysis of Overall Author Collaboration Network
Fig. 4
The evolution of overall co-authorship network.
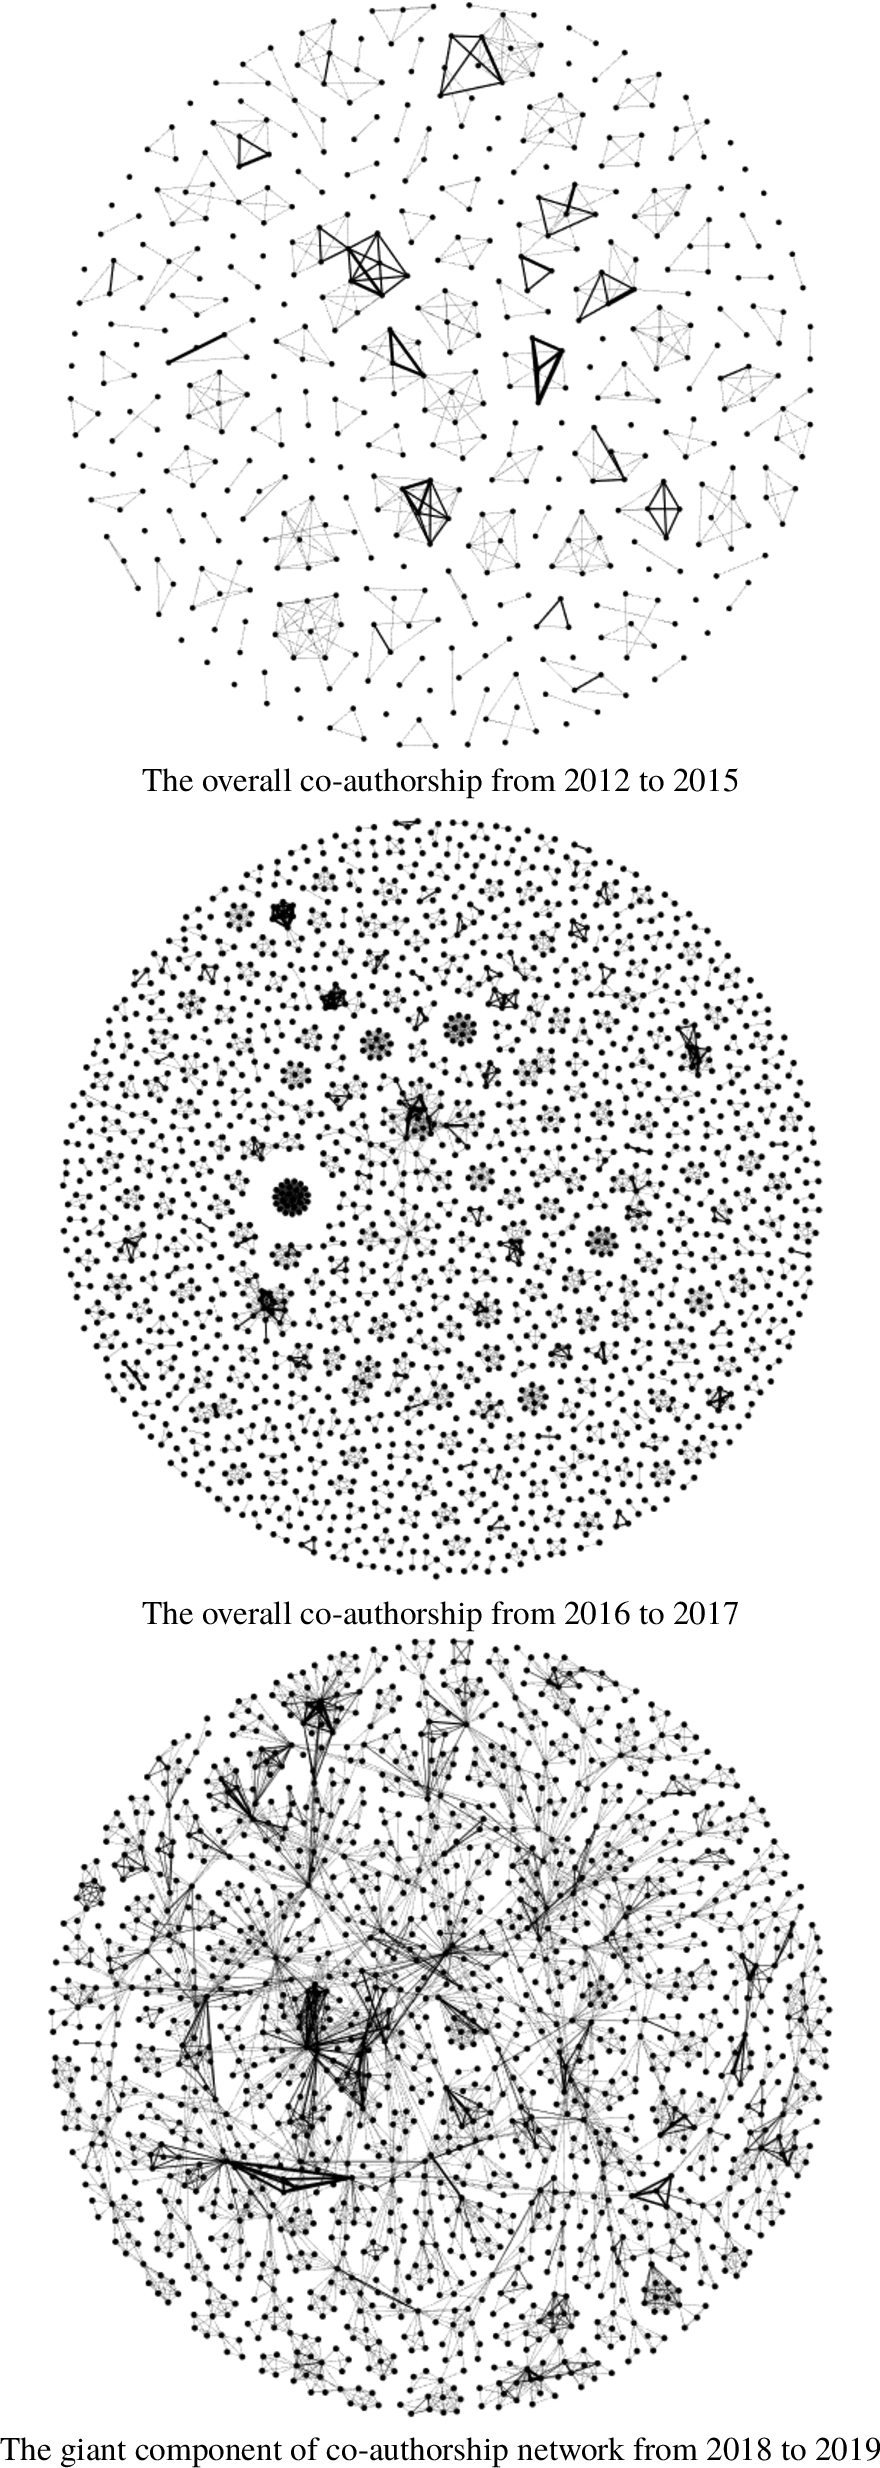
This paper displays the evolution of overall author collaboration network in three phases and discusses the characteristics of different collaboration networks. The visualization software Gephi (Bastian et al., 2009) is used to display the evolution of overall author collaboration network, which is presented in Fig. 4. The metrics of different collaboration networks are shown in Table 5. The node of collaboration network represents the author and the edge denotes the collaboration between two authors. The thickness of these lines represents collaboration times between two authors. The scale of author collaboration network continues to enlarge from 2012 to 2019. The network gradually gains the characteristics of a small world network. The network is scattered in the first stage. The biggest component of this period just has 14 numbers, accounting for only 2.9% of the overall network. However, the giant component with 1592 numbers has appeared in the last stage, which accounts for 17.9% of the overall network. The connectivity of network has been continuously enhanced.
Table 5
Metrics of co-authorship network.
| Description of overall network in 2012–2015 | Statistics | Description of overall network in 2016–2017 | Statistics | Description of big component network in 2018–2019 | Statistics |
| Nodes | 477 | Nodes | 2094 | Nodes | 1592 |
| Edges | 619 | Edges | 3742 | Edges | 4889 |
| Average degree | 2.595 | Average degree | 3.574 | Average degree | 6.142 |
| Density | 0.005 | Density | 0.002 | Density | 0.004 |
| Diameter | 3 | Diameter | 8 | Diameter | 22 |
| Average clustering coefficient | 0.955 | Average clustering coefficient | 0.948 | Average clustering coefficient | 0.851 |
| Average path length | 1.263 | Average path length | 2.725 | Average path length | 7.848 |
| Number of weakly | 169 | Number of weakly | 594 | Overall co-authorship | 8903 |
| Connected components | Connected components | network size | |||
| giant component size | 14 | Giant component size | 98 | Giant component size | 1592 |
| Main component % | 2.9% | Main component % | 4.7% | Main component % | 17.9% |
There are 477 authors in the first stage (2012–2015). The average degree is 2.595, which demonstrates that every author has at least 2–3 collaborators. It is noticeable that there are 169 components in the network. Every component has a small scale. The biggest component just has 14 nodes. It is deducted that authors in the first stage have a small-scale collaborative relationship with others. The average clustering coefficient is 0.955 but the density of the network is just 0.005. The average path length is 1.263, which is relatively long. It indicates that although the collaboration is relatively close among small co-authorship group, the network has not yet formed the typical small-world network characteristics. According to the definition by Wasserman and Faust (1994), a small-world network has a high clustering coefficient and a short geodesic distance. As described above, the co-authorship network is still in the elementary development stage during this period.
The number of authors increases sharply from 477 in the first stage to 2094 in the second stage. The average degree is 3.574, which means that every author increases one collaborator on average compared with the last phase. The increasing of author numbers directly causes the enlarging of network scale. There are 594 components in the network. The giant component begins to form during this period. The biggest component has 98 nodes. However, the small-scale collaboration groups are still the main form of collaboration. The average clustering coefficient is still in a high level which is 0.984, but the density is just 0.002. There is a relatively short average path length in the network which is 2.725 compared with the network diameter of 8. The small-world network characteristic starts to appear. In general, although the field of blockchain starts to have the characteristic of mature network, the network is still in the stage of continuous development in this period.
The number of authors have an explosive increase during the period of 2018–2019, which achieves 8903. The big-scale component has formed in this phase. The biggest component has 1592 numbers. Due to the big-scale of overall co-authorship network, it is difficult to solve the problem of abbreviated author names by manually verifying the author information. Therefore, this paper describes and analyses the characteristics of the network based on the giant component to ensure the veracity. The average degree is 6.142, which is much higher than last two phases. It demonstrates that authors tend to establish the extensive collaborative relationship with others rather than just limited to the small collaboration groups. The average clustering coefficient is 0.851 but the density is just 0.004. The average path length is 7.848, which is relatively short compared to the network diameter of 22. It conforms to the characteristics of a small-world network. There are more authors collaborating with others repeatedly in this period. This big component has the feature of a mature network.
4.1.2The Evolution of Influential Author Collaboration Network
A lot of studies consider the total citations (TC) as the significance indicator to measure the influence of authors. The influential author collaboration network can provide some references for studying the overall collaboration network characteristics and collaboration mode. Therefore, this paper extracts authors with more than 45 citations and constructs the co-authorship networks.
Fig. 5
The influential author collaboration network in 2012–2015.
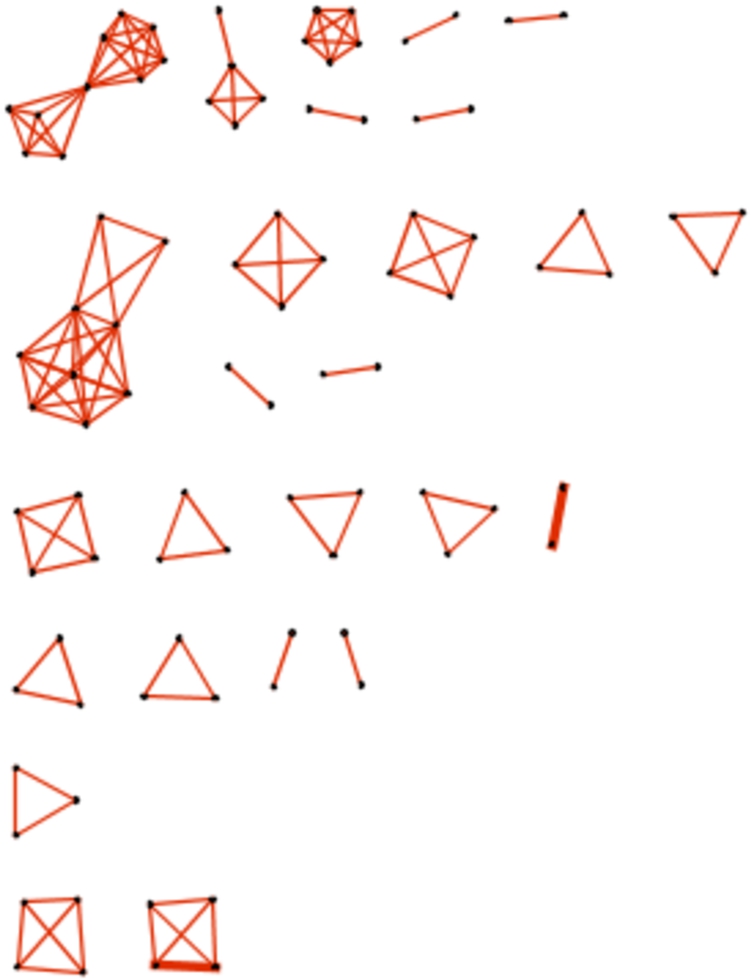
Sci2 Team (2009) is used to visualize the influential author collaboration network in different phases, which are presented from Fig. 5 to Fig. 7. To avoid special cases like one publication having too many authors, papers which have more than 25 authors are removed. The node represents the author and the line between two nodes denotes the collaboration between two authors in the network. The bold line means that authors collaborate with each other more than 3 times (not including 3 times). The completed subnet is defined as every author having a direct connection with others in the network. The connected subnet is defined that some authors are connected with each other directly and some authors need to connect with others by midpoint in the network (Peng et al., 2017).
In general, the scale of influential author collaboration network is gradually enlarging from 2012 to 2019. The connectivity of network has been continuously enhanced. The big-scale completed subnet has formed in the last period. The topics of research are gradually expanding from cryptocurrency to the application of blockchain technology in various domains.
Figure 5 shows the influential author collaboration network in 2012–2015. The network is scattered. The scale of collaboration network is small during this period. It can be seen from Fig. 5 that there are three connected subnets and many completed subnets. These subnets all have a small scale. Besides, there are few authors who collaborate with others more than 3 times.
There are only three papers in the biggest connected component. The biggest connected subnet has two small collaboration groups connected by one author named Miller Andrew. This author as a bridge connects two collaboration groups. The main theme of this connected subnet is the Bitcoin. The left group mainly focuses on the problems of mining Bitcoin and the right group mainly focuses on the improvement of efficiency and privacy of Bitcoin.
Figure 6 displays the influential author collaboration network from 2016 to 2017. The network is also scattered. Small collaboration groups are still the main collaborative form at this stage. However, the connection among small collaboration groups is closer than last period and the scale of them is gradually enlarging. Some authors establish collaborative relationship with collaborator’s collaborator, thereby the scale of collaboration is gradually enlarging and the big-scale connected subnets begin to appear during this period. The number of authors who connect with others more than 3 times also increases during this period.
Fig. 6
The influential author collaboration network in 2016–2017.
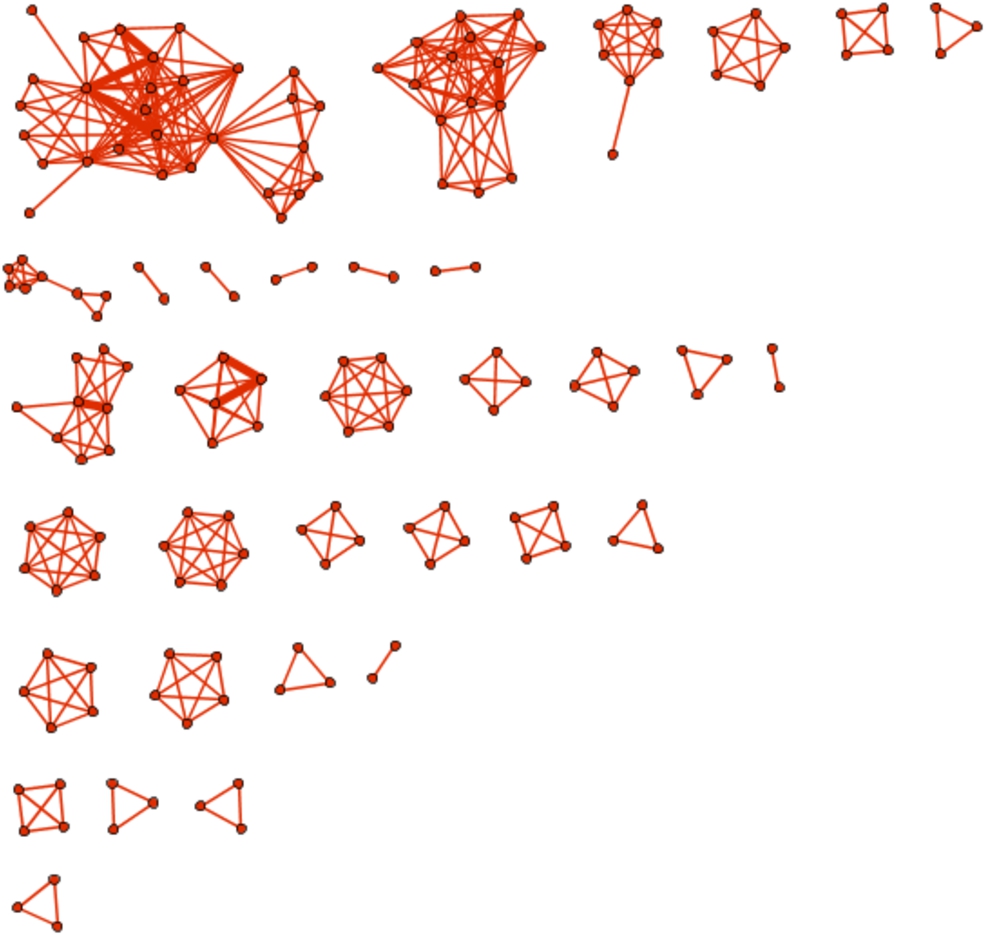
It can be seen from Fig. 6, there are two big-scale connected subnets in the network. The biggest subnet has two small collaboration groups connected by one author named Saxena Prateek. The largest connected subnet of this period is developed from the biggest connected subnet in the last stage. However, the other connected subnet in the last stage disappears in this period.
The main topic of the biggest connected subnet is security and privacy of the smart contract. Kosba et al. (2016) introduced the smart contract system named HAWK, which is useful to protect the transaction privacy. Juels et al. (2016) illustrated the risk of criminal smart contracts (CSC) leading to the important information leakage in order to accelerate policy release and strengthen the guarantee of technology in CSC field. Besides, the main topic of the other connected subnet is the application of blockchain-based system. Except for two big connected subnets, some of completed subnets are beginning to research on the application of blockchain technology in different fields especially the financial blockchain (Bouri et al., 2016) and cloud computing service (Tosh et al., 2017; Liang et al., 2017).
Fig. 7
The influential author collaboration network in 2018–2019.
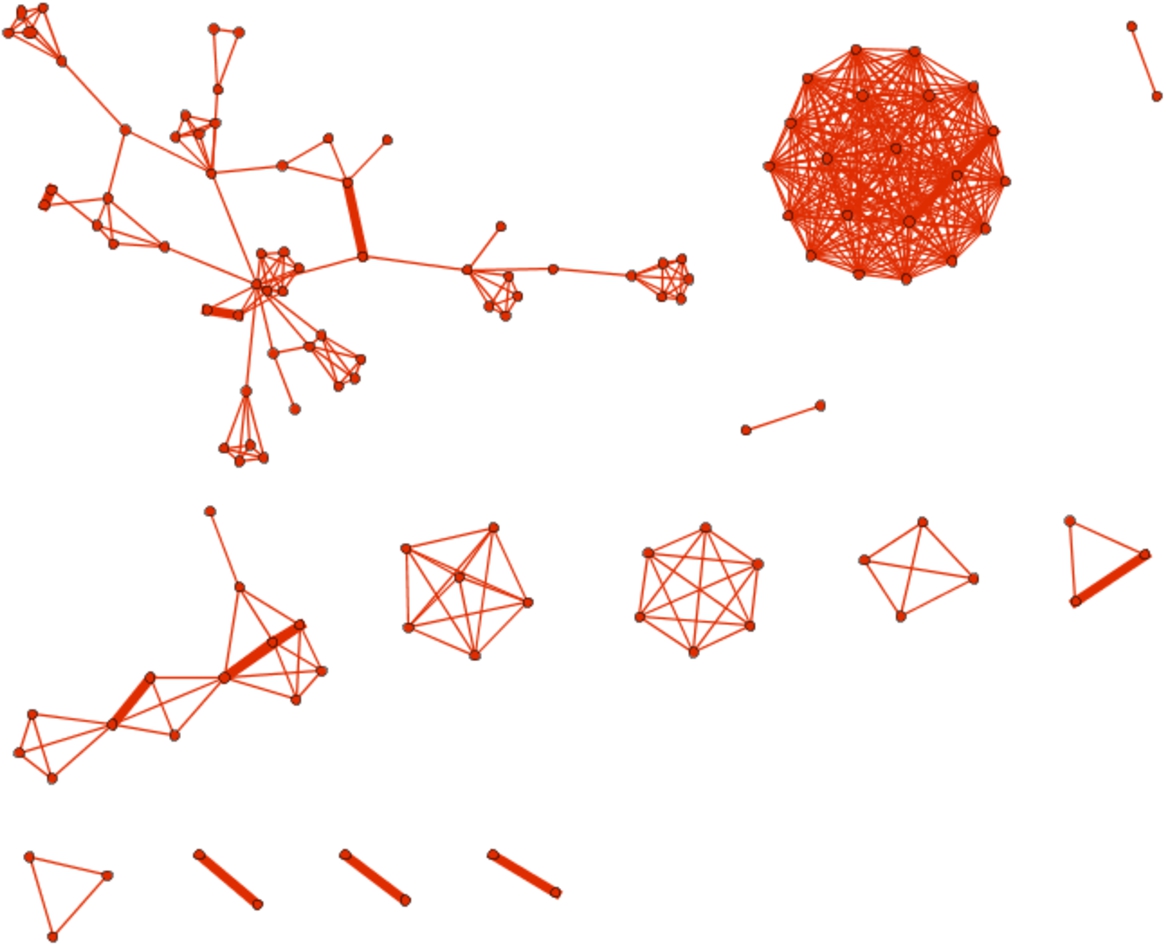
Figure 7 displays the influential author collaboration network from 2018 to 2019. The connectivity of network has been enhanced. Small collaboration groups are no longer the main collaborative form among influential authors. Due to the continuous expansion of the author collaboration scale, the big-scale connected subnet and the completed subnet have been formed in this period.
Collaboration network in this period is mainly research on the application of blockchain technology in various of domains such as traffic (Yang et al., 2018; Kang et al., 2018), financial (Huang et al., 2018; Begušić et al., 2018), Internet of Things (IoT) (Li et al., 2017), medical (Esposito et al., 2018), energy (Mengelkamp et al., 2018) and supply chain management (Saberi et al., 2019).
The research topic of the biggest completed subnet is relatively concentrated, which is the status quo, improvement and evaluation of Hyperledger Fabric (HIF) system for permissioned blockchain (private blockchain). There are 20 authors in the subnet. However, 13 authors (Androulaki et al., 2018) collaborate with each other for one paper named “Hyperledger Fabric: A Distributed Operating System for Permissioned Blockchains”. Coccia and Bozeman (2016) hold the view that researchers who belong to the category of application technology tend to international collaboration. It can be explained that an emerging application technology needs to be continuously debugged and evaluated so that it could be used better in the future. This process contributes to the collaboration and interaction among researchers from different research domains, institutions, even countries.
Nevertheless, only two authors (Barger Artem and Manevich Yacov) collaborate with each other for more than 3 times in the subnet. This phenomenon displays the interdisciplinary characteristic in the field of blockchain to some degree. The authors from different research domains collaborate with each other just one time which is useful to supply for the different professional background knowledge for a specific research, but this kind of collaboration is difficult to continue in the long term.
More than half of institutions are enterprises rather than universities in the subnet, which are different subsidiary companies in different countries of the International Business Machines Corporation (IBM). The country collaboration of the completed subnet is mainly concentrated in Europe.
4.2Institution Collaboration Network Analysis
4.2.1Analysis of Overall Network
The Vos-viewer is used to construct the initial institution collaboration network. Then Gephi is used to calculate the metrics of the network. There is a giant component in the institution collaborative network, which accounts for 58.98% of the overall network. The giant component has 1938 numbers. To avoid special cases, for example, one publication having too many authors, this paper sets a threshold to remove articles with more than 25 authors. Therefore, the giant component after screening has 1911 numbers. The difference of metrics between the overall network and the giant component is presented in Table 6. The giant component is the focus of our future analysis.
There are 1911 nodes and 4906 edges in the giant component. The average degree is 5.134, which means that one institution has at least 5 collaborators in the network. The average clustering coefficient is 0.684 but the density of network is just 0.003. The average path length is 4.907, which is shorter than the diameter of 13. The giant component network conforms to the characteristics of a small world network.
Table 6
Metrics of institution collaboration network.
| The whole institution collaboration network | Statistics | The biggest component of network | Statistics |
| Nodes | 3286 | Nodes | 1911 |
| Edges | 6276 | Edges | 4906 |
| Average degree | 3.82 | Average degree | 5.134 |
| Density | 0.001 | Density | 0.003 |
| Diameter | 13 | Diameter | 13 |
| Average clustering coefficient | 0.713 | Average clustering coefficient | 0.684 |
| Average path length | 4.81 | Average path length | 4.907 |
| Number of weakly | 839 | Number of weakly | 1 |
| connected components | connected components | ||
| Giant component size | 1938 | Giant component size | 1911 |
| Main component % | 58.98% | Main component % | 100% |
4.2.2Centrality Analysis
Table 7
The distribution of institution centrality.
| Rank | Label | Degree | Label | Closeness centrality | Label | Betweenness centrality | Label | Eigenvector centrality |
| 1 | Chinese Acad Sci | 78 | Chinese Acad Sci | 0.307717 | Chinese Acad Sci | 0.087329 | Chinese Acad Sci | 1 |
| 2 | Beijing Univ Posts & Telecommun | 63 | Beijing Univ Posts & Telecommun | 0.30212 | CSIRO | 0.076032 | Univ Chinese Acad Sci | 0.878779 |
| 3 | Univ Chinese Acad Sci | 59 | Tsinghua Univ | 0.30169 | Univ Oxford | 0.064646 | Univ Cambridge | 0.74446 |
| 4 | Beihang Univ | 54 | Carnegie Mellon Univ | 0.299796 | Beijing Univ Posts & Telecommun | 0.06175 | Simon Fraser Univ | 0.737409 |
| 5 | Tsinghua Univ | 48 | CSIRO | 0.298624 | UCL | 0.056234 | Univ East Anglia | 0.702585 |
| 6 | Xidian Univ | 48 | Xidian Univ | 0.298531 | Tsinghua Univ | 0.05499 | Univ Auckland | 0.69324 |
| 7 | Univ Sydney | 46 | Univ Oxford | 0.298531 | Carnegie Mellon Univ | 0.052819 | Univ Essex | 0.688823 |
| 8 | Univ Texas San Antonio | 46 | Univ Elect Sci & Technol China | 0.296999 | Univ Illinois | 0.049238 | Univ Calif Davis | 0.688632 |
| 9 | CSIRO | 43 | Univ Illinois | 0.2964 | Xidian Univ | 0.048268 | Cranfield Univ | 0.679508 |
| 10 | Peking Univ | 43 | Shanghai Jiao Tong Univ | 0.294981 | King Saud Univ | 0.045328 | 25 st Jamess St | 0.678153 |
| 11 | Singapore Management Univ | 43 | Univ Texas San Antonio | 0.29326 | Univ Elect Sci & Technol China | 0.042987 | 721 Ohio St | 0.678153 |
| 12 | Univ Elect Sci & Technol China | 42 | Univ Chinese Acad Sci | 0.28865 | Univ Technol Sydney | 0.042442 | British Antarctic Survey | 0.678153 |
| 13 | Shanghai Jiao Tong Univ | 40 | Univ Technol Sydney | 0.288563 | Univ Texas San Antonio | 0.042291 | British Ecol Soc | 0.678153 |
| 14 | Univ Illinois | 40 | Singapore Management Univ | 0.286744 | Univ Sydney | 0.041063 | BTO | 0.678153 |
| 15 | UCL | 39 | Beihang Univ | 0.286357 | Beihang Univ | 0.040932 | Environm Agcy | 0.678153 |
This paper extracts top 15 high centrality institutions from the giant component, which is exhibited in Table 7. Universities account for a large proportion among these institutions. It can be seen from Table 7 that there are four Chinese institutions having a stable and relatively high rank among four centrality indicators, which are Chinese Acad Sci, Beijing Univ Posts & Telecommun, Tsinghua Univ and Xidian Univ. It also demonstrates that China has an important influence in this field. The most core institution is Chinese Acad Sci because it ranks top 1 among all four centrality indicators. Beihang Univ, Univ Texas San Antonio and Univ Sydney all have a high degree centrality distribution compared with other centrality indicators. This phenomenon indicates that although these institutions have an extensive collaboration with others, the ability of transferring and controlling information is still in a relatively low level.
Carnegie Mellon Univ and Univ Elect Sci & Technol China have a relatively high value of closeness centrality compared with their other centrality indicators. Especially Carnegie Mellon Univ does not appear in the other top 15 indicators but it has a high rank of closeness and betweenness centralities, even exceeding some influential institutions. It demonstrates that although this institution has not established extensive collaborative relationship with others, it has a huge potential in effectively disseminating information due to the close distance from other institutions in the network.
Univ Illinois, CSIRO, Univ Oxford and UCL have a high position in the rank of betweenness centrality indicator compared with other centrality indicators in Table 7. Although these institutions have not established the wide collaboration with others, they have a good ability to control and transfer information efficiently. Therefore, these institutions also have a vital influence in this field. Except for the Chinese Acad Sci and Univ Chinese Acad Sci, there are no other universities appearing repeatedly between eigenvector centrality and other three centrality indicators. It is deducted that maybe other institutions can enlarge their influence by collaborating with more influential institutions.
4.2.3Collaboration Network Analysis
Fig. 8
The collaboration network of institutions.
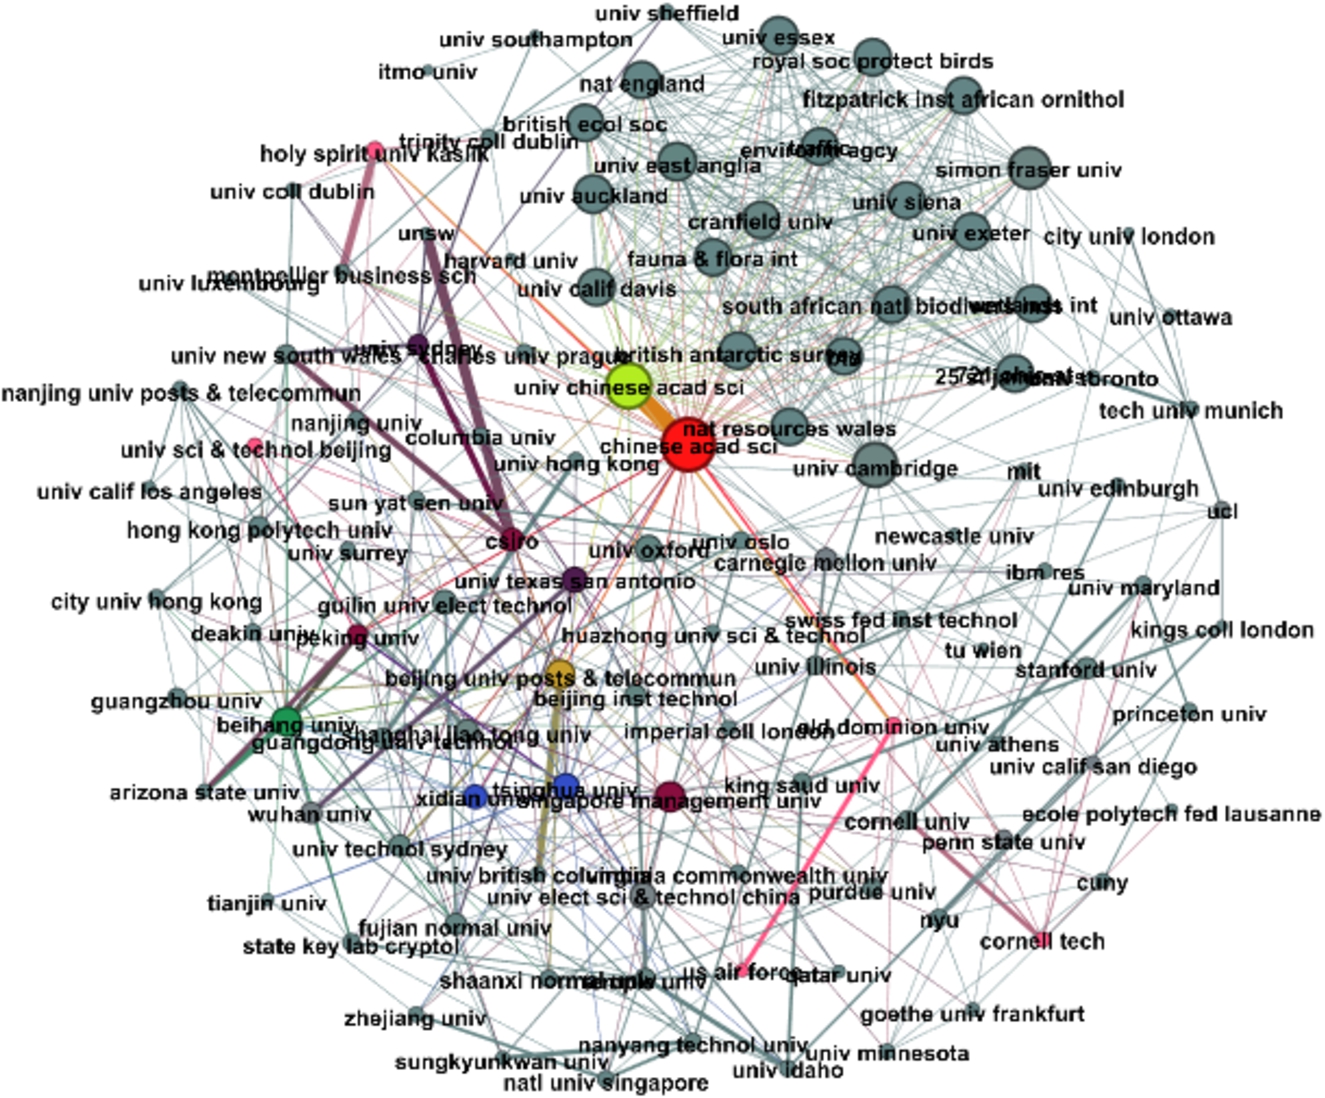
This paper extracts these institutions with the value of degree centrality above 15 from the giant component and constructs the institution collaboration network by Gephi, which is presented in Fig. 8. Every node stands for an institution and the edge represents the collaboration between two institutions. The thickness of the line denotes the collaboration times between two institutions. Colour nodes stand for those institutions which have a relatively high value of degree centrality. The same size of nodes represents the same value of degree centrality.
It can be seen from Fig. 8, the institution collaboration network has two closely connected collaboration groups. One of the collaboration groups has a close connection among internal members, which communicates with others almost only by Chinese Acad Sci. The other collaboration group has a relatively big scale in the network. It is established by some main institutions named CSIRO, Beihang Univ, Beijing Univ Posts & Telecommun, Tsinghua Univ and Univ Oxford. The scale of collaboration among these institutions and other institutions is still enlarging. Chinese Acad Sci is the centre of this network. Chinese Acad Sci and Univ Chinese Acad Sci have the most closely collaborative relationship, which is not only because of the geographical proximity but also due to the affiliated relationship between two institutions. Maybe it is the reason why Univ Chinese Acad Sci has a high value of eigenvector centrality in Table 5. Besides, UNSW, CSIRO, Univ New South Wales and Univ Sydney have multiple collaborative relationship. However, UNSW and Univ New South Wales always seem to be connected with each other by CSIRO. Maybe there is a structural hole between them, which contributes to the important position of CSIRO.
4.2.4The Clustering of Institution Collaboration Network
To find out the main research topic in every institution, this paper displays the clustering of institution collaboration network, which is visualized by the software of Citespace (Chen, 2006). The clustering of institution collaboration network is presented in Fig. 9.
Fig. 9
The clustering of institution collaboration network.
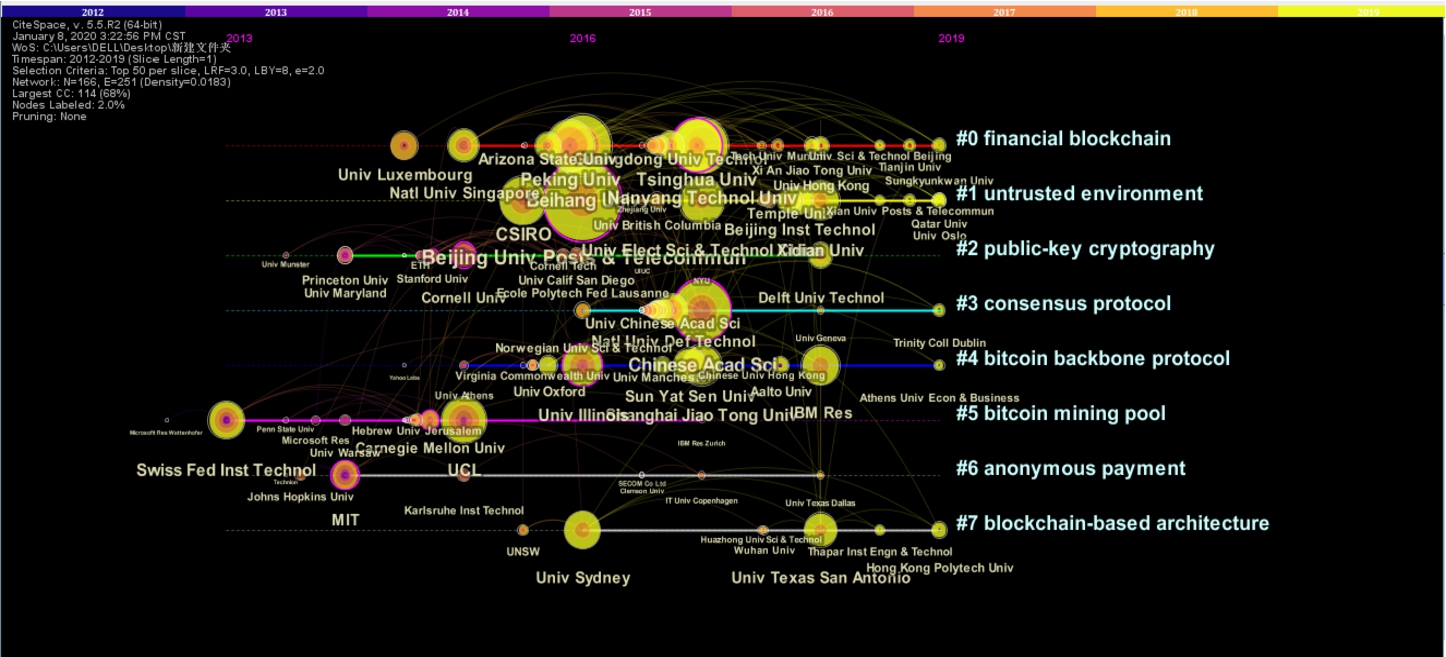
The biggest clustering in Fig. 9 is #0 named financial blockchain. This clustering contains plenty of institutions like Arizona State Univ, Beihang Univ, Tsinghua Univ and Peking Univ. The earliest cluster that appeared in the network is #5 named bitcoin mining pool, which appears in 2013. The clustering #2 and #6 have the similar attention time, but there is less attention in 2019 in these two clusterings. The clustering #2 is about the public-key cryptography. Stanford Univ mentioned above in centrality analysis appears in this clustering. The clustering #6 is about the anonymous payment. The institution with high rank of betweenness centrality named UCL belongs to this clustering. The clustering #1, #3 and #7 have a similar development time from around 2016 to 2019. The clustering #1 is mainly about the untrusted environment. The clustering #1 contains some influential institutions like Beijing Univ Posts & Telecommun, Xidian Univ and Univ Elect Sci & Technol China. These institutions maybe focus on the secure problems of blockchain technology. The clustering #3 mainly focuses on the consensus protocol, which includes the core institution Chinese Acad Sci. The clustering of #7 mainly focuses on the blockchain-based architecture. Two institutions with relatively high degree centrality, Univ Sydney and Univ Texas San Antonio, belong to this clustering. The clustering #4 is about the bitcoin backbone protocol. This clustering contains Shanghai Jiao Tong Univ, IBM Res, Univ Illinois and Univ Oxford.
4.3Country Collaboration Network Analysis
4.3.1The Overall Collaboration Network Analysis
Table 8
Metrics of country collaboration network.
| Description | Statistics |
| Nodes | 91 |
| Edges | 641 |
| Average degree | 14.088 |
| Density | 0.157 |
| Diameter | 5 |
| Average clustering coefficient | 0.621 |
| Average path length | 2.094 |
| Number of weakly connected components | 1 |
The Bib-excel is used for data reprocessing. Then the Gephi is used to calculate the metrics of overall country collaboration network in this section. The giant component has 91 numbers, which accounts for 91.92% of the overall network. Therefore, the giant component is the focus of our analysis. Metrics of the giant component network are presented in Table 8.
There are 91 nodes and 641 edges in the network. The average degree is 14.088, which means that every country has at least 14 collaborators. The average clustering coefficient is 0.621, which is a relatively high value. The average path length is 2.094 while the diameter of network is 5. It indicates that the country collaboration network conforms to the characteristics of a small world network. In addition, the country collaboration network has a relatively close connection, which has a little difference with author and institution collaboration network.
4.3.2Centrality Analysis
The top 15 countries with high value of centrality are presented in the Table 9. The most core countries in this field are UK and the USA which is defined as the country having the highest rank in every centrality indicator. It indicates that UK and the USA have the significant position in the collaboration network.
China ranks top 3 in all centrality indicators except for the betweenness centrality. It demonstrates that China has wide connections with influential countries and also locates in the centre of network. However, the ability of control information is relatively weak compared with other powerful countries. In contrast, France and Switzerland have a higher betweenness value compared with others. It indicates that they have a stronger ability to control and transfer the information to other countries although they have not established the extensive connections with others.
Australia, Spain, Germany, Canada, South Korea, India and Russia have an almost stable distribution in the value of centrality, but they have the important position in this field. Brazil does not appear in the top 15 countries in the rank of eigenvector centrality. This country also has a low level of other centrality values. Collaborating with influential countries may be a good way to improve self-influence. Netherlands has a relatively high value of betweenness centrality, but it does not appear in the top rank of degree centrality. It can be deducted that although this country does not have wide connections with others, it owns an important position to control the dissemination of information. Saudi Arabia, Belgium and Ireland have just one centrality indicator ranking in Table 9.
Table 9
The distribution of country centrality.
| Rank | Label | Degree | Label | Closeness centrality | Label | Betweenness centrality | Label | Eigenvector centrality |
| 1 | USA | 58 | USA | 0.731707 | UK | 0.130083 | USA | 1 |
| 2 | UK | 54 | UK | 0.708661 | USA | 0.118418 | UK | 0.943153 |
| 3 | Peoples R China | 45 | Peoples R China | 0.661765 | France | 0.07683 | Peoples R China | 0.87671 |
| 4 | Australia | 43 | Australia | 0.652174 | Australia | 0.06955 | Australia | 0.841712 |
| 5 | Spain | 43 | Spain | 0.647482 | Spain | 0.066074 | Spain | 0.795748 |
| 6 | France | 41 | France | 0.642857 | Switzerland | 0.060119 | France | 0.794611 |
| 7 | Germany | 34 | Germany | 0.608108 | Peoples R China | 0.057052 | Italy | 0.739585 |
| 8 | Italy | 34 | Italy | 0.608108 | Germany | 0.047079 | Germany | 0.71184 |
| 9 | India | 33 | Canada | 0.604027 | Netherlands | 0.044156 | India | 0.696277 |
| 10 | South Korea | 33 | India | 0.6 | South Korea | 0.041203 | South Korea | 0.669512 |
| 11 | Canada | 32 | Switzerland | 0.588235 | Canada | 0.036456 | Canada | 0.663054 |
| 12 | Switzerland | 29 | South Korea | 0.584416 | Russia | 0.033795 | Switzerland | 0.633688 |
| 13 | Brazil | 28 | Netherlands | 0.580645 | India | 0.032442 | Russia | 0.618514 |
| 14 | Russia | 28 | Brazil | 0.573248 | Brazil | 0.031819 | Netherlands | 0.593704 |
| 15 | Saudi Arabia | 27 | Russia | 0.573248 | Belgium | 0.029745 | Ireland | 0.553297 |
4.3.3Collaboration Network Analysis
Fig. 10
The collaboration network of countries.
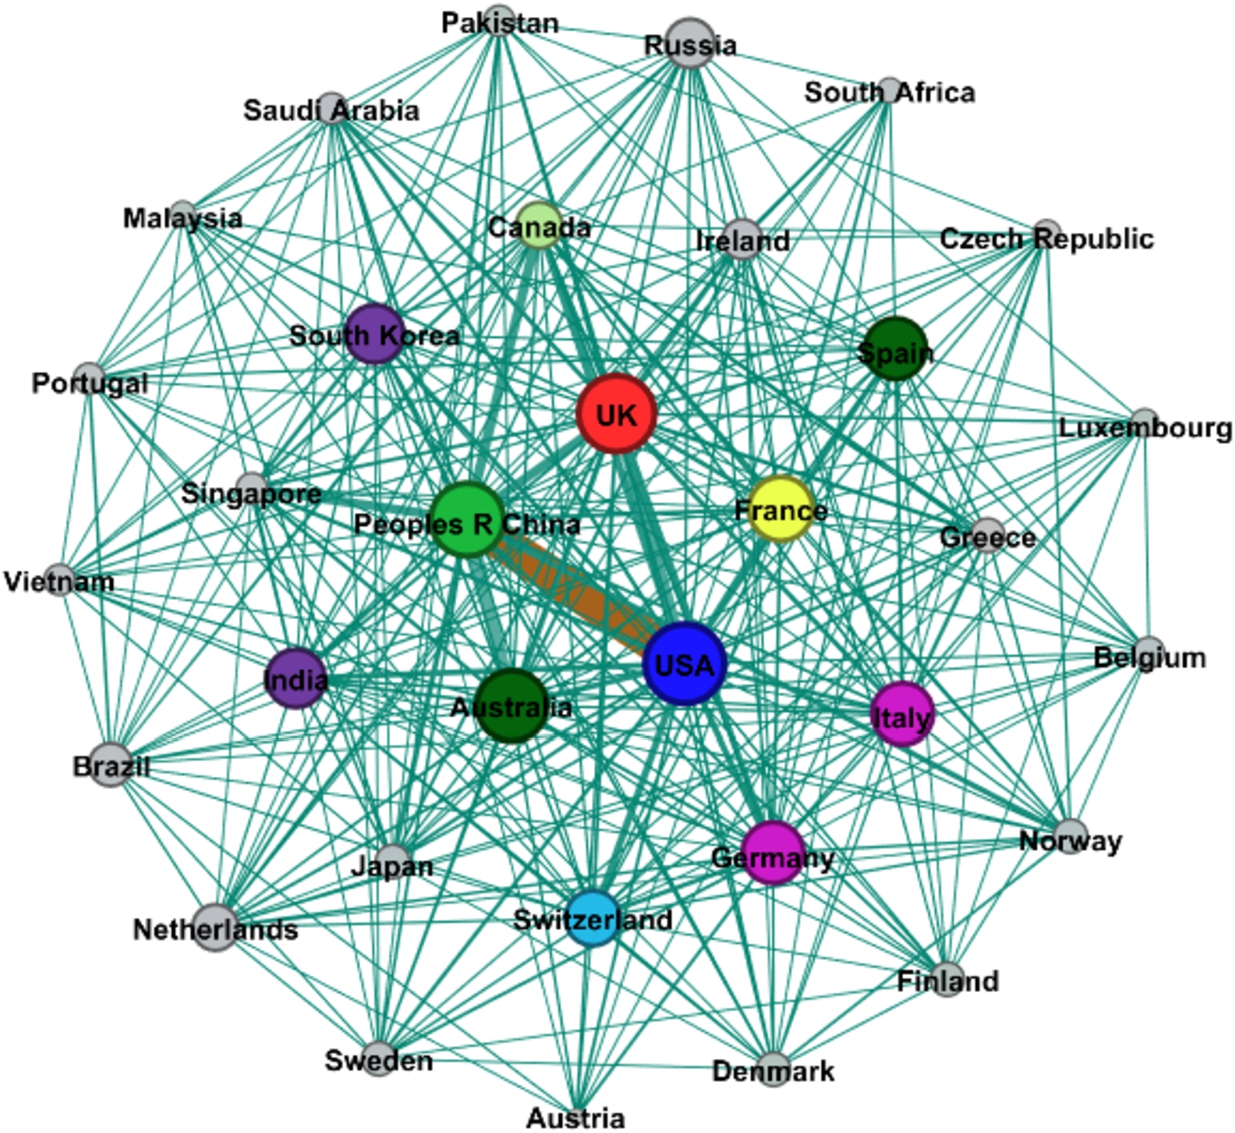
This paper extracts countries with a value of degree centrality being larger than 15 and constructs a country collaboration network which is presented in Fig. 10. The node represents the country and the edge represents the collaborative relationship between two countries. The size of nodes denotes the value of degree centrality and the same colour is the same value of degree. The thickness of lines stands for the collaboration times among countries. There are 33 nodes and 319 edges in the network.
It can be seen from Fig. 10 that there is a close connection among these countries. Countries collaborating with each other frequently are gathered together in the centre of the network. It is obvious that the core countries of network are UK, USA, China and France. These countries also have the highest value of degree centrality. China has the most frequent collaborative relationship with the USA, which is followed by the collaboration between UK and the USA. There is a small collaboration group among China, the USA and UK, which has a relatively high density of collaboration compared with others. Countries in the edge of the network are not connected closely with each other.
5Discussion
Blockchain technology provides a decentralized and distributed transaction environment so that the transaction can be accomplished more securely and efficiently. In recent years, blockchain technology has acquired extensive attention from scholars and practitioners, leading to an enormous increase in the amount of scientific literature in this field. It is important and meaningful to analyse the characteristics and trends of collaboration in a sequential time period based on the large number of articles. This paper uses the methods of bibliometrics and SNA to display the development level and trend from the perspective of collaboration.
The analysis of collaboration characteristics reveals that the number of articles published in the form of collaboration increases sharply especially in the recent years. The collaboration rate of authors, institutions and countries also continue to rise from 2012 to 2019. It indicates that collaboration has become a trend in this field. Three authors’ collaboration are the main form of author collaboration. Five and more authors’ collaboration mode also has a high proportion. Meanwhile, the collaboration between two institutions and countries is their main form of collaboration. This phenomenon demonstrates that authors incline to the big-scale collaboration but they tend to collaborate with researchers who belong to the same institution and country. There is a little difference from the collaboration mode of top 15 most productive authors. These prolific authors not only have a high level of collaboration but also tend to international and inter-institution collaboration. Besides, the collaboration rate of prolific institutions and countries is also significantly higher than the general level of this field. Most of prolific institutions (73.33%) are universities. The institutions of China and the USA account for a large proportion among top 15 prolific institutions. In addition, China and USA rank in the top 2 among top 10 most productive countries but the average citation of American articles is much higher than that of China.
The analysis of overall author collaboration network reveals that the scale of network is gradually enlarging and the connectivity is gradually enhancing. The giant component network has been formed between 2018 and 2019, which has the characteristics of a small world network. This paper also displays the evolution of influential author collaboration network in three phases based on the authors with more than 45 citations. The theme of research has gradually expanded from cryptocurrency to the application of blockchain technology in various domains, promoting the expansion of the network scale and the enhancement of connectivity. The large-scale of the completed subnet has formed in the last phase. However, the interdisciplinary characteristics are also among the causes why just a few authors collaborate with others more than 3 times.
The giant component (58.98%) exists in the institution collaboration network, which conforms to the characteristics of a small world network. The core institution of this field is Chinese Acad Sci., Beihang Univ, Univ Texas San Antonio and Univ Sydney have established a wide range of collaborative relationships, which play an important role in the network. The position of Carnegie Mellon Univ and Univ Elect Sci & Technol China in the network enables them to transfer the information quickly and effectively. In addition, Univ Illinois, CSIRO, Univ Oxford and UCL have a strong ability to control and transmit information. This paper also constructs the collaboration network based on the authors with more than 15 degrees. It can be seen from Fig. 8, Chinese Acad Sci and Univ Chinese Acad Sci have the closest collaborative relationship in the institution collaboration network. Due to this close collaborative relationship, Univ Chinese Acad Sci occupies an important position in the network. Besides, there are 8 clusters extracted from the topic and abstract of articles based on the institution collaboration network. The financial blockchain (#0) and untrusted environment (#1) accept more attention compared with other clusters. However, the topic with less attention among institutions like bitcoin backbone protocol may have more value to be studied in the future.
There is only one giant component in the country collaboration network, accounting for 91.92% of the entire network. The giant component conforms to the characteristics of small world network. USA and UK are the hubs of the network. China has not become the core of network because the betweenness centrality of China is lower than other centrality metrics. Maybe this is why Chinses articles have lower average citations compared with articles of USA and UK. France and Switzerland have a strong ability of controlling and transferring information. In addition, countries like Brazil can increase their influence by collaborating with influential countries. This paper also constructs collaboration network based on the countries with more than 15 degrees. It can be seen from Fig. 10, countries collaborating with each other frequently are gathered together in the centre of network. The small collaboration group constructed by China, the USA and UK has a relatively high density of collaboration compared with other numbers.
6Conclusion
In order to display the degree and the dynamic trend of collaboration in the blockchain field, this paper studies the collaboration characteristics and collaboration network from three levels (author, institution and country) based on the bibliometrics and SNA. Lotka’s law overestimates the authors in this field. It indicates that blockchain as an emerging field still has room for development. The continuous expansion and deepening of research topics have contributed to the growth of collaboration rate. The scale of collaboration network is gradually enlarging and the connectivity is gradually enhancing. This phenomenon indicates that collaboration has become a trend. China, UK and USA occupy an important position. They also have a close collaborative relationship in the network. However, China’s influence and the capability of controlling information are lower than those of UK and USA. It is worth noting that Chinese Acad Sci not only ranks 1st among prolific institutions but also plays a central role in the institution collaboration network. Maybe the development of important institution will improve China’s influence in the future. In general, this paper provides a comprehensive and in-depth overview of the blockchain field. In addition, this paper also provides some references for researchers and policymakers to choose the right research direction and collaboration mode.
There are still some limitations in this article. Firstly, the time period of this article is relatively short, which has the limitation of displaying the development trend and collaboration degree in this field. Secondly, the problem of author name abbreviations has not been solved in this article. Maybe it can be solved in the future studies by programming.
References
1 | Androulaki, E., Barger, A., Bortnikov, V., Cachin, C., Christidis, K., De Caro, A., Enyeart D., Ferris C., Laventman G., Manevich Y., Muralidharan, S. Murthy C., Nguyen B., Sethi M., Singh G., Smith K., Sorniotti A., Stathakopoulou C., Vukolić M., Weed Cocco S., Yellick J. ((2018) ). Hyperledger fabric: a distributed operating system for permissioned blockchains. In: Proceedings of the Thirteenth EuroSys Conference, Porto, Portugal. |
2 | Bastian, M., Heymann, S., Jacomy, M. ((2009) ). Gephi: an open source software for exploring and manipulating networks. In: Proceedings of the Third International ICWSM Conference, 361–362. |
3 | Begušić, S., Kostanjčar, Z., Stanley, H.E., Podobnik, B. ((2018) ). Scaling properties of extreme price fluctuations in Bitcoin markets. Physica A: Statistical Mechanics and its Applications, 510: , 400–406. |
4 | Bouri, E., Azzi, G., Dyhrberg, A.H. (2016). On the return-volatility relationship in the Bitcoin market around the price crash of 2013. Available at SSRN 2869855. https://doi.org/10.2139/ssrn.2869855. |
5 | Bouri, E., Molnár, P., Azzi, G., Roubaud, D., Hagfors, L.I. ((2017) ). On the hedge and safe haven properties of Bitcoin: is it really more than a diversifier? Finance Research Letters, 20: , 192–198. |
6 | Çavuşoğlu, A., Türker, İ. ((2014) ). Patterns of collaboration in four scientific disciplines of the Turkish collaboration network. Physica A: Statistical Mechanics and its Applications, 413: , 220–229. |
7 | Chen, C. ((2006) ). CiteSpace II: detecting and visualizing emerging trends and transient patterns in scientific literature. Journal of the American Society for Information Science and Technology, 57: (3), 359–377. |
8 | Coccia, M., Bozeman, B. ((2016) ). Allometric models to measure and analyze the evolution of international research collaboration. Scientometrics, 108: (3), 1065–1084. |
9 | Dabbagh, M., Sookhak, M., Safa, N.S. ((2019) ). The evolution of blockchain: a bibliometric study. IEEE Access, 7: , 19212–19221. |
10 | Dabi, Y., Darrigues, L., Katsahian, S., Azoulay, D., De Antonio, M., Lazzati, A. ((2016) ). Publication trends in bariatric surgery: a bibliometric study. Obesity Surgery, 26: (11), 2691–2699. |
11 | Esposito, C., De Santis, A., Tortora, G., Chang, H., Choo, K.K.R. ((2018) ). Blockchain: a panacea for healthcare cloud-based data security and privacy? IEEE Cloud Computing, 5: (1), 31–37. |
12 | Firdaus, A., Ab Razak, M.F., Feizollah, A., Hashem, I.A.T., Hazim, M., Anuar, N.B. ((2019) ). The rise of “blockchain”: bibliometric analysis of blockchain study. Scientometrics, 120: (3), 1289–1331. |
13 | Hölbl, M., Kompara, M., Kamišalić, A., Nemec Zlatolas, L. ((2018) ). A systematic review of the use of blockchain in healthcare. Symmetry, 10: (10), 470. |
14 | Huang, H., Chen, X., Wu, Q., Huang, X., Shen, J. ((2018) ). Bitcoin-based fair payments for outsourcing computations of fog devices. Future Generation Computer Systems, 78: , 850–858. |
15 | Juels, A., Kosba, A., Shi, E. ((2016) ). The ring of gyges: Investigating the future of criminal smart contracts. In: Proceedings of the 2016 ACM SIGSAC Conference on Computer and Communications Security, Vienna, Austria. |
16 | Kang, J., Yu, R., Huang, X., Wu, M., Maharjan, S., Xie, S., Zhang, Y. ((2018) ). Blockchain for secure and efficient data sharing in vehicular edge computing and networks. IEEE Internet of Things Journal, 6: (3), 4660–4670. |
17 | Kosba, A., Miller, A., Shi, E., Wen, Z., Papamanthou, C. ((2016) ). Hawk: the blockchain model of cryptography and privacy-preserving smart contracts. In: 2016 IEEE Symposium on Security and Privacy (SP). IEEE, pp. 839–858. |
18 | Lara-Cabrera, R., Cotta, C., Fernández-Leiva, A.J. ((2014) ). An analysis of the structure and evolution of the scientific collaboration network of computer intelligence in games. Physica A: Statistical Mechanics and its Applications, 395: , 523–536. |
19 | Li, Z., Kang, J., Yu, R., Ye, D., Deng, Q., Zhang, Y. ((2017) ). Consortium blockchain for secure energy trading in industrial internet of things. IEEE Transactions on Industrial Informatics, 14: (8), 3690–3700. |
20 | Liang, X., Shetty, S., Tosh, D., Kamhoua, C., Kwiat, K., Njilla, L. ((2017) ). May. Provchain: a blockchain-based data provenance architecture in cloud environment with enhanced privacy and availability. In: 2017 17th IEEE/ACM International Symposium on Cluster, Cloud and Grid Computing (CCGRID). IEEE, pp. 468–477. |
21 | Lotka, A.J. ((1926) ). The frequency distribution of scientific productivity. Journal of the Washington Academy of Sciences, 16: (12), 317–323. |
22 | Mengelkamp, E., Gärttner, J., Rock, K., Kessler, S., Orsini, L., Weinhardt, C. ((2018) ). Designing microgrid energy markets: a case study: the brooklyn microgrid. Applied Energy, 210: , 870–880. |
23 | Merediz-Solà, I., Bariviera, A.F. ((2019) ). A bibliometric analysis of bitcoin scientific production. Research in International Business and Finance, 50: , 294–305. |
24 | Miau, S., Yang, J.M. ((2018) ). Bibliometrics-based evaluation of the Blockchain research trend: 2008–March 2017. Technology Analysis & Strategic Management, 30: (9), 1029–1045. |
25 | Nakamoto, S. (2008). Bitcoin: a peer-to-peer electronic cash system. http://Bitcoin.org/Bitcoin.pdf. |
26 | Paulavičius, R., Grigaitis, S., Igumenov, A., Filatovas, E. ((2019) ). A decade of blockchain: review of the current status, challenges, and future directions. Informatica, 30: (4), 729–748. |
27 | Peng, Y., Shi, J., Fantinato, M., Chen, J. ((2017) ). A study on the author collaboration network in big data. Information Systems Frontiers, 19: (6), 1329–1342. |
28 | Persson, O., Danell, R., Schneider, J.W. ((2009) ). How to use Bibexcel for various types of bibliometric analysis. In: Celebrating Scholarly Communication Studies: A Festschrift for Olle Persson at his 60th Birthday, 9–24. |
29 | Saberi, S., Kouhizadeh, M., Sarkis, J., Shen, L. ((2019) ). Blockchain technology and its relationships to sustainable supply chain management. International Journal of Production Research, 57: (7), 2117–2135. |
30 | Sci2 Team (2009). Science of Science (Sci2) Tool. Indiana University and SciTech Strategies. https://sci2.cns.iu.edu. |
31 | Tosh, D.K., Shetty, S., Liang, X., Kamhoua, C.A., Kwiat, K.A., Njilla, L. ((2017) ). Security implications of blockchain cloud with analysis of block withholding attack. In: 2017 17th IEEE/ACM International Symposium on Cluster, Cloud and Grid Computing (CCGRID). IEEE, pp. 458–467. |
32 | Van Eck, N.J., Waltman, L. ((2010) ). Software survey: VOSviewer, a computer program for bibliometric mapping. Scientometrics, 84: (2), 523–538. |
33 | Wasserman, S., Faust, K. ((1994) ). Social Network Analysis: Methods and Applications. Cambridge University Press, Cambridge. |
34 | Yang, Z., Yang, K., Lei, L., Zheng, K., Leung, V.C. ((2018) ). Blockchain-based decentralized trust management in vehicular networks. IEEE Internet of Things Journal, 6: (2), 1495–1505. |
35 | Yu, D.J., Xu, Z.S., Wang, W. ((2018) ). Bibliometric analysis of fuzzy theory research in China: a 30-year perspective. Knowledge-Based Systems, 141: , 188–199. |
36 | Yu, D.J., Xu, Z.S., Antuchevičienė, J. ((2019) ). Bibliometric analysis of the Journal of Civil Engineering and Management between 2008 and 2018. Journal of Civil Engineering and Management, 25: (5), 402–410. |
37 | Yu, D.J., Xu, Z.S., Wang, X.Z. ((2020) ). Bibliometric analysis of support vector machines research trend: a case study in China. International Journal of Machine Learning and Cybernetics, 11: (3), 715–728. |
38 | Yu, D., Sheng, L. ((2020) ). Knowledge diffusion paths of blockchain domain: the main path analysis. Scientometrics, 125: (1), 471–497. |
39 | Zhou, H., Zhang, X., Hu, Y. ((2020) ). Robustness of open source product innovation community’s knowledge collaboration network under the dynamic environment. Physica A: Statistical Mechanics and its Applications, 540: , 122888. |

