
The Importance of Speckle Tracking Echocardiography Evaluating of Nonobstructive Coronary Artery Stenosis and Its Correlation with Microvascular Angina
Abstract
This study aims to evaluate patients with limited state of changes in coronary arteries detected by coronary angiography, the dynamics of these changes over the two years, identify the relevant diagnostic criteria, and assess the efficacy of applied treatment by using speckle tracking echocardiography. Peak radial and circumferential strain and SR (systolic, early, and late diastolic strains) were measured based on the short-axis view; peak longitudinal strain and SR were measured from the apical side of four- two- and three-chamber views. Radial, longitudinal (GLS), circumferential global and regional strains were calculated as an average of measurements. All patients
1Introduction
Coronary artery disease (CAD) is the most common type of heart disease and a major cause of death and disability in developed countries in both men and women (Roger, 2007). Most of the studies allow that the mortality has gradually declined and touches particularly advanced age population, but several reports have illustrated it still causes about one-third of all deaths in population over 35 years or sometimes earlier (Rosamond et al., 2008; Nichols et al., 2014). According to a report of AHA for people aged 40 years, the lifetime risk of developing CAD was 49% in men and 32% in women whereas for those reaching 70 years, the lifetime risk was 35% in men and 24% in women, respectively (Sanchis-Gomar et al., 2016). Goyal and Yusuf reported that CAD mortality was expected to increase by approximately 29% in women and 48% in men in developed countries between 1990 and 2020 (Goyal and Yusuf, 2006). The main specific reasons for such worsening epidemiologic situation are the rapid increase of globalization, urbanization, aging of society, growing rate of chronic and systemic diseases, closely associated with developing of CAD (Horton, 2015; Danaei et al., 2013).
CAD, which is often defined as silent ischemia, for some reason has increasingly become asymptomatic or atypically expressed which can lead to more serious manifestations such as MI or sudden death. As a rule, this category of patients does not fall into the view of cardiologists. Patients who show entirely expressed positive CAD symptoms routinely receive electrocardiograms, exercise tests, 24-hour ECG recordings, and standard echocardiography. In the case of positive main CAD tests, the invasive coronary artery angiography (CAA) procedure is recommended as a golden standard since it has a possibility to precisely verify or exclude CAD diagnosis. However, a real problem exists with patients who possess limited coronary artery damage (stenosis range <70%) and who are clinically quite problematic, but do not receive adequate and sufficient attention of clinicians. There are only a few papers on the importance and dynamics of clinical status of such a category as well as treatment strategy and its effectiveness control. In this regard, echocardiography could be the most common cardiac imaging technique for patients with suspected cardiac disease to assess cardiac function and status. But ordinary echocardiography at rest provides undervalued information in the presence of CAD in patients suspected of having stable angina pectoris (SAP) (Vanoverschelde and Goffinet, 2007).
We focused our attention on speckle tracking echocardiography (STE) as a non-invasive method that could be more informative for the assessment of global and regional left ventricular myocardial function. STE offers the opportunity to evaluate myocardial deformation independently of both cardiac translation and the insonation angle (Teske et al., 2007). Strain and strain rate (SR) describe the amount and rate of deformation of the myocardium throughout the cardiac cycle and it can be qualified as more sensitive descriptors of regional myocardial function comparing with conventional measures of myocardial function. Therefore, our study aimed to evaluate patients with limited state of changes in coronary arteries detected by CAA, discard the dynamics of these changes over the 2 years, identify the relevant diagnostic criteria and assess the efficacy of applied treatment by using STE method.
2Material and Methods
2.1Study Population
Study population consists of patients who visited the Department of Cardiology of Lithuanian University of Health Sciences Clinical Hospital from 2012 to 2017. Initially, 151 patients were enrolled in the study: 80 males and 71 females (mean age: 62.36 ± 9.6). They were selected according to the following inclusion criteria: verified diagnosis of SAP, no previous evaluation of CAD by CAA or coronary artery computer tomography, no significant cardiac valve pathology, no other systemic diseases except dyslipidemia or arterial hypertension. Borderline range of coronary artery stenosis (<70%) was established and verified by CAA on this particular case. In 5 cases echocardiographic images were not suitable for evaluation due to high rates of obesity or other specific characteristics, so these patients were excluded from further study. After the 2 years’ period, 128 patients from the first group repeated clinical visits for a 2D-strain echocardiography investigation. The contact with the rest of the patients was lost due to various reasons.
2.2Two-Dimensional Strain Echocardiography
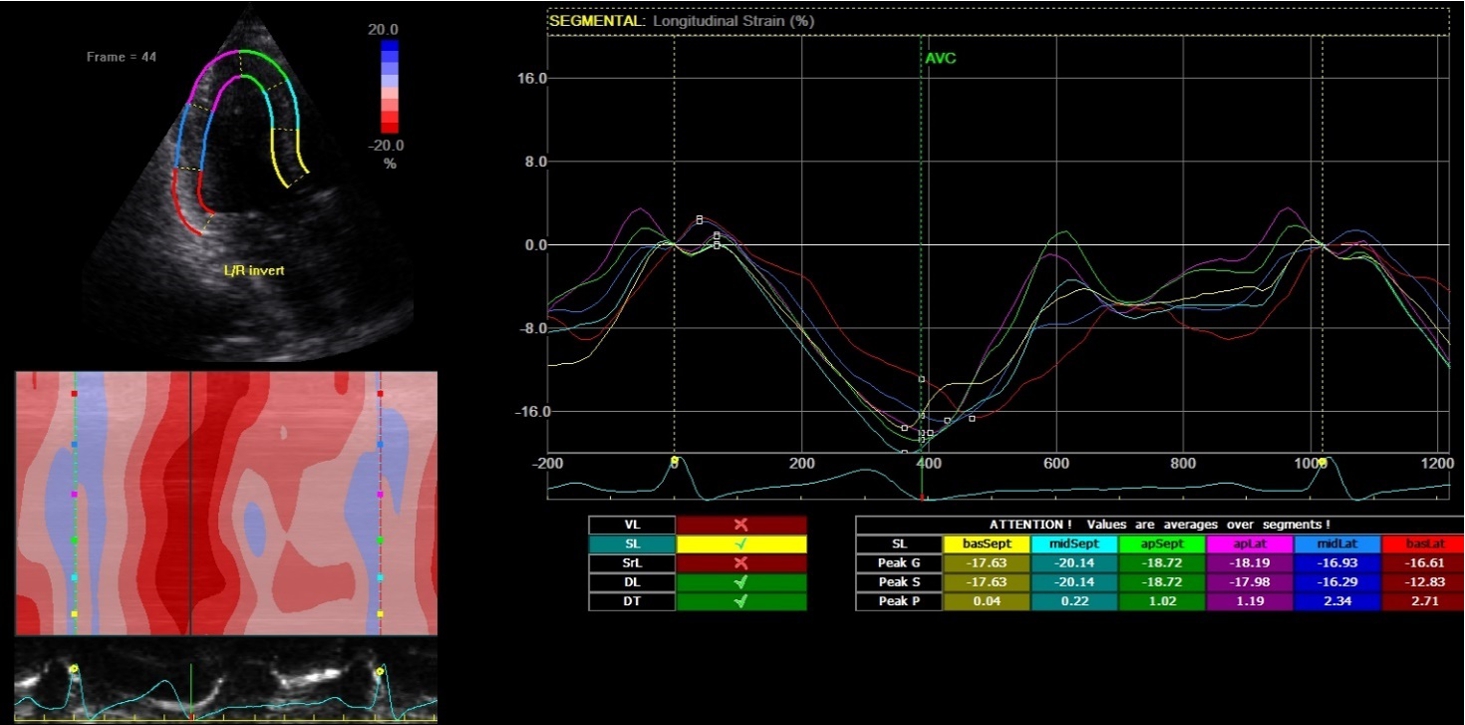
2D-echocardiography measurement was performed at rest in the left lateral decubitus position, using the Vivid 7 device (General Electrical-Vingmed Ultrasound AS, Horten, Norway) with 3.5 MHz transducers. Strain analysis was done by one investigator who was blinded to the results of the CAA examinations by using automated software Echo-PAC (GE Healthcare). The examination included standard measurements: left ventricular posterior wall (LVPW), left ventricular interventricular wall (LVIW), left ventricular end-diastolic diameter (LVEDD), left ventricular end-systolic diameter (LVESD), left ventricular end-diastolic volume (LVEDV), left ventricular end-systolic volume (LVESV), left ventricular ejection fraction (LVEF), early diastolic trans-mitral flow velocity (E), atrial systolic velocity (A), early diastolic mitral annular velocity (e′). 3 consecutive beats from standard positions (short axis, long axis, 4-chambers, 3-chambers, and 2-chambers views) were used for evaluation. Two-dimensional grayscale images were obtained at a frame rate of 60–80 Hz. According to the latest guidelines, we also measured strain and strain rate (SR) (Danaei et al., 2013). The investigator traced the LV endocardium manually, therewith it was tracked by the standard software automatically. Peak radial and circumferential strain and SR (systolic, early and late diastolic) were measured based on the short-axis view (Fig. 1) peak longitudinal strain and SR were measured based on apical four- (Fig. 2), two- and three-chamber views. Radial, longitudinal (GLS), circumferential global and regional strains were calculated as an average of measurements.
Fig. 1
Two-dimensional strain echocardiography, short-axis view.
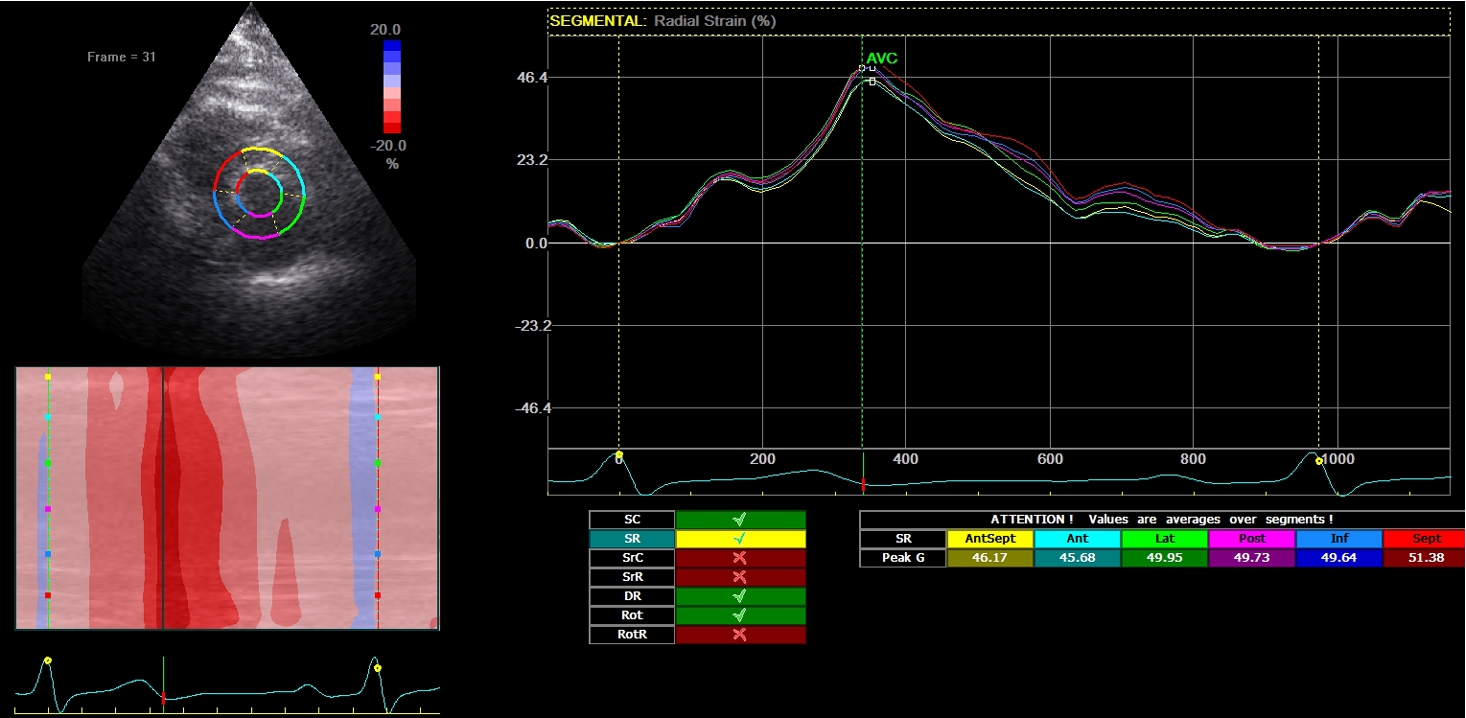
Fig. 2
Two-dimensional strain echocardiography, four-chamber view.
2.3Coronary Angiography (CAA) Investigation
CAA was performed using the percutaneous radial or femoral approach and the standard protocol. Each coronary artery (LAD – left anterior descending, LCX – left circumflex artery, and RCA-right coronary artery) were visualized in ⩾2 projections. Range of stenosis established by using quantitative CAA evaluation method: measuring was done by comparing the area of the narrowing to an adjacent normal segment and as a percentage reduction calculated in the projection, which demonstrates the narrowest place. Analysis of the angiograms was performed visually by 2 experienced (over 5 years’ experience) operators who were blinded to the results of the echocardiographic examinations. For patients enrolled in the CAD group, FFR was performed for more accurate verification. IVUS-VH was performed in 4 cases with suspected unstable plaque.
2.4Statistical Methods and Analysis
Statistical analysis was performed with SPSS 22.0 software package. The Kolmogorov–Smirnov test was used to test the normality of distribution. The main results were expressed as the mean value and standard deviation (m ± SD). Mann-Whitney test was used to compare continuous variables between two categorical data groups. Continuous variables with a normal distribution were compared using Student’s t-test. A one-way ANOVA with a posthoc Bonferroni analysis was used in CAD patients’ groups to see whether the patient groups differed between themselves and compared to the control group. ROC (Receiver Operating Characteristic) curve was used to estimate the sensitivity and specificity of the cut-off point of STE parameters. Categorical data were compared by using the chi-square test, when
2.5Ethics
Lithuanian Bioethics Committee permit No. 1 (version 1, Nr. BE-2-31, 2013-12-05) was issued for this study.
3Results
3.1Epidemiologic Characteristics of the Study Population
After the final exclusion, 146 patients were enrolled in the study. Table 1 presents the baseline characteristics of the study population. According to the CAA findings, patients were divided into two groups: for 120 patients the coronary artery stenosis (CAD group) was determined, whereas 26 patients had no stenosis (control group). The data in Table 1 indicate that both groups were consistent enough with the spectrum of the features under consideration.
Table 1
The baseline epidemiologic characteristics of the study population. BMI – body mass index; CCSC – Canadian cardiovascular society classification.
| Characteristic | Control group | CAD group | p-value |
| Gender male n (%) | 11 (42.31) | 64 (53.33) | 0.3 |
| Age | 60.84 ± 9.2 | 62.65 ± 9.6 | 0.38 |
| History of hypertension n (%) | 23 (92) | 112 (94.12) | 0.85 |
| History of smoking: | |||
| Current n (%) | 8 (36.36) | 29 (27.62) | 0.54 |
| Previous n (%) | 3 (13.64) | 8 (7.62) | 0.75 |
| No smoker | 15 (50) | 83 (64.67) | 0.36 |
| Family history of CAD n (%) | 6 (30) | 11 (11.58) | 0.1 |
| BMI: | 28.04 ± 4.68 | 30.14 ± 5.55 | 0.07 |
| Angina pectoris (CCSC) class | |||
| Class I n (%) | 8 (32) | 9 (7.56) | 0.23 |
| Class II n (%) | 14 (56) | 88 (73.95) | 0.42 |
| Class III n (%) | 2 (8) | 22 (18.49) | 0.53 |
| Dyslipidemia, n (%) | 21 (84) | 100 (84.03) | 0.08 |
| Lipogram: | |||
| Cholesterol | 4.24 ± 3.22 | 4.42 ± 2.85 | 0.77 |
| Low-density lipoprotein (LDL) | 2.44 ± 2.07 | 2.48 ± 2.1 | 0.93 |
| High-density lipoprotein (HDL) | 1.04 ± 1 | 0.86 ± 0.78 | 0.31 |
| Triglycerides | 0.9 ± 0.85 | 1.14 ± 1.19 | 0.33 |
| Medication: | |||
| β-Blockers n (%) | 20 (80) | 93 (81.58) | 0.28 |
| Calcium channel blockers n (%) | 9 (36) | 36 (32.43) | 0.37 |
| Angiotensin II receptor blockers (ARBs) n (%) | 22 (91.67) | 107 (93.04) | 0.25 |
| Diuretics n (%) | 4 (16) | 29 (25.44) | 0.31 |
| Another antihypertensive agent n (%) | 3 (12) | 23 (20.18) | 0.14 |
| Platelet inhibitor n (%) | 21 (84) | 109 (91.60) | 0.24 |
| Statins n (%) | 22 (88) | 94 (82.46) | 0.27 |
| Nitrates n (%) | 2 (8) | 13 (11.40) | 0.48 |
| Trimetazidine dihydrochloride n (%) | 5 (20) | 19 (16.81) | 0.64 |
3.2CAA Findings
Summarized cardiac angiography observations are presented in Table 2. Control group
Table 2
Angiography findings.
| Control group | CAD group | |
| Number of diseased vessels: | ||
| 1-vessel disease n (%) | 0 | 48 (40) |
| 2-vessel disease n (%) | 0 | 46 (38.33) |
| 3-vessel disease n (%) | 0 | 26 (21.67) |
| Diseased vessel projection: | ||
| LM stenosis n (%) | 0 | 2 (1.66) |
| LAD stenosis n (%) | 0 | 103 (85.83) |
| LCX stenosis n (%) | 0 | 49 (40.83) |
| RCA stenosis n (%) | 0 | 63 (52.50) |
Most (about 80%) of the patients (Table 2) had one or two-vessel disease and only 20% had systemic all three-vessel disease. We found no clear correlation between the concentrations of cholesterol, LDH, HDL, and triglycerides, and the number of diseased vessels, which could be an important factor in coronary artery pathology developing, but we believe that this has been undermined by inadequate patient sampling.
3.3Echocardiographic Data
We divided all measurements into three groups according to the area of a coronary artery: RCA, LAD, and LCX. Basic echocardiographic measurements are shown in Table 3.
Table 3
Standard echocardiographic findings. LVEDD – left ventricular end-diastolic diameter; LVESD – left ventricular end-systolic diameter; LVEF – left ventricular ejection fraction; LVPW – left ventricular posterior wall; IVSW – interventricular septum wall; E – early diastolic transmitral flow velocity; A – atrial systolic velocity; e′ – early diastolic mitral annular velocity.
| Control group | CAD group | |||||
| I visit | II visit | p-value | I visit | II visit | p-value | |
| LVEDD (mm) | 47.08 ± 5.15 | 46.72 ± 5.35 | 0.836 | 46.01 ± 8.17 | 45.9 ±8.0 | 0.933 |
| LVESD (mm) | 32.96 ± 5.74 | 32.18 ± 6.28 | 0.78 | 32.5 ± 6.10 | 31.6 ±6.3 | 0.37 |
| LVEF (%) | 60.95 ± 5.93 | 64.0 ± 6.99 | 0.16 | 61.20 ± 4.96 | 61.7 ±5.8 | 0.595 |
| LVPW (mm) | 10.15 ± 1.42 | 10.23 ± 1.73 | 0.878 | 10.09 ± 1.68 | 10.4 ±1.6 | 0.323 |
| IVSW (mm) | 9.96 ± 1.75 | 10.28 ± 2.2 | 0.625 | 10.34 ± 1.82 | 10.5 ±2.0 | 0.561 |
| E peak rate (m/s) | 64.7 ± 10.32 | 51.07 ± 1.72 | 0.21 | 65.65 ± 14.5 | 56.8 ± 34.5 | 0.481 |
| A peak rate (m/s) | 68.8 ± 13.66 | 70.35 ±13.05 | 0.727 | 70.79 ± 17.1 | 74.7 ± 15.2 | 0.136 |
| e′ lateral (m/s) | 0.1 ± 0.031 | 0.1 ± 0.025 | 0.99 | 0.1 ± 0.029 | 1.69 ± 13.4 | 0.27 |
| e′ septal (m/s) | 0.08 ± 0.014 | 0.085 ± 0.0 | 0.364 | 0.08 ± 0.02 | 0.08 ± 0.02 | 0.563 |
From the analysis of standard echocardiographic parameters we found no statistically significant difference in all measured parameters in neither control nor CAD groups.
3.3.1Right Coronary Artery (RCA)
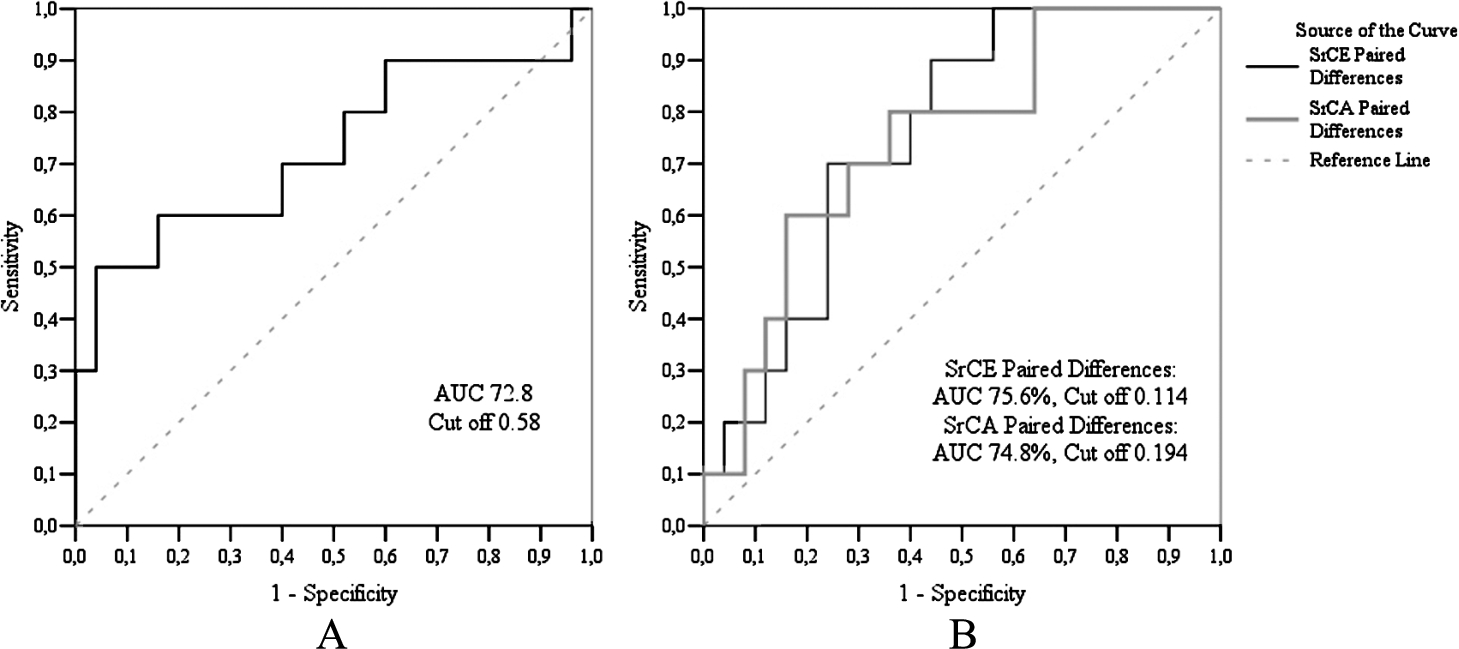
Echocardiographic measurements data are presented in Table 4. During the two years, in the case of the control group, we found statistically significant changes only in myocardial circumferential strain, while in the case of the CAD group, in late diastolic circumferential strain rates. Having compared the changes between the control and CAD groups, we observed statistically significant changes in systolic circumferential, early diastolic, and late diastolic circumferential strain rates. ROC curve analysis (Fig. 3) showed that the sensitivity of circumferential systolic strain rate was 96.0%, and specificity – 50.0%. The sensitivity of circumferential early diastolic strain rate was 56.0%, specificity – 90.0%, meanwhile, circumferential late diastolic strain rate sensitivity was 64.0%, and specificity – 79.9%, respectively.
Table 4
Echocardiographic measurements RCA.
| Control group | CAD group | **p-value | |||||
| I visit | II visit | *p-value | I visit | II visit | *p-value | ||
| Myocardial strain % (GLS) | |||||||
| Longitudinal strain | −17.87 ± 1.13 | −17.45 ± 0.95 | 0.638 | −17.6 ± 0.66 | −16.16 ± 0.81 | 0.079 | 0.429 |
| Circumferential strain | −22.12 ± 1.92 | −18.06 ± 1.35 | 0.037 | −17.59 ± 0.99 | −17.17 ± 1.57 | 0.638 | 0.323 |
| Radial strain | 27.34 ± 4.22 | 28.31 ± 4.69 | 0.959 | 29.54 ± 3.14 | 32.43 ± 3.17 | 0.809 | 0.916 |
| Systolic strain rate/s | |||||||
| Longitudinal strain rate | −1.03 ± 0.06 | −1.05 ± 0.08 | 0.937 | −1.03 ± 0.03 | −1.02 ± 0.05 | 0.751 | 0.838 |
| Circumferential strain rate | −1.89 ± 0.09 | −1.64 ± 0.16 | 0.241 | −1.68 ± 0.08 | −1.89 ± 0.11 | 0.128 | 0.037 |
| Radial strain rate | 2.37 ± 0.3 | 2.63 ± 0.36 | 0.638 | 2.56 ± 0.27 | 3.16 ± 0.44 | 0.084 | 0.54 |
| Early diastolic strain rate/s | |||||||
| Longitudinal strain rate | 1.17 ± 0.06 | 1.15 ± 0.05 | 0.875 | 1.05 ± 0.04 | 1.03 ± 0.06 | 0.713 | 0.789 |
| Circumferential strain rate | 2.22 ± 0.18 | 1.83 ± 0.17 | 0.059 | 1.83 ± 0.13 | 2.03 ± 0.14 | 0.122 | 0.019 |
| Radial strain rate | −2.29 ± 0.41 | −2.66 ± 0.27 | 0.424 | −2.47 ± 0.2 | −3.18 ± 0.43 | 0.248 | 0.975 |
| Late diastolic strain rate/s | |||||||
| Longitudinal strain rate | 1.16 ± 0.05 | 1.28 ± 0.09 | 0.071 | 1.24 ± 0.05 | 1.18 ± 0.06 | 0.551 | 0.136 |
| Circumferential strain rate | 1.4 ± 0.09 | 1.25 ± 0.14 | 0.445 | 1.14 ± 0.07 | 1.58 ± 0.14 | 0.007 | 0.024 |
| Radial strain rate | −1.88 ± 0.29 | −1.73 ± 0.28 | 0.695 | −1.77 ± 0.25 | −2.18 ± 0.31 | 0.361 | 0.53 |
*p-value by parametric Paired Samples Test or non-parametric Wilcoxon Signed Ranks Tests between I and II visit.
**p-value by parametric Test or non-parametric Mann-Whitney test (between Control and CAD groups paired differences).
Fig. 3
ROC analysis of RCA echography findings. A – ROC curve of circumferential systolic strain rate, B – ROC curve of circumferential early diastolic and circumferential late diastolic strain rates.
3.3.2Left Anterior Descending Coronary Artery (LAD)
Schematic evaluation of parameters are represented in Table 5. There were no statistically significant changes in the control group by STE during a two-year observation period. The same was observed having compared data between control and CAD groups. However, we found statistically significant differences that reflect function improvement of these parameters inside the CAD group: myocardial longitudinal strain, systolic longitudinal and circumferential strain rates, early diastolic circumferential, and late diastolic longitudinal strain rates.
Table 5
Echocardiographic measurements LAD.
| Control group | CAD group | **p-value | |||||
| I visit | II visit | *p-value | I visit | II visit | *p-value | ||
| Myocardial strain % (GLS) | |||||||
| Longitudinal strain | −19.4 ± 0.58 | −19.61 ± 0.89 | 0.534 | −18.88 ± 0.48 | −20.52 ± 0.57 | 0.006 | 0.211 |
| Circumferential strain | −27.11 ± 3.0 | −24.27 ± 1.68 | 0.208 | −24.32 ± 0.99 | −26.58 ± 0.94 | 0.181 | 0.071 |
| Radial strain | 20.73 ± 3.36 | 22.39 ± 2.42 | 0.515 | 26.53 ± 1.9 | 29.87 ± 2.52 | 0.25 | 0.983 |
| Systolic strain rate/s | |||||||
| Longitudinal strain rate | −1.2 ± 0.05 | −1.21 ± 0.09 | 0.657 | −1.17 ± 0.03 | −1.26 ± 0.03 | 0.038 | 0.224 |
| Circumferential strain rate | −2.22 ± 0.13 | −2.04 ± 0.12 | 0.214 | −2.05 ± 0.08 | −2.3 ± 0.09 | 0.012 | 0.084 |
| Radial strain rate | 2.01 ± 0.27 | 2.44 ± 0.22 | 0.285 | 2.96 ± 0.21 | 3.27 ± 0.23 | 0.206 | 0.953 |
| Early diastolic strain rate/s | |||||||
| Longitudinal strain rater | 1.51 ± 0.06 | 1.4 ± 0.1 | 0.248 | 1.41 ± 0.05 | 1.42 ± 0.05 | 0.886 | 0.284 |
| Circumferential strain rate | 2.41 ± 0.24 | 2.31 ± 0.15 | 0.678 | 2.2 ± 0.09 | 2.52 ± 0.09 | 0.005 | 0.251 |
| Radial strain rate | −1.66 ± 0.25 | −2.42 ± 0.32 | 0.074 | −2.63 ± 0.12 | −3.08 ± 0.23 | 0.067 | 0.605 |
| Late diastolic strain rate/s | |||||||
| Longitudinal strain rate | 1.28 ± 0.07 | 1.35 ± 0.1 | 0.894 | 1.16 ± 0.05 | 1.27 ± 0.04 | 0.037 | 0.793 |
| Circumferential strain rate | 1.74 ± 0.11 | 1.53 ± 0.18 | 0.314 | 1.49 ± 0.07 | 1.62 ± 0.08 | 0.091 | 0.11 |
| Radial strain rate | −1.58 ± 0.18 | −1.52 ± 0.26 | 0.646 | −1.87 ± 0.14 | −2.22 ± 0.26 | 0.32 | 0.508 |
*p-value by parametric Paired Samples Test or nonparametric Wilcoxon Signed Ranks Tests between I and II visits.
**p-value by parametric T-Test or nonparametric Mann-Whitney test (between Control and CAD groups paired differences).
3.3.3Left Circumflex Coronary Artery (LCX)
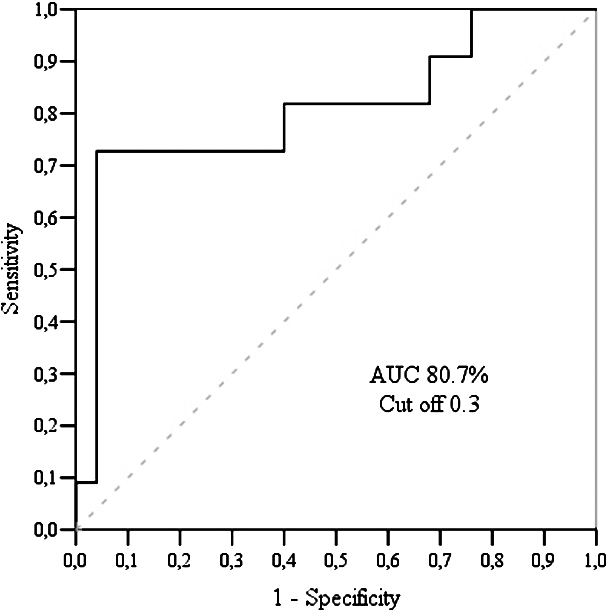
There was a statistically significant difference between early and late diastolic longitudinal strain rates inside the control group, and myocardial longitudinal strain, inside the CAD group (Table 6). Having analysed data between the groups, significant difference was determined in early diastolic longitudinal strain rate with sensitivity – 96.0% and specificity – 72.7% (Fig. 4).
We do not find a statistically significant difference between patients with single-vessel disease vs two-vessel disease and multivessel disease regarding STE data.
Table 6
Echocardiographic measurements LCX.
| Control group | CAD group | **p-value | |||||
| I visit | II visit | *p-value | I visit | II visit | *p-value | ||
| Myocardial strain % (GLS) | |||||||
| Longitudinal strain | −17.63 ± 1.49 | −19.73 ± 0.94 | 0.286 | −17.9 ± 0.87 | −19.78 ± 0.86 | 0.049 | 0.972 |
| Circumferential strain | −16.39 ± 2.47 | −12.63 ± 2.66 | 0.374 | −16.62 ± 1.23 | −14.04 ± 1.42 | 0.192 | 0.706 |
| Radial strain | 25.39 ± 4.41 | 28.85 ± 4.69 | 0.646 | 28.81 ± 4.17 | 35.01 ± 4.32 | 0.351 | 0.826 |
| Systolic strain rate/s | |||||||
| Longitudinal strain rate | −1.2 ± 0.06 | −1.33 ± 0.06 | 0.182 | −1.22 ± 0.05 | −1.3 ± 0.05 | 0.098 | 0.548 |
| Circumferential strain rate | −1.82 ± 0.15 | −1.77 ± 0.14 | 0.878 | −1.8 ± 0.11 | −1.96 ± 0.13 | 0.191 | 0.422 |
| Radial strain rate | 2.29 ± 0.3 | 2.69 ± 0.32 | 0.239 | 2.54 ± 0.25 | 3.02 ± 0.35 | 0.123 | 1.0 |
| Early diastolic strain rate/s | |||||||
| Longitudinal strain rate | 1.27 ± 0.11 | 1.72 ± 0.13 | 0.013 | 1.46 ± 0.07 | 1.47 ± 0.07 | 0.809 | 0.004 |
| Circumferential strain rate | 2.05 ± 0.24 | 1.82 ± 0.21 | 0.508 | 1.92 ± 0.12 | 2.0 ± 0.08 | 0.478 | 0.899 |
| Radial strain rate | −2.41 ± 0.44 | −2.65 ± 0.26 | 0.308 | −2.31 ± 0.22 | −2.92 ± 0.37 | 0.291 | 0.885 |
| Late diastolic strain rate/s | |||||||
| Longitudinal strain rate | 1.1 ± 0.12 | 1.33 ± 0.06 | 0.033 | 1.13 ± 0.07 | 1.19 ± 0.05 | 0.333 | 0.471 |
| Circumferential strain rate | 1.3 ± 0.14 | 1.31 ± 0.11 | 0.646 | 1.27 ± 0.08 | 1.33 ± 0.12 | 0.532 | 0.933 |
| Radial strain rate | −2.12 ± 0.27 | −1.79 ± 0.28 | 0.48 | −1.74 ± 0.25 | −1.99 ± 0.26 | 0.067 | 0.331 |
*p-value by parametric Paired Samples Test or non-parametric Wilcoxon Signed Ranks Tests between I and II.
**p-value by parametric T-Test or non-parametric Mann-Whitney test (between Control and CAD groups paired differences).
Fig. 4
LCX echography findings: ROC curve analysis of longitudinal early diastolic strain rate.
4Discussion
SAP has become a significant medical problem within the community, although it receives less attention in general cardiology practice. The principal objectives in the management of SAP to both acute and chronic forms mainly include the prevention of great cardiac events and the improvement of health status (Beltrame, 2017). Clinically, SAP patients have three key components: angina symptoms, various functional limitations, and poor health quality, and each of these components is directly related to MI or mortality, therefore the importance of evaluating these patients is obvious, especially considering the chronic nature of the disease (Beltrame, 2017). In this regard, LVEF is the most commonly used echocardiographic parameter to assess cardiac function and status in cardiology, where it is essential to guide therapy and for prognostication (Yeboah et al., 2016). Still, echocardiography as a “gold standard” image modality is recommended for assessment of patients in SAP, but it has limitations including high inter- and intra-observer variability. In our study, both control and CAD group patients had LVEF ⩾60%, so according to the value judgment, whey were “clinically normal”. But in the study, over 80% of both group patients had some symptoms of myocardial ischemia. Looking from the clinical perspective, STE has already been used for assessing ischemia-related myocardial and systemic diseases, where it can predict probable subclinical cardiac disorder earlier in the course of the disease, when conventional 2D echocardiography appears to be normal (Aggeli et al., 2015). STE should provide more information on the rate of segmental and global myocardial deformation such as factors for early cardiac pathology detection, herewith this method has been systematically validated to sonomicrometry, tagged MRI and colour-coded tissue Doppler echocardiography (Vanoverschelde and Goffinet, 2007; Amundsen et al., 2006).
GLS is useful for detecting both significant and limitary (⩽70%) coronary artery stenosis during stress tests even at rest (Rosamond et al., 2008; Biering-Sørensen et al., 2014). It provides an insight into the longitudinal, circumferential, and radial mechanics of the heart and valuable insights to myocardial deformation by quantifying strain and torsion with the inherent advantage of being angle-independent (Nesbitt et al., 2009; Huang and Orde, 2013). According to Biering-Sorensen, GLS can identify which concrete coronary artery suffers from significant stenosis. GLS was significantly lower in patients with CAD compared to patients without CAD and remained an independent predictor of CAD after multivariable adjustment for baseline data, exercise ECG and conventional echocardiographic parameters (Biering-Sørensen et al., 2013). Interestingly, longitudinally orientated myocardial fibres are located on subendocardial layers, the area most susceptible to ischemia, that is why measurements of longitudinal motion and deformation may be the most sensitive markers of CAD using tissue Doppler imaging (TDI) or 2-dimensional strain echocardiography (2DSE) (Biering-Sørensen et al., 2014; Hoffmann et al., 2012). We found an improvement of parameters in GLS longitudinal strain (LAD and LCX) on CAD and GLS circumferential strain in control groups, respectively. The vast majority of studies show the benefits of STE in identifying early CAD features when the results of other studies are uncertain. In opposite, the main findings of our study demonstrate that STE at rest is not suitable for the evaluation of the hemodynamical significance of coronary artery stenosis which is smaller than 70%. During an observation period of 2 years, we detected an improvement of measured parameters of STE. It means that the clinical condition of our patients over the two years has improved in both control and CAD groups. We, therefore, speculate that microvascular angina (MVA) may be responsible for this. Many patients at the initial stage of SAP and evidence of myocardial ischemia do not have a detectable or significant range of coronary atherosclerosis at CAA. Primary stable MVA defines patients with SAP, positive stress test results, and angiographically normal coronary arteries (Montalescot et al., 2013). The origin of MVA leading to functional abnormalities of coronary resistive vessels is not yet determined because of the heterogeneous entity and multiple pathophysiological mechanisms. Depending on the pathogenetic mechanism, there are 4 types of clinical classification of coronary microvascular dysfunction (CMD) according to the original classification proposed by Camici and Crea (Camici and Crea, 2007). Standardized diagnostic clinical criteria for evaluation of MVA are as follows: (1) symptoms of myocardial ischemia, (2) absence of obstructive CAD (<50% diameter reduction or FFR > 0.80), (3) objective evidence of myocardial ischemia and (4) evidence of impaired coronary microvascular function (Ong et al., 2018). Definitively, MVA is diagnosed if all four criteria are present. Suspected MVA (sMVA) is diagnosed if symptoms of ischemia are present (criteria-1) with no obstructive coronary artery disease (criteria-2) but only objective evidence of myocardial ischemia (criteria-3), or evidence of impaired coronary microvascular function (criteria-4) alone, respectively (Ong et al., 2018). In our study, all patients both in control and CAD groups had evidence of three criteria mentioned above. These findings could be partially explained by the suitable treating of sMVA. Angina caused by coronary microvascular dysfunction in a sizeable proportion of patients undergoing CAA for anginal symptoms is found to show normal coronary arteries or nonobstructive CAD (stenosis <70%). For many years, there was uncertainty regarding the real significance of anginal symptoms that are accompanied by electrocardiographic evidence of ischemia during stress. In 1988, Cannon and Epstein demonstrated that compared with asymptomatic controls, in patients with chest pain and on CAA normal coronary arteries the coronary microcirculation has a heightened sensitivity to vasoconstrictor stimuli and a limited microvascular vasodilator capacity during atrial pacing which is allusive with the presence of MVA. The main goal of treatment of MVA is global risk factor control and anti-anginal treatment possibly targeting both large epicardial coronary arteries and coronary microcirculation (Crea et al., 2014). Common treatment mainly includes ACE inhibitors, statins, B-blockers, Ca channel blockers, antithrombotic, and nitrates. All our groups’ patients had this treatment during the two years (Table 1). In our opinion, this fact has led to an improvement of STE. Even though drugs can help alleviate symptoms, many patients still have refractory symptoms, and treatment of these patients remains challenging. Atherosclerosis of small coronary arteries and its’ caused MVD affects myocardial longitudinal strain. Our study has shown that measurements of longitudinal strain could be useful when evaluating dynamic of myocardial function in SAP with nonobstructive coronary arteries.
Patients with MVD had significantly impaired diastolic function compared with healthy individuals. Moreover, improvement in GLS (−18.88 ± 0.48% vs. −20.52 ± 0.57%;
5Conclusions
The main findings of our study demonstrate that STE is suitable for the evaluation of the hemodynamical and clinical significance of limitary nonobstructive coronary artery stenosis (less than 70%). STE should provide more information on the rate of segmental and global myocardial deformation such as factors for early selective cardiac pathology detection. Microvascular angina may be important for the health status of patients at the initial stage of SAP, since evidence of myocardial ischemia is not detectable in CAA. STE could be informative and effective for evaluation and adequate treatment of patients at different stages of CAD.
6Limitation
The limitations of this study are as follows. First, the main focus was not only to evaluate asymptomatic patients with limited changes in coronary arteries but to determine selective and typical findings of STE, which could be informative diagnostic and adequate treatment criteria meaning that it is simple, quick, and noninvasive. Second, the presence of MVA still must be confirmed by other examinations. Third, relatively small number of patients were enrolled. Nonetheless, we will continue to do this research in the future, in particular by increasing the number of patients being examined and making a better patient selection.
References
1 | Aggeli, C., Lagoudakou, S., Felekos, I., Panagopoulou, V., Kastellanos, S., Toutouzas, K., Roussakis, G., Tousoulis, D. ((2015) ). Two-dimensional speckle tracking for the assessment of coronary artery disease during dobutamine stress echo: clinical tool or merely research method. Cardiovascular Ultrasound, 13: , 43. |
2 | Amundsen, B.H., Helle-Valle, T., Edvardsen, T., Torp, H., Crosby, J., Lyseggen, E., Støylen, A., Ihlen, H., Lima, J.A.C., Smiseth, O.A., Slørdahl, S.A. ((2006) ). Noninvasive myocardial strain measurement by speckle tracking echocardiography: validation against sonomicrometry and tagged magnetic resonance imaging. Journal of the American College of Cardiology, 47: (4), 789–793. |
3 | Beltrame, J. ((2017) ). Impact of chronic stable angina on health status. Medicographia, 39: (1), 11–16. |
4 | Biering-Sørensen, T., Hoffmann, S., Mogelvang, R., Iversen, A.Z., Galatius, S., Fritz-Hansen, T., Bech, J., Jensen, J.S. ((2014) ). Myocardial strain analysis by 2-dimensional speckle tracking echocardiographyimproves diagnostics of coronary artery stenosis in stable angina pectoris. Circ Cardiovasc Imaging, 7: (1), 58–65. |
5 | Biering-Sørensen, T. Hoffmann, S., Mogelvang, R., Zeeberg Iversen, A., Galatius, S., Fritz-Hansen, T., Bech, J., Jensen, J.S. ((2013) ). Myocardial strain analysis by 2-dimensional speckle tracking echocardiography improves diagnostics of coronary artery stenosis in stable angina pectoris. European Heart Journal, 34: (Issue Supplement 1), P3988. |
6 | Camici, P.G., Crea, F. ((2007) ). Coronary microvascular dysfunction. New England Journal of Medicine, 356: , 830–840. |
7 | Crea, F., Camici, P.G., Merz, C.N.B. ((2014) ). Coronary microvascular dysfunction: an update. European Heart Journal, 35: (17), 1101–1111. |
8 | Danaei, G., Singh, G.M., Paciorek, C.J, Lin, J.K, Cowan, M.J., Finucane, M.M., Farzadfar, F., Stevens, G.A., Riley, L.M., Lu, Y., Rao, M., Ezzati, M. ((2013) ). The global cardiovascular risk transition: associations of four metabolic risk factors with national income, urbanization, and western diet in 1980 and 2008. Circulation, 127: (14), 1493–1502. |
9 | Goyal, A., Yusuf, S. ((2006) ). The burden of cardiovascular disease in the Indian subcontinent. Indian Journal of Medical Research, 124: , 235–44. |
10 | Hoffmann, S., Jensen J.S., Iversen A.Z., Sogaard P., Galatius S., Olsen N.T., Bech J., Fritz-Hansen T., Biering-Sorensen T., Badskjaer J., Pietersen A., Mogelvang R. ((2012) ). Tissue Doppler echocardiography improves the diagnosis of coronary artery stenosis in stable angina pectoris. European Heart Journal – Cardiovascular Imaging, 13: , 724–729. |
11 | Horton, R. ((2015) ). Offline: chronic diseases – the social justice issue of our time. Lancet, 386: , 2378. |
12 | Huang, S.J., Orde, S. ((2013) ). From speckle tracking echocardiography to torsion: research tool today, clinical practice tomorrow. Current Opinion in Critical Care, 19: (3), 250–257. |
13 | Montalescot, G. Sechtem, U., Achenbach, S., Andreotti, F., Arden, C., Budaj, A., Bugiardini, R., Crea, F., Cuisset, T., Di Mario, C., Ferreira, J.R., Gersh, B.J., Gitt, A.K., Hulot, J.S., Marx, N., Opie, L.H., Pfisterer, M., Prescott, E., Ruschitzka, F., Sabaté, M., Senior, R., Taggart, D.P., van der Wall, E.E., Vrints, C.J. ((2013) ). 2013 ESC guidelines on the management of stable coronary artery disease: the task force on the management of stable coronary artery disease of the European Society of Cardiology. European Heart Journal, 34: (38), 2949–3003. |
14 | Nesbitt, G.C., Mankad, S., Oh, J.K. ((2009) ). Strain imaging in echocardiography: methods and clinical applications. International Journal of Cardiovascular Imaging, 25: , 9–22. |
15 | Nichols, M., Townsend, N., Scarborough, P., Rayner, M. ((2014) ). Cardiovascular disease in Europe 2014: epidemiological update. European Heart Journal, 35: (42), 2929–2933. |
16 | Ong, P., Camici, P.G., Beltrame, J.F., Crea, F., Shimokawa, H., Sechtem, U., Kaski, J.C., Bairey Merz, C.N. ((2018) ). International standardization of diagnostic criteria for microvascular angina. International Journal of Cardiology, 250: , 16–20. |
17 | Roger, V.L. ((2007) ). Epidemiology of myocardial infarction. Medical Clinics of North America, 91: (4), 537–52. |
18 | Rosamond, W., Flegal, K., Furie, K., Go, A., Greenlund, K., Haase, N., Hailpern, S.M, Ho, M., Howard, V., Kissela, B., Kittner, S., Lloyd-Jones, D., McDermott, M., Meigs, J., Moy, C., Nichol, G., O’Donnell, C., Roger, V., Sorlie, P., Steinberger, J., Thom, T., Wilson, M., Hong, Y. ((2008) ). Heart disease and stroke statistics – 2008 update: a report from the American Heart Association Statistics Committee and Stroke Statistics Subcommittee. Circulation, 117: (4), e25–e146. |
19 | Sanchis-Gomar, F., Perez-Quilis, C., Leischik, R., Lucia, A. ((2016) ). Epidemiology of coronary heart disease and acute coronary syndrome. Annals of Translational Medicine, 4: (13), 256. |
20 | Teske, A.J., De Boeck, B.W., Melman, P.G., Sieswerda, G.T., Doevendans, P.A., Cramer, M.J. ((2007) ). Echocardiographic quantification of myocardial function using tissue deformation imaging, a guide to image acquisition and analysis using tissue Doppler and speckle tracing. Cardiovasc Ultrasound, 5: , 27. |
21 | Vanoverschelde, J.-L., Goffinet, C. ((2007) ). Speckle tracking echocardiography. European Cardiovascular Disease 2007, 3: (1), 1–3. |
22 | Yeboah, J., Rodriguez, C.J., Qureshi, W., Liu, S., Carr, J.J., Lima, J.A., Hundley, W.G., Herrington, D.M. ((2016) ). Prognosis of low normal left ventricular ejection fraction in an asymptomatic population-based adult cohort: the multiethnic study of atherosclerosis. Journal of Cardiac Failure, 22: (10), 763–768. |


