
Learning text analytics without coding? An introduction to KNIME
Abstract
The combination of the quantitative turn in linguistics and the emergence of text analytics has created a demand for new methodological skills among linguists and data scientists. This paper introduces KNIME as a low-code programming platform for linguists interested in learning text analytic methods, while highlighting the considerations necessary from a linguistics standpoint for data scientists. Examples from an Open Educational Resource created for the DiMPAH project are used to demonstrate KNIME’s value as a low-code option for text analysis, using sentiment analysis and topic modelling as examples. The paper provides detailed step-by-step descriptions of the workflows for both methods, showcasing how these methods can be applied without writing code. The results suggest that visual or low-code programming tools are useful as an introduction for linguists and humanities scholars who wish to gain an understanding of text analytic workflows and computational thinking. However, as with more traditional programming, caution must be exercised when using methods without fully understanding them. In conclusion, KNIME is a potential avenue for innovative research and teaching computational methods to humanities scholars.
1.Introduction
Since the late 1990s, computational and statistical methods have gained more ground in linguistics, to the extent that many scholars have come to describe the paradigm shift as the ‘quantitative turn’ (Kortman 2021).11 This is particularly true of corpus linguistics, a field of study that makes use of large computer-readable samples of language. Corpus linguists use large representative text collections, or corpora, to study linguistic features of almost every description, and within the field, the quantitative turn has had a particularly substantial impact on inferential and predictive modelling, which leads to a more accurate and fine-grained understanding of language change and variation, in particular (see Hilpert & Gries, 2016).
Over the same period of time, text analytics or text mining has burgeoned within data science, becoming a vibrant and wide-ranging field of research with application in research and industry alike (Kotu & Deshpande, 2019). Despite the obvious connections to linguistics, text analytics has largely developed separately, and similar analytical questions are often approached in different theoretical and methodological ways in linguistics and data science. To illustrate, many linguists today remain essentially unfamiliar with the concept of Natural Language Processing (NLP), despite working with natural human languages for a living, while colleagues in digital humanities are often much better acquainted with the field (see McGillivray et al., 2020).
As the volume of digitised and born-digital textual data has expanded, text analytic computational methods have claimed an increasingly central role in text-centric fields of research and enterprise. Within academia, fields as diverse as digital humanities, quantitative social sciences, and media and journalism studies all benefit from text analytics, particularly when it comes to methods of pattern recognition and predictive analytics on human activity and behaviour (see Kuhn, 2019). Because data science has a much higher profile than corpus linguistics in academia and industry, most projects involving text analytics tend to gravitate towards methods developed in data science (Pollack, 2012; Jensen, 2014). Consequently, social and political scientists, historians, and computational literary scholars are more likely to reach out to computer scientists than corpus linguists for collaboration (see Kuhn 2019).22
At present, one of the major challenges in humanities research is the lack of necessary technical skills among scholars (see Yusoff et al., 2020). In particular, many scholars with a more traditionally discipline-focused skill set will often acknowledge the potential benefits of being able to work through digitised archival data, but then at once lament their own shortcomings when it comes to executing the analyses required, or even adequately understanding how the seemingly beneficial computational methods actually work. Indeed, despite the popularity and undeniable added value of quantitative methods, and the decades long history of humanities computing and later digital humanities, even a basic introduction to such approaches is still often missing in modern humanities curricula (Hockey, 2004). Consequently, when scholars from the so-called “soft” disciplines such as linguistics become interested in exploring the methodological tools on offer in data science, the learning curve is often so steep that many working professionals feel that they cannot invest the time needed into learning (and repeatedly relearning, as the case often is with casual programmers) basic skills in programming, package management, and data wrangling – i.e., tasks that traditional online and stand-alone corpus tools handle “under the hood” – before any actual research can take place.
In answer to these challenges, this paper introduces the low-code data science platform KNIME as an alternative point of access for linguists who are interested in familiarising themselves with machine learning and data science.33 Visual programming environments provide an easy-to-use graphic user interface for building analytical workflows in which each step is represented on screen as a single node or module that has clearly defined input and output ports, and configuration settings that can be accessed through a simple pop-up screen. No scripting is required from the user, who can instead focus on building the logic of the analytical pipeline without having to devote time to learning the syntax and quirks of a scripting language. Whilst the user is largely (though not entirely) limited to the available repertoire of modules, the current versions of many such tools offer more than enough breadth and variety to serve as a solid introduction to what is currently possible in data science, machine learning, statistics, and data visualisation.
1.1The text analytics OER
The aims of this paper have also been operationalized in the form of an Open Educational Resource (OER) on the DariahTeach platform as part of the DiMPAH44 project. The goal of the OER was to introduce linguistic perspectives on language for readers with a background in data science, and to introduce text analytical methods used in data science for readers from a linguistic background. The technical implementation of DariahTeach is built on the teaching platform Moodle, which had to be taken into account at every step of OER design.
A challenge experienced during the creation of the OER was the planned asynchronous mode of learner interaction, and the design of a resource with which the teachers would have no contact once deployed. Taking a perspective from previous research on distance teaching, this limits the design to only one of the interaction types described by Moore (1986): Learner-content interactions. Looking at the recommendations for distance learning, this singular mode becomes difficult to work around, as instructor presence and connections to current events are both indicated as important contributors to learner engagement (Gray & DiLoretto, 2016).
The remaining contributors to engagement are structure and the experience of progression, which emphasises both the form of the OER and the interactive elements included within it. Connecting to the intent of creating interactive learner experiences, the interactive elements included in this specific case could be divided into on-site and off-site elements. On-site interactive elements take place on the teaching platform and rely on the H5P elements included in the Moodle environment. These provide a sense of progression through the OER’s materials, while also providing a structural component through which self-assessment becomes possible.
Off-site interactive elements are the main focus of this article, and are interactive elements that the learner engages with outside the teaching platform. Given that KNIME was chosen as the main tool for the OER, the workflows presented in this article make up the majority of off-site interactive elements. The use cases also represent the largest possibility of producing learner engagement, as they offer the opportunity to provide applications of the content that learners can experience as useful for their own needs. While different from engaging directly with current events, practical use cases aimed at providing general methods that can be applied to a broad selection of topics are a possible workaround as they allow learners to use the methods within their own fields of interest.
Another challenge was the two audiences of the OER, namely how to engage students who may come from either linguistics or data science, presumably with little, if any, previous familiarity with the ‘other’ side. This challenge overlaps with the idea of use cases being experienced as relevant or practical by the learners, as the two intended audiences will approach the contents from different perspectives. This is implemented in the use cases through an introductory approach to the methods, for the linguist audience, and an introductory explanation of the relevant linguistic perspective on the process for the data science audience.
2.Text analytics and (corpus) linguistics
Corpus linguists are really just linguists who have decided to research language using corpora, meaning that their research interests often align with those of other linguists. Linguists might explore changes in language norms or grammatical patterns, or the changes languages might undergo in certain contexts or during certain periods. In general, it is the language that matters rather than the content, though corpus linguistic methods are also increasingly used in cross-disciplinary projects involving fields like history, social sciences, political science, gender studies, etc.
By contrast, data scientists working in text analytics are more interested in accomplishing practical tasks that happen to involve language. This includes tasks such as grouping a set of texts according to the similarities in their content, exploring social media, and recognising specific types of texts based on predetermined features for practical applications, such as e-mail spam detection. As a simplified generalisation, it could be said that data scientists are often doing something via text analysis, while linguists are interested in learning more about language itself.
Just as there are differences in how corpus linguists and data scientists view language in their work, there are also differences in the type of training they have commonly received. An area where this difference becomes important to the current paper is that linguists have rarely received explicit training in programming or statistics, although basic statistical concepts are often included in linguists’ training to some degree. Corpus linguists are also often trained in the use of specific tools to carry out their queries, and only some in the field engage with the things that happen “under the hood” of the programs they are learning to use (see Mason, 2018). Data scientists, on the other hand, will often receive training in programming and advanced statistics, but are rarely introduced to theoretical details about language.
When considering the benefits of a tool like KNIME for text analytics or corpus-based linguistics, these different backgrounds must be taken into account. KNIME is more geared towards data scientists, but the question is whether it could be said to accommodate the perspectives of linguists as well (see Tyrkkö and Ihrmark submitted). In the following sections, we first introduce KNIME at a general level and then present two examples of KNIME facilitating text analytics from the OER.
3.Introduction to low-code programming with KNIME66
3.1The basic building blocks
The fundamental challenge of computational thinking is to be able to break a task down to its component parts. We all do this all the time (‘grab doorknob’, ‘twist’, ‘pull’), but usually without having to stop and think about each step. By contrast, in programming, we need to spell out each step, which requires not only knowing what the steps are, but also how each step needs to be coded in a given programming language. In regular script-based programming, this means having to learn not only the lexicon and syntax of the language, but also a wide variety of programming concepts such as variable types, arrays, package management, control structures, debugging, etc. Although both conceptual and practical knowledge of these concepts is necessary for anyone aspiring to become a developer, acquiring that knowledge can be a time-consuming process that might not be realistic for someone who needs access to basic or intermediate methods only occasionally.
Programming languages are often conceptualised as a hierarchy of levels, in which high-level languages like Python and Visual Basic take care of many of the details of computational mechanics, while low-level languages leave more of the work to the human programmer. Visual programming environments like KNIME, Orange, and Scratch can be described as very high-level languages, in which the user is more or less completely detached from the mechanics of writing code and only has to focus on building the workflow. In the so-called “low code” approach, the user builds up a workflow from functional nodes, each of which usually performs one well-defined function. This makes the learning curve much less steep than with scripting languages, but with the downside that the user is limited to the available functionalities. While this is unlikely to be a problem for new users – KNIME, for example, has thousands of nodes covering a very wide range of functions – there can be times when the user would wish to do something that the tool does not cater for, and in those situations there is little that can be done.77 Another potential downside of low-code programming is that they may make it tempting for users to employ methods that they do not fully understand, though the issue of black boxes is by no means limited to these platforms (see Tyrkkö and Ihrmark submitted). On the other hand, low-code platforms make prototyping new ideas and testing different data analytic scenarios much easier and quicker, especially for novice or occasional users. The visual nature of the workflows makes the analytical process more transparent, which means that colleagues and collaborators who are not familiar with programming can understand and engage with all aspects of the research cycle.
3.2KNIME
KNIME’s main window is shown in Fig. 1, and contains the canvas, node repository, console log, as well as access to node descriptions and the KNIME Hub. The canvas is located in the centre of the window, and is where the user can place their nodes. The node repository is located at the bottom left, and shows a list of all nodes currently installed. More nodes can be added by the use of extensions, which are often thematic in nature and aimed at a specific type of functions or a specific type of materials. The console log is located at the bottom right, and is where the log is posted once a node executed. This is where error codes are posted if a node is incorrectly configured or has been given incorrect input.88
Figure 1.
KNIME main window.
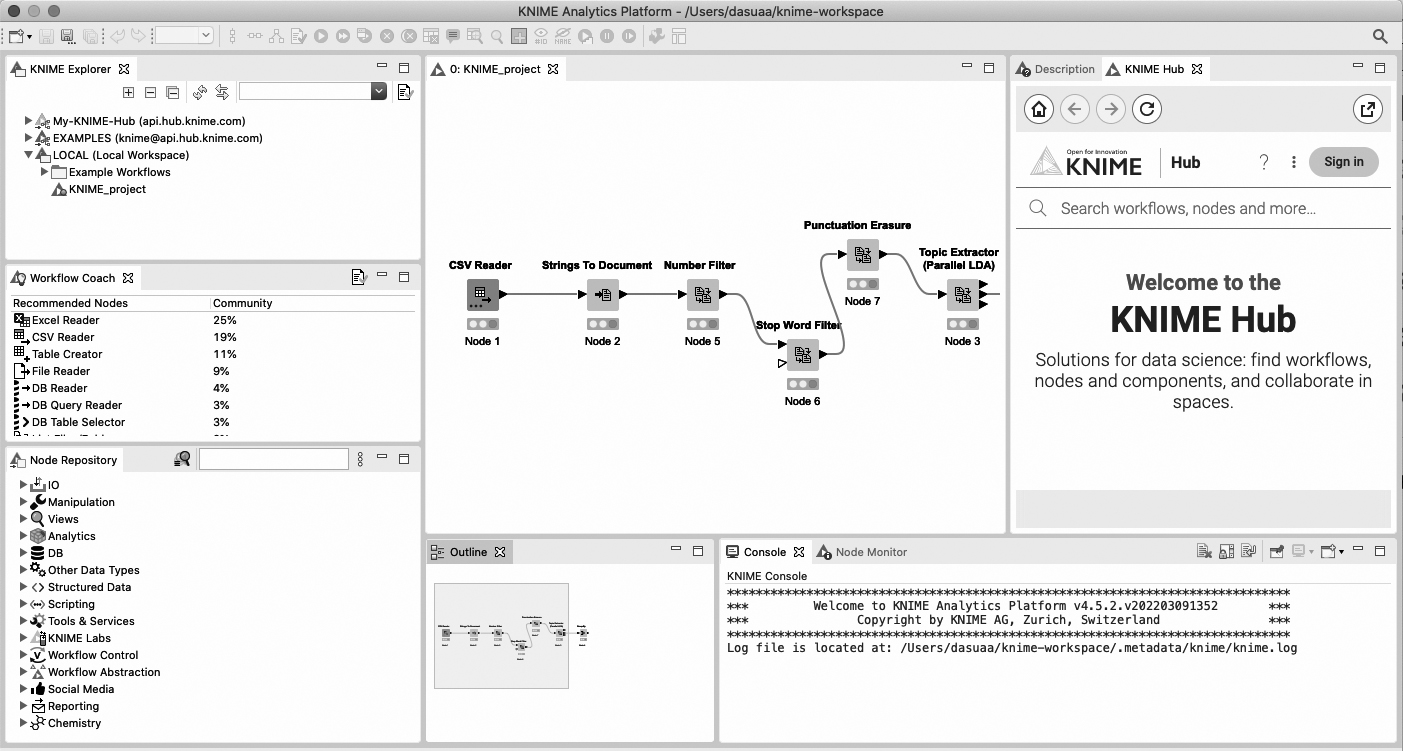
Top right we find the box containing node descriptions and access to the KNIME Hub. When clicking a node, the description tab will provide a summary of the node’s function and a mapping of the input and output ports. The description will also specify the acceptable input types and the format of the output. The KNIME Hub tab will allow users to search for new nodes, or entire workflows, on KNIME’s website. The integration of the Hub into the main window enables users to drag nodes from the website directly into their own workflow, and have KNIME install them automatically. Full workflows can also be dragged-and-dropped in the same way.
KNIME nodes can be configured by right-clicking them and selecting “Configure …”, which opens the options for that specific node. The nodes show their status by using a “stoplight” located at the bottom of the node. A red dot indicates that the node needs to be configured, a yellow dot shows that the node is configured and ready to execute, and a green dot indicates that the node has been executed (as can be seen in Fig. 1). Nodes can be executed individually by using the right-click menu, or as a group by executing the last node of the workflow.
The workflows created in these environments can be saved and shared with other users, but they only run within the respective platform and cannot be compiled into standalone applications. However, KNIME also offers a selection of nodes that will output the data into different file formats, such as .CSV or .JSON, so that materials can still be shared. This also means that KNIME can be used for part of the process, and then have data exported to whatever format is needed for the next tool.
4.Case studies
4.1Sentiment analysis
The first case study uses the Twitter API to collect tweets and sort them according to predicted sentiment.99 While not common in corpus linguistics, sentiment analysis is common within data science, particularly with social media data. It can be used to perform tasks related to marketing and impact measurement, or by political analysts looking at public responses to decisions and events (e.g., Matalon et al., 2021). The task of sentiment scoring resembles semantic valence judgments in cognitive linguistics (see, e.g., Warriner et al., 2013, Mohammad, 2016), with the difference that the scoring is carried out automatically on the basis of so-called ‘gold standard’ training data, making sentiment analysis a type of supervised machine learning.
Lexicon-based sentiment analysis uses collections of words tagged by human readers as expressing positive, negative or neutral sentiment. Given how polysemous and context-dependent many words are, this approach is not foolproof, but at a large enough scale the sentiment scores are usually agreeable to human evaluators. This example uses the dictionary tagger node. There are other approaches to sentiment analysis in KNIME, such as training a BERT (Devlin et al., 2018) model for the specific context of the sample,1010 but the more general dictionary approach was chosen here for the sake of simplicity. It is important to keep in mind, however, that the use of a generic sentiment dictionary here makes the predictions less reliable.
The sample dataset is collected via Twitter’s API, through which Twitter allows users to collect tweets and interact with the Twitter platform. Access to the API is tiered, and the approach shown here requires ‘elevated access’. Elevated access is free,1111 but requires the user to fill out a form specifying their intended use of the data. Once a developer account is registered with Twitter, the user gains access to the API through a combination of verifications.
The Twitter search node provides the specifications of the sample collected from the API. The node allows for a selection to be made regarding the nature of the sample, for instance, focusing the data collection exclusively on recent or popular tweets. We can also specify a string that needs to be included in the tweets. This provides the main thematization of our sample. The node also specifies the size of the sample we wish to collect, as well as the information we wish to collect for each tweet. The terms of use limits the use and presentation of data derived from the API based on different categories of sensitive information. A discussion about the ethics of Twitter sampling has also been carried out in the academic sphere, with the lack of informed consent obtained from the individual tweeters highlighted as one issue amongst others (see Williams et al., 2017).
The first node of our workflow (Fig. 2) authorises our access to the API, and the second node is the previously described Twitter search node. The Twitter search node is connected to a Table manipulator node, which allows us to preview the tweets. The workflow is forked after the table manipulator, which we will return to when discussing the merging of our sentiment scores and our tweets. The main flow continues on to a Row ID node, which allows us to add a column of row IDs to identify the individual tweets. This is then passed on to a node called String to Document, which transforms each row into an individual document with the newly added row ID as the title.
Figure 2.
Sentiment analysis workflow.
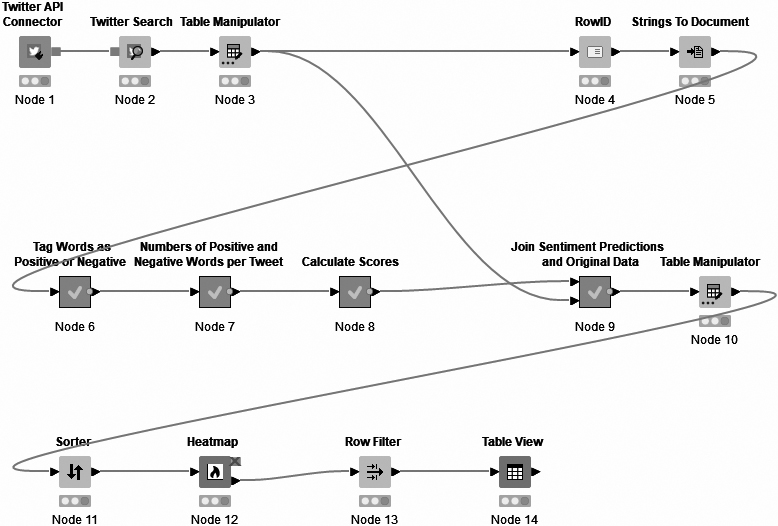
The majority of nodes in the middle row are meta-nodes, which are visualised as grey squares. They contain the sub-nodes needed to calculate and log the sentiment scores and predictions. Meta-nodes are opened by double-clicking them, which will show their workflows in a new KNIME tab.1212 These specific meta-nodes are pre-configured for the sentiment analysis task, and can be downloaded via the KNIME hub. While initially configured for sentiment analysis according to positive, negative and neutral, the meta-nodes can be re-configured to predict other sentiments by accessing the workflows and changing the dictionary used for tagging (node 6 in our workflow).
In addition to the dictionaries available through the Dictionary Tagger node, we can also add our own dictionary or modify an existing one. Custom dictionaries can be easily imported by connecting a CSV Reader node to the Dictionary tagger, which will then tag the sample according to the new dictionary. The dictionary used here is the MPQA Sentiment Dictionary. It is important to note that the MPQA dictionary used only contains single items, and does not assess items in context.
Sentiment-carrying words are tagged, counted and logged for each tweet-turned-document. The sentiment score is then calculated by accumulation, where the number of positive and negative tags in each tweet are added up and scored between
Figure 3.
Sentiment scores, predictions and Tweets.
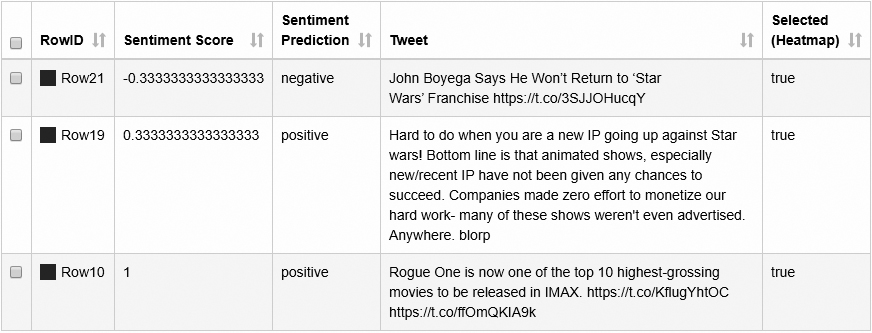
The first example (row21) is classified as moderately negative, the second example (row19) as moderately positive, and the third example (row10) as very positive. A human reader will probably agree with the first and third score, but the second example is likely to be read as a negative statement by most. As messages get more semantically complicated,1313 sentiment accuracy suffers, especially with lexicon-based methods (see Hartmann et al., 2022).
The scores provided by the sentiment analysis are then combined with our original data table according to the row ID provided for each tweet and used as the title for our documents. This is where the fork in the workflow comes into play, as the row IDs provided by the Row ID node match the rows of our original table, and allow us to easily match the sentiment output to the tweets. A Table manipulator node is added after the merge in order for us to be able to inspect the data.
The Sorter node sorts our table according to our choice of column, in this case sentiment score. The table can then be passed on to a heatmap (Fig. 4) with tweets at similar scores near each other.
Figure 4.
Sentiment score heatmap.
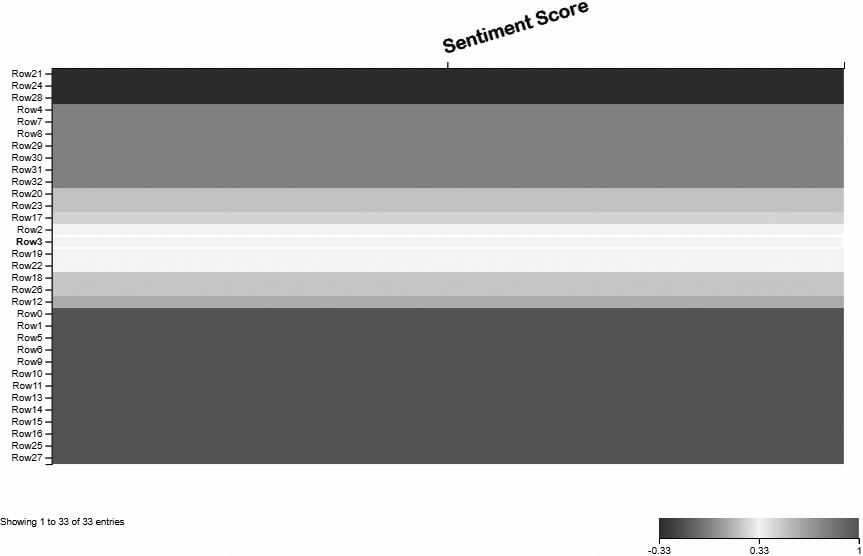
The point of displaying the results on a heatmap is partially to visually explore the distributions, but also because the heatmap allows us to select rows. In order to select rows, we first activate the selection function in the top right corner of our heatmap window. We can then click on a row in our heatmap to select it, or we can select several rows to inspect the sentiment sections of our sample.
Clicking “apply” in our heatmap window will add a column to our table, where the selection status for each row is indicated by “true” or “false” (as seen in Fig. 3). By passing the table from our heatmap node to a Row filter node, we can filter out the rows that were not selected through adding “false” in the exclusion filter and specifying the column indicating the selection in the heatmap. By doing so, we end up with a table consisting of tweets predicted as expressing the selected sentiment that we can either inspect through a table viewer or export for further analysis.
4.2Topic modelling future Stories for Europe
Topic modelling is another method not often used by linguists, but commonplace within data science. There are different ways of approaching topic modelling, but for the current workflow parallel Latent Dirichlet Allocation (LDA) was chosen. LDA works based on co-occurrence of terms within the materials, and defines topics as being certain collections of terms.
In order for this approach to yield usable results, pre-processing is needed. This includes “standardising” the text itself in order to mitigate issues related to casing, as well as reducing noise through filtering numbers, stop words and punctuation. While other approaches for topic modelling would do away with the need for such pre-processing, the explicitness of the processing needed for the LDA topic extractor makes it a good fit for teaching purposes.
“Stories from 2050” is a 2021 short story anthology, which aimed at exploring the future of Europe in light of the climate crisis,1414 and was selected due to the OER theme. The full workflow is shown in Fig. 5.
Figure 5.
Topic modelling workflow.
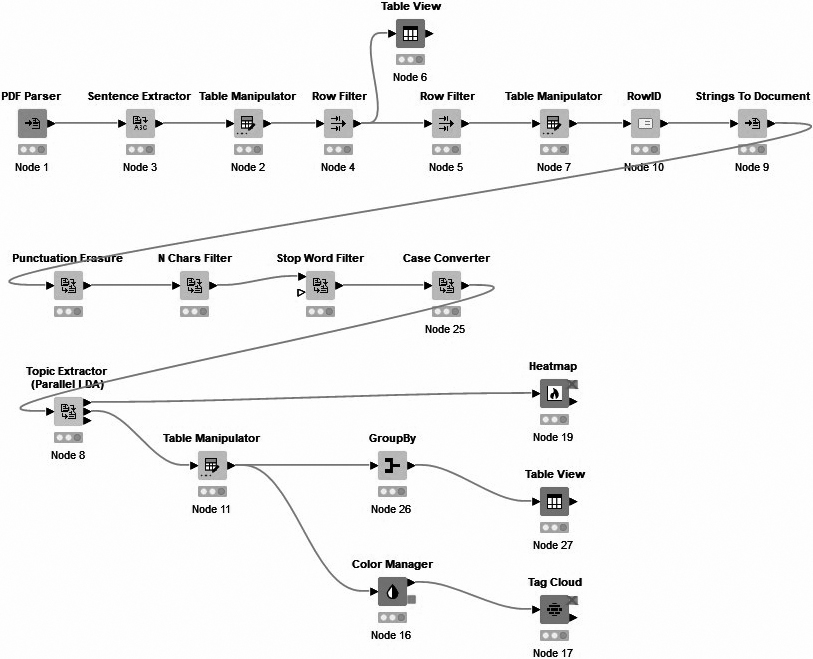
The first line of the workflow is the document parsing and pre-processing step. “Stories from 2050” is selected in the PDF Parser node and loaded into KNIME, followed by a Sentence Extractor node which splits the text material into individual sentences. The resulting data table is inspected through a Table Manipulator, before being connected to a set of Row Filter nodes, with a Table View node in between. The reason for this is the editorial material and indices at the beginning and end of the publication. The first Row Filter is configured to remove the initial irrelevant materials. However, the Table Manipulator node only offers a limited overview, and does not show the later content of the publication. Therefore, a Table View node is placed after the initial Row Filter, so that the data rows containing irrelevant information at the end of the publication can be identified. These rows are then filtered out using the second Row Filter node.
A Table Manipulator node is then used to inspect the results, and the data table is passed on to a Row ID node, which assigns the row index to a Row ID column. Finally, the individual data rows are turned into documents with the sentence as content and the Row ID column as titles in order to accommodate the text pre-processing.
The first node of the text pre-processing line is a Punctuation Erasure node. This is followed by an N Chars Filter node, which removes terms shorter than a set number of characters. It is important to have a good idea about the data one is parsing, as a decision has to be made regarding whether to include shorter words that might still contain useful information. The N Chars Filter node is followed by a Stop Word Filter node, which removes any remaining stop words. Finally, the Case Converter node is used to convert all the content to lowercase, which removes the issue of terms being counted as separate entities due to capitalization.
Figure 6.
Heatmap showing topic distribution.
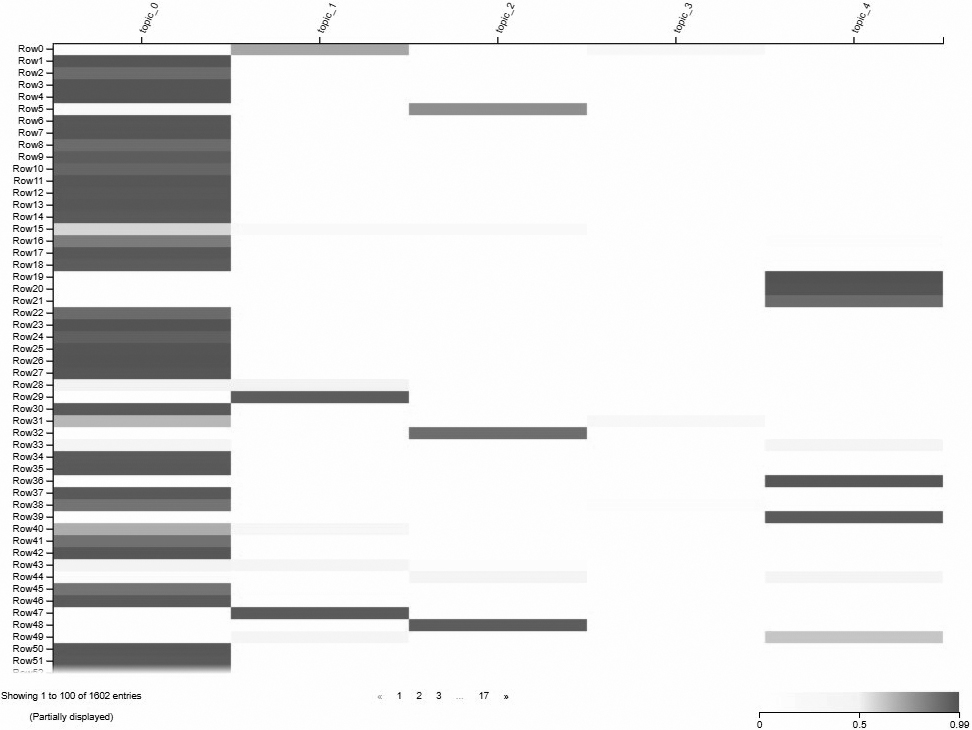
The pre-processed texts are now ready for the Topic Extractor node, and the presentation of results. When configuring the Topic Extractor node, we have to set the number of topics as well as the number of terms included in each topic. While there are methods to optimize the number of topics, the approach used here is manual. The learner is asked to repeat the topic extraction using different configurations, and decide on a good number of terms and topics based on their inspection of the results.
The output ports of the Topic Extractor node are connected to different ways of viewing and visualising the results. The top output port sends the document titles (the Row IDs) and their topic annotations to a Heatmap node, which allows for the visualisation of the distribution of topics amongst the rows (Fig. 6).
The second output port of the Topic Extractor node contains the topics and the associated terms. This node is initially connected to a Table Manipulator for inspection, and is then forked into two flows. The first flow makes use of a GroupBy node, which accumulates all the terms associated with each topic into a list. The GroupBy node is then connected to a Table View node so that the terms can be inspected (Fig. 7). It is important to note that topic terms are not words that appear invariably in all texts labelled with that topic. What the top terms do is they give us a sense of the ‘aboutness’ of the topic, similarly to keywords in corpus linguistics (see Gabrielatos, 2018).
Figure 7.
Topic terms for the first five topics.
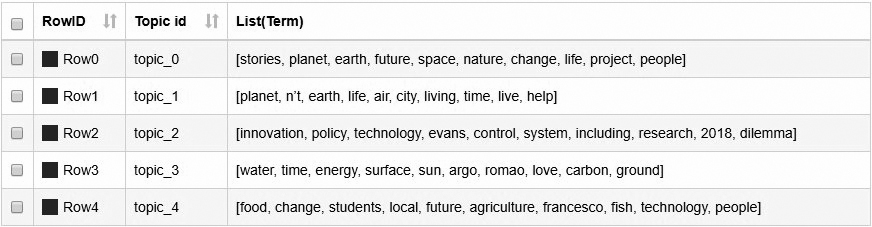
Figure 8.
Topic term tag cloud.
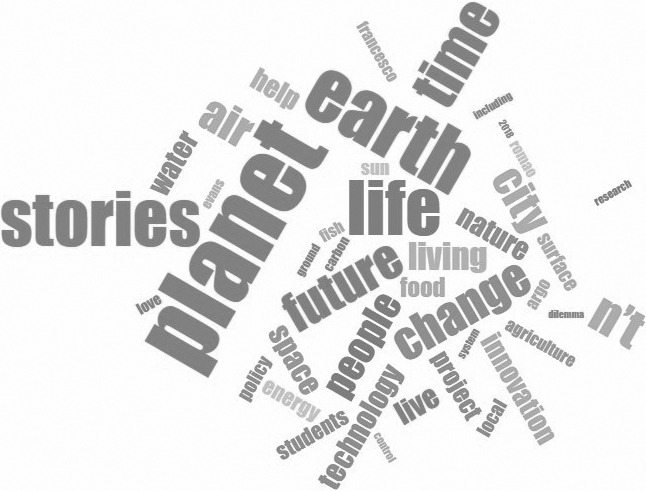
In order to visualize the topic terms, a Tag Cloud node is used. The Table Manipulator node is first connected to a Colour Manager node, which assigns a colour to each of the topics. The Tag Cloud then creates the visualisation. In the configuration, “weight” is chosen as the size for the terms, which corresponds to their frequency in each topic definition, and the colour is according to the Color Manager node. The resulting cloud is shown below in Fig. 8, where the colour corresponds to the topic and the size indicates term weight within that topic.
5.Discussion
To sum up, we would suggest that low-code programming solutions can go a long way towards solving the issue of the steep learning curve of data scientific methods of text analytics. We see visual or low-code programming tools primarily as a practical introduction for linguists and other humanities scholars, who wish to gain a usage-based understanding of text analytic workflows and a quick introduction to computational thinking, but also as a potential avenue for innovative original research – after all, KNIME and other similar platforms are not positioned as educational resources, but as fully functional data science environments that are currently in use in both research and enterprise. Consequently, by making text analytic methods more accessible and understandable, these tools can play a key role in future collaborations between text-centric fields and the wider humanities community. As linguists experienced with programming and developing tools for linguistics and language education, the authors look forward to more organic integration of text analysis and linguistics with general humanities research, and the wider use of tools that make text analytics transparent and accessible to all is a step in the right direction.
Kuhn (2019) highlighted text analytic methods, such as those made available through KNIME, as being on the wish list of researchers seeking collaborations involving research on text. While there are already examples of such collaborations involving linguists (see, e.g., Baker & McEnery, 2016; Alasuutari et al., 2018; Demmen et al., 2022), there is plenty of room for improvement when it comes to making methods desired by collaboration partners more available to linguists, and the benefit of doing so has the potential of making new perspectives on textual evidence more broadly available in the future landscape of digital humanities. At the same time, it is worth noting that the same could be said about making broader linguistic knowledge available for people who already have expertise in the analytical methods (as discussed briefly in Section 2).
From the teaching perspective, the visual workflow of KNIME has also been experienced as a benefit when attempting to create structured and engaging off-site interactions for the asynchronous OER. The infrastructure surrounding KNIME (e.g., KNIME hub and NodePit) enables resources to be easily shared and stored, while the visualisation of the process makes it possible to establish clear connections between description and implementation without necessarily highlighting every node or function in isolation. This provides a didactic framing of the method as a process through which data is analysed, rather than presenting separate functions that are carried out individually. The focus on the workflow and research process provides the learner with a holistic experience of what is being done, and could serve to maintain engagement as the OER moves into the separate functions selected for discussion in relation to the background materials on linguistics and text analytics.
6.Conclusion
Given how prominent text analytical methods have become in research and industry, it is prudent for language professionals and scholars working with textual data to acquire at least a passing familiarity with how such research is carried out. As the previous discussion and two case studies have hopefully demonstrated, low-code data science platforms like KNIME have the potential of opening a window, if not a door, to the inner workings of computational text analytics. The relative transparency of visually explicit workflows, clearly labelled nodes, and parameters presented in the form of menus and input fields all contribute to making a KNIME research cycle something that most linguists and other humanities researchers will have little trouble understanding regardless of their computational background, or lack thereof.
There are important considerations to make regarding the understanding needed to apply those methods responsibly. While KNIME might make the methods available without the need for direct programming, the assumptions and mechanics of the methods must still be understood well enough by the researcher for them to be able to apply them correctly. As previously noted, KNIME will happily run erroneous workflows as long as the base criterion for the nodes are fulfilled.
However, approaches using coding would suffer from the same dangers of blind implementation, with the added complexity of a programming language adding to the opacity of the process. KNIME could allow a new user to focus on understanding the process and procedure in terms of what influences their results by removing the need to invest considerable time into learning the practicalities of learning a new programming language or resource. As such, KNIME looks like an appealing solution when engaging with text analytics, as it would allow for (more of) the focus to remain on the text and the language as attempted in the OER operationalization.
Notes
1 A similar paradigm shift has been observed throughout the humanities and social sciences. For discussion, see Schöch (2013) and Arnold and Tilton (2019).
2 For examples to the contrary, see, e.g., Baker and McEnery (2016), Alasuutari et al. (2018), Demmen et al. (2022).
3 Tyrkkö and Ihrmark (submitted).
4 The Digital Methods Platform for Arts and Humanities (DiMPAH) is a project funded by Erasmus
6 The authors are not paid to endorse KNIME. In the spirit of full transparency, the authors have been in contact with KNIME and there are, as of autumn 2022, potential plans to explore mutually beneficial activities.
7 KNIME, like other modular programming environments, does offer integrations with widely used scripting languages like Python and R.
8 It is important to note that KNIME will not provide error codes for incorrect usage of nodes or functions, but will only post an error code if the node fails to execute. It is entirely possible to configure nodes incorrectly and receive output from them.
9 API, or Application Programming Interface, is a software interface that allows two computers to communicate with each other. In the context of online tools, API usually refers to the lexicon and syntax of a line of code that will instruct a server to carry out a query or perform some other task, and then send the requested results back. Many online services, such as Google and Amazon, provide detailed instructions on their APIs, some of which are available by subscription only.
10 BERT, or Bidirectional Encoder Representations from Transformers, is a relatively new and highly promising machine learning method for natural language modelling (Devlin et al., 2018).
11 During early 2023 Twitter changed its policy regarding the free third-party use of the API, and a paid version is likely to be released by the time this article is published. However, the specifics of the new API access model are unknown to the authors at the time of writing. In the OER, learners without API access are suggested to download a Twitter dataset from Kaggle.
12 Metanodes can also be expanded within the workflow to reveal the individual nodes they include. Doing this replaces the metanode with its dependent nodes with the links in place.
13 Common features of natural language use that cause particular problems for sentiment classifiers include humour, ambiguous statements, certain types of negations, and statements that require contextual information. For example, the ** classifier scores the sentence “the dictator is dead” as strongly negative, while the sentence “the king is dead” is scored as neutral.
14 Available here: https://op.europa.eu/en/publication-detail/-/publication/87769c66-5d5a-11ec-9c6c-01aa75ed71a1/language-en/format-PDF/source-245938989 (17/10 2022 15:15).
Acknowledgments
This work was co-funded by the Erasmus
References
[1] | Alasuutari, P., Rautalin, M., Tyrkkö, J. ((2018) ). The rise of the idea of model in policymaking: The case of the British parliament, 1803–2005. European Journal of Sociology, 59: (3), 341-363. |
[2] | Taylor, A., Tilton, L. ((2019) ). New Data? The Role of Statistics in DH. In Gold, Matthew K. & Lauren F. Klein (eds.) Debates in the Digital Humanities 2019. University of Minnesota Press. |
[3] | Baker, H., McEnery, T. ((2016) ). Corpus Linguistics and 17th-Century Prostitution. New York: Bloomsbury. |
[4] | Demmen, J., Sankaranarayanan, R., Hartshorne-Evans, N., Semino, E. ((2022) ). Language Matters: Representations of ‘heart failure’ in English discourse. A large-scale linguistic study. BMJ Open Heart, 9: (1). |
[5] | European Commission, Directorate-General for Research and Innovation, Stories from 2050: radical, inspiring and thought-provoking narratives around challenges and opportunities of our futures, Schindler, T. (editor), Guadarrama Baena, G. (editor), Publications Office, 2021, doi: 10.2777/203724. |
[6] | Gabrielator, C. ((2018) ). Chapter 12: Keyness Analysis: nature, metrics and techniques. In Taylor, C. & Marchi, A. (eds). Corpus Approaches To Discourse: A critical review. Oxford: Routledge. |
[7] | Gray, J.A., & DiLoreto, M. ((2016) ). The effects of student engagement, student satisfaction, and perceived learning in online learning environments. International Journal of Educational Leadership Preparation, 11: (1). |
[8] | Hilpert, M., & Gries, S. ((2016) ). Quantitative approaches to diachronic corpus linguistics. In M. Kytö & P. Pahta (Eds.), The Cambridge Handbook of English Historical Linguistics (Cambridge Handbooks in Language and Linguistics, pp. 36-53). Cambridge: Cambridge University Press. doi: 10.1017/CBO9781139600231.003. |
[9] | Hockey, S. ((2004) ). The history of humanities computing. In Schriebman S., R. Siemens, & J. Unsworth (eds.) A Companion to Digital Humanities. Available online at https://companions.digitalhumanities.org/DH/?chapter=content/9781405103213_chapter_1.html. |
[10] | Jensen, K.E. ((2014) ). Linguistics and the digital humanities: (Computational) corpus linguistics. MedieKultur Journal of Media and Communication Research, 30: (57), 117-136. |
[11] | Kotu, V., & Deshpande, B. ((2019) ). Chapter 9 – Text Mining. In Kotu, V. & B. Deshpande (eds.) Data Science. Concepts and Practice. Science Direct. pp. 281-305. |
[12] | Kuhn, J. ((2019) ). Computational text analysis within the Humanities: How to combine working practices from the contributing fields? Language Resources & Evaluation, 53: , 565-602. |
[13] | Mason, O. ((2018) ). Programming for Corpus Linguistics. How to Do Text Analysis with Java. Edinburgh: Edinburgh Textbooks in Empirical Linguistics. |
[14] | McGillivray, B., Poibeau, T., & Ruiz Fabo, P. ((2020) ). Digital Humanities and Natural Language Processing: “Je t’aime …Moi non plus”. Digital Humanities Quarterly. doi: 10.17863/CAM.55816. |
[15] | Moore, M. ((1989) ). Three types of interaction. American Journal of Distance Education. 3: , 1-7. doi: 10.1080/08923648909526659. |
[16] | Pollach, I. ((2012) ). Taming Textual Data: The contribution of Corpus Linguistics to Computer-aided Text Analysis. Organizational Research Methods, 15: (2), 263-287. |
[17] | Schöch, C. ((2013) ). Big? Smart? Clean? Messy? Data in the Humanities. Journal of Digital Humanities, 2: (3). |
[18] | Tyrkkö, J., & Ihrmark, D. (Submitted). Low-code data science tools for linguistics: Swiss army knives or pretty black boxes? In Coats S. and V. Laippala (es.) March of Data (Language, Data Science and Digital Humanities X). London: Bloomsbury Academic. |
[19] | Williams, M.L., Burnap, P., & Sloan, L. ((2017) ). Towards an ethical framework for publishing twitter data in social research: Taking into account users’ views, online context and algorithmic estimation. Sociology, 51: (6), 1149-1168. doi: 10.1177/0038038517708140. |
[20] | Yusoff, K.M., Ashaari, N.S., Wook, T.S.M.T., Ali, N.M. ((2020) ). Analysis on the Requirements of Computational Thinking Skills to Overcome the Difficulties in Learning Programming. International Journal of Advanced Computer Science and Applications, 11: (3), 244-253. |


