
Implementation of marketplace data in the production of Consumer Price Index in Indonesia
Abstract
Digital Economy in recent years, especially in Southeast Asia, including Indonesia, is growing rapidly. E-commerce is one part of the Digital Economy. BPS-Statistics Indonesia as a Non-ministerial Government Agency responsible directly to the president has conducted an E-commerce Survey in 2019. From this publication, it is concluded that the interest of Indonesian traders using the internet in selling in recent years has increased. So, the urgency of using e-commerce data in its application in official Statistics is increasingly needed. Several studies have carried out the application of e-commerce data in the calculation of The Consumer Price Index (CPI). In this research, e-commerce data is applied with a case study using the data from one of online marketplaces in Indonesia in calculating CPI at city level in Java. The purpose of this study is to compare the marketplace-based CPI data and BPS-Statistics’ survey-based CPI. The data is collected through web scraping techniques and followed by preprocessing data and analyzed descriptively. Web scraper that is built can be used in obtaining data. Commodity-level CPI with marketplace data tends to have relatively large prices which result in higher CPI being compared to BPS-Statistics CPI. Meanwhile, at the expenditure group level, the CPI between the two approaches is broadly similar in general.
1.Introduction
The digital economy is defined as a part of economic output that solely originates or primarily from digital technology with a business model based on digital goods or services [4]. In Southeast Asia, including Indonesia, the digital economy has developed rapidly in recent years. Anandan et al. predicted an internet economy of 200 billion USD in Southeast Asia in 2025 [1]. Furthermore, Anandan et al. saw such a drastic market acceleration that it predicted the internet economy to be closer to 240 billion USD [2]. This means that the role of digital economy as a business transaction on the internet is now starting to be evenly distributed and will continue to grow.
Bank Indonesia (BI) stated that the emergence of the concept of the digital economy made economic actors have to adjust to changes that occur [16]. The Indonesian government has created an e-commerce roadmap [15] to realize Indonesia as the largest digital economy country in Southeast Asia by 2020. The roadmap in question is contained in Presidential Regulation Number: 74 of 2017 concerning the Road Map for the Electronic-Based National Trade System (Road Map E-commerce) 2017-2019. Quoting the contents of the Presidential Decree, the Presidential Regulation was issued with the consideration that an electronic-based economy has high economic potential for Indonesia, and is one of the backbones of the national economy, as well as in the context of optimizing the use of electronic-based economic potential. The government sees the need to encourage the acceleration and development of an electronic-based national trade system (e-commerce), start-up businesses, business development, and logistics acceleration by establishing an integrated E-commerce Road Map.
The BEA (U.S. Bureau of Economic Analysis) classifies the digital economy into three main types of goods and services, namely infrastructure where digitization is needed so that it can be connected, e-commerce transactions, and digital media [5]. Mesenbourg [10] also divides the digital economy into three main components, namely supporting infrastructure, electronic business processes (e-business), and electronic commerce transactions (e-commerce). E-commerce is defined as an online store and transaction system [9]. According to the Indonesian E-commerce Association (IdEA) in Wijaya & Mariyah’s research [20], e-commerce is divided into three categories, namely (1) Classified ads, e-commerce where there is no online transaction facility from the website. (2) Marketplace, e-commerce where the website facilitates online transactions for online merchants. (3) Online retail, e-commerce where the website domain belongs to the online store itself and there is a stock of goods/services to be sold. An article published by Forbes [8] states that an online marketplace is a website or application that facilitates shopping from various sources. Marketplace operators do not own any inventory, their business is to serve other people’s inventory to users and facilitate transactions.
BPS-Statistics Indonesia as a non-ministerial government agency that is directly responsible to the president has conducted the 2019 E-commerce Survey [18]. The survey was conducted on a sample of 3,504 census blocks spread across 101 cities/regencies in Indonesia. The results of the survey showed that only 15.08 percent of respondents carried out e-commerce businesses. However, of the 15.08 percent of e-commerce businesses, 45.03 percent of businesses started using the internet from 2017 to 2018 and in 2019 as many as 25.11 percent, the rest started from 2016 onwards. From this, it can be seen that the interest of Indonesian traders by using the internet in selling in recent years has increased. So that the urgency of using e-commerce data in its application to Official Statistics is increasingly needed.
This study aims to implement e-commerce data with a case study of one of the largest online marketplaces in Indonesia in calculating the CPI at city level. In order to obtain the data, a web scraper needs to be developed. From the data obtained, it is possible to compare the consumption value with the marketplace data sales value approach and the BPS-Statistics Indonesia’s consumption value. Furthermore, this study also aims to see the patterns of CPI obtained by the marketplace and the BPS data approaches, whether they have similar patterns or not so that the stakeholders can consider the best decision-making policies.
2.Related work
Big data implementations in price statistics are have widely begun. This is done as an alternative to official statistics data sources [21]. Several previous studies related to big data in price statistics are used as references in this research. The first research was conducted by Wijaya & Mariyah [20], this study aims to capture the price changes on e-commerce websites to produce e-commerce-based CPI through the development of a web scraper and evaluate the results of the e-commerce CPI with the CPI results from BPS-Statistics for each commodity. However, the research locus is assumed to be in the DKI Jakarta area due to limited online retail data which lacked information on sales locations. The results of this study indicated that the e-commerce-based CPI calculation can be done using the BPS-Statistics Indonesia’s calculation approach.
Likewise, Mitchell [11] used collected online prices to generate CPI. Mitchell analyzed how online prices on consumer goods move relative to prices collected in retail stores in Canada and evaluated how e-commerce affects the CPI and explored how the CPI could further adapt and develop in an ever-increasing digital world. The data used was the price from the online websites. According to Mitchell, the price movements and the frequency of price changes at online prices were higher than at outlets with physical presence as indicated by the relative price magnitude. Mitchell added that there is currently no consistent long impact on the CPI at lower levels than the national level. Even so, the online prices used for calculating the CPI can be used as an indicator in calculating the CPI because price recording can be done more quickly.
Additionally, Cavallo & Rigobon discussed the use of online prices on Official Statistics, especially in calculating the CPI [6]. The methodology used following the concepts and formulas of calculating the official US Bureau of Labor Statistics CPI. The data came from some online retails in 25 countries. This data covered at least 70% of the Official Statistics commodity basket. The data was collected using web scraping software which was built in Python and PHP programming languages. The software was in the form of a robot that can extract information from websites that have a similar structure. It is stated that the method used was data extraction through the HTML websites structure. This study explained the advantages and disadvantages of collecting data using web scraping techniques. The biggest advantage obtained with web scraping techniques is that it costs little, data is available in real-time, and daily data is possible to obtain. Nonetheless, the disadvantage of data collection on online retail websites is that information on how many products have been sold is not available. So that in calculating the CPI, adjustments are needed with those made by Official Statistics.
From previous studies, the use of e-commerce with online marketplace data in calculating CPI is still lacking. The most common is using online retail data to calculate the CPI. This study proposes a marketplace data approach over online retail to provide the lack of location variable from online retail data and make the CPI result more precisely, in city level. In Indonesia, so far, the calculation of CPI is still based on traditional markets, while with current digitalization, everyone is shifting from traditional to online shopping. Therefore, this study will capture the online-based CPI. For the collection data stage, we use web-scraping methods with the consideration of ease and low cost.
3.Consumer price index by BPS-statistics Indonesia
According to BPS-Statistics Indonesia [3], the Consumer Price Index (CPI) is one of the economic indicators used to measure the rate of price changes (inflation/deflation) at the consumer level. The public consumption patterns have been changed starting from January 2020, which affects the measurement of inflation in Indonesia. It uses the 2018 CPI base year = 100. In addition, there are several fundamental changes in the calculation of the CPI (2018 = 100) compared to the CPI (2012 = 100), i.e. in terms of coverage, classification of commodity groupings, methodology for calculating the CPI, commodity baskets, and weigh diagrams.
These changes are based on the Cost of Living Survey conducted by BPS-Statistics Indonesia during 2018, as one of the main basic components in calculating the CPI [3]. Where currently there are 835 commodity baskets used in each city covering between 248-473 types of commodity goods/services. The number of cities covered is 90 CPI cities. The classification of commodities is divided into 11 groups and 34-42 sub-groups of consumption expenditures in the COICOP (Classification of Individual Consumption According to Purpose).
The CPI calculation by BPS-Statistics Indonesia [3] in general is using the Modified Laspeyres method with the following formula:
k = The number of types of goods/services listed in the commodity basket.
4.Methods
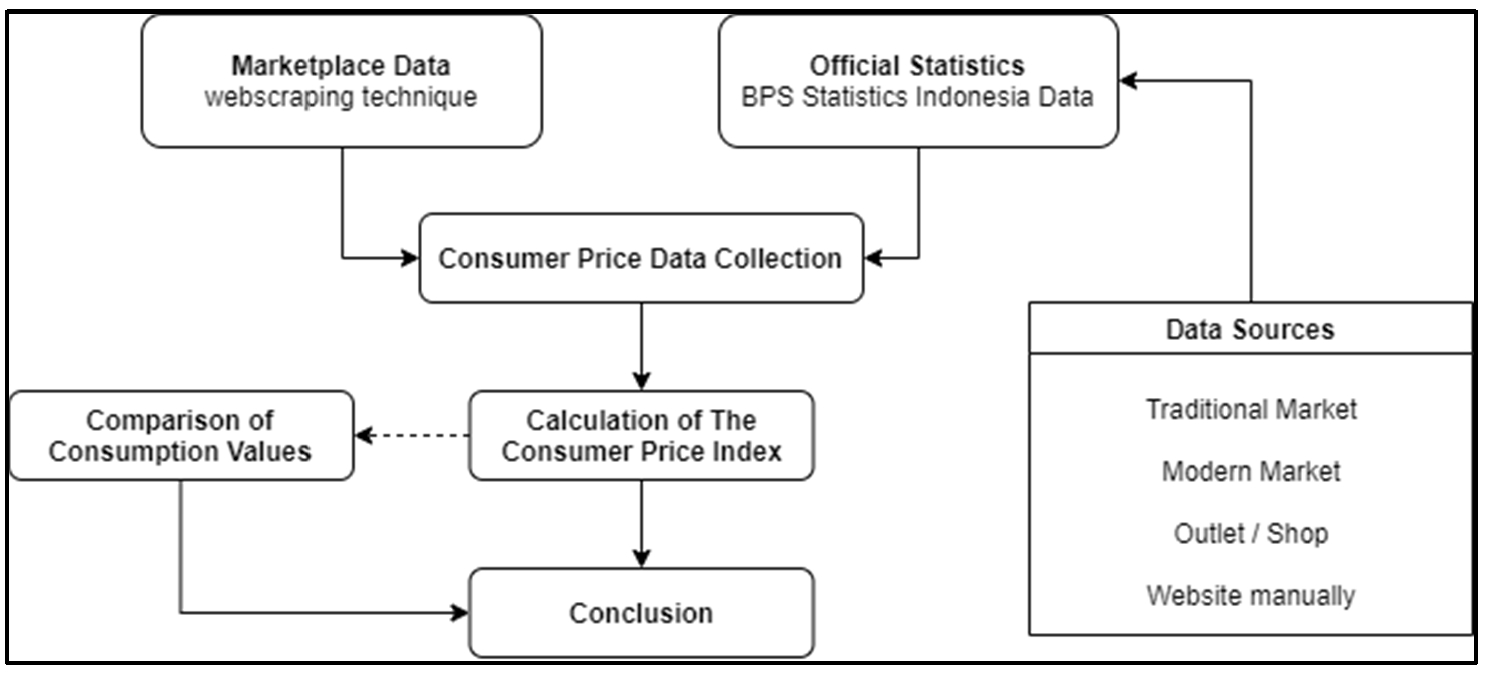
This study examines the calculation of CPI with marketplace data using data collection methods employing web scraping techniques as an alternative to BPS-Statistics Indonesia’s data collection methods. In addition, the consumption value sourced from BPS-Statistics Indonesia is compared with the consumption value using the sales value approach obtained from marketplace data to see the consumption patterns of the people between the two approaches. The research framework in this study is visualized in Fig. 1.
Fig. 1.
Research framework.
4.1.Data collection
The data in this study were obtained through two approaches, the web scraping technique and the data obtained from the BPS-Statistics by interviews and documents. The full web-scraped datasets remain available at https://github.com/mghozyah/dataios.
Web scraping. According to Adhinugroho, et al. [13], web scraping is a method that used to retrieve unstructured data from online web pages that is available, then transformed into structured data. With the web scraping method, the data can be collected in real time, saving time and money.
Web scraping in the CPI Manual Concepts and Methods book published by the IMF [7] is defined as an automatic data collection method taken from the internet by extracting data from websites or using an API (Application Programming Interface), which is a series of routines, protocols, and tools for building software applications. Web scraping identifies and retrieves relevant data and organizes it in a format that suits your needs.
This study focuses on data collection based on selected commodities according to the BPS-Statistics Indonesia’s commodity basket. So it is necessary to learn the website flow network or the infrastructure down to the product level. The flow network is a flow that makes it easier for users when they want to understand how the front-end and back-end of a website are built. Figure 2 shows the flow network that will be used in scraping the marketplace data.
Fig. 2.
The flow network of researched marketplace.
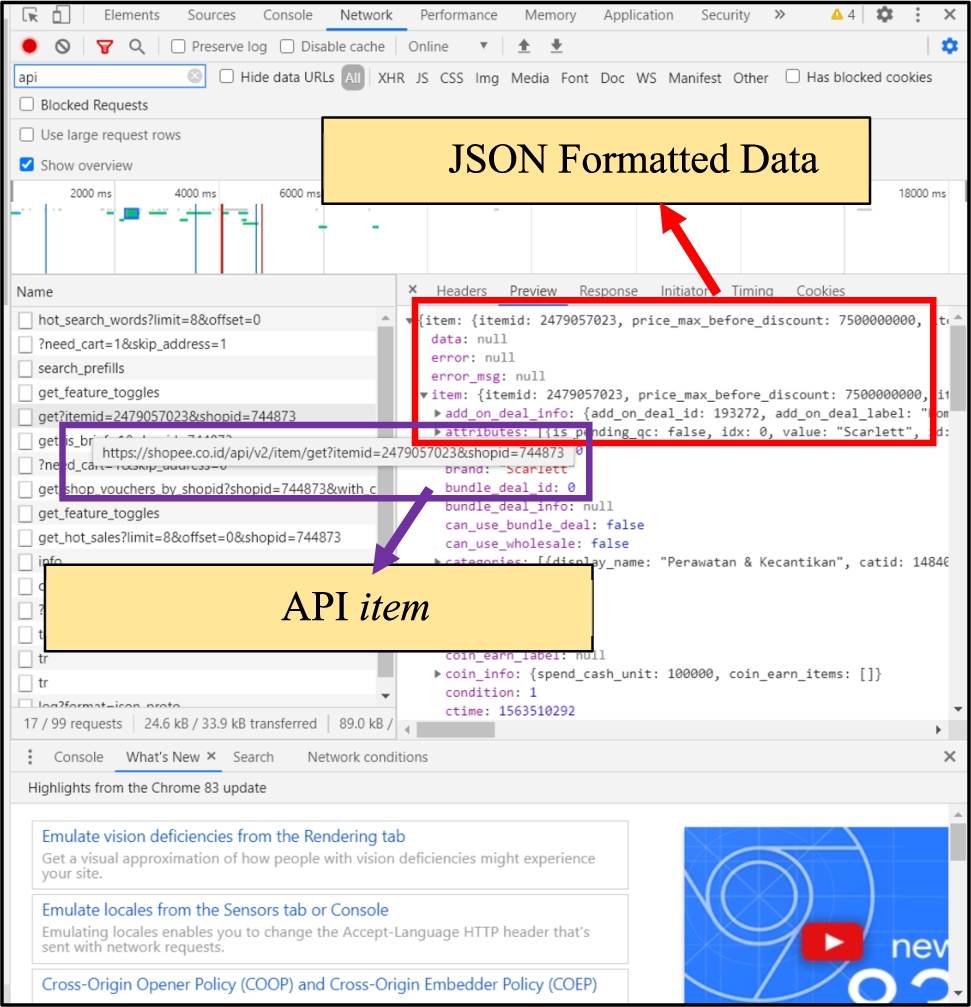
Figure 2 shows that the marketplace has well-organized website structure that the data is stored in JSON format and can be retrieved using the public API, one of the API shown in the Fig. 2 named the API item.
4.2.Data analysis
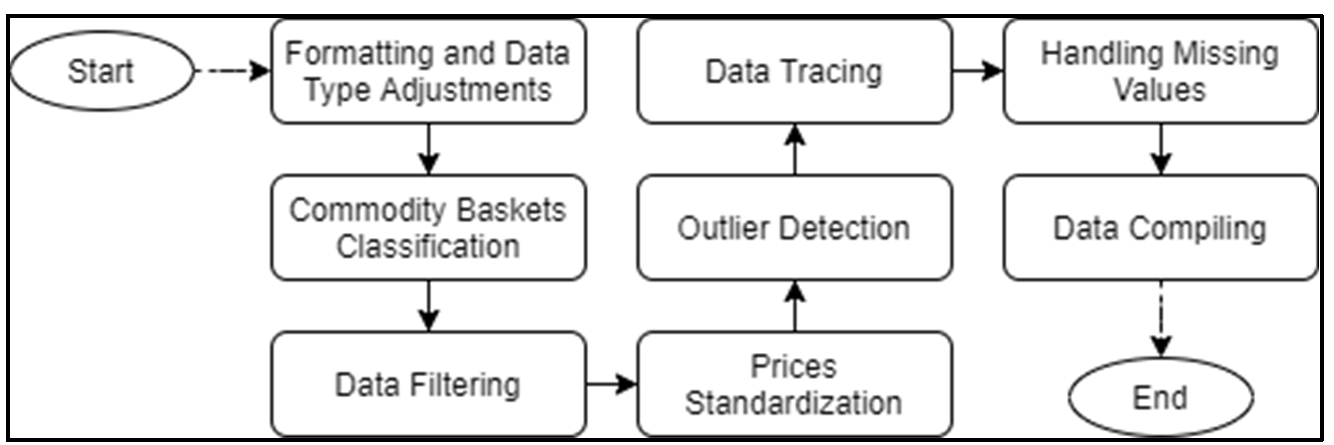
The analytical method used in this research is descriptive analysis. This is the research analysis flow about how this research uses the online marketplace data into calculating the consumer price index and analyze that with descriptive analysis (Fig. 3).
Fig. 3.
Research analysis flow.
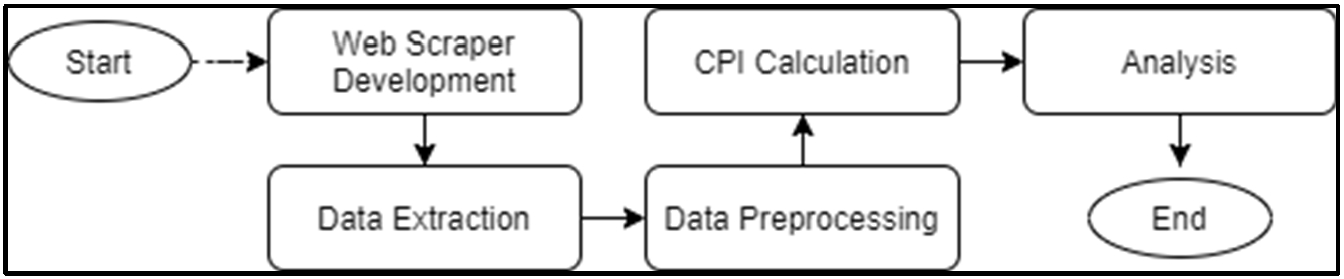
In general, before data can be analyzed, the first step is to obtain the data from the selected marketplace. The data is taken from the selected market place with a web scraper that has been built, then the data is extracted so that it can be processed further to calculate the consumer price index. These steps are discussed in detail in the following sections.
Data extraction. The web scraper that has been built will be run by searching the commodity data based on BPS-Statistics commodity baskets, whereas a list of commodity basket to be included in the search is required. The BPS-Statistics Indonesia’s commodity basket according to the 2018 Cost of Living Survey consists of 11 expenditure groups of commodity goods and services. The data obtained need to be extracted into flat-file for analysis purposes. The flow of how to extract the data in this study can be seen in Fig. 4. The extracted data through web-scraping is then entered in the data preprocessing stage as follows in Fig. 5.
Fig. 4.
Data extraction flow.
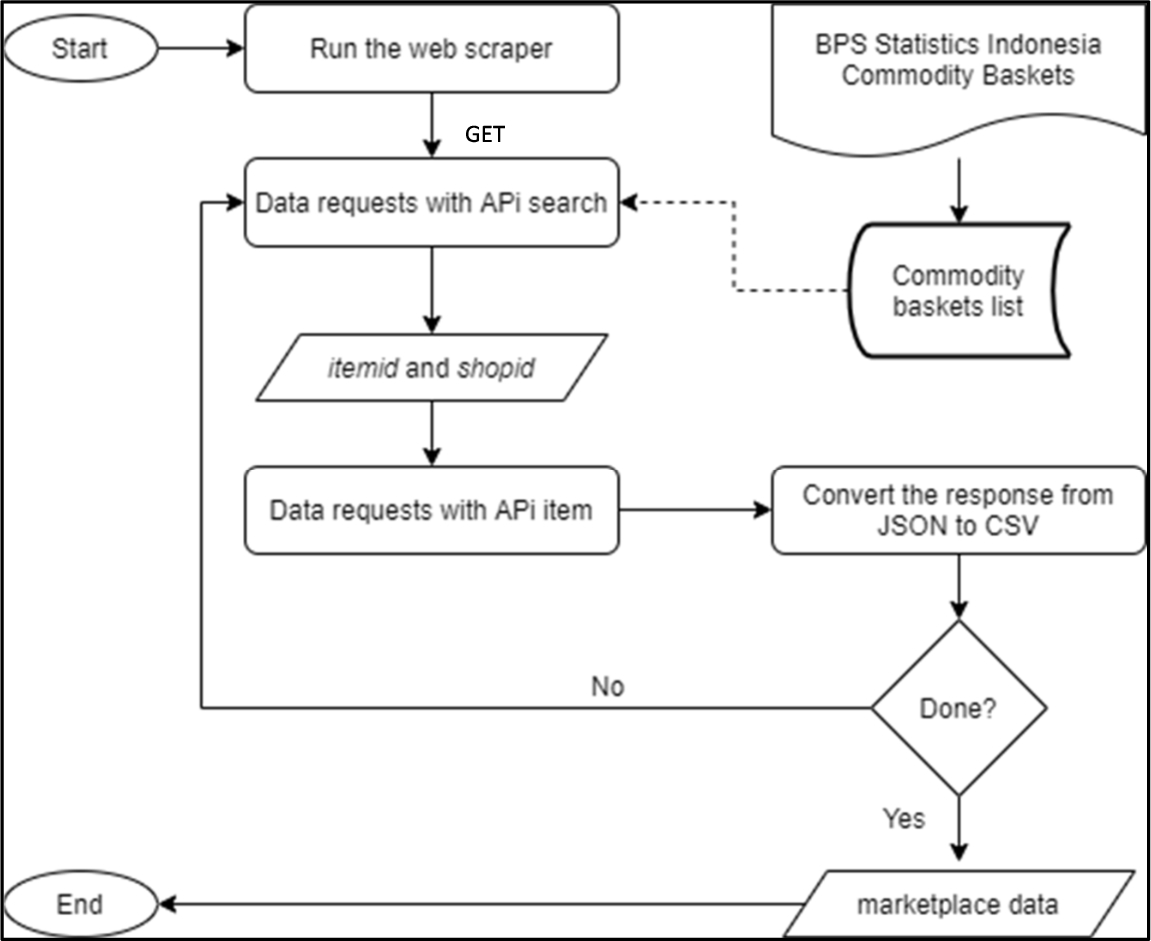
Figure 4 shows that the data is retrieved using the API search with the GET method, where the search is carried out using a list of commodity baskets that have been prepared. Furthermore, based on data obtained from API search, the “itemid “and “shopid” variables are extracted which are then used as variables to obtain marketplace data with API items. The data on the website is returned to the user in JSON format. The JSON data is converted into a flat CSV file to make it easier to use for further analysis.
Data preprocessing.
Fig. 5.
Data preprocessing flow.
Formatting and Data Type Adjustments
Data adjustments were made due to errors in the data format when the data was collected.
Commodity Basket Classification
This research classification technique refers to the web scraping data classification technique in the CPI Manual Concepts and Method [7]. There are two techniques for classifying commodities in research. First is text string matching and the second is category mapping. In this study, two-techniques classification is carried out to avoid misclassification of the commodities The following figure (Fig. 6) shows how the classification works in this study.
Fig. 6.
Commodity basket classification flow.
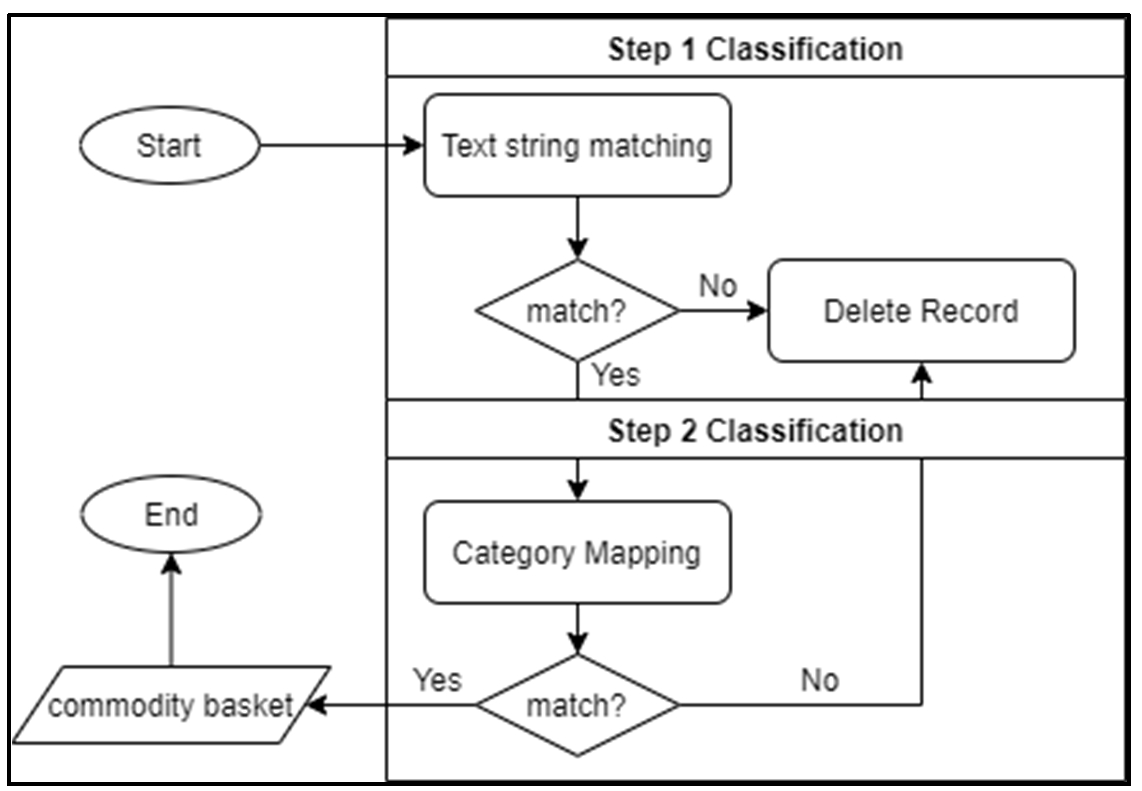
In the first classification step, the data string is classified using text string matching to make sure that the data is in order with the BPS commodity baskets. Then, we do the category mapping as the second step classification. In this process, we make sure that the category of the data is matching with the BPS commodity baskets categories. In the end, it will build a full dataset of marketplace commodity baskets based on the BPS commodity basket.
Data Filtering
BPS-Statistics Indonesia, in selecting respondents, selected merchants with the criteria of being crowded with consumers. In the marketplace data approach, the data that has no history/trace of the seller means that it cannot be used as an object of analysis. So at this stage, the data records that have no historical sales are filtered. In this study, the data is filtered based on the location. First, eliminating the data records that are located outside Indonesia and data records without location information. Next, build some supporting variables to filter the location of the data records that are classified as the CPI city in Java to support the filtering stage, namely the “information” variable (Not CPI City on Java Island; CPI City on Java Island) and “cpi_city”. (Name of City/Regency in Java Island).
Price Standardization
Standardization of the price of a record is carried out to equalize the size of a unit [14]. According to the concept and definition of BPS-Statistics itself, retail traders use transactions with standard units such as kilograms and liters. So that in this study, the price standardization of each record is carried out into a standard unit by performing one of the web-scraped data classification techniques [7], namely manual mapping.
Outlier Detection
Complete a selection of records that are detected as outlier data to avoid fraudulent data and the effect on the standardized average price [7, 12]. This method is used based on IMF guidelines in dealing with outliers data. It is stated that prevention is seen based on the median and the quartile value. Thus, in this study, the control of outlier data used the IQR method [19].
Data Tracing
Data tracing is employed to filter the data that has price movements in each month. At this stage, the “weeks” and “month” variables are formed which are used as additional information on the period of a data record and preparation for calculating the Consumer Price Index.
Handling Missing Values
The elimination of extreme prices is also carried out to avoid the impact that occurs on average commodity prices [12]. In the CPI Manual Concepts and Method (2020) book, it is stated that there are four ways to handle missing data [7], those are:
1. Ignore observations for which prices data are missing so that a suitable sample is retained even though there are fewer samples.
2. Use the last observed price on the missing price data.
3. Conduct Imputation of missing price data with changes in average prices over a certain period.
4. Conduct Imputation of missing price data based on the price changes that are comparable to other similar outlets.
Based on the results of interviews with informants, currently, the handling of lost data at BPS-Statistics Indonesia uses a one-month waiting system, where if there is some missing data, the price is equated with the last survey. In the second month, if nothing is found, a change is made by asking for the price in the previous month. So, in this study, the prevention of missing data was carried out using the Last Observation Carried Forward (LOCF) method.
LOCF is one of the missing data imputation methods that are usually used in longitudinal data studies [17]. LOCF was used to maintain sample size as well as to reduce bias caused by the attrition of participants in the study.
Data Compiling
The data from the preprocessing of the previous stages was then compiled with the data obtained from the BPS-Statistics by taking slices of commodity baskets. So that it will simplify the process of calculating the CPI and analysis.
CPI calculation. The data that has been through the data preprocessing stage is then calculated into CPI. The method used is using a modified Laspeyres index [3]. In this study, several changes were made from the BPS-Statistics processing stage as a form of adjustment to the form of marketplace data. The modification of the component process for calculating the CPI was carried out due to the limitations of the existing marketplace data, so it is hoped that there will be further studies on this matter. The difference between the marketplace and BPS-Statistics Indonesia in terms of processing can be seen in the following table (Table 1).
Table 1
Differences in BPS-statistics CPI processing and marketplace-based CPI
| No | Differentiator | BPS-Statistics | Marketplace |
| 1 | Market Weight | The location consists of the name of the market within a market type. However, the current weighting has only been applied to the rice commodity. The rest also has no location weight. | The selection of respondents on marketplace data was different from the selection of BPS-Statistics Indonesia’s respondents. Therefore, the weight of the location is neglected (for rice commodity). |
| 2 | Weighted by Type of Market | Based on the weight of traditional markets and modern markets. | Because this study only consists of one type of market, which is online marketplace, the weight of location type is equal to 1 (one) or in other words, it can be ignored. |
| 3 | Quality Weight | Calculating the average commodity price for each quality. | The average commodity price is calculated the average price of all qualities with similar commodities. |
| 4 | Commodity Weights | Used in the processing of CPI at the national level. | This study is not covering all the cities according to the 2018 Cost of Living Survey. So, the calculation of the CPI is limited to the cities where the CPI was taken. |
| 5 | Consumption Value | The Basic Consumption Value uses the BPS-Statistics Base CV for the 2018 Cost of Living Survey results. | The value of total marketplace and BPS-Statistics Indonesia’s consumption by expenditure group is adjusted to the number of commodities covered in the research. This consumption value is used in calculating the CPI for the expenditure group. |
Analysis. The results of calculating the CPI in the previous stage are used for the analysis of this stage. The calculation of the average price is carried out in April and May 2020, so that the results of the calculation are in the form of May 2020 CPI for commodity and per group with adjustments. At this stage, the descriptive analysis method is used. Descriptive analysis is presented with tables or graphs to evaluate the research results.
5.Results and discussion
5.1.Web scraping implementation
Listing commodities. This study uses a list of commodity items included in the BPS-Statistics commodity basket as a result of the 2018 Cost of Living Survey. The BPS-Statistics commodity basket consists of 835 types of commodities from 11 expenditure groups, where the expenditure groups with codes 09 and 10 are service commodities, which is not the scope of this study. The details of the expenditure groups covered in the study are presented in the following table (Table 2) .
Table 2
List of expenditure groups in this study
| No | Group code | Expenditure group |
| 1 | 01 | Food, Beverages, and Tobacco |
| 2 | 02 | Clothing and Footwear |
| 3 | 03 | Housing, Water, Electricity, and Household Fuels |
| 4 | 04 | Equipment and Routine Household Maintenance |
| 5 | 05 | Health |
| 6 | 06 | Transportation |
| 7 | 07 | Information, Communication, and Financial Services |
| 8 | 08 | Recreation, Sports, and Culture |
| 9 | 11 | Personal Care and Other Services |
The results of commodity listings used for search on the web scraper, which is reduced to 535 types of commodities.
5.2.Research commodity coverage
The data that has been compiled is then tabulated to see the coverage of the final commodity in this study. The final commodity coverage of this research can be seen in the following table.
Table 3
BPS-statistics Indonesia’s and this study commodities coverage finale
| No | CPI city | Province | BPS-Statistics | Marketplace coverage |
| 1 | DKI Jakarta | DKI Jakarta | 473 | 221 |
| 2 | Bogor | West Java | 351 | 97 |
| 3 | Sukabumi | West Java | 333 | 18 |
| 4 | Bandung | West Java | 411 | 187 |
| 5 | Cirebon | West Java | 374 | 55 |
| 6 | Bekasi | West Java | 350 | 127 |
| 7 | Depok | West Java | 341 | 121 |
| 8 | Tasikmalaya | West Java | 355 | 48 |
| 9 | Cilacap | Central Java | 306 | 20 |
| 10 | Purwokerto | Central Java | 364 | 0 |
| 11 | Kudus | Central Java | 314 | 13 |
| 12 | Surakarta | Central Java | 356 | 99 |
| 13 | Semarang | Central Java | 408 | 117 |
| 14 | Tegal | Central Java | 340 | 28 |
| 15 | Yogyakarta | DIY Yogyakarta | 400 | 93 |
| 16 | Jember | East Java | 358 | 34 |
| 17 | Banyuwangi | East Java | 315 | 22 |
| 18 | Sumenep | East Java | 320 | 4 |
| 19 | Kediri | East Java | 373 | 61 |
| 20 | Malang | East Java | 382 | 113 |
| 21 | Probolinggo | East Java | 340 | 22 |
| 22 | Madiun | East Java | 335 | 33 |
| 23 | Surabaya | East Java | 420 | 162 |
| 24 | Tangerang | Banten | 335 | 132 |
| 25 | Cilegon | Banten | 333 | 27 |
| 26 | Serang | Banten | 375 | 44 |
Table 3 shows the number of commodities covered by BPS-Statistics Indonesia and the number of commodities covered by the marketplace, which are used in this study to calculate the consumption values and the CPI. There is a significant difference in the amount of coverage compared to the coverage by BPS-Statistics. It depends on the conditions of each CPI city whether the city has a high or low level of technology adoption. Commodities with greater coverage are indicated by larger, more developed urban areas, and the rapid use of technology in each area.
Furthermore, we will see the pattern of the CPI value from the marketplace and the BPS approach. However, it should be noted that the results obtained will not replace the CPI produced by BPS because further research is needed. This is why this study is rather concerned with the movement pattern to provide initial insight to stakeholders.
In addition, Purwokerto district in this study will be not analyzed because there is no commodity package covered. Moreover, DKI Jakarta has the highest coverage. This is in line with our expectation because DKI Jakarta province is the capital of Indonesia.
5.3.Consumption value patterns by BPS-statistics and marketplace data
The marketplace consumption value is obtained from the processing results at the CPI calculation stage, while the BPS-Statistics consumption value is obtained from the Sub-directorate of Consumer Price Statistics. The consumption values are used to see the movement pattern is at the level of the expenditure group. This is also used to see how much people consume a commodity, so that it can see a picture of people’s consumption patterns and becomes one of the auxiliary variables in calculating the consumer price index.
In this section, a random sample is taken in the format of expenditure groups in a CPI city for each particular movement pattern (Fig. 9) where there are 162 events with 9.26% or 15 events experiencing conditions where the BPS-Statistics Consumption Value (CV) is lower than the marketplace CV. In the following figure, the CV data was first carried out with a 10 logarithmic transformation to show the movement pattern more clearly because some cases of the differences are too small. The complete data on CV can be seen in the Appendix section.
Fig. 7.
Conditions of consumption values (CV) by BPS-statistics and marketplace.
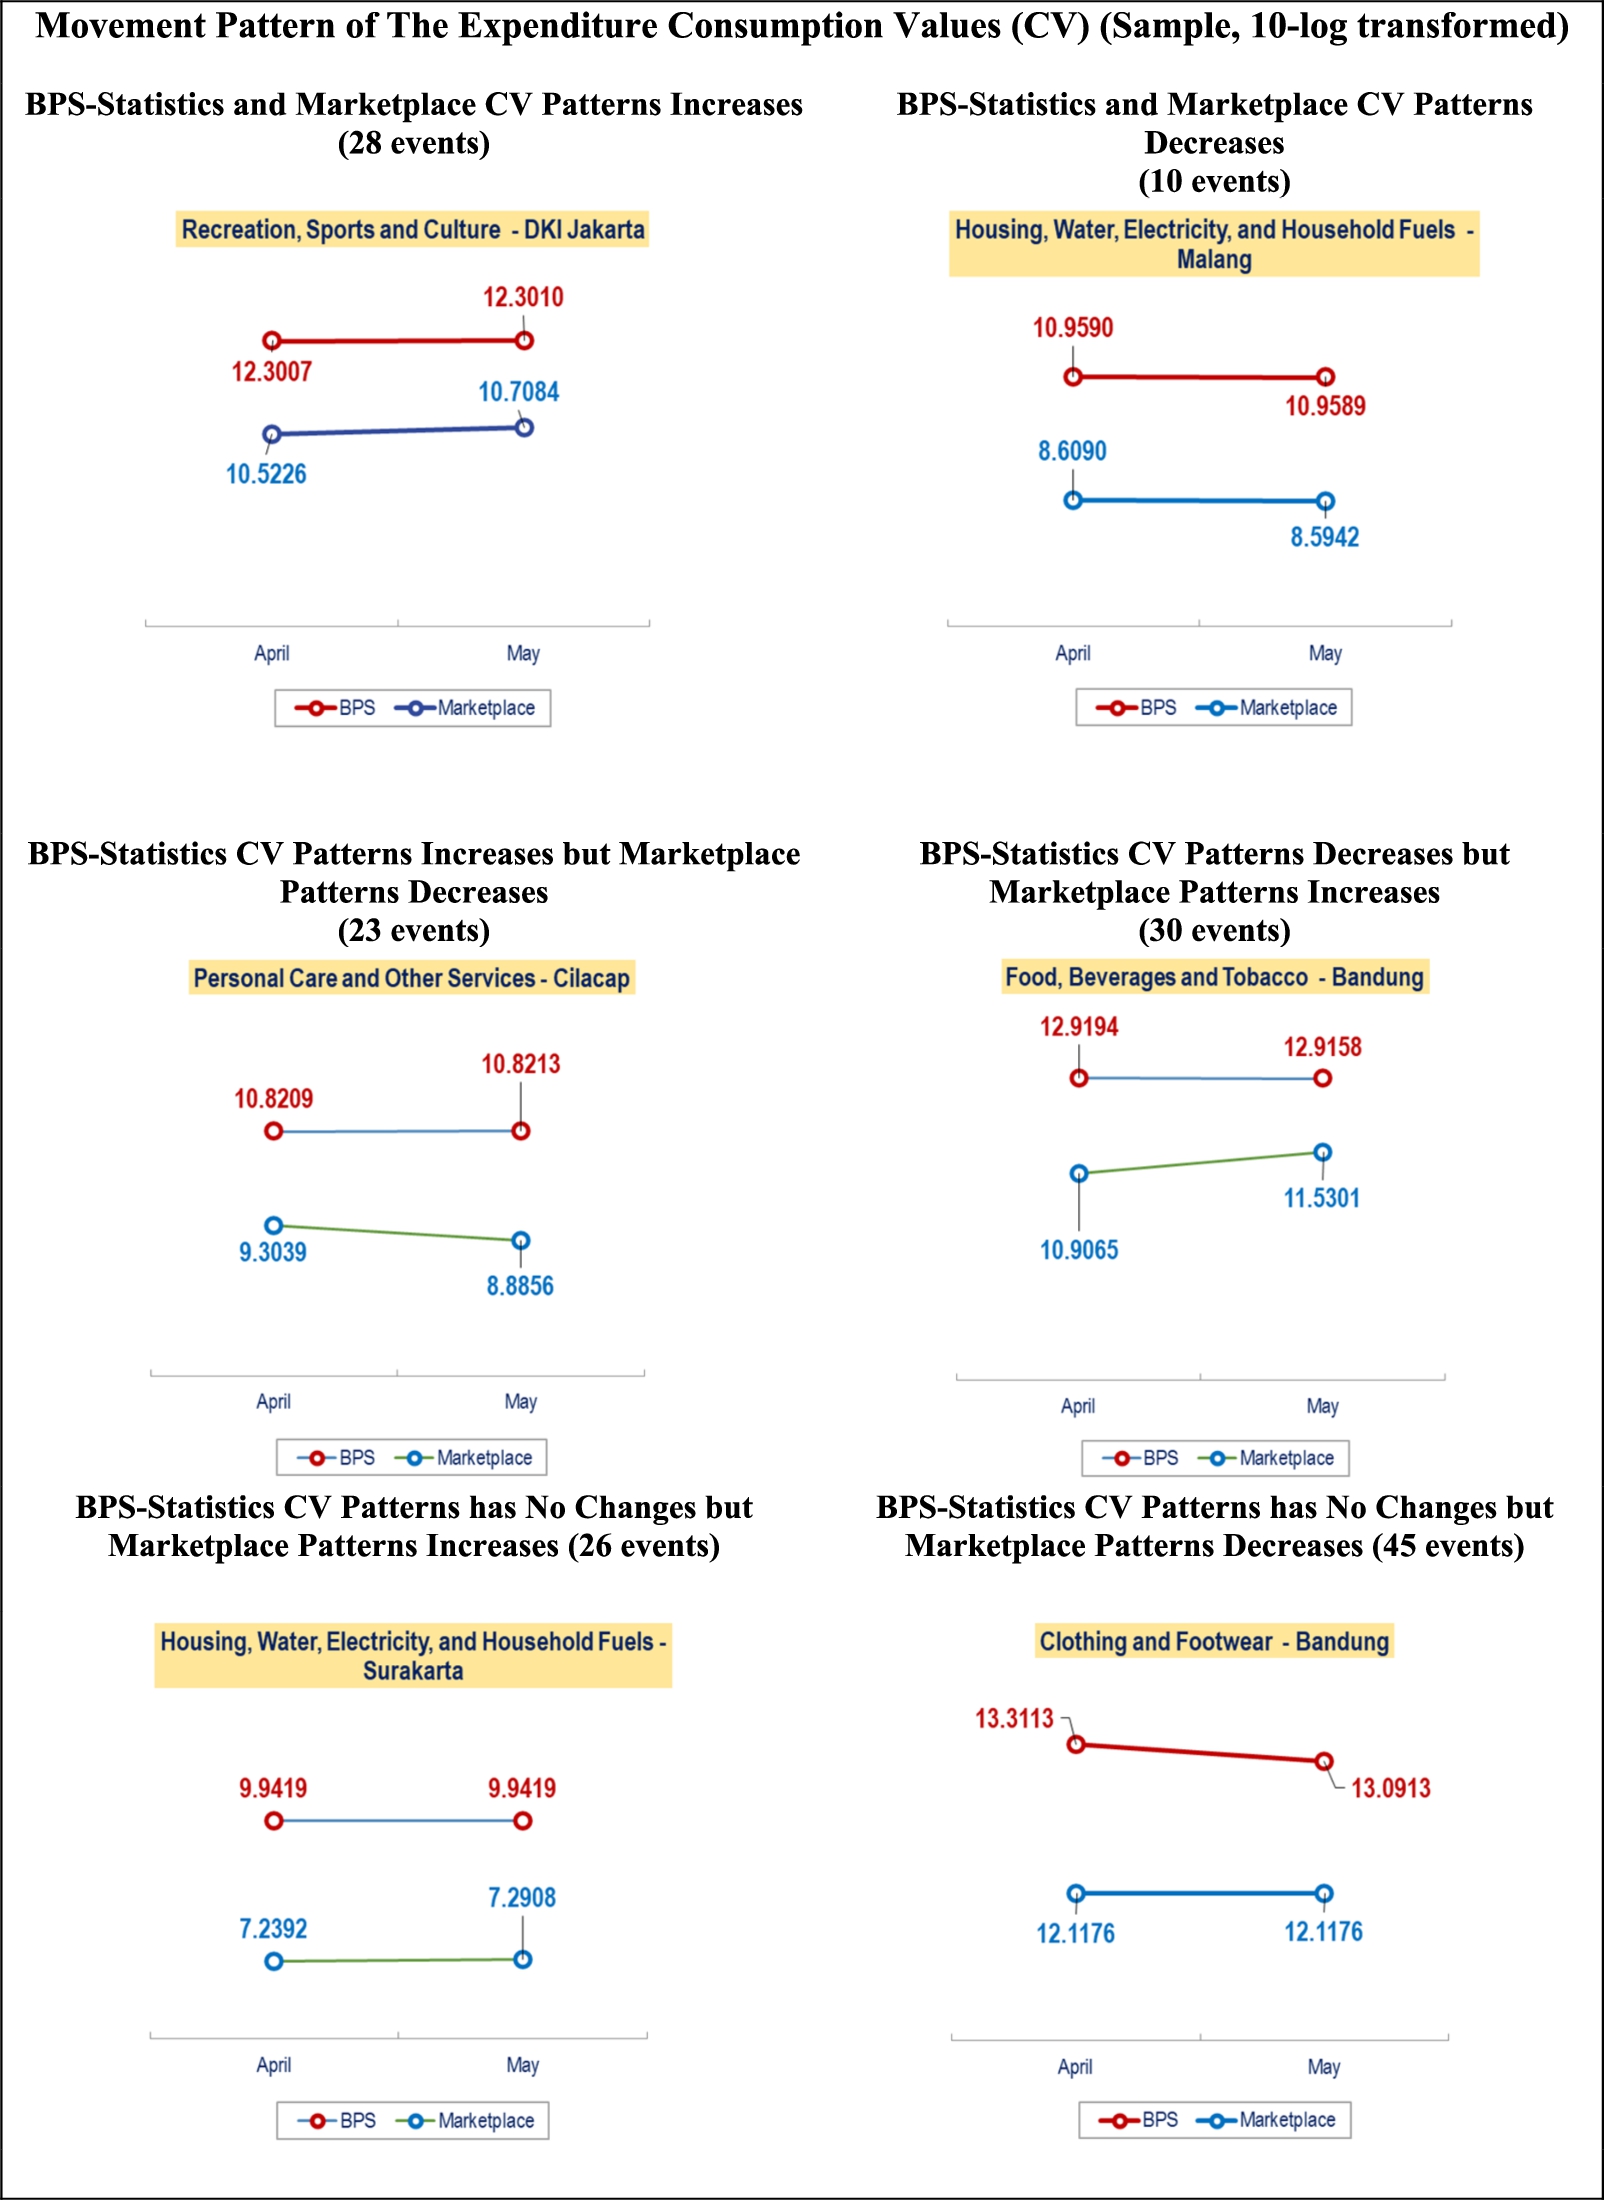
From Fig. 7, it can be seen that there are 38 events or 23.46% events of the consumption value that have a similar pattern, there are 53 events or 32.72% contradictory patterns, and the rest or 43.82% BPS-Statistics does not change when the marketplace changes. This means that the movement of marketplace data consumption patterns is more volatile than the pattern of consumption values obtained from BPS-Statistics.
5.4.Marketplace-based consumer price index results with BPS-statistics
Differences in the concepts and definitions by BPS-Statistics Indonesia, such as the weight of quality and consumption value for calculating the CPI and the unavailability of marketplace supporting data are the main limitations in this study. Nonetheless, after going through the adjustment process and approach, this research is able to produce CPI with a marketplace data approach.
Furthermore, a descriptive analysis is carried out regarding the CPI that has been produced before. The analysis is implemented in each city and categorized into two groups, namely at the commodity level and the level of the expenditure group. In this study, we calculate the CPI of May 2020.
Commodity Level. At the commodity level, two cases are analyzed based on the BPS-Statistics Indonesia’s CPI value, the commodities that generally have the highest and lowest BPS-Statistics Indonesia’s CPI.
1. Highest BPS-statistics Indonesia’s CPI value in general
Based on May 2020 BPS-Statistics CPI, the commodity that generally has the highest CPI value in each CPI city is the commodity of shallots (Fig. 8) . Cities with shallot commodities as a commodity with the highest CPI are Bandung, Bekasi, Bogor, Depok, Probolinggo, Semarang, Tangerang, and Tegal, where the data on the marketplace data for shallot commodities is covered by 12 CPI cities.
Fig. 8.
BPS-statistics Indonesia and marketplace-based CPI for shallot commodities.
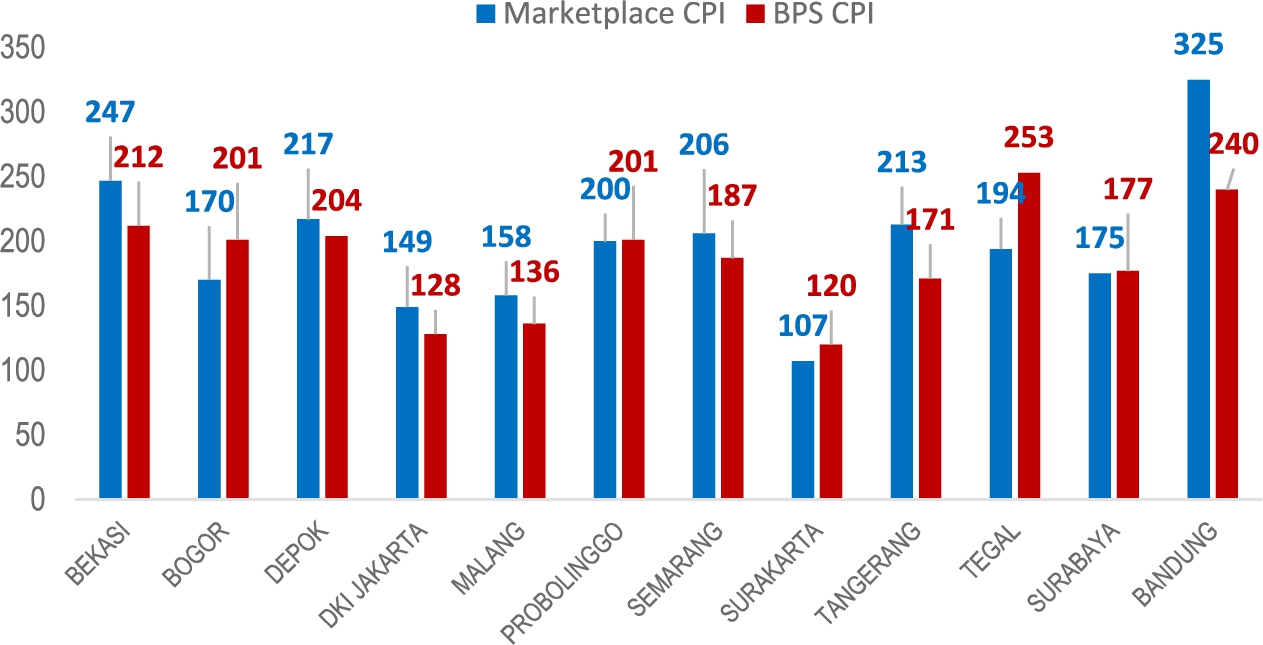
Figure 8 shows that the marketplace-based CPI at the commodity level generally has a higher index than the BPS-Statistics Indonesia’s CPI. The five cities with lower index scores than BPS-Statistics Indonesia’s CPI were Bogor, Probolinggo, Surakarta, Tegal, and Surabaya. Based on several online news publications, the demand for shallots before Eid al-Fitr (Islamic festival) has experienced a rapid increase in prices. This event caused a higher CPI for both the BPS-Statistics CPI and the CPI with a marketplace data approach.
2. Lowest BPS-statistics CPI value
The Consumer Price Index (CPI) is an index that measures the average price of goods and services consumed by households. The lower CPI Value basically means that the CPI tries to measure the level of aggregate prices in an economy and thus measures the purchasing power per unit of a country’s currency.
The commodities of each city with the lowest BPS-Statistics Indonesia’s CPI consist of various commodities, the lowest is the city of Malang with a value of 43.86 for the Red Chili commodity. The lowest BPS-Statistics Indonesia’s CPI ranges from 43.86 to 103.21 CPI units (Table 4).
Table 4
Summary of BPS-statistics Indonesia and marketplace-based CPI in each city with the lowest BPS-statistics CPI as a base in May 2020
| No | CPI city | Commodity | BPS-Statistics Indonesia CPI | Marketplace-based CPI |
| 1 | Bandung | Jengkol | 66.47 | 77.32 |
| 2 | Banyuwangi | Bleach | 102.77 | 106.38 |
| 3 | Bekasi | Leek | 71.93 | 68.20 |
| 4 | Bogor | Deodorant | 75.85 | 77.21 |
| 5 | Cilacap | Women’s shoes | 100.44 | 101.09 |
| 6 | Cilegon | Salt | 96.67 | 87.95 |
| 7 | Cirebon | Pepper/Pepper | 71.52 | 117.15 |
| 8 | Depok | Cayenne pepper | 76.18 | 119.64 |
| 9 | DKI Jakarta | Soun | 71.17 | 71.34 |
| 10 | Jember | Towel | 84.12 | 92.97 |
| 11 | Kediri | Avocado | 49.21 | 47.65 |
| 12 | Kudus | Panties | 101.76 | 99.70 |
| 13 | Madiun | Garan | 88.97 | 90.71 |
| 14 | Malang | Red chili pepper | 43.86 | 60.97 |
| 15 | Probolinggo | Garlic | 55.64 | 70.27 |
| 16 | Semarang | Cayenne pepper | 75.83 | 107.29 |
| 17 | Serang | Snack/Snack | 97.05 | 113.05 |
| 18 | Sukabumi | Towel | 77.44 | 85.10 |
| 19 | Sumenep | Potato | 103.21 | 102.47 |
| 20 | Surabaya | Avocado | 74.94 | 69.20 |
| 21 | Surakarta | Salt | 87.14 | 76.85 |
| 22 | Tangerang | Red chili pepper | 79.9 | 113.20 |
| 23 | Tasikmalaya | Cayenne pepper | 74.43 | 93.65 |
| 24 | Tegal | Salt | 89.93 | 85.63 |
| 25 | Yogyakarta | Cayenne pepper | 84.23 | 98.90 |
Table 4 shows that the BPS-Statistics Indonesia’s CPI tends to be lower than the marketplace-based CPI. The CPI with the lowest value-based on BPS data for the majority of cities is dominated by chilies, especially cayenne pepper, taking place in the Depok, Semarang, Tasikmalaya, and Yogyakarta city. These cases can occur due to weather factors in this commodity.
On the other hand, the cayenne pepper commodity shows an index value of below one hundred so that it has the potential to turn inflation into deflation as the harvest season enters. However, for the cayenne pepper commodity, the CPI with the marketplace data approach in that city has a large enough gap, some even have a CPI value exceeding one hundred. This means that price changes in marketplace data for cayenne pepper are greater than price changes in the traditional and modern market approaches calculated by the BPS-Statistics. In addition, it can be concluded that there are indications of the coming of harvests that have the potential to make the deflation of CPI value, not having much effect on the condition of commodity sales in the marketplace.
Expenditure group level. At this level, comparisons are made among expenditure groups in each city, so that differences in the amount of the CPI value can be analyzed using the BPS-Statistics and marketplace approaches. In this paper, a sample from 25 cities is taken with the highest number of commodity coverage, Jakarta. The rest comparison results can be found in the Appendix.
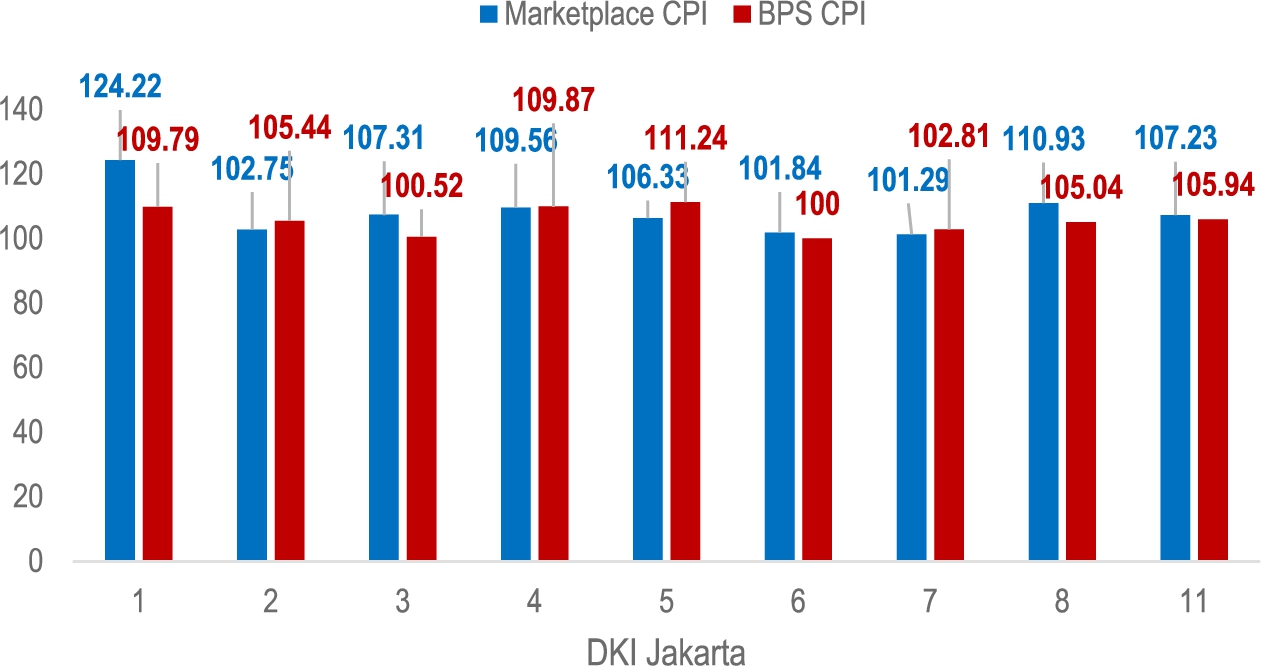
DKI Jakarta. DKI Jakarta’s CPI at the expenditure group level tends to be the same. The figure below (Fig. 9) shows that the difference in the CPI using the two approaches in each expenditure group does not exceed 15 CPI units. The biggest difference occurred in the Food, Beverage, and Tobacco (1) expenditure group, which was 14.43 CPI units. It also shows that the CPI value with the marketplace data approach in a general has higher CPI value than BPS. This is indicated that the relative prices difference where the marketplace data has a higher relative price value than BPS, which is in line with Mitchell’s research [11].
Fig. 9.
DKI Jakarta’s BPS-statistics and marketplace-based CPI at expenditure group level.
6.Conclusion and future works
Based on the results and discussion that has been done, the following conclusions can be obtained.
1. The construction of a web scraper in one of the marketplaces in Indonesia to obtain marketplace data has been successfully built. The web scraper created can extract data directly into CSV format after receiving a response from the marketplace website. However, the data that this study obtained is limited, because we do not have full access to the existing database.
2. The consumption value using the marketplace data sales value approach tends to be lower than the BPS-Statistics consumption value. However, the patterns of consumption value movement, in general, are similar. This shows that the marketplace data obtained in this study are aggregated below BPS-Statistics data, so the total consumption value obtained from the marketplace approach is generally lower.
3. The CPI with a marketplace data approach at the city level tends to have a higher index value than the survey-based CPI of BPS-Statistics Indonesia. This indicates a difference in relative prices for BPS-Statistics commodities and marketplace data. At the expenditure group level, the BPS-Statistics Indonesia’s CPI and the marketplace, in general, have quite a small difference, meaning that the CPI calculation with marketplace data is quite good.
These are some suggestions for future works to continue this research:
1. Commodities produced in this study do not include all commodity items listed in the 2018 Cost of Living Survey commodity basket. This is due to the classification of commodities using text string matching and category mapping. For this reason, in further research, it can be studied the classification method in marketplace data to obtain maximum results.
2. The treatment of standardization of prices on commodities also still uses manual mapping, so it is necessary to study further how to detect the quantity of a unit so that the process and results of standardization are more precise.
3. In further research, collaboration can be coordinated with the selected marketplace office so that direct access to the data can be obtained.
Acknowledgements
This research would not have been possible without the support from the interviewees who have agreed to be interviewed for the purposes of this research, especially staff of the Sub-directorate for Statistical Model Development BPS-Statistics, staff of the Sub-Directorate of Consumer Price Statistics BPS-Statistics, and Politeknik Statistika STIS.
Appendices
Appendix
The full datasets of web-scraped data, marketplace consumption values, and the marketplace-based CPI’s are remains available at https://github.com/mghozyah/dataios.
References
[1] | R. Anandan, R. Sipahimalani, A. Bharadwaj, J. Jhangiani, D. Kim and S. Ramesh, e-conomy SEA: Unlocking the $200B Digital Opportunity. Asia Pasific: Google-Temasek, 2016, available at: https://www.thinkwithgoogle.com/intl/en-apac/future-of-marketing/digital-transformation/e-conomy-sea-unlocking-200b-digital-opportunity/. |
[2] | R. Anandan, R. Sipahimalani, S. Saini, S. Aryasomayajula and W. Smittinet, e-Conomy SEA 2018: Southeast Asia’s internet economy hits an inflection point. Asia Pasific: Google-Temasek, 2018, available at: https://www.thinkwithgoogle.com/intl/en-apac/future-of-marketing/digital-transformation/e-conomy-sea-2018-southeast-asias-internet-economy-hits-inflection-point/. |
[3] | Badan Pusat Statistik, Buku Pedoman Survei Harga Konsumen, BPS, Jakarta, (2013) , Available at: https://sirusa.bps.go.id/webadmin/pedoman/Suvei%20Harga%20Konsumen.pdf. |
[4] | R. Bukth and R. Heeks, Defining, Conceptualising and Measuring the Digital Economy, Manchester, UK, 2017, Manchester Centre for Development Informatics Working Paper 68, Available at: https://www.research.manchester.ac.uk/portal/en/publications/defining-conceptualising-and-measuring-the-digital-economy(c9ae8345-6f3c-4d5e-9496-d7bd00153df3)/export.html. |
[5] | U.S. Bureau of Economic Analysis. (March 2018). Digital Economy. Available at https://www.bea.gov/data/special-topics/digital-economy. |
[6] | A. Cavallo and R. Rigobon, The billion project: Using online prices for measurement and research, Journal of Economic Perspectives 30: (2) ((2016) ), 151–178. doi:10.1257/jep.30.2.151. |
[7] | I.M. Fund, Consumer Price Index Manual Concepts and Methods, 2020, available at: https://www.imf.org/~/media/Files/Data/CPI/cpi-manual-concepts-and-methods.ashx. |
[8] | R. Kestenbaum, What Are Online Marketplaces and What Is Their Future? Forbes, Vol. 26, 2017, available at: https://www.forbes.com/sites/richardkestenbaum/2017/04/26/what-are-online-marketplaces-and-what-is-their-future/#563510603284. |
[9] | K. Laudon and C. Traver, E-Commerce 2016: Business, Technology, Society, 12th edn, (2017) , Available at: https://www.pearson.com/store/p/e-commerce-2016-business-technology-society/P100000775967. |
[10] | T. Mesenbourg, Measuring The Digital Economy, 2001, available at: https://www.census.gov/content/dam/Census/library/working-papers/2001/econ/umdigital.pdf. |
[11] | T. Mitchell, E-commerce and the Consumer Price Index: Measuring Inflation in a Digital Economy. Published by authority of the Minister responsible for Statistics Canada ©Her Majesty the Queen in Right of Canada as represented by the Minister of Industry, 2019, 2019, Available at: https://www150.statcan.gc.ca/n1/pub/62f0014m/62f0014m2019008-eng.htm. |
[12] | U. Nations, Practical Guide to Producing Consumer Price Indices, Switzerland, Geneva, (2009) , available at: https://unece.org/fileadmin/DAM/stats/publications/Practical_Guide_to_Producing_CPI.pdf. |
[13] | Y. Adhinugroho, A.P. Putra, M. Luqman, G.Y. Ermawan, S. Mariyah, and S. Pramana, Development of online travel Web scraping for tourism statistics in Indonesia, Information Research 25: (4) ((2020) ), paper 885. doi:10.47989/irpaper885. |
[14] | S. Pramana, B. Yuniarto, R. Kurniawan, R. Yordani, J. Lee, I. Amin, P.P.N. Satyaning and Y. Riyadi, Big data for government policy: Potential implementations of bigdata for official statistics in Indonesia, Jakarta, in: International Workshop on Big Data and Information Security (IWBIS), (2017) , pp. 17–21. doi:10.1109/IWBIS.2017.8275097. |
[15] | P. Presiden, Nomor: 74 Tahun 2017 Peta Jalan Sistem Perdagangan Nasional Berbasis Elektronik (Road Map E-commerce) Tahun 2017-2019. Lembaran Negara Republik Indonesia Tahun 2017 Nomor 176. Jakarta, available at: https://peraturan.bpk.go.id/Home/Details/73107/perpres-no-74-tahun-2017. |
[16] | Y. Rachman, Jalan terjal mengembangkan ekonomi digital. AntaraNews, Vol. 6, 2019, available at: https://www.antaranews.com/berita/944414/jalan-terjal-mengembangkan-ekonomi-digital. |
[17] | N.J. Salkind, Encyclopedia of Research Design (Vols. 1-0). Thousand Oaks, SAGE Publications, Inc., CA, (2010) . doi:10.4135/9781412961288. |
[18] | B.P. Statistik, 2019, Statistik E-Commerce 2019. Jakarta: BPS. Available at: https://www.bps.go.id/publication/2019/12/18/fd1e96b05342e479a83917c6/statistik-e-commerce-2019.html. |
[19] | J. Tukey, Exploratory Data Analysis, Addison-Wesley Company, Philippines, (1977) , available at: http://www.ru.ac.bd/wp-content/uploads/sites/25/2019/03/102_05_01_Tukey-Exploratory-Data-Analysis-1977.pdf. |
[20] | A.P. Wijaya and S. Mariyah, Study of consumer price index based on E-commerce in Indonesia, in: Asia-Pasific Economic Statistics Week. UN ESCAP, Bangkok, Thailand, (2019) . doi:10.13140/RG.2.2.15682.09924. |
[21] | S. Pramana, S. Mariyah, and T. Takdir, Big data implementation for price statistics in Indonesia: Past, current, and future developments, Statistical Journal of the IAOS 37: (1) ((2021) ) 415–427. doi:10.3233/SJI-200740. |


