
HOBBIT: A platform for benchmarking Big Linked Data
Abstract
An increasing number of solutions aim to support the steady increase of the number of requirements and requests for Linked Data at scale. This plethora of solutions leads to a growing need for objective means that facilitate the selection of adequate solutions for particular use cases. We hence present Hobbit, a distributed benchmarking platform designed for the unified execution of benchmarks for Linked Data solutions. The Hobbit benchmarking platform is based on the FAIR principles and is the first benchmarking platform able to scale up to benchmarking real-world scenarios for Big Linked Data solutions. Our online instance of the platform has more than 300 registered users and offers more than 40 benchmarks. It has been used in eleven benchmarking challenges and for more than 13000 experiments. We give an overview of the results achieved during 2 of these challenges and point to some of the novel insights that were gained from the results of the platform. Hobbit is open-source and available at http://github.com/hobbit-project.
1.Introduction
While the adoption of Linked Data (LD) is increasing steadily, the selection of the right frameworks for a given application driven by this paradigm remains elusive. This is partly due to the lack of (1) large-scale benchmarks for most steps of the LD life cycle [2] and (2) scalable benchmarking platforms able to generate uniform comparable evaluation results for the technologies which deal with this type of data [35]. The usefulness of benchmarks for characterising the performance of families of solutions has been clearly demonstrated by the varied benchmarks made available over recent decades [20,35,43,44]. For example, the TPC family of benchmarks is widely regarded as having provided the foundation for the development of efficient relational databases [20]. Modern examples of benchmarks that have achieved similar effects include the QALD [44] and BioASQ [43] benchmarks, which have successfully contributed to enhancing the performance of question answering systems over LD and in the bio-medical domain respectively. Modern benchmarking platforms have also contributed to the comparability of measurements used to evaluate the performance of systems. For example, benchmarking platforms such as BAT [11], GERBIL [35] and IGUANA [10] provide implementations and corresponding theoretical frameworks to benchmark different aspects of the LD life cycle in a consistent manner. Still, none of these benchmarking platforms can scale up to the requirements of modern applications.
The main contribution of this paper is the Hobbit (Holistic Benchmarking of Big Linked Data) platform. Hobbit was designed to accommodate the benchmarking of Big LD applications, i.e., applications driven by LD that exhibit Big Data requirements as to the volume, velocity and variety of data they process [8]. The platform was designed with extensibility in mind. Thus, its architecture is modular and allows the benchmarking of any step of the LD life cycle.11 The comparability of results was the second main design pillar. Consequently, Hobbit abides by the FAIR principles [47]. The practical usability of the platform was ensured by its use in 11 challenges between 2016 and 2019 (e.g., [1,17,18,21,22,24,31,34,40,41]). Hobbit is open-source and can be deployed locally, on a local cluster and on computing services such as Amazon Web Services (AWS). Additionally, we offer an online instance of the platform deployed on a cluster and available for experimentation.22 In this paper, we focus on the architecture of the platform and summarise the results of the evaluation campaigns carried out with the platform.
The rest of this paper is structured as follows: We begin by giving an overview of the state of the art in benchmarking LD in Section 2. In Section 3, we present requirements for the benchmarking platform that were gathered from experts. We used these requirements to derive the architecture for the platform presented in Section 4. We demonstrate the use of the platform in Section 5 by showing how it can be applied to benchmark a knowledge extraction framework along the axes of accuracy and scalability – a dimension that was not considered in previous benchmarking efforts. We present the different applications of the benchmarking platform in Section 6. Finally, we discuss limitations and derive future work in Section 7 before concluding the paper with Section 8.
2.Related work
The work presented herein is mostly related to benchmarking platforms for Linked Data/RDF-based systems. Several benchmarks have been developed in the area of linking RDF datasets [32]. A recent detailed comparison of instance matching benchmarks can be found in [13]. The authors show that there are several benchmarks using either real or synthetically generated datasets. SEALS 33 is the best-known platform for benchmarking link discovery frameworks. It offers the flexible addition of datasets and measures for benchmarking link discovery. However, the platform was not designed to scale and can thus not deal with datasets which demand distributed processing.
For a large proportion of existing benchmarks and benchmark generators (e.g., LUBM [23], BSBM [4], DBSBM [28] and FEASIBLE [37]), the focus has commonly been on creating frameworks able to generate data and query loads [4,23,28,37] able to stress triple stores. IGUANA [10] is the first benchmarking framework for the unified execution of these data and query loads. However, like the platforms aforementioned, IGUANA does not scale up to distributed processing and can thus not be used to benchmark distributed solutions at scale.
Knowledge Extraction – especially Named Entity Recognition and Linking – has also seen the rise of a large number of benchmarks [35]. Several conferences and workshops aiming at the comparison of information extraction systems (including the Message Understanding Conference [42] and the Conference on Computational Natural Language Learning [38]) have created benchmarks for this task. In 2014, Carmel et al. [6] introduced one of the first Web-based evaluation systems for Named Entity Recognition and Linking. The BAT benchmarking framework [11] was also designed to facilitate benchmarking based on these datasets by combining seven Wikipedia-based systems and five datasets. The GERBIL framework [35] extended this idea by being knowledge-base-agnostic and addressing the NIL error problem in the formal model behind the BAT framework.While these systems all allow for benchmarking knowledge extraction solutions, they do not scale up to the requirements of distributed systems.
In the area of Question Answering using LD, challenges such as BioASQ [43], and the Question Answering over Linked Data (QALD) [45] have aimed to provide benchmarks for retrieving answers to human-generated questions. The GERBIL-QA platform [46] is the first open benchmarking platform for question answering which abides by the FAIR principles. However, like its knowledge extraction companion, it is not designed to scale up to large data and task loads.
Frameworks aiming at benchmarking in a generic fashion are very rare. The Peel framework44 supports the automation of experiments on Big Data infrastructure. However, the framework only supports systems that can be executed on one of the supported Big Data solutions like Flink or Spark which excludes a lot of existing LD benchmarks and systems.55 Moreover, it does not support a large portion of the specific requirements for benchmarking Big LD described in Section 3. A major drawback is that the results generated by the platform are not transparent as the execution of systems and benchmarks is hidden from the users. This makes a comparison of the resources used by benchmarked systems impossible.
Also relevant according to the literature are novel Big Data benchmarks for benchmarking relational databases (e.g., BigBench [19] and OLTP [14]). However, although they come with scalable data and task generators, these benchmarks are solely focused on the benchmarking of relational databases and are not benchmarking frameworks.
A similar data generation-based approach is used by Plug and Play Bench [9]. However, in contrast to the other benchmarks, Plug and Play Bench aims at benchmarking different hardware settings on which the benchmark is executed instead of comparing different software solutions.
Table 1
Comparison of LD benchmarking frameworks, their applicability for all eight steps of the LD life cycle and their support of features necessary for benchmarking Big LD solutions
| Year | Extraction | Storage | Manual Revision | Linking | Enrichment | Quality Analysis | Evolution | Exploration | Scalable Data | Scalable Tasks | FAIR Benchmarking | |
| BAT | 2013 | ✓ | – | |||||||||
| GERBIL | 2014 | ✓ | – | ✓ | ||||||||
| GERBIL-QA | 2018 | – | ✓ | ✓ | ||||||||
| IGUANA | 2017 | ✓ | – | ✓ | ||||||||
| HOBBIT | 2017 | ✓ | ✓ | – | ✓ | ✓ | (✓) | ✓ | ✓ | ✓ | ✓ | ✓ |
Table 1 compares the existing benchmarking frameworks used to benchmark LD systems regarding their applicability for all eight steps of the LD life cycle as well as their support of features necessary for benchmarking Big LD solutions. The step “Manual Revision” is mentioned only for the completeness of the life cycle steps.
It can be seen that the Hobbit platform is the first benchmarking framework which supports all steps of the LD life cycle that can be benchmarked automatically.66 In addition, it is the first benchmarking platform for LD which scales up to the requirements of Big Data platforms through horizontal scaling. The comparability of Hobbit’s benchmarking results are ensured by the cluster underlying the open instantiation of the platform.77
3.Requirements
We adopted a user-driven approach to develop our platform. Additionally to the goals of the HOBBIT project, the requirements were mainly derived from an online survey as well as a workshop – both described in [16].88
The survey had 61 expert participants representing their organisations. These experts were contacted via mail using several mailing lists of the Semantic Web community. During the survey, the participants were asked to add themselves to one ore more of three stake holder groups. 48 participants classified themselves as solution providers, i.e., they represent an organisation which implements a LD system. 46 participants added themselves to the group of technology users, i.e., people which are using LD systems developed by a 3rd party. The third group – the scientific community which aims at identifying problems in existing solutions and developing new algorithms – comprised 47 participants. Asked for the target of the LD systems they are developing or using, 50 participants stated to work in the area of storage and querying, 39 in the area of Interlinking, 39 in Classification and Enrichment, 35 in Link Discovery, 31 in Extraction and 22 in Reasoning. The survey further asked which benchmarks the participants use. This was further detailed with the size and type of datasets (synthetic, real-world or a combination of both) they use as well as the KPIs they are interested in.
In 2016, a workshop was arranged within the programme of the Extended Semantic Web Conference. 21 conference participants took part in the workshop and discussed the goals of the HOBBIT project as well as requirements. The participants were separated into 4 groups – Generation & Acquisition, Analysis & Processing, Storage & Curation as well as Visualisation & Services – covering the complete LD life cycle. Each group discussed requirements which the benchmarks of this area as well as the benchmarking platform used to execute these benchmarks should fulfil.
To distinguish them from the FAIR principles, we will abbreviate these user requirements with U.
3.1.Functional requirements
U1 The main functionality of the platform is the execution of benchmarks.
U2 Benchmark results should be presented in human- and machine-readable form.
U3 It should be possible to add new benchmarks and new systems.
U4 The platform should offer repeatable experiments and analysis of results.
U5 The key performance indicators (KPIs) should include the effectiveness, e.g., the accuracy, and the efficiency, e.g., runtime of systems.
U6 The platform should be able to measure the scalability of solutions. This leads to the need of a scalable generation of both – data the evaluation is based on as well as tasks a system has to execute.
U7 The platform should support the benchmarking of distributed systems.
U8 It should support the execution of benchmarking challenges. This includes (1) the creation of challenges within the platform, (2) the registration of users with their system for the challenge, (3) the execution of the challenge experiments at a predefined point in time and (4) the summary of the experiment results for this challenge.
These functional requirements predefined the corner stones for the platforms architecture. In Section 4, it will be shown how the platform fulfils each of them.
3.2.Qualitative requirements
U9 The benchmarks should be easy to use and interfaces provided should be as simple as possible.
U10 The platform should support different programming languages.
U11 The results should be archived safely for later reference.
U12 The platform needs to be robust regarding faulty benchmarks or systems.
Several requirements – especially U1–U4 as well as U8 – addressed fundamental functions of a benchmarking platform which supports the execution of benchmarking challenges and were directly derived from this goal. However, the results of the survey as well as the workshop show that the participants agreed to the goals of the project and that especially the repeatability of experiments (U4) is of importance to the community. The range of mentioned KPIs in the survey as well as in the results of the workshop let to U5. The need to measure the efficiency of systems is one reason for U6. The large range of dataset sizes used by the survey participants was another reason.99 U7 was an important requirement to ensure the ability to benchmark systems which achieve their scalability by horizontal scaling. U9 was a result of the workshop. U10 and U11 were derived very early. Although not explicitly mentioned during the workshop, the usage of different programming languages within the community became evident. Additionally, U11 was derived from the usage of existing platforms which have already been accepted by the community, e.g., the citable URIs of GERBIL [35]. The error tolerance of a software is a general requirement for most developments. However, with U12 it gained additional attention because the platform allows the upload of third party software which might not be reliable.
We derived the degree of modularity and the error handling of the platform from these requirements (U1, U3–U12). The result analysis component and interfaces were designed to accommodate U2 and U9–U12. Details are provided in Section 4.
3.3.FAIR principles
From the beginning on, the platform was built to support the FAIR principles [47].1010
F1 (Meta)data are assigned a globally unique and persistent identifier.
F2 Data are described with rich metadata (defined by R1 below).
F3 Metadata clearly and explicitly include the identifier of the data they describe.
F4 (Meta)data are registered or indexed in a searchable resource.
A1 (Meta)data are retrievable by their identifier using a standardised communications protocol.
A1.1 The protocol is open, free, and universally implementable.
A1.2 The protocol allows for an authentication and authorisation procedure, where necessary.
A2 Metadata are accessible, even when the data are no longer available.
I1 (Meta)data use a formal, accessible, shared, and broadly applicable language for knowledge representation.
I2 (Meta)data use vocabularies that follow FAIR principles.
I3 (Meta)data include qualified references to other (meta)data.
R1 Meta(data) are richly described with a plurality of accurate and relevant attributes.
R1.1 (Meta)data are released with a clear and accessible data usage license.
R1.2 (Meta)data are associated with detailed provenance.
R1.3 (Meta)data meet domain-relevant community standards.
The following section shows the design of the Hobbit platform and how it supports the FAIR principles.
4.Platform architecture
4.1.Overview
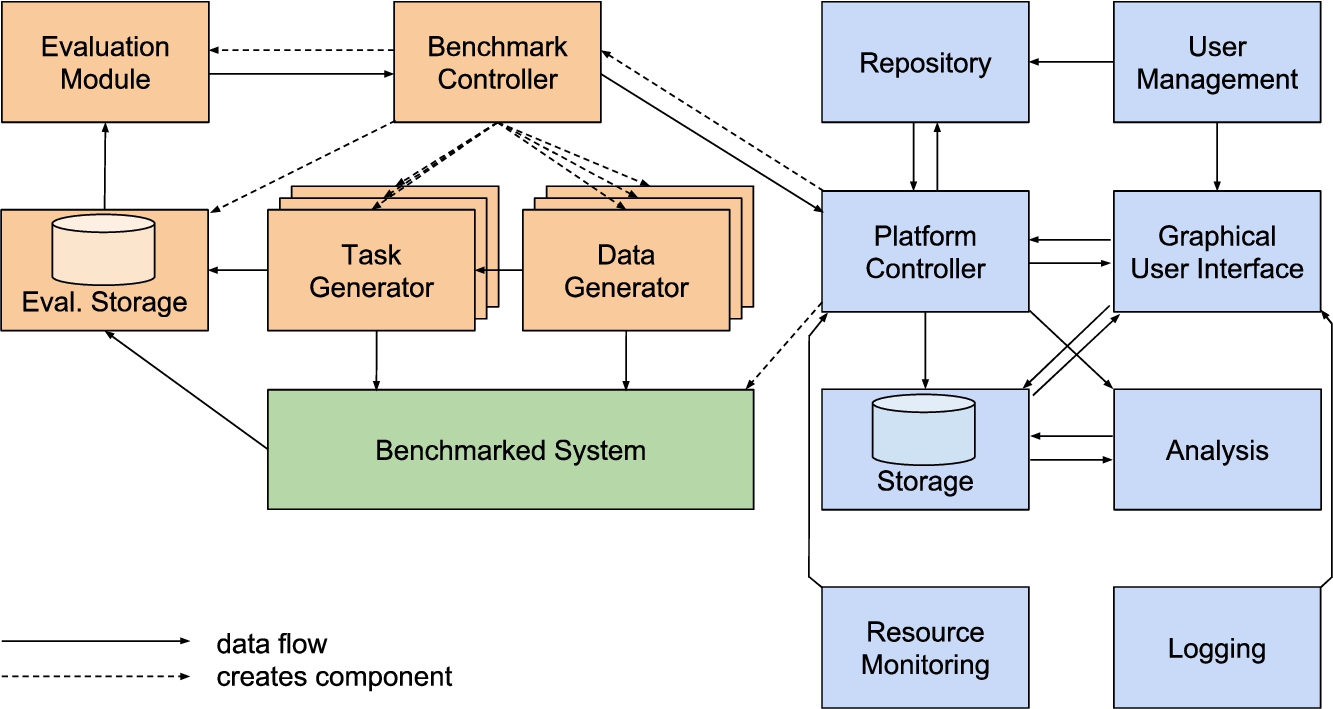
Figure 1 gives an overview of the architecture of the Hobbit platform. The platform is based on a container architecture, i.e., the components are implemented as independent containers. This eases the adding of new benchmarks and systems (U3) which can be implemented using different languages (U10). Additionally, it eases the development and maintenance of the platform itself and adds a separation between the platform, benchmark and system containers, thus limiting the influence of faulty program code to its container instead of decreasing the stability of the whole platform (U11, U12). Using containers for benchmark and system components also gives the possibility of scaling both by offering the deployment of additional containers across multiple machines (U6, U7). The communication between these components is ensured by means of a message bus. Choosing this established communication method eases the implementation of benchmarks and systems based on different programming languages (U9, U10).
Fig. 1.
Architecture of the Hobbit platform.
4.2.Platform components
The platform has several components (see blue elements in Fig. 1). They offer the main functionality of the platform.
4.2.1.Platform controller
The platform controller is the central component of the Hobbit platform. Its main role is to coordinate the interaction of other components as needed. This mainly includes handling requests that come from the user interface component, starting and stopping of experiments, observing the health of the cluster and triggering the analysis component. In addition, the controller manages a priority queue that contains user-configured experiments that are to be executed in the future. The execution order of experiment configurations is determined using (1) the time at which they have been configured by the user (following the first-in-first-out principle) and (2) the priority of experiments, which is derived from whether the said experiment is part of a scheduled challenge (higher priority) or not (U8). The internal status of the platform controller is stored in a database. This enables restarting the controller without losing its current status, e.g., the content of the experiment queue.
The platform controller uses features of Docker Swarm to observe the status of the cluster that is used to execute the experiments.E.g., if one of the nodes drops out of the cluster, the comparability between single experiments might not be given (U4). Thus, the platform controller needs to be aware of the number of working nodes that are available for the experiment. If there is no running experiment and the queue is not empty, the platform controller initiates the execution of an experiment and observes its state. If the experiment takes more time than a configured maximum, the platform controller terminates the benchmark components and the system that belongs to the experiment. By these means, it also ensures that faulty benchmarks or systems cannot block the platform (U12).
4.2.2.Storage
The storage component contains the experiment results and configured challenges. It comprises two containers – a triple store that uses the Hobbit ontology to describe results and a handler for the communication between the message bus and the triple store. The storage component offers a public SPARQL endpoint with read-only access which can be queried via HTTP/HTTPS (U2, F4, A1).1111 The write access is limited to the platform controller, the user interface and the analysis component. The controller stores experiment results and manages running challenges. The user interface presents the available data to the user and enables the configuration of new challenges as well as the registration of systems for taking part in a challenge (U8). The analysis component requests experiment results from the storage and stores results of the analysis.
4.2.3.Ontology
The experiment results, the metadata of experiments and challenges as well as the results of the analysis component are stored as RDF triples [26] (I1). Where possible, we used established RDF vocabularies (I2, R1.3).1212 However, for describing the experiments and challenges in detail we created the Hobbit ontology.1313
The ontology offers classes and properties to define the metadata for the single benchmarks and benchmarked systems. For each benchmark or system a user would like to use within the platform, a metadata file has to be provided containing some general information. This includes the definition of a URI for each benchmark and system (F1), a name, a description and a URI of the API offered by the benchmark and implemented by the system. Based on the API URI the platform can map the available systems to the benchmarks to make sure that the system is applicable for a given benchmark.
Additionally, a benchmark’s metadata include parameters and KPIs. The parameter can be defined to be configurable through the user interface when starting an experiment and whether the parameter should be used as feature in the analysis component.
A system’s metadata offers the definition of several system instances with different parameterisations. The analysis method can make use of the different parameter values of the instances to measure the impact of the parameters on the KPIs.
Experiments are described with triples regarding (1) provenance, (2) the experiment results, (3) the benchmark configuration and (4) benchmark as well as (5) system metadata (F2, F3, I3, R1, R1.2). The provenance information covers – additionally to the metadata of the benchmark and system – the start and end time of the experiment as well as details about the hardware on which the experiment has been executed. The experiment results are generated by the implementation of the benchmark and typically contain results for the single KPIs which are defined in the benchmark’s metadata. Together with the metadata of the benchmark and system, the description of the KPIs and their description are used by the analysis component (U4). The platform controller assigns a URI to the experiment (F1) and copies the configuration of the benchmark as well as the metadata of the benchmark and system into the experiment’s metadata. Note that this makes sure that even if a user removes a benchmark or system from the platform after executing an experiment their metadata is still available (A2).
Challenges which are carried out on the platform are modelled by separating them into single tasks. Each task has a benchmark with a certain parameterisation and users can register their systems for the single tasks to take part in the challenge. A challenge and its tasks have a generated URI (F1) and come with a label as well as a description. Additionally, the creator of the challenge can define the execution date and the publication date of the challenge as well as a link to a web page giving further information about the challenge. The first date defines the point in time at which the execution of the single experiments of the challenge should start while the latter defines the day at which the results should be made public. The experiments that are part of a challenge, point to the challenge task for which they have been executed (I3).
Essentially, the ontology offers classes and properties to store the configuration and the results of an experiment. URIs are assigned to benchmarks, benchmarked software systems, and KPIs. Moreover, benchmark configurations as well as benchmark and system features, e.g., a certain parameterization, can be described. In addition to experiments, the ontology allows for the description of challenges, tasks in challenges and benchmarks associated with these tasks.
4.2.4.Analysis
This component is triggered after an experiment has been carried out successfully. Its task is to enhance the benchmark results by combining them with the features of the benchmarked system(s) and the data or task generators. This combination can lead to additional insights, e.g., strengths and weaknesses of a certain system (U4). While the component uses the results of benchmarks, it is modelled independently from any benchmark implementation.
4.2.5.Graphical user interface
The graphical user interface component handles the interaction with the user via HTTP/HTTPS (A1). It retrieves information from the user management that allows different roles enabling the user interface to offer functionality for authenticated users as well as a guest role for unauthenticated users. For example, a guest is only allowed to read the results of experiments and analysis (U2). Since the number of experiments is steadily increasing, the user interface offers a filter and sorting mechanism to increase the findability (F4). Experiments are currently visualized as table containing their metadata, the parameter values and the KPI values. This table view can also be used to compare several experiments with each other. Additionally, plots as shown in Fig. 2 are generated where applicable.1414
Fig. 2.
An example of a plot generated for a KPI. It shows the F1-measure the Jena Fuseki triple store achieved for 71 consecutive select queries during a run of the Odin benchmark [17].
![An example of a plot generated for a KPI. It shows the F1-measure the Jena Fuseki triple store achieved for 71 consecutive select queries during a run of the Odin benchmark [17].](https://content.iospress.com:443/media/ds/2020/3-1/ds-3-1-ds190021/ds-3-ds190021-g002.jpg)
Fig. 3.
An example of a diagram showing the Pearson correlations between the different parameters of the Odin benchmark [17] and the micro F1-measure achieved by the two triple stores Virtuoso and Jena Fuseki.
![An example of a diagram showing the Pearson correlations between the different parameters of the Odin benchmark [17] and the micro F1-measure achieved by the two triple stores Virtuoso and Jena Fuseki.](https://content.iospress.com:443/media/ds/2020/3-1/ds-3-1-ds190021/ds-3-ds190021-g003.jpg)
Authenticated users have additional rights ranging from starting experiments to organising challenges, i.e., define experiments with a certain date at which they will be executed (U1, U8).
Additionally, experiments and challenges have dereferencable URIs assigned, i.e., a user can copy the URI of an experiment or a challenge into the browser’s URL bar and the server shows the details of this resource (F1, A1). For our online instance, we offer w3id URIs to enable static URLs that can be redirected.1515
For each benchmark, a report can be generated. This comprises (1) a brief overview over the results of the last experiments carried out with the benchmark, (2) scatter plots that compare values of features and KPIs as well as (3) plots showing the correlation between benchmark features and the performance achieved by the single systems. Such a plot is shown in Fig. 3.
If the license of the data has been configured in the triple store, the information is shown in the user interface (R1.1). The data of our online instance is licensed under the Creative Commons Attribution 4.0 International Public License.1616
4.2.6.Message bus
This component contains the message bus system. Three different communication patterns are used. Firstly, labelled data queues simply forward data, e.g., the data generated by the mimicking algorithm is transferred from several data generators to several task generators. The second pattern works like remote procedure calls. The queue has one single receiving consumer that executes a command, e.g., a SPARQL query, and sends a response containing the result. Thirdly, a central broadcasting queue is used (hobbit.command). Every component connected to this queue receives all messages sent by one of the other connected components. This queue is used to connect the loosely coupled components and orchestrate their activities.
4.2.7.User management
The user management relies on Keycloak.1717 It allows the upload of private systems which cannot be seen by other users. Additionally, the platform makes use of different user roles to enable single users to create challenges. Note that the user management offers a guest role that enables unregistered users to see the publicly available experiment results.
4.2.8.Repository
The repository contains all available benchmarks and systems. For our online instance, the repository is a Gitlab1818 instance which can be used by registered users to upload Docker images and define the metadata of their benchmarks and systems (U3, R1.3). Note that the user can define the visibility of his system, i.e., the platform supports publicly accessible systems and benchmarks that can be used by every other registered user as well as private systems. However, the experiment results (including the system’s metadata) will always be made public.
4.2.9.Resource monitoring
The resource monitoring component uses Prometheus1919 to collect information about the hardware resources used by the benchmarked system. The benchmark can request this information to include it into its evaluation. At the moment, the CPU time, the disk space and the amount of RAM used by the system can be monitored. Based on the architecture of Prometheus, this list of metrics can be further extended.
4.2.10.Logging
The logging comprises three components – Logstash,2020 Elasticsearch2121 and Kibana.2222 While Logstash collects the log messages from the single components, Elasticsearch is used to store them inside a fulltext index. Kibana offers the user interface for accessing this index. The logs are kept private. However, owners of systems or benchmarks can download the logs of their components from the user interface.
4.3.Benchmark components
These components are part of given benchmarks and have been colored orange in Fig. 1. Hence, they are instantiated for a particular experiment and are destroyed when the experiment ends. A benchmark execution has three phases – an initialisation phase, a benchmarking phase and an evaluation phase. The phases are described in more detail in Section 4.5. It should be noted that the components described in this section represent our suggestion for the structure of a benchmark. However, the Hobbit platform supports a wide range of possible benchmark structures as long as a benchmark implements the necessary API to communicate with the platform controller.
4.3.1.Benchmark controller
The benchmark controller is the central component of a benchmark. It communicates with the platform controller and it creates and controls the data generators, task generators, evaluation-storage and evaluation-module.
4.3.2.Data generator
Data generators are responsible for supplying the other components with the data necessary for the experiment. Depending on the benchmark implementation, there are two ways types of generators. Either, a given dataset, e.g., a real-world dataset, is loaded from a file or the component encapsulates an algorithm able to generate the necessary data. Importantly, data generators can be run in a distributed fashion to ensure that the platform can create the necessary data volumes or data velocity. Typically, data generators are created by the benchmark controller and configured using benchmark-specific parameters. They generate data based on the given parameters and send said data to the task generators as well as to the system adapter and terminate when the required data has been created.
4.3.3.Task generator
Task generators get data from data generators, generate tasks that can be identified with an ID and send these IDs to the system adapter. Each task represents a single problem that has to be solved by the benchmarked system (e.g., a SPARQL query). The expected response for the generated task is sent to the evaluation storage. Like data generators, task generators can be scaled to run in a distributed fashion.
4.3.4.Evaluation storage
This component stores the gold standard results as well as the responses of the benchmarked system during the benchmarking phase. During the evaluation phase it sends this data to the evaluation module. Internally, the output of a benchmark is stored as a set of key-value pairs. Task IDs are used as key. Each value comprises (1) the expected result, (2) the result calculated by the benchmarked system as well as (3) the timestamp at which the task was sent to the system by a task generator and (4) the timestamp at which the response was received by the evaluation storage.
4.3.5.Evaluation module
The evaluation module is created by the benchmark controller at the beginning of the evaluation phase and requests results from the evaluation storage. It evaluates them by computing the KPIs associated with the benchmark. It should be noted that the decision which KPIs will be used is mainly up to the benchmark developer. Both, the effectiveness as well as the efficiency of systems can be measured (U5). After computing the KPIs the component summarises the evaluation results and sends them to the benchmark controller before it terminates.
4.4.Benchmarked system components
Each system to be benchmarked using the Hobbit platform has to implement the API of the benchmark to be used and the API of the platform. Since systems are typically not developed for the mere sake of being benchmarked with our platform, each system is usually connected to the platform by means of a system adapter container. The system adapter serves as a proxy translating messages from the Hobbit platform to the system to be benchmarked and vice versa. The system adapter of each of the systems to benchmark is instantiated by the platform controller when an experiment is started. Adapters can create additional containers that might contain components of the benchmarked system. Thereafter, they send a ready signal to the platform controller to indicate that they are ready to be benchmarked. They receive incoming data and tasks, forward them to the system and send its responses to the evaluation storage. Adapters stop the benchmark system and terminate after they receive a command indicating that all tasks have been completed.
Fig. 4.
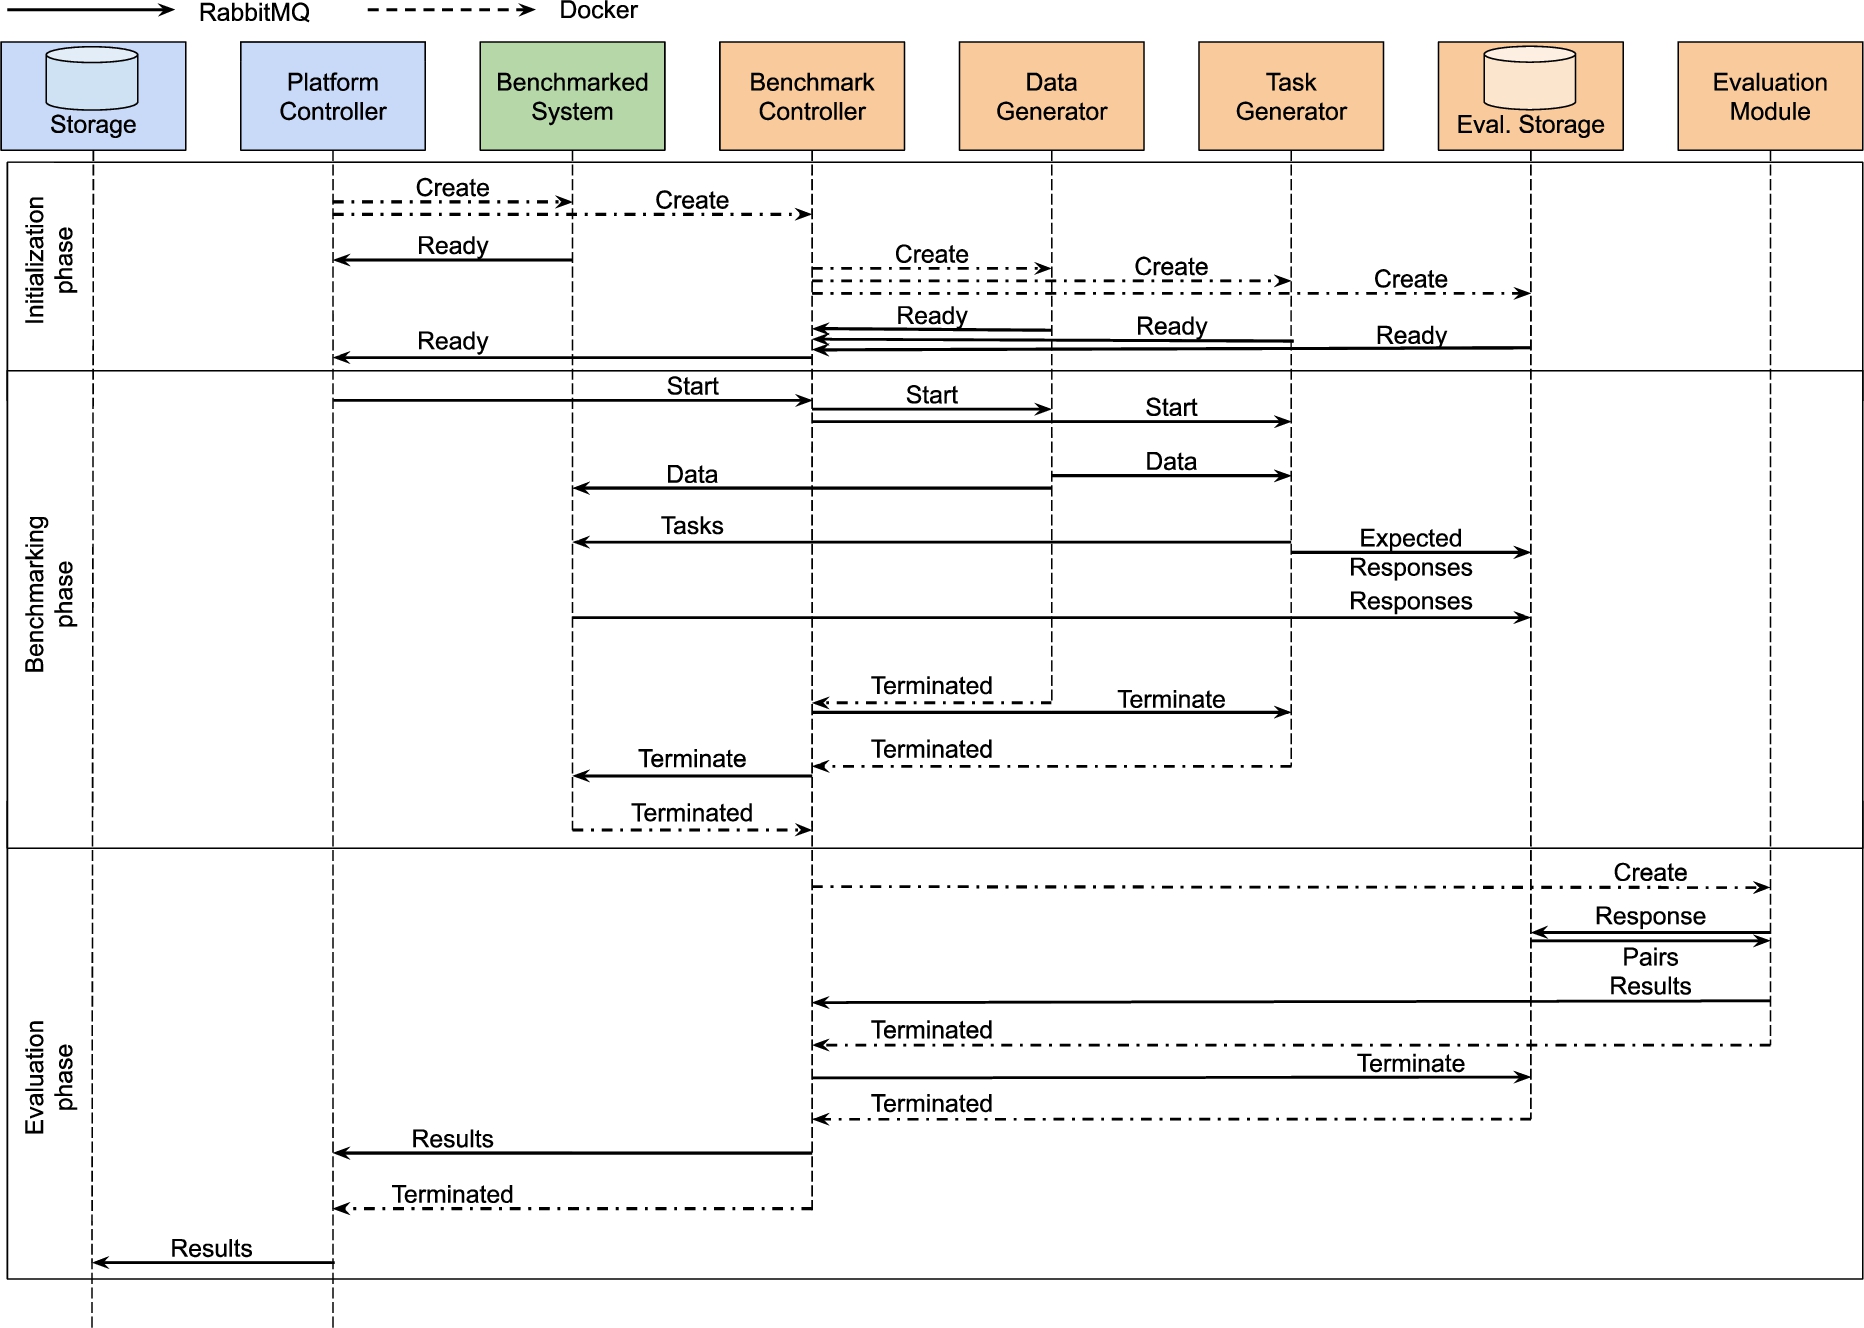
Simplified overview of the general benchmarking workflow. The system as well as the user interface are left out and the benchmark controller creates other containers directly, without sending requests to the platform controller.
4.5.Benchmark workflow
Since the platform was designed for executing benchmarks (U1), we defined a typical workflow of benchmarking a Big LD system. The workflow is abstracted to make sure that it can be used for benchmarking all steps of the LD life cycle steps. Figure 4 shows a sequence diagram containing the steps as well as the type of communication that is used. Note that the orchestration of the single benchmark components is part of the benchmark and can be different across different benchmark implementations.
4.5.1.Initialisation phase
At the beginning of the benchmarking process, the platform controller makes sure that a benchmark can be started. This includes a check to make sure that all hardware nodes of the cluster are available. The platform controller then instantiates the system adapter. The said adapter first initializes, then starts the system to be benchmarked and makes sure that it is working properly. Finally, the adapter sends a message to the platform controller to indicate that it is ready. Once the system adapter has been started, the platform controller generates the benchmark controller. The task of the benchmark controller is to ensure that the data and tasks for a given benchmark are generated and dispatched according to a given specification. To achieve this goal, the controller instantiates the data and task generators as well as the evaluation storage. It then sends a message to the platform controller to indicate that it is ready.
4.5.2.Benchmarking phase
The platform controller waits until both the system adapter and the benchmark controller are ready before starting the benchmarking phase by sending a start signal to the benchmark controller which starts the data generators. The data generators start the data generation algorithms to create the data that will underlie the benchmark. The data is sent to the system adapter and to the task generators. The task generators generate the tasks and send them to the system adapter, which triggers the required processing of the data in the system. The system response is forwarded to the evaluation storage by the system adapter. The task generators store the corresponding expected result in the evaluation storage. After the data and task generators finish their work, the benchmarking phase ends and both the generators and the system adapter terminate.
4.5.3.Evaluation phase
During the evaluation phase, the benchmark controller creates the evaluation module. The evaluation module loads the results from the evaluation storage. This is done by requesting the results pairs, i.e., the expected result and the result received from the system for a single task, from the storage. The evaluation module uses these pairs to evaluate the system’s performance and to calculate the KPIs. The results of this evaluation are returned to the benchmark controller before the evaluation module and storage terminate. The benchmark controller adds information for repeating the experiment, e.g., its parameters, to the evaluation results, sends them to the platform controller and terminates. Note that this makes sure that all the data is still available, although the benchmark or the benchmarked system are deleted from the servers (A2). After the benchmark controller has finished its work, the platform controller can add additional information to the result, e.g., the configuration of the hardware, and store the result. Following this, a new evaluation can be started. The platform controller sends the URI of the new experiment result to the analysis component. The analysis component reads the evaluation results from the storage, processes them and stores additional information in the storage.
Importantly, the platform allows for other orchestration schemes. For example, it is possible to generate all the data in a first step before the task generators start to generate their tasks based on the complete data. In another variation, the task generators can also be enabled to generate a task, wait for the response of the system and then send the subsequent task.
5.Evaluation
The Hobbit platform has already been used successfully in a large number of challenges (see Section 6). Still, we evaluated our architecture in two different respects. First, we simulated benchmarking triple stores using Hobbit. These experiments had two goals. First, we wanted to prove that the Hobbit platform can be used on single, lightweight hardware (e.g., for development purposes or for benchmarks where the scalability and runtime are not of importance) as well as in a distributed environment. Second, we wanted to evaluate the throughput of storage benchmarks. In addition, we benchmarked several knowledge extraction tools and studied the runtime performance of these systems for the first time.
Table 2
Platform benchmark results on a single machine (1–3) and a cluster (4, 5)
| Experiments | Exp. 1 | Exp. 2 | Exp. 3 | Exp. 4 | Exp. 5 |
| Data generators | 2 | 2 | 2 | 1 | 3 |
| Task generators | 1 | 1 | 1 | 1 | 1 |
| Queries | 1,000 | 2,000 | 5,000 | 100,000 | 300,000 |
| Avg. query runtime (in ms) | 7,058 | 17,309 | 33,561 | 38,810 | 59,828 |
| Query runtime std. dev. | 686 | 4,493 | 3,636 | 22,517 | 24,540 |
| Overall runtime (in s) | 11.2 | 32.4 | 51.5 | 2,086 | 2,536 |
| Queries per second (avg.) | 44.9 | 31.0 | 48.6 | 865.1 | 774.2 |
5.1.Triple store benchmark
To configure our simulation, we derived message characteristics from real data using the Linked SPARQL Queries Dataset [36]–a collection of SPARQL query logs. This collection of real query logs suggests that (1) the average length of a SPARQL query is 545.45 characters and (2) the average result set comprises 122.45 bindings. We assumed that the average size of a single result is 100 characters leading to a result set size of approximately 12,200 characters which is created for every request by our triple store simulation.
The platform was deployed on a small machine2323 and on a server cluster.2424 The single benchmark runs are shown in Table 2. We executed the benchmark with three different numbers of queries on the smaller machine and two larger numbers of queries on the cluster. Our results show that the platform can run even on the minimalistic single machine chosen for our evaluation. Hence, the Hobbit platform can be used locally for smoke tests and development tests. In addition, our results also clearly indicate the need for a platform such as Hobbit by pointing to the necessity to deploy benchmarking platforms in a large-scale environment to test some of the Big LD systems. Experiments with 5000 queries run on the small machine clearly show an increase in the average runtime per query and the standard deviation of the query runtimes due to a traffic jam in the message bus queues. In contrast, our results on the cluster show that we are able to scale up easily and run 20 times more queries per second than on the single machine.
5.2.Knowledge Extraction benchmark use case
For our second evaluation, we used Task 1B of the Open Knowledge Extraction challenge 2017 [41] as use case. This task comprises the problem of spotting named entities from a given text and linking them to a given knowledge base. All experiments were run on our cluster. We benchmarked the following named entity recognition tools: (1) FOX [39], (2) the Ottawa Baseline Information Extraction (Balie) [30], (3) the Illinois Named Entity Tagger (Illinois) [33], (4) the Apache OpenNLP Name Finder (OpenNLP) [3], (5) the Stanford Named Entity Recognizer (Stanford) [15], and (6) DBpedia Spotlight (Spotlight) [27]. The entities that were found in the text by any of the tools are linked to a given knowledge base using AGDISTIS [29]. In our experiment, we used DBpedia 20152525 as the reference knowledge base.
The aim of the benchmark was to measure the scalability and the accuracy of these systems under increasing load, an experiment which was not possible with existing benchmarking solutions. We used a gold standard made up of 10,000 documents generated using the BENGAL generator2626 included in the Hobbit platform. The evaluation module was based on the evaluation used in [41] and measured the runtime for single documents as well as the result quality in terms of micro-precision, recall and F1-measure. We used 1 data and 1 task generator for our benchmark. The data generator was configured to run through 5 velocity phases (2000 documents/phase) with differing delays between single documents in each phase. The delays between the documents were set to
Fig. 5.
Average runtime per document achieved by systems during the different phases.
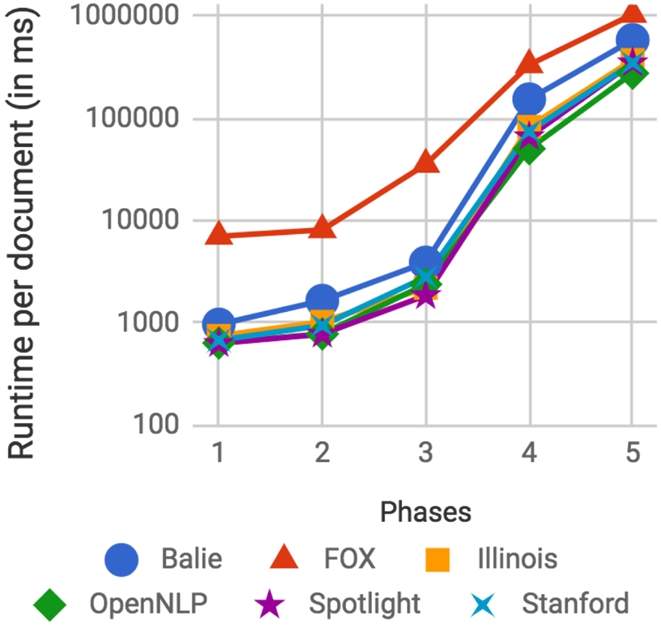
The results presented in Figure 5 show that all approaches scale well when provided with enough hardware. As expected, FOX is the slowest solution as it relies on calling 5 underlying fully-fledged entity recognition tools and merging their results. Our results also indicate that a better load balancing could lead to even better runtimes. In particular, the runtime per document starts to increase as soon as the tool cannot handle the incoming amount of documents in time and the documents start to be queued (see Phase 2 to 4). Additionally, the results show that Balie is slower than the other fully-fledged entity recognition tools. Given that Balie also has the lowest F1-score (see Table 3) it can be argued that removing Balie from FOX could be an option to increase its efficiency.
Table 3
The effectiveness of the systems (micro measures)
| System | Precision | Recall | F1-measure |
| Balie | 0.321 | 0.293 | 0.306 |
| FOX | 0.505 | 0.543 | 0.523 |
| Illinois | 0.524 | 0.614 | 0.565 |
| OpenNLP | 0.351 | 0.233 | 0.280 |
| Spotlight | 0.513 | 0.411 | 0.456 |
| Stanford | 0.548 | 0.662 | 0.600 |
6.Application
The Hobbit platform is now being used by more than 300 registered users that already have executed more than 13000 experiments with more than 40 benchmarks.2727 The Hobbit platform was also used to carry out eleven benchmarking challenges for Big Data applications. It was used for the Grand Challenge of the 11th and 12th ACM International Conference on Distributed and Event-Based Systems (DEBS 2017 and 2018) [21,22]. The 2017 challenge was aimed at event-based systems for real-time analytics. Overall, more than 20 participating systems had to identify anomalies from a stream of sensor data.
The Open Knowledge Extraction Challenges 2017 and 2018 used the platform for benchmarking Named Entity Recognition, Entity Linking and Relation Extraction approaches [40,41]. For one of the challenge tasks a setup similar to our evaluation in Section 5.2 was used. This evaluation revealed that the scalability of some systems decreases drastically under realistic loads. While some of the benchmarked solutions were able to answer single requests efficiently, they became slower than competing systems when challenged with a large amount of requests [41].
The Mighty Storage Challenges 2017 and 2018 focused on benchmarking triple stores [17,18]. Their RDF data ingestion tasks showed that most triple stores are unable to consume and retrieve triples (e.g., sensor or event data) efficiently. This insight suggests that current triple stores need to significantly improve in their scalability before they can be used for Big Data applications out of the box. The derivation of this insight was made possible by Hobbit’s support of distributed systems and its distributed implementation that allows the generation of enough data and queries to overload the triple stores.
7.Limitations and future work
The Hobbit benchmarking platform showed its applicability during several challenges and experiments described above. However, the platform comes with some limitations and space for future enhancements which will be discussed in this section.
The FAIR principles are focusing on data management. Thus, not all of them can be solely realised by the implementation of the platform. There are principles which are at least partly in the responsibility of the organisation hosting the platform. The license for the experiment results has to be defined by the hosting organisation (R1.1). Similarly, the combination of globally unique, persistent identifiers (F1) and making them retrievable (A1) is supported by the platform implementation and our online instance is deployed to enable this feature. However, the hosting party of a new instance will have to define another persistent URI namespace for experiments and organise the redirection of requests from this namespace to the newly deployed instance.
Another limitation can be seen in the fulfilment of F2, R1.2 and I2. The platform is programmed to enhance the metadata of an experiment by adding all metadata that the platform has about itself as well as the metadata of the benchmark and system with which the experiment has been executed. However, since the benchmark and system metadata are user defined their richness as well as the used vocabularies are mainly depending on the user.
The design of the platform comes with two bottlenecks which we addressed by using horizontal scaling. Firstly, the message bus which is used for the communication might not be able to handle all the data in a reasonable amount of time. We handled this issue by using RabbitMQ as message broker.2828 It supports the deployment of a cluster of message brokers increasing the possible throughput. Secondly, the evaluation storage may reduce the benchmarked system’s performance by consuming the results at a much lower pace than the system is sending them. To avoid this situation, we chose RIAK – a key-value store which can be deployed as cluster.2929 This enables the consumption of several system results in parallel.
An important limitation of the platform is the necessary knowledge about several technologies and the platform APIs which is demanded. While viewing and searching for experiment results is straight forward, the deployment of a new benchmark or a new system can cause some effort for users which have not worked with the platform before. Especially for complex benchmarks the workflow described in Section 4.5 may have to be adapted. We created base implementations for different benchmark and system components, developed example benchmarks and systems as open source projects, created video tutorials and enhanced the documentation of the platform over time incorporating user questions and feedback we received. However, the further lowering of this entry barrier remains an important future task.
Additionally, we received feature requests from the community. These requests are mainly targeting the user interface. However, one feature request focuses on the sharing of data. At the moment, it is not possible for containers executed inside the platform to share a common directory. Instead, data which has to be shared needs to be sent using the message queues. In the future, we want to make use of a feature of Docker containers which allows them to share a common data container without exposing the local hard drives of the servers to the 3rd party programs that are executed inside the containers of the benchmarks and the systems.
8.Conclusion
This paper presents the architecture of the Hobbit benchmarking platform, which is based on real requirements collected from experts from across the world. The platform is designed to be modular and easy to scale up. Hobbit is hence the first benchmarking platform that can be used for benchmarking Big LD systems. The platform has already been used in several challenges and was shown to address the requirements of large-scale benchmarking for storage, predictive maintenance, knowledge acquisition and question answering. These challenges showed clearly that Hobbit can be used to measure both the scalability and accuracy of Big Data platforms. As the platform is not limited to a particular step of the LD life cycle and can be configured to use virtually any data generator and task generator, it is well suited for benchmarking any step of the Big LD life cycle. A fully fledged implementation of the platform is available as an open-source solution and has started to attract the developer community. While writing this paper, the platform is planned to be used for the Semantic Web Challenge 2019 as well as the OAEI Challenge 2019.3030 It will also serves as one of the key stones of the Innovative Training Network (ITN) KnowGraphs during the next years. We hence aim to extend it so as to build the reference point for benchmarking Big LD applications.
Notes
1 Code and dataset generators available at http://github.com/hobbit-project. Project homepage at https://project-hobbit.eu/.
5 The complete list can be found at https://github.com/peelframework/peel#supported-systems.
6 We are not aware of the existence of an automatic benchmark for the quality analysis step. However, the platform itself would support such a benchmark.
8 Please note that [16] is also available via the Community Research and Development Information Service (CORDIS) of the European Commission using the grand agreement ID of the HOBBIT project: 688227. See https://cordis.europa.eu/project/rcn/199489/results/en.
9 3.6% of the survey participants used datasets with less than 10k triples while 35.7% used datasets with more than 100M triples.
11 Our endpoint can be found at https://db.project-hobbit.eu/sparql.
13 The formal specification of the ontology can be found at https://github.com/hobbit-project/ontology.
14 The example is part of the experiment https://w3id.org/hobbit/experiments#1540829047982.
15 See https://w3id.org/.
16 License: https://creativecommons.org/licenses/by/4.0/legalcode. The license statement of our online instance can be found at https://master.project-hobbit.eu/home.
23 Dual Intel Core i5, 2.5 GHz, 2 GB RAM.
24 1 master server (1xE5-2630v4 10-cores, 2.2 GHz, 128 GB RAM) hosting platform components (including RabbitMQ message broker), 1 data server (1xE5-2630v3 8-cores, 2.4 GHz, 64 GB RAM) hosting storages, 6 nodes (2xE5-2630v3 8-cores, 2.4 GHz, 256 GB RAM) divided into two groups hosting either components of the benchmark or the benchmarked system.
Acknowledgements
This work was supported by the European Union’s H2020 research and innovation action HOBBIT (GA no. 688227), by the H2020 Marie Skłodowska-Curie project KnowGraphs (GA no. 860801) and by the German Federal Ministry for Economic Affairs and Energy (BMWi) within the project RAKI (no. 01MD19012D) of the program ‘Smarte Datenwirtschaft’.
References
[1] | A. Algergawy, M. Cheatham, D. Faria, A. Ferrara, I. Fundulaki, I. Harrow, S. Hertling, E. Jiménez-Ruiz, N. Karam, A. Khiat, P. Lambrix, H. Li, S. Montanelli, H. Paulheim, C. Pesquita, T. Saveta, D. Schmidt, P. Shvaiko, A. Splendiani, E. Thiéblin, C. Trojahn, J. Vataščinová, O. Zamazal and L. Zhou, Results of the ontology alignment evaluation initiative 2018, in: Proceedings of the 13th International Workshop on Ontology Matching (OM 2018), Monterey, CA, USA, October 8, 2018, P. Shvaiko, J. Euzenat, E. Jiménez-Ruiz, M. Cheatham and O. Hassanzadeh, eds, CEUR-WS, (2018) , pp. 76–116, http://ceur-ws.org/Vol-2288/oaei18_paper0.pdf. |
[2] | S. Auer, J. Lehmann, A.-C. Ngonga Ngomo and A. Zaveri, Introduction to linked data and its lifecycle on the web, in: Reasoning Web. Semantic Technologies for Intelligent Data Access, Springer, (2013) , pp. 1–90. doi:10.1007/978-3-642-23032-5_1. |
[3] | J. Baldridge, The opennlp project, 2005, http://opennlp.apache.org/index.html. |
[4] | C. Bizer and A. Schultz, The Berlin SPARQL benchmark, Int. J. Semantic Web Inf. Syst. 5: (2) ((2009) ), 1–24. doi:10.4018/jswis.2009040101. |
[5] | D. Brickley, R.V. Guha and B. McBride, RDF schema 1.1, W3C Working Group Note, 2014, http://www.w3.org/TR/2014/REC-rdf-schema-20140225/. |
[6] | D. Carmel, M.-W. Chang, E. Gabrilovich, B.-J.P. Hsu and K. Wang, ERD 2014: Entity recognition and disambiguation challenge, SIGIR Forum ((2014) ). doi:10.1145/2701583.2701591. |
[7] | J.J. Carroll and J.Z. Pan, XML schema datatypes in RDF and OWL, W3C Working Group Note, 2006, http://www.w3.org/TR/2006/NOTE-swbp-xsch-datatypes-20060314/. |
[8] | J.M. Cavanillas, E. Curry and W. Wahlster, New Horizons for a Data-Driven Economy: A Roadmap for Usage and Exploitation of Big Data in Europe, Springer, (2016) . doi:10.1007/978-3-319-21569-3. |
[9] | S. Ceesay, A.D. Barker and B. Varghese, Plug and play bench: Simplifying big data benchmarking using containers, in: 2017 IEEE International Conference on Big Data, (2017) . doi:10.1109/BigData.2017.8258249. |
[10] | F. Conrads, J. Lehmann, M. Saleem, M. Morsey and A.-C. Ngonga Ngomo, IGUANA: A generic framework for benchmarking the read–write performance of triple stores, in: The Semantic Web – ISWC 2014, Lecture Notes in Computer Science, Vol. 8796: , Springer International Publishing, (2017) , pp. 519–534. doi:10.1007/978-3-319-68204-4_5. |
[11] | M. Cornolti, P. Ferragina and M. Ciaramita, A framework for benchmarking entity-annotation systems, in: 22nd World Wide Web Conference, (2013) . doi:10.13140/2.1.4942.9766. |
[12] | R. Cyganiak and D. Reynolds, The RDF data cube vocabulary, W3C Recommendation, 2014, http://www.w3.org/TR/2014/REC-vocab-data-cube-20140116/. |
[13] | E. Daskalaki, G. Flouris, I. Fundulaki and T. Saveta, Instance matching benchmarks in the era of Linked Data, in: Web Semantics: Science, Services and Agents on the World Wide Web, (2016) . doi:10.1016/j.websem.2016.06.002. |
[14] | D.E. Difallah, A. Pavlo, C. Curino and P. Cudre-Mauroux, OLTP-bench: An extensible testbed for benchmarking relational databases, Proc. VLDB Endow. 7: (4) ((2013) ), 277–288. doi:10.14778/2732240.2732246. |
[15] | J.R. Finkel, T. Grenager and C. Manning, Incorporating non-local information into information extraction systems by Gibbs sampling, in: ACL, (2005) , pp. 363–370. doi:10.3115/1219840.1219885. |
[16] | I. Fundulaki, Deliverable 1.2.1: Requirements specification from the community, 2016, http://project-hobbit.eu/about/deliverables/. |
[17] | K. Georgala, M. Spasić, M. Jovanovik, V. Papakonstantinou, C. Stadler, M. Röder and A.-C.N. Ngomo, MOCHA2018: The mighty storage challenge at ESWC 2018, in: Semantic Web Challenges, D. Buscaldi, A. Gangemi and D. Reforgiato Recupero, eds, Springer International Publishing, Cham, (2018) , pp. 3–16. ISBN 978-3-030-00072-1. doi:10.1007/978-3-030-00072-1_1. |
[18] | K. Georgala, M. Spasić, M. Jovanovik, H. Petzka, M. Röder and A.-C. Ngonga Ngomo, MOCHA2017: The mighty storage challenge at ESWC 2017, in: Semantic Web Challenges: Fourth SemWebEval Challenge at ESWC 2017, (2017) . doi:10.1007/978-3-319-69146-6_1. |
[19] | A. Ghazal, T. Rabl, M. Hu, F. Raab, M. Poess, A. Crolotte and H.-A. Jacobsen, BigBench: Towards an industry standard benchmark for big data analytics, in: Proceedings of the 2013 ACM SIGMOD International Conference on Management of Data, SIGMOD’13, ACM, New York, NY, USA, (2013) , pp. 1197–1208. doi:10.1145/2463676.2463712. |
[20] | J. Gray and C. Levine, Thousands of debitcredit transactions-per-second: Easy and inexpensive, arXiv preprint cs/0701161, 2007, https://arxiv.org/abs/cs/0701161. |
[21] | V. Gulisano, Z. Jerzak, R. Katerinenko, M. Strohbach and H. Ziekow, The DEBS 2017 grand challenge, in: Proceedings of the 11th ACM International Conference on Distributed and Event-Based Systems, DEBS’17, ACM, (2017) , pp. 271–273. doi:10.1145/3093742.3096342. |
[22] | V. Gulisano, Z. Jerzak, P. Smirnov, M. Strohbach, H. Ziekow and D. Zissis, The DEBS 2018 grand challenge, in: Proceedings of the 12th ACM International Conference on Distributed and Event-Based Systems, DEBS’18, ACM, (2018) , pp. 191–194. ISBN 978-1-4503-5782-1. doi:10.1145/3210284.3220510. |
[23] | Y. Guo, Z. Pan and J. Heflin, LUBM: A benchmark for OWL knowledge base systems, J. Web Sem. 3: (2–3) ((2005) ), 158–182. doi:10.1016/j.websem.2005.06.005. |
[24] | E. Jiménez-Ruiz, T. Saveta, O. Zamazal, S. Hertling, M. Roder, I. Fundulaki, A. Ngonga Ngomo, M. Sherif, A. Annane, Z. Bellahsene, S. Ben Yahia, G. Diallo, D. Faria, M. Kachroudi, A. Khiat, P. Lambrix, H. Li, M. Mackeprang, M. Mohammadi, M. Rybinski, B.S. Balasubramani and C. Trojahn, Introducing the HOBBIT platform into the ontology alignment evaluation campaign, in: Proceedings of the 13th International Workshop on Ontology Matching (OM 2018), Monterey, CA, USA, October 8, 2018, P. Shvaiko, J. Euzenat, E. Jiménez-Ruiz, M. Cheatham and O. Hassanzadeh, eds, CEUR-WS, (2018) , pp. 49–60, http://ceur-ws.org/Vol-2288/om2018_LTpaper5.pdf. |
[25] | T. Lebo, S. Sahoo and D. McGuinness, PROV-O: The PROV ontology, W3C Recommendation, 2013, http://www.w3.org/TR/2013/REC-prov-o-20130430/. |
[26] | F. Manola, E. Miller and B. McBride, RDF 1.1 primer, W3C Working Group Note, 2014, https://www.w3.org/TR/2014/NOTE-rdf11-primer-20140624/. |
[27] | P.N. Mendes, M. Jakob, A. Garcia-Silva and C. Bizer, DBpedia spotlight: Shedding light on the web of documents, in: 7th International Conference on Semantic Systems (I-Semantics), (2011) . doi:10.1145/2063518.2063519. |
[28] | M. Morsey, J. Lehmann, S. Auer and A.N. Ngomo, DBpedia SPARQL benchmark – performance assessment with real queries on real data, in: The Semantic Web – ISWC 2011 – 10th International Semantic Web Conference, Proceedings, Part I, Bonn, Germany, October 23–27, 2011, (2011) , pp. 454–469. doi:10.1007/978-3-642-25073-6_29. |
[29] | D. Moussallem, R. Usbeck, M. Röder and A.-C. Ngonga Ngomo, MAG: A multilingual, knowledge-base agnostic and deterministic entity linking approach, in: K-CAP 2017: Knowledge Capture Conference, ACM, (2017) . doi:10.1145/3148011.3148024. |
[30] | D. Nadeau, Balie—baseline information extraction: Multilingual information extraction from text with machine learning and natural language techniques, Technical report, University of Ottawa, 2005, http://balie.sourceforge.net/dnadeau05balie.pdf. |
[31] | G. Napolitano, R. Usbeck and A.-C.N. Ngomo, The scalable question answering over linked data (SQA) challenge 2018, in: Semantic Web Challenges, D. Buscaldi, A. Gangemi and D. Reforgiato Recupero, eds, Springer International Publishing, Cham, (2018) , pp. 69–75. ISBN 978-3-030-00072-1. doi:10.1007/978-3-030-00072-1_6. |
[32] | M. Nentwig, M. Hartung, A.-C. Ngonga Ngomo and E. Rahm, A survey of current link discovery frameworks, Semantic Web ((2015) ), 1–18. doi:10.3233/SW-150210. |
[33] | L. Ratinov and D. Roth, Design challenges and misconceptions in named entity recognition, in: Proceedings of the Thirteenth Conference on Computational Natural Language Learning, CoNLL’09, Association for Computational Linguistics, (2009) , pp. 147–155. doi:10.3115/1596374.1596399. |
[34] | M. Röder, T. Saveta, I. Fundulaki and A.-C.N. Ngomo, HOBBIT link discovery benchmarks at ontology matching 2017, in: Proceedings of the 12th International Workshop on Ontology Matching (OM-2017), Vienna, Austria, October 21, 2017, P. Shvaiko, J. Euzenat, E. Jiménez-Ruiz, M. Cheatham and O. Hassanzadeh, eds, CEUR-WS, (2017) , pp. 209–210, http://ceur-ws.org/Vol-2032/om2017_poster2.pdf. |
[35] | M. Röder, R. Usbeck and A.-C. Ngonga Ngomo, GERBIL – benchmarking named entity recognition and linking consistently, Semantic Web Journal ((2017) ), 1–19. doi:10.3233/SW-170286. |
[36] | M. Saleem, I. Ali, A. Hogan, Q. Mehmood and A.-C. Ngonga Ngomo, LSQ: The linked SPARQL queries dataset, in: International Semantic Web Conference (ISWC), (2015) . doi:10.1007/978-3-319-25010-6_15. |
[37] | M. Saleem, Q. Mehmood and A.N. Ngomo, FEASIBLE: A feature-based SPARQL benchmark generation framework, in: The Semantic Web – ISWC 2015 – 14th International Semantic Web Conference, Proceedings, Part i, Bethlehem, PA, USA, October 11–15, 2015, (2015) , pp. 52–69. doi:10.1007/978-3-319-25007-6_4. |
[38] | E.F.T.K. Sang and F. De Meulder, Introduction to the CoNLL-2003 shared task: Language-independent named entity recognition, in: Proceedings of CoNLL-2003, (2003) . doi:10.3115/1119176.1119195. |
[39] | R. Speck and A.-C. Ngonga Ngomo, Ensemble learning for named entity recognition, in: The Semantic Web – ISWC 2014, Lecture Notes in Computer Science, Vol. 8796: , Springer International Publishing, (2014) , pp. 519–534. doi:10.1007/978-3-319-11964-9_33. |
[40] | R. Speck, M. Röder, F. Conrads, H. Rebba, C.C. Romiyo, G. Salakki, R. Suryawanshi, D. Ahmed, N. Srivastava, M. Mahajan and A.-C.N. Ngomo, Open knowledge extraction challenge 2018, in: Semantic Web Challenges, D. Buscaldi, A. Gangemi and D. Reforgiato Recupero, eds, Springer International Publishing, Cham, (2018) , pp. 39–51. ISBN 978-3-030-00072-1. doi:10.1007/978-3-030-00072-1_4. |
[41] | R. Speck, M. Röder, S. Oramas, L. Espinosa-Anke and A.-C. Ngonga Ngomo, Open knowledge extraction challenge 2017, in: Semantic Web Challenges: Fourth SemWebEval Challenge at ESWC 2017, Communications in Computer and Information Science, Springer International Publishing, (2017) . doi:10.1007/978-3-319-69146-6_4. |
[42] | B.M. Sundheim, Tipster/MUC-5: Information extraction system evaluation, in: Proceedings of the 5th Conference on Message Understanding, (1993) . doi:10.3115/1072017.1072023. |
[43] | G. Tsatsaronis, M. Schroeder, G. Paliouras, Y. Almirantis, I. Androutsopoulos, E. Gaussier, P. Gallinari, T. Artieres, M.R. Alvers, M. Zschunke et al., BioASQ: A challenge on large-scale biomedical semantic indexing and question answering, in: AAAI Fall Symposium: Information Retrieval and Knowledge Discovery in Biomedical Text, (2012) , https://www.aaai.org/ocs/index.php/FSS/FSS12/paper/viewPaper/5600. |
[44] | C. Unger, C. Forascu, V. Lopez, A.-C.N. Ngomo, E. Cabrio, P. Cimiano and S. Walter, Question answering over linked data (QALD-4), in: Working Notes for CLEF 2014 Conference, (2014) , http://www.ceur-ws.org/Vol-1180/CLEF2014wn-QA-UngerEt2014.pdf. |
[45] | C. Unger, C. Forascu, V. Lopez, A.N. Ngomo, E. Cabrio, P. Cimiano and S. Walter, Question answering over linked data (QALD-5), in: CLEF, (2015) , http://ceur-ws.org/Vol-1391/173-CR.pdf. |
[46] | R. Usbeck, M. Röder, M. Hoffmann, F. Conrad, J. Huthmann, A.-C. Ngonga-Ngomo, C. Demmler and C. Unger, Benchmarking question answering systems, Semantic Web Journal ((2018) ). doi:10.3233/SW-180312. |
[47] | M.D. Wilkinson, M. Dumontier, J.I. Aalbersberg, G. Appleton, M. Axton, A. Baak, N. Blomberg, J.-W. Boiten, L.B. da Silva Santos, P.E. Bourne, J. Bouwman, A.J. Brookes, T. Clark, M. Crosas, I. Dillo, O. Dumon, S. Edmunds, C.T. Evelo, R. Finkers, A. Gonzalez-Beltran, A.J.G. Gray, P. Groth, C. Goble, J.S. Grethe, J. Heringa, P.A.C. Hoen, R. Hooft, T. Kuhn, R. Kok, J. Kok, S.J. Lusher, M.E. Martone, A. Mons, A.L. Packer, B. Persson, P. Rocca-Serra, M. Roos, R. van Schaik, S.-A. Sansone, E. Schultes, T. Sengstag, T. Slater, G. Strawn, M.A. Swertz, M. Thompson, J. van der Lei, E. van Mulligen, J. Velterop, A. Waagmeester, P. Wittenburg, K. Wolstencroft, J. Zhao and B. Mons, The FAIR guiding principles for scientific data management and stewardship, Scientific data 3: ((2016) ), 160018. doi:10.1038/sdata.2016.18. |


