
Geographical trends in academic conferences: An analysis of authors’ affiliations
Abstract
In the last decade, the research literature has reached an enormous volume with an unprecedented current annual increase of 1.5 million new publications. As research gets ever more global and new countries and institutions, either from academia or corporate environments, start to contribute, it is important to monitor this complex phenomenon and understand its dynamics and equilibria.
We present a study on a conference proceedings dataset extracted from Springer Nature SciGraph that illustrates insightful geographical trends and highlights the unbalanced growth of competitive research institutions worldwide in the 1996–2016 period. The main contribution of this work is fourfold. In the first instance, we found that the distributions of institutions and publications among countries follow a power law, consistently with previous literature, i.e., very few countries keep producing most of the papers accepted by high-tier conferences. Secondly, we show how the turnover rate of country rankings is extremely low and steadily declines over time, suggesting an alarmingly static landscape in which new entries struggle to emerge. We also performed an analysis of the venue locations and their effect on the distribution of countries involved in the publications, underlining the central role of Europe and China as knowledge hubs. Finally, we evidence the presence of an increasing gap between the number of institutions initiating and overseeing research endeavours (i.e. first and last authors’ affiliations) and the total number of institutions participating in research.
The paper also discusses our experience in working with authors’ affiliations: an utterly simple matter at first glance, that is instead revealed to be a complex research and technical challenge.
1.Introduction
Over the last decade, the scholarly literature has increased dramatically in terms of the volume of papers, authors, and contributing institutions. Nowadays, the research literature is estimated to comprise 100-150 million publications with an annual increase rate around 1.5 million new publications [3]. Such a complex, global-scale system is worth studying in order to understand its dynamics and internal equilibria. In particular, the study of authors’ affiliations [12,25] has a concrete impact on the interpretation of research as a complex phenomenon, inserted in a delicate socioeconomic and geopolitical context.
In this study, we present an analysis of a dataset of conference proceedings metadata, which was distilled from SciGraph,11 a free linked open data (LOD) dataset of scholarly knowledge published and curated by Springer Nature. In particular, we first present a macro analysis of the full dataset (1996–2016), including conference proceedings across several scientific disciplines (e.g., computer science, life sciences, chemistry, engineering) and then a micro analysis, which focuses on three high-tier conferences in our area of expertise: the International Semantic Web Conference (ISWC), the Extended Semantic Web Conference (ESWC), and the International Conference on Theory and Practice of Digital Libraries (TPDL).
The main contribution of this work is fourfold. In the first instance, we found that, over the observed period, the distributions of institutions and publications among countries follow a power law, consistently with what previously demonstrated in the literature across the 1981–2010 period [8,18,22,25]. That is, very few countries keep producing most of the papers accepted by academic conferences. Secondly, we show how the annual and overall turnover rate of country rankings is extremely low and steadily declining over time, suggesting an alarmingly static landscape in which new entries struggle to emerge. We also performed an analysis of the venue locations and their effect on the distribution of countries involved in the publications. This analysis highlights the central role of Europe in the research landscape and other distinctive publishing patterns of countries and continents in our dataset. Finally, we report an increasing gap between the number of institutions initiating and overseeing research endeavours (i.e. first and last authors’ affiliations) and the total number of institutions participating in research.
This article extends our paper [21] presented at the workshop on “Semantics, Analytics, Visualization: Enhancing Scholarly Dissemination (SAVE-SD)” co-located with The Web Conference 2018 held in Lyon, France. The main novel contributions are: (i) an improved version of the dataset exhibiting less noise and new dimensions of analysis, (ii) an enhanced literature review section, (iii) an improved analysis of our hypothesis on author position, (iv) a more comprehensive analysis of the evolution of the country rankings over the years, (v) an analysis of the effect of conference locations on the distribution of involved countries.
The remainder of this paper is structured as follows. In Section 2 we summarise the relevant state of the art. In Section 3 we describe the criteria that drove us to the selection of the dataset, and the data preparation phase we opted for, while in Section 4 we describe the methodology followed in our analysis. Finally, in Section 5 we describe the results that emerged from our analysis and in Section 6 we discuss the main implications of our study and outline future directions of research.
2.Literature review
A variety of bibliometrics studies in the last 30 years have highlighted the importance of different indicators of the presumed quality of research produced by researchers, institutions, and countries. In particular, many papers have highlighted how researchers’ performance can be affected by factors such as gender [17], location [5,12], reputation [28], centrality in the co-authorship network [29], online presence [33], and so on. For instance, Jadidi et al. [17] investigated gender-specific inequality and imbalance on about 1 million computer scientists over the course of 47 years and observed that women are on average less likely to adopt the collaboration patterns associated with a strong research impact. Petersen et al. [28] introduced an approach for quantifying the influence of an author reputation on their future research impact and found that reputation is associated with the citation count of articles, but only during the early phase of the citation lifecycle. Sarigol et al. [29] demonstrated that a classifier based only on co-authorship network centrality metrics can predict with high precision whether an article will be highly cited within five years after the publication. Thelwall et al. [33] showed that there is a significant correlation between eleven tested Altmetrics and citations in the Web of Science dataset.
Several papers address the field of spatial scientometrics [12], which focuses on the spatial distribution of publication and citation impact and the effect of geographical biases. Frenken et al. [13] categorise these studies in three main categories: (i) the ones that analyse the distribution of publications or citation impact [7,15,18,22,25], (ii) the studies that focus on the relationship between scientific impact and the spatial organisation of research activities [9,14,30], and (iii) the studies that design applications and approaches to visualise these dynamics [4,5].
In the first category, we found several studies that focused on the role of countries, cities, and organisations (e.g. university, research institutes) and highlighted the great discrepancy in quantity and quality of the research produced by different nations. Here we will mainly focus on the studies that consider country-level dynamics. For instance, May [22] analysed the numbers of publications and citations of different countries in the 1981–1994 period using the Institute for Scientific Information database (Ed. then Thomson ISI and, currently, Clarivate Analytics), which included more than 8.4 million papers and 72 million citations. In accordance with our results, the authors found that the countries that produced the highest share of research papers more than 20 years ago were USA, United Kingdom, Japan, Germany, France, Canada, Italy, India, Australia, and Netherlands. King [18] built on this work and analysed the 1993–2002 period adopting again the Thomson ISI dataset. Ten years after May’s study, the most important countries regarding research were essentially the same. In particular, King found that the countries that produced most of the top 1% highly cited publications were USA, United Kingdom, Germany, Japan, France, Canada, Italy, Switzerland, Netherlands, and Australia. At a finer level of granularity, Csomós [7] analysed the scientific output of nearly 2200 cities worldwide from 1986 to 2015, and examined extensively the associated geographical patterns, collaborations and dynamics over time. Unsurprisingly, the major world cities are the strongest producers of scientific output and knowledge hubs; nonetheless, the gap between such cities and the main ones from emerging/developing countries (e.g. China) is gradually closing up. Pan et al. [25] continued this line of work by performing a systematic analysis of citation networks between cities and countries in the 2003–2010 period and reported that the citation distribution of countries and cities follows a power law. According to their citation rank, the main producers of research in that period were USA, United Kingdom, Germany, Japan, France, Canada, China, Italy, Netherlands, and Australia. Interestingly, they also argued that a necessary (but not sufficient) condition for a country to reach an impact larger than the world average is to invest more than about 100,000 USD per researcher annually. Several other studies confirmed that the publication distribution of countries usually follows a power law. For example, Albarrán et al. [1] performed a study on the citation distributions of 3.7 million articles published in the period 1998–2002 in 219 Web of Science categories, or sub-fields. They concluded that for 140 out of the 219 sub-fields the existence of a power law could not be rejected, but observed also that power laws are much flatter than usually believed and represent on average 2% of all articles and 13.5% of all citations. Similarly, Carvalho and Batty [6] analysed the Citeseer database of Computer Science publications and reported that the productivity of research organisations in USA also follows a power law. Similarly, Huang et al. [15] analysed the Web of Science dataset in the 1981–2008 and discovered that most publications were concentrated on a small number of countries, including the USA, the United Kingdom, Japan, Germany, and France. However, they observed that this situation may be changing soon due to the rapid growth of in China and other Asian countries such as Taiwan and Korea. This conclusion is actually in contrast with the output of our study, as we will discuss in Section 5.1.
Some studies focus on specific research areas. For example, Hung [16] investigated 689 journals in e-Learning with text mining techniques and ranked the countries according to their ability to cover multiple sub-topics. The resulting rank includes England, Taiwan, China, USA, Germany, Italy, Spain, Japan, South Korea, and Australia. Woodson [36] studied the inequalities in the field of nanomedicine by analysing the Web of Science and PubMed databases. He found that most nanomedicine research was produced by high income countries and that only 7% of the publications addressing specific diseases focused on diseases which afflict mainly poor countries. Similarly, Falagas et al. [11] conducted a study on the biomedical papers in the ISI dataset published in the period 1995–2003. They found that Western Europe and USA dominated the landscape and that the developing regions had only small research contributions. However, a second study from Falagas et al. [10] proved that other fields exhibit a different tendency. They analysed the articles published in 12 journals in Tropical Medicine during the period 1995–2003 finding that the developing areas of the world produced a considerable amount of publications. In particular, the first author of 41.6% of the publication was from Africa or Latin America.
The second category of work proposed by Frenken et al. [13] regards the effect of geography on citation impact. For example, He [14] analysed a dataset of 1,860 papers written by 65 biomedical scientists in New Zealand and reported that internationally co-authored papers receive more citations than national collaborations. Similarly, Sin [30] conducted a study on 7,489 papers in the field of Library and Information Science and found that the articles that included international collaborations, Northern European authors, and authors in high-income nations tend to be cited more. Eisend and Schmidt [9] analysed the citation impact of publications from German organisations in the field of Business and reported that international collaborations were particularly beneficial when researchers lack language skills and knowledge of foreign markets. Borner and Penumarthy [2] studied the set of papers published in the Proceedings of the National Academy of Sciences (PNAS) in the 1982–2001 period and found that the citation linkages between institutions decrease with the distance between them. Interestingly, the diffusion of the Internet did not appear to change this dynamic.
Finally, several works proposed applications and techniques to analyse and visualise the spatial aspects of science. For instance, Bornmann and Waltman [5] presented a method to generate density maps that highlights regions of scientific excellence. Similarly, Bornmann et al. [4] introduced a web application22 to visualise institutional performance within specific subject areas.
The work presented in this paper falls mainly in the first two categories presented in this literature review. Unlike the aforementioned analyses, in this study we (i) focused on the temporal evolution of countries and institutions in conference papers during the 1996–2016 period, (ii) analysed the effect of the venue locations on the distribution of countries involved in the publications, taking into consideration both continental and intercontinental conferences, (iii) performed an analysis on the first and last authors’ affiliations, and (iv) addressed specific high-tier conferences in the domain of semantic web and digital libraries.
3.Data
A main premise of our study is the availability of a scholarly knowledge dataset containing information about authors’ affiliations sufficiently detailed and structured, i.e. including both institution name and country, possibly disambiguated via a persistent identifier.
For the sake of Open Science principles and reproducibility best practices [35], we intentionally kept out of consideration pay-walled data sources such as Scopus,33 Web of Science44 and Microsoft Academic,55 and we focused on what can be freely accessed on the Web.
Some top-quality scholarly datasets such as DBLP [20] and Semantic Scholar66 are not apt to our study as they lack essential information about authors’ affiliations. Other datasets technically provide authors’ affiliations, but the relevant metadata are often incomplete or far from being ready to use. For example, Crossref77 technically offers a field devised for affiliations in their metadata API JSON format.88 However, we found that the majority of the records currently lack this information, and, when present, this is provided as a simple array of affiliation strings (i.e. a catch-all, unstructured text). Besides, such affiliation strings often exhibit several well-known ambiguity issues due to (i) alternate forms (e.g., “Open University” and “The Open University”), (ii) linguistic variations (e.g., “Università di Pisa” and “University of Pisa”), (iii) different granularity and missing information (e.g., “Knowledge Media Institute, Milton Keynes”), (iv) any combination of the aforementioned three.
After a thorough analysis of currently available datasets curated at the source with regards to these aspects, we choose SciGraph,99 a LOD dataset published and curated by Springer Nature. To the best of our knowledge, SciGraph is the only free, large-scale dataset providing reconciliation of authors’ affiliations by disambiguating and linking them to an external authoritative dataset in terms of institutions (in this case GRID,1010 the Global Research Identifier Database). In its entirety, SciGraph consists1111 of 78 distinct datasets and includes about 2 billion triples describing research literature objects such as journal articles, conference papers, books, and monographs published by Springer Nature and spanning over a broad set of topics such as computer science, medicine, life sciences, chemistry, engineering, astronomy, and more.
For our analysis we focused on conferences proceedings as conferences are the focal point of networking and knowledge exchange among practitioners. To this end, we downloaded from SciGraph the books (i.e. proceedings) and book chapters (i.e. articles) datasets spanning from 1996 to 2017 and the conferences dataset linking together all the books related to the same conference series (i.e. all the instances of a certain conference series, say “The Web Conference”). Additionally, we downloaded the ancillary GRID dataset1212 which provides high-quality and curated information of institutions and organisations, academic or not, participating in research. These datasets were loaded in a graph database1313 resulting in a graph of 313,035,870 triples.1414 Then, we extracted via a SPARQL query1515 a TSV (tab-separated values) dump describing all authors’ contributions to papers published in conference proceedings. For the sake of clarity, if paper p is written by authors
During our analysis, we realised that, despite the great overall quality of the data in SciGraph, several affiliations were wrongly resolved to an incorrect organisation identifier in the GRID database. For example, for reasons beyond our knowledge, several contributions of authors actually affiliated to the University of Oxford were mistakenly attributed to the Weizmann Institute of Science in Israel. In the attempt to mitigate this problem, we opted for leveraging the affiliation string field that nonetheless is present in SciGraph alongside the GRID identifier. This enabled us to match this affiliation string with the name of the institution in the GRID database, and overwrite whatever information is present in SciGraph, fixing errors similar to the aforementioned one and thus improving the accuracy of the dataset. Finally, we augmented the dataset for further geographical inspection by resolving countries to continents of pertinence and by adding latitude and longitude coordinates of countries’ centroids. Incidentally, we fixed some other minor issues related to spelling mistakes of country names.
4.Methodology
Since we intended to address both general and conference-specific trends, we performed a macro analysis, on the full dataset, and a micro analysis, on three selected high-tier conferences.
In the macro analysis we considered all conferences in the 1996–2016 period. We discarded 2017, since in this year we observed a fairly lower number of contributions and a significant amount of unresolved affiliations. The resulting macro dataset includes 1,664,733 contributions (477,921 unique papers), of which 946,165 contributions (264,534 unique papers) are explicitly attributed to 1,016 unique conference series.
For the micro analysis we focused instead on three high-tier conferences in the fields of semantic web and digital libraries: the International Semantic Web Conference (ISWC), the Extended Semantic Web Conference (ESWC), and the International Conference on Theory and Practice of Digital Libraries (TPDL). We selected them for two main reasons. First, we wanted to perform this analysis on familiar venues near our field of expertise. In the second instance, we were interested in comparing ISWC and ESWC, which are considered the two top conferences in the semantic web domain and traditionally tend to attract quite different demographics. The first draws people from all over the world, while the second (previously called “European Semantic Web Conference”) appeals mainly to a European audience. Focusing the analysis on three conferences enabled us to manually curate and enrich their data and therefore produce a very comprehensive representation of the involved institutions and countries.
The datasets of these conferences were extracted from the raw dataset by selecting the contributions with the relevant DBLP conference series identifier (respectively semweb, esws and ercimdl). In some cases we deliberately chose to manually reconciliate some conference editions that were found missing from the conference series (e.g., ISWC 2007 and 2015) and drop instead the contributions mistakenly attributed (e.g., the First International Workshop of Semantic Web Services and Web Process Composition). Two conference editions appear to be missing for good (i.e., they are not in our dataset: ESWC 2007 and TPDL 2014, the latter being a joint event with JCDL published by IEEE/ACM), while for TPDL 2015–2017 the number of contributions is surprisingly lower than in earlier years, but still consistent with figures published by Springer Nature.1616 However, these few missing and circumscribed data points should not affect the overall validity of our analysis.
The manual curation phase (i.e. a two day, single person, task) principally aimed at resolving missing affiliations and linking them to correct institutions in the GRID database. In particular, for each contribution whose affiliation details (i.e. gridID, organisation name, city, country, and continent) were empty, we used the provided affiliation string (a plain, “catch-all” text field) to manually infer the missing pieces of information. Often, for lack of clarity of such a string, we availed of information accessible on the Springer website, the PDF of the paper itself, and other institutional websites in order to resolve the affiliation correctly. Whenever GRID provided no entry for the institution in question, but we were still able to narrow down at least its country (e.g. aCompany GmbH), we opted for “minting” a fictional identifier. When even this was not possible, we had no other option but to leave the affiliation unresolved. Fortunately, our enrichment procedure left our datasets with a minority of unresolved contributions, as we will discuss later in detail. We argue that this process, even if time consuming, enabled us to analyse affiliations with a good granularity and to take into account also institutions involved in a small number of research outputs. Table 1 summarises the key features about the datasets used in our analysis.
Table 1
Features of the datasets used for our analysis
| Macro analysis | Micro analysis | |||
| ISWC | ESWC | TPDL | ||
| observation period | 1996–2016 | 2003–2016 | 2004–2017 (excl. 2007) | 2003–2017 (excl. 2014) |
| contributions | 1,664,733 | 3,924 | 4,224 | 3,271 |
| unique papers (DOIs) | 477,921 | 1,028 | 1,141 | 919 |
| countries | 166 | 44 | 54 | 52 |
| institutions (gridIDs) | 15,423 | 3,739 | 4,076 | 3,208 |
| conference series | 1,016 | – | – | – |
For each dataset, we analysed trends about papers (identified by unique Digital Object Identifiers, DOIs), countries, and institutions (identified by unique gridIDs) over time, as well as their distributions across the entire observed period. Besides, we tried to assess to what extent the research landscape was open (or closed) to changes by measuring the variability of country rankings over the years. To this end, we defined as rate of change
We also took into consideration the very peculiar nature of the data here considered: conference papers, usually not covered by traditional scientometrics and bibliometrics studies that instead mainly focus on journals. Unlike journal papers, having a publication accepted in conference proceedings usually requires at least an author to present the work at the venue. This aspect has major implications that need to be studied further. We thus performed an analysis on the relationship between the country in which a conference was hosted and the countries from which the publications were from. For this purpose, we assumed that the first author is the one who selects or attends the venue, hence the origin of the paper is the country of affiliation of the first author. This heuristic should hold also in the cases in which the first author is a student and the supervisor would choose the venue, since they would have the same affiliation.
Finally, we took into consideration the author order (present in SciGraph) and formulated the hypothesis that different author contributions weigh differently when writing a paper. In particular, we hypothesised that the first author indicates the initiator of a research effort, while the last author indicates the professor or the research line supervisor acting as an overseer of the work; a hypothesis that seems reasonable in many disciplines, especially in computer science, which is well represented in our datasets. We validated this intuition both quantitatively and qualitatively. We observed that only 26.8% of papers in our macro dataset happen to have authors ordered alphabetically (single-authored papers being considered as not ordered). Also, among the papers resulting in an ordered author list, 58% is authored by just two authors, indicating that the aforementioned percentage is likely an overestimation of the actual number of papers with alphabetically ordered authors. Finally, the percentage drops to 11.25% when considering papers with three or more authors.
Checking the “seniority” of authors would be another viable strategy to test further our hypothesis. Unfortunately, author disambiguation and references are not yet modelled in the present version of SciGraph and thus a computational estimation of seniority based on the number of papers produced, citations count, period of activity, or similar factors was not possible. We opted for proceeding from a qualitative point of view and observed the name of the researchers that appeared most as last authors in the datasets under analysis. In the macro dataset, we found a number of very influential (papers, H-index and citations looked up on Google Scholar) scientists who lead significant research groups. We validated that the same stands for the three datasets for the micro analysis. Of course this hypothesis does not hold in all the cases (e.g. papers in which the order is alphabetical or other) and does not reflect a common custom for all academic disciplines (e.g. in Humanities & Social Sciences); however, we believe that this can be a good approximation that works well for this analysis. Indeed, the same hypothesis has been followed in a number of recent studies [23,32,34,37].
The results shown in the following are obtained by analysing the datasets within a Python notebook1717 availing of Pandas library.1818 For reproducibility purposes, the datasets and the Python notebook are accessible on Github,1919 as well as on Zenodo2020 for long-term preservation. Nonetheless, the datasets can be easily reconstructed following the methodology we just described. All the plots here included, and many others not reported for the sake of space, are available online.2121 As the plots are rich in content, the images reported here cannot adequately render all the information available. Therefore, we strongly suggest the interested reader to consult also the online visualisations, which are also interactive.
5.Results
In this Section, we report the results emerged from our macro and micro analysis. The discussion of such results can be found in Section 6.
5.1.Macro analysis
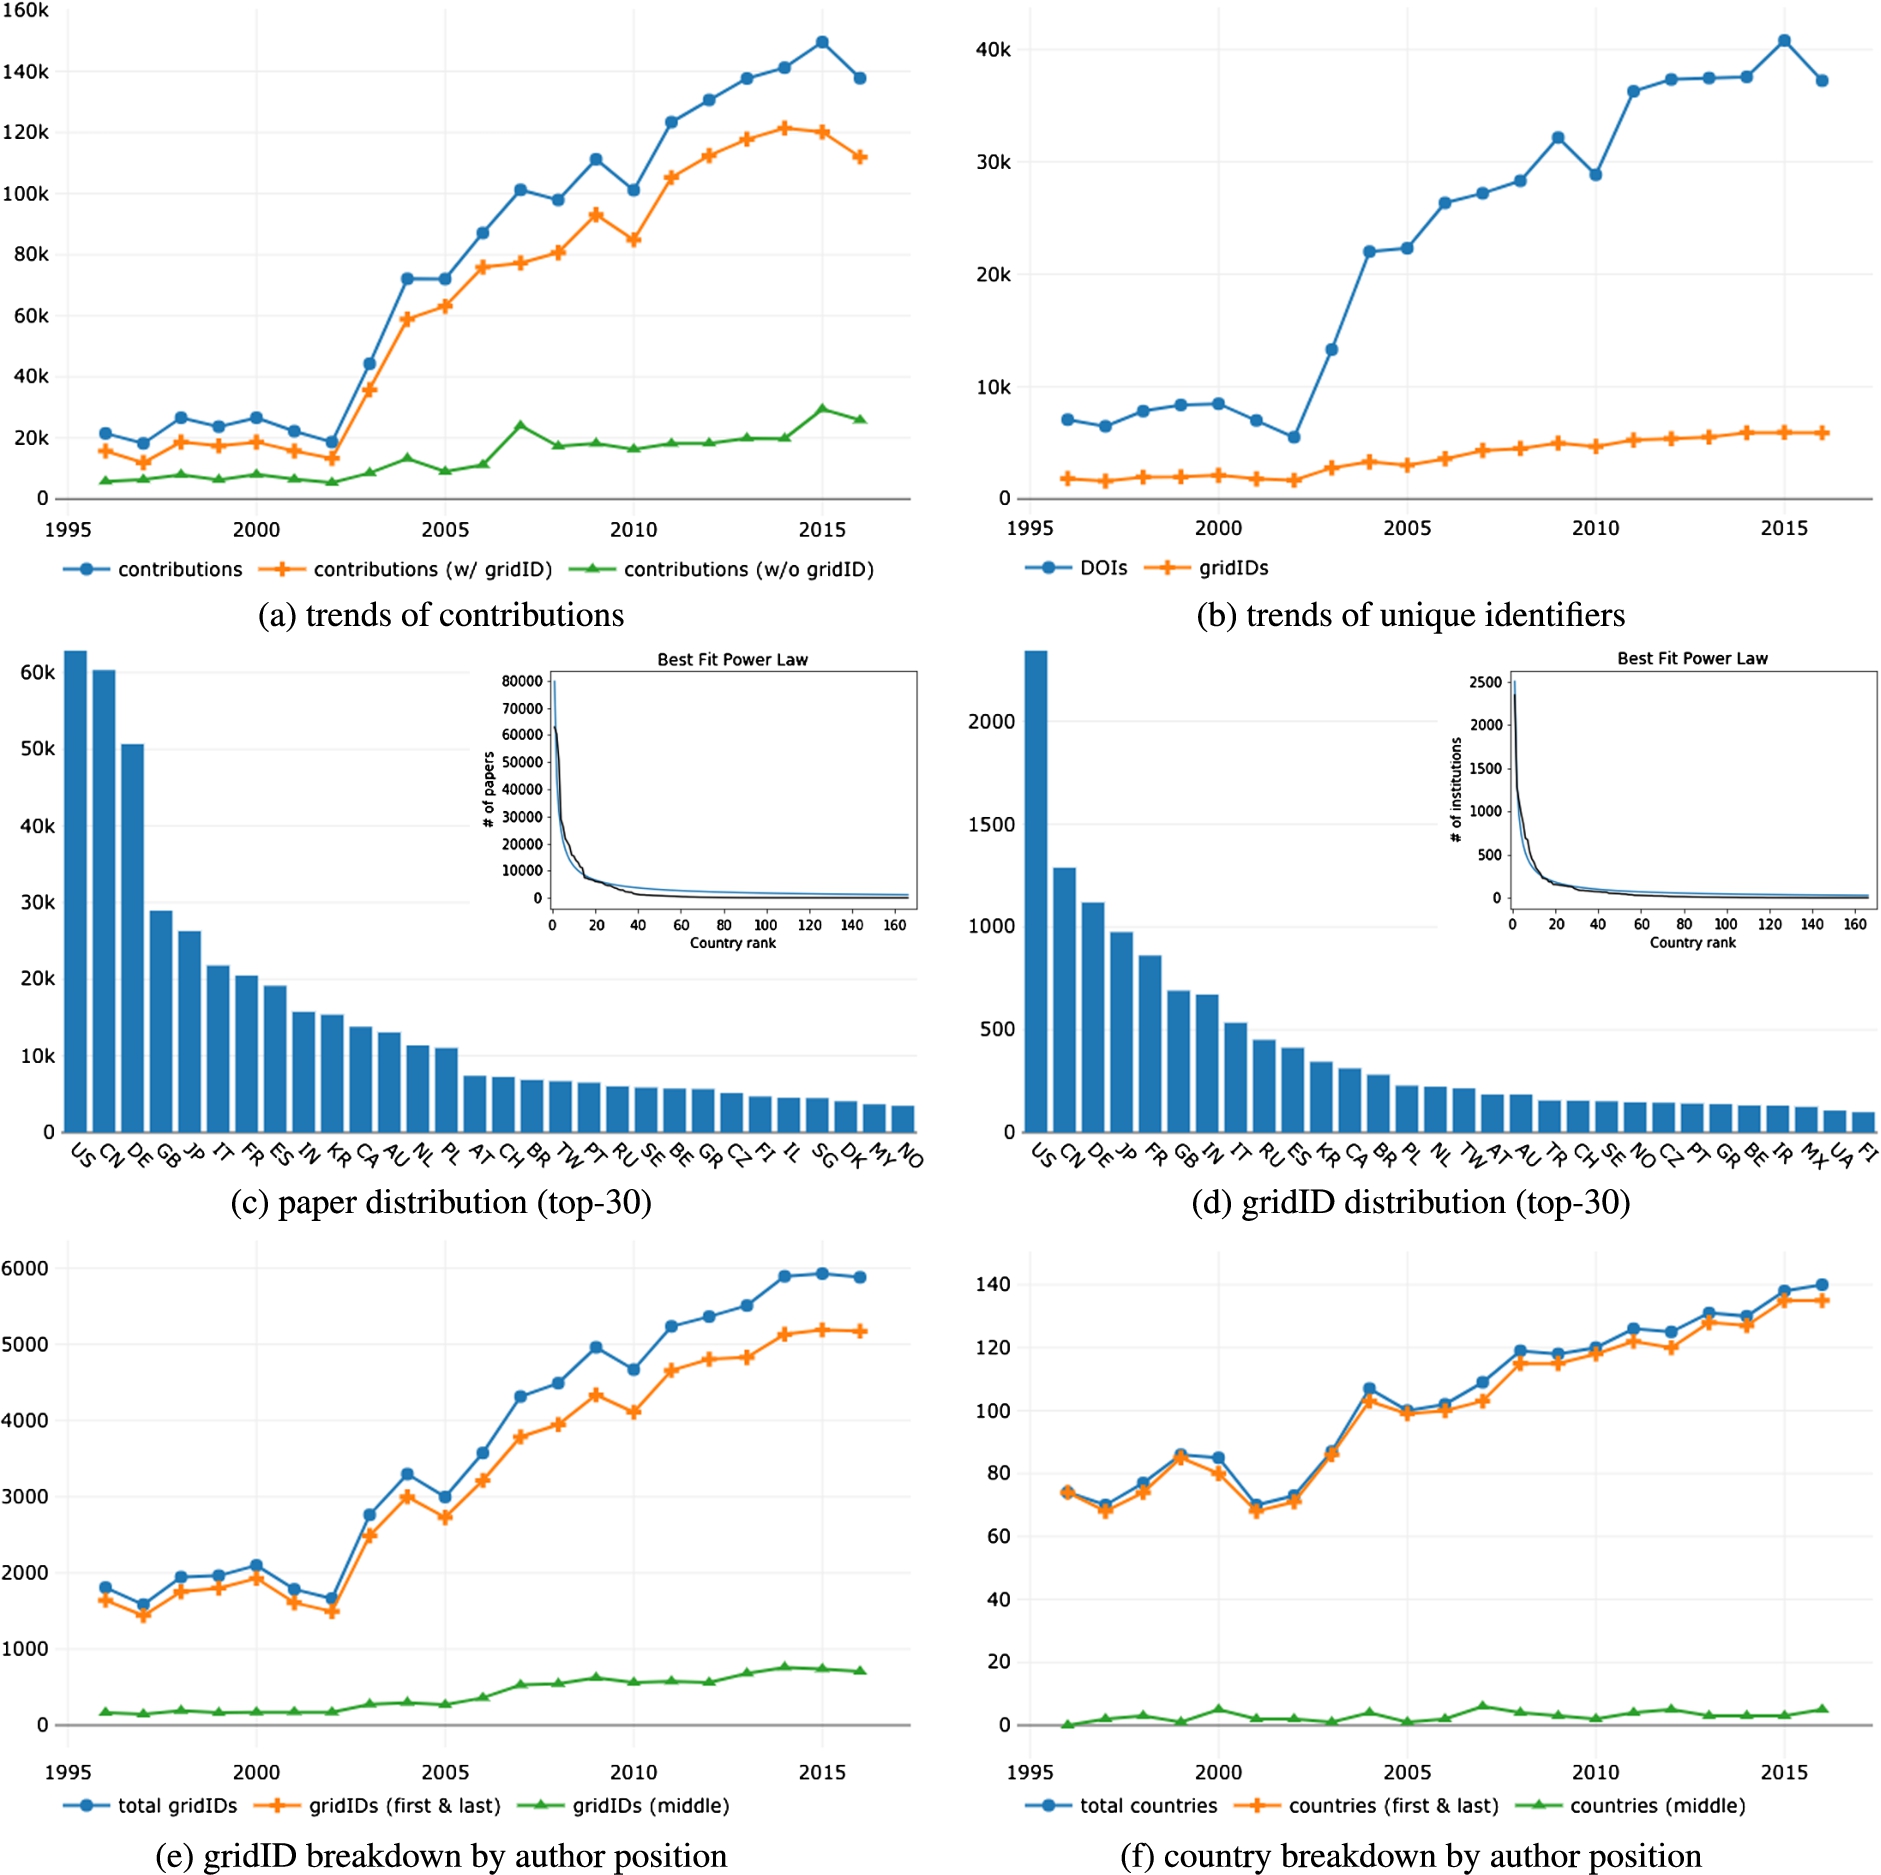
The number of contributions for each year, either with or without resolved affiliations, is reported in Fig. 1(a). We can notice how information about authors’ affiliation is present in the majority of contributions in our dataset. Figure 1(b) shows the number of unique papers (DOIs) and the number of unique institutions (gridIDs) over the years. Despite a scale factor, the two trends are correlated with a Pearson’s correlation coefficient [27] of
Figure 1(c) reports the distribution of papers among countries over the observed period without taking initiators and overseers into account (top-30 for the sake of space). The distribution is heavily skewed in favour of USA, China, and Germany. The data points follow a power law2222 confirming the results of previous literature [8 ,18 ,22,25]. Interestingly, the power law characteristic of the paper distribution over countries is also valid in each year across the period. The data follow the Pareto distribution [26] with 20% of the countries producing more than 80% of the papers. The distribution of institutions over countries (i.e. the number of institutions present in a given country) follows as well a power law, as shown by Fig. 1(d). Again, the figure shows the first 30 countries in order to improve the readability. For the sake of space, we omitted the details about the distributions among countries of papers and institutions for first and last authors; the reader can consult them online.
Fig. 1.
Results form the macro analysis. (a) the trends of contributions with and without resolved authors’ affiliations. The amount of unresolved affiliations (in green) is relatively contained. (b) the trends of unique papers and institutions (highly correlated, despite the scale factor). (c) and (d) the distribution of papers and institutions among countries respectively. In figures’ inlays, the best fitting power law of the two distributions. (e) and (f) the breakdown of unique institutions and countries by authors’ position (i.e. first/last vs middle authors).
In order to assess the openness/closeness of the research landscape, we computed the average
Fig. 2.
Yearly top-10 country rankings in the macro analysis (a) and country ranking similarity over the whole observed period according to Spearman’s rho (b).
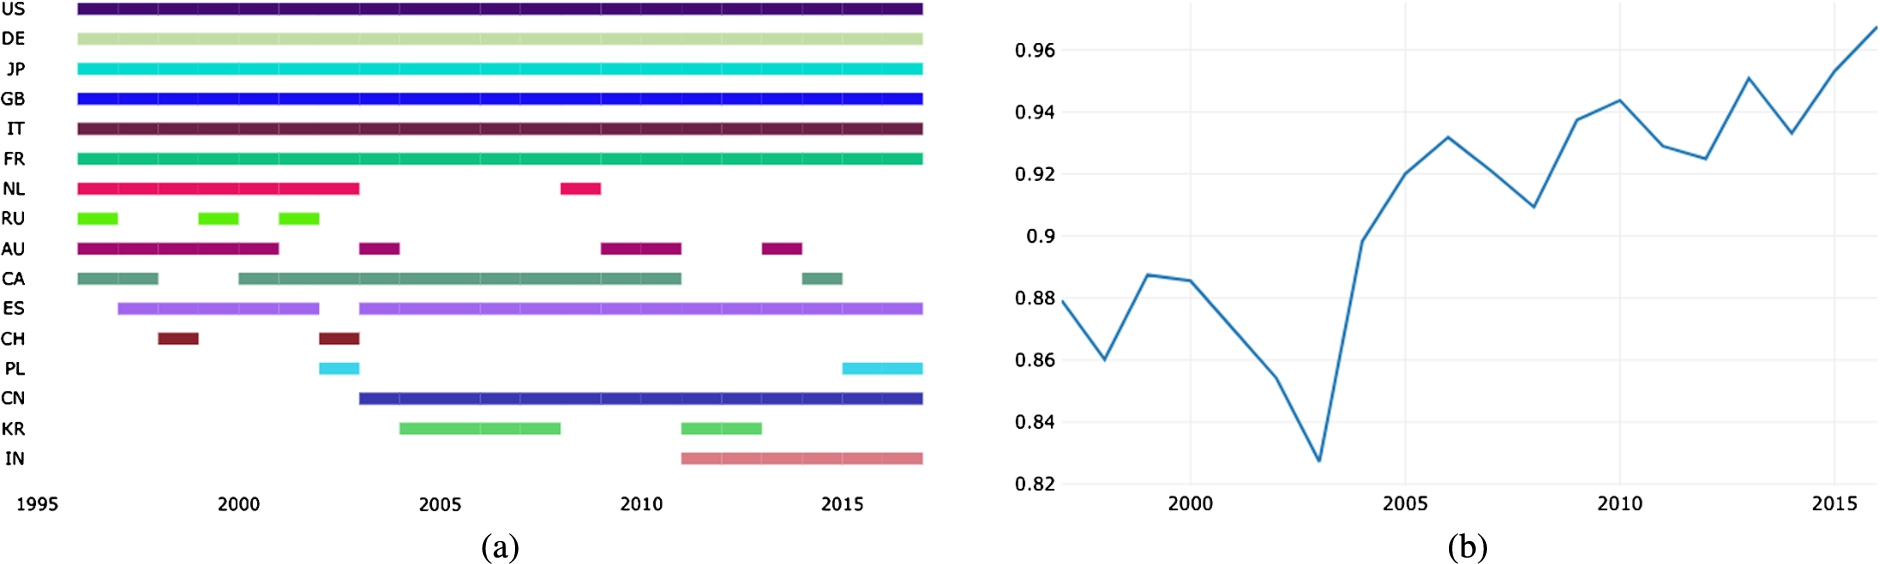
We also evaluated the similarity of country rankings (in terms of papers produced) in subsequent years over the whole set of countries (166) according to Spearman’s rho. As it can be noted in Fig. 2(b), the coefficient is globally growing over time, denoting an increasingly static landscape. The average Spearman’s rho in the period under analysis is 0.9, which is traditionally considered a very strong direct correlation, and grows up to 0.96 in 2016. Interestingly, the Spearman’s rho lowers momentarily in 2002–2003, suggesting that the emergence of China and other Asian countries was briefly able to invert the trend, as also indicated by Huang et al. [15]. However, from 2004 the Spearman’s rho started to grow again, indicating that the appearance of few new players did not change the long term dynamics. It thus appears that, despite the larger availability of scientific publications online, the research landscape is actually become increasingly impermeable to emerging countries.
The results of the analysis of conference venues are summarised in Fig. 3. Figure 3(a) shows a world map where edges represent papers sent from a given country to conferences in another country. Papers are aggregated by country (i.e. thickness of an edge) and continent (i.e. the colour of the edge). For practicality, latitude and longitude are relative to the countries centroids.
Fig. 3.
Results from the analysis of conference venues on the macro dataset. In (a), a generic edge originates from a country (i.e. its centroid) contributing to a paper and terminates on a country hosting the venue where it has been presented. The thickness of an edge encodes the number of papers a country contributed to, while the colour encodes the country’s continent of origin. In (b), an heatmap showing how continents of affiliation (on y-axis) split their papers among continents hosting conferences (on x-axis). In (c), the dual heatmap showing in what percentage the papers received by continents hosting conferences (on y-axis) are divided among continents of affiliation (on x-axis). In (d), a bubble chart representing how countries divide their contributions among continental and intercontinental conferences. Each bubble represents a country; the colour encodes the continent the country belongs to, while the area encodes the number of papers published by the country within its own continent.
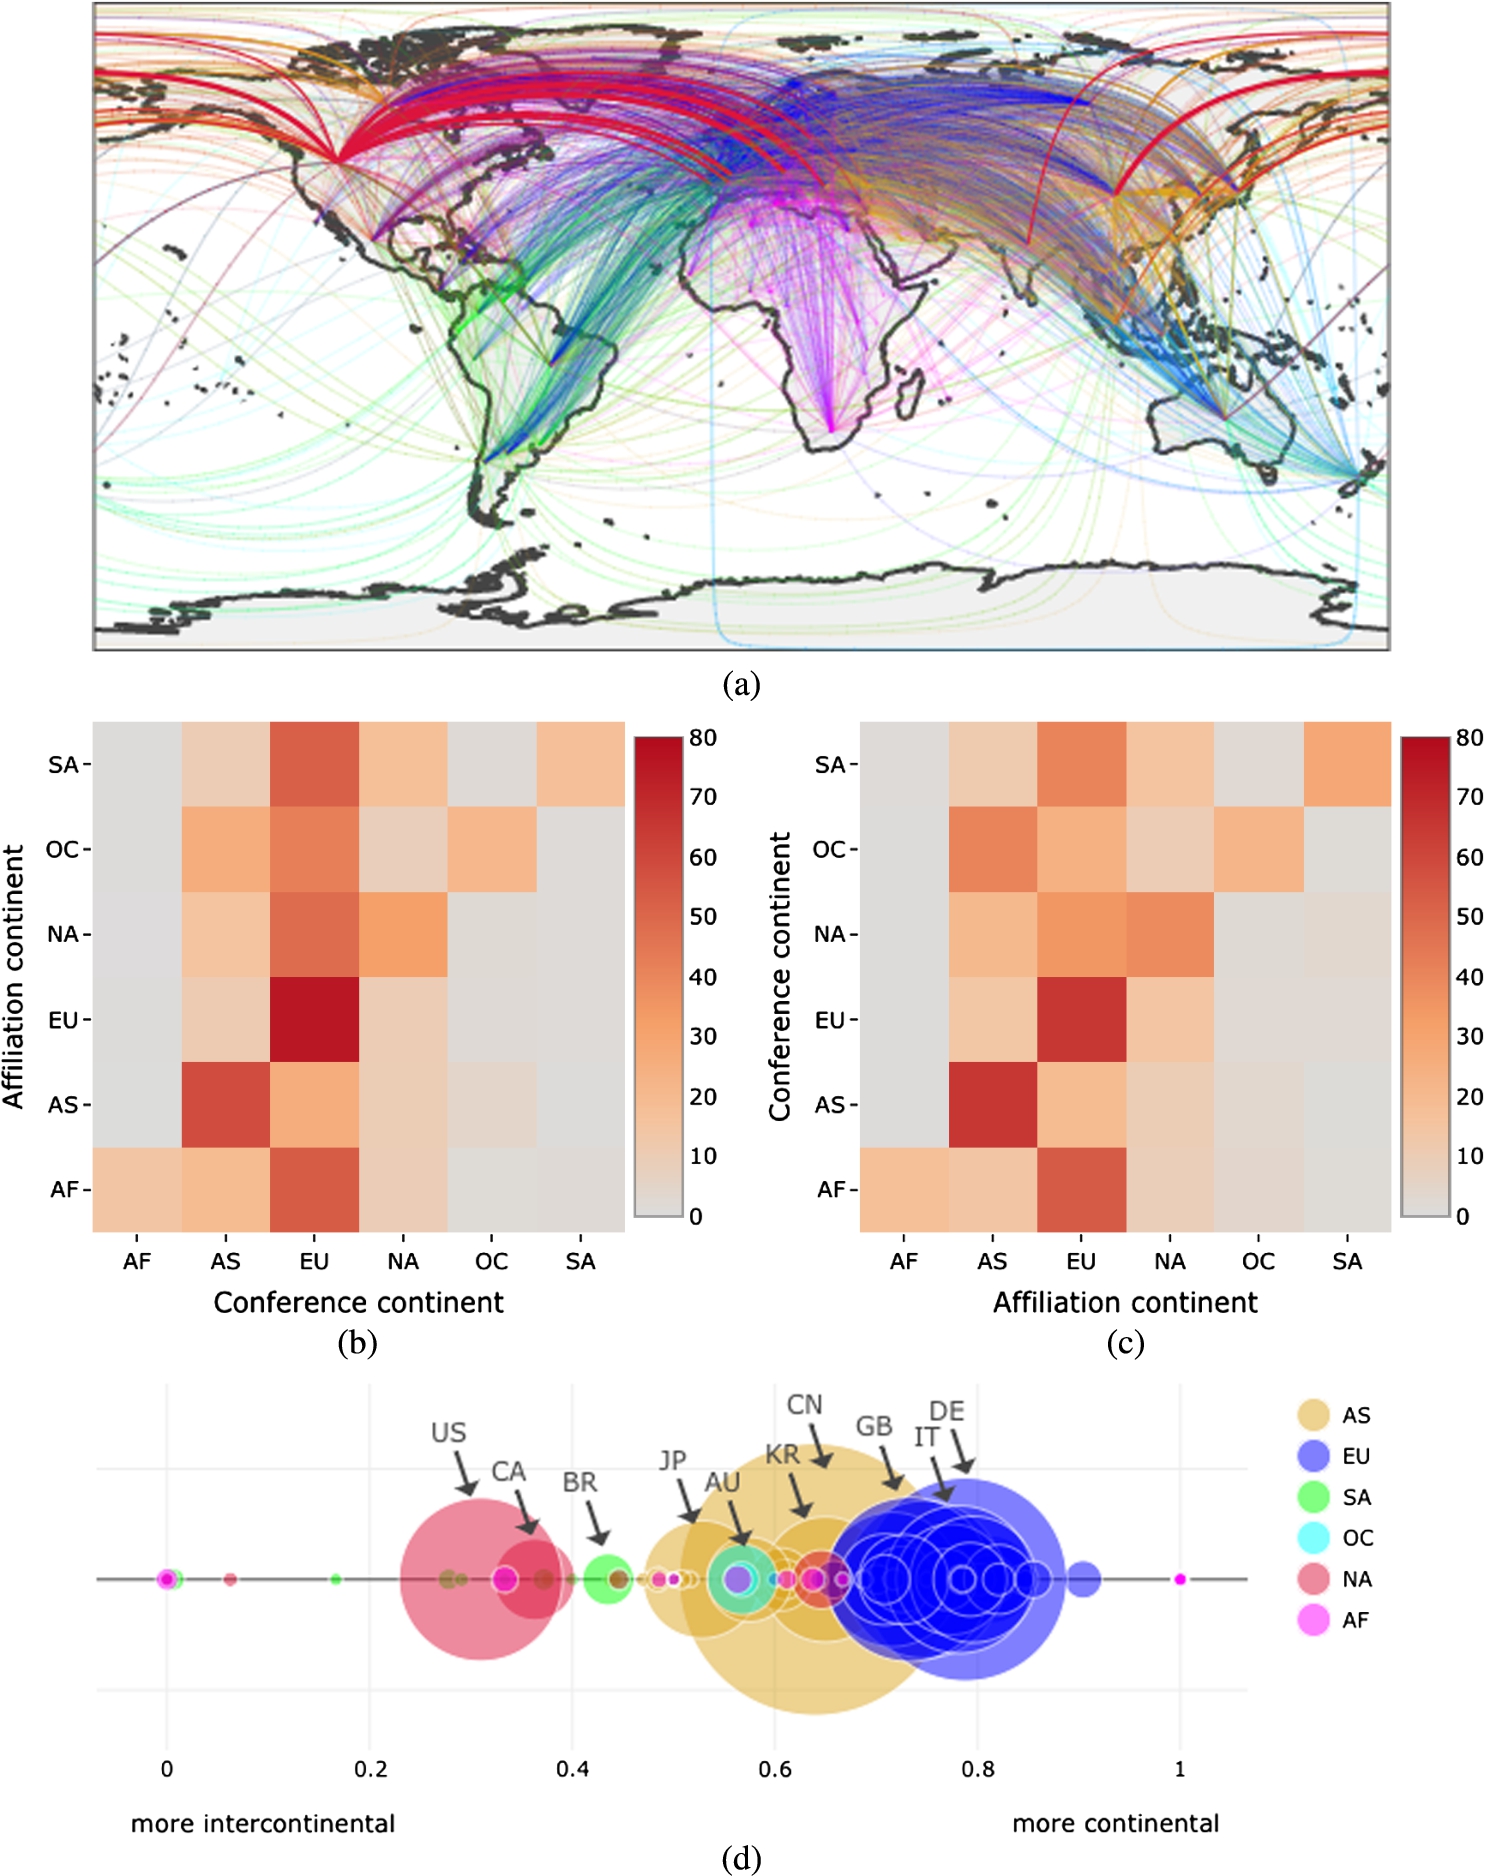
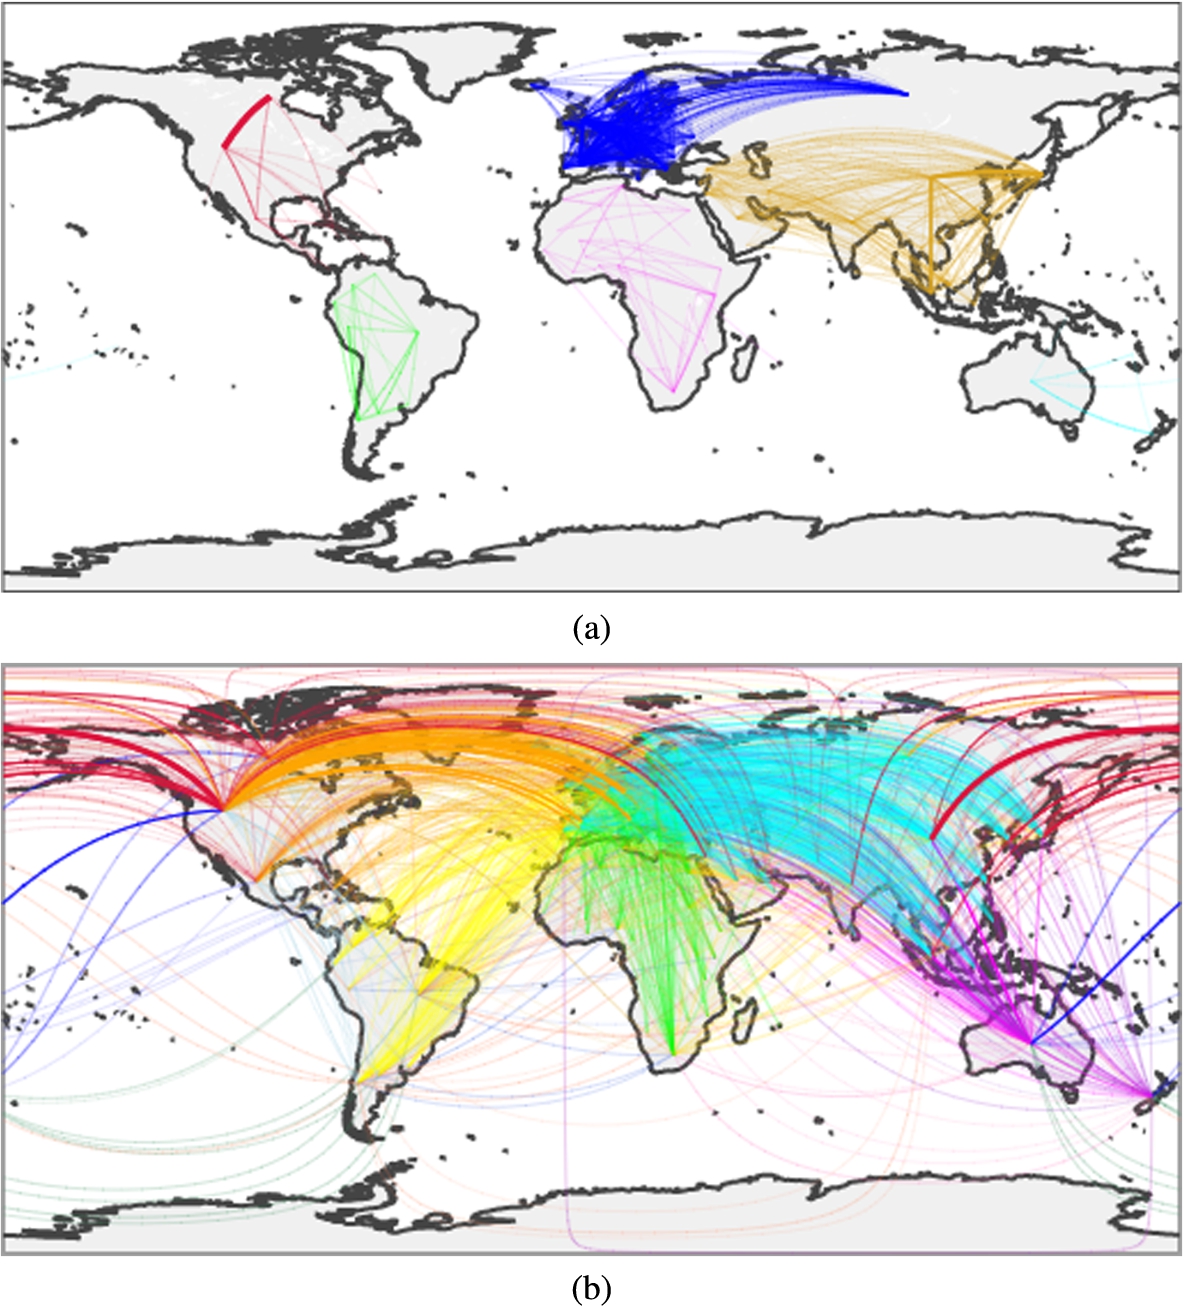
The heatmap in Fig. 3(b) shows the patterns with which different continents submit their papers to conferences (rows sum up to 100%) and provides a key to read Fig. 3(a). Europe appears to be the main target for all the other continents (Europe: 75.72%, North America: 48.93%, Africa: 53.72%, Oceania: 42.29%, South America: 52.40%) with the notable exception of Asia (only 25.91%). The fact that European countries send so many papers to conferences in Europe is not surprising as the continent is dense of opportunities and exhibits a very tight network of collaborations. What seems surprising is that other continents concentrate the largest part of their volume towards Europe, a signal that we interpret as a global acclamation of research quality: researchers, even from afar, even from developing countries, tend to be attracted to European conferences. In contrast, Asia publishes 58.86% of its papers in conferences hosted in Asia. This might suggest that Asia too has developed over the years a research environment dense of opportunities, and with a tight network of academics. The collaboration networks of Europe and Asia emerge quite clearly in Fig. 4(a), which displays intracontinental collaborations among countries. Figure 4(b) reports instead intercontinental collaborations among countries. As before, Europe appears to be the most prominent continent.
Fig. 4.
Intracontinental (a) and intercontinental (b) collaborations among countries. Edges represent a collaboration among two countries within a paper; the width of the edge represents the intensity of the collaboration, while the colour encodes the couple of continents involved. As the images are information rich, we suggest exploring them on the online notebook.
The dual heatmap in Fig. 3(c) reports the number of papers received from conferences aggregated by continent (rows sum to 100%). It may be reasonable to believe that conferences tend to attract especially “local” contributions (on the diagonal in the heatmap). However, this is true only for Asia (65.89%) and Europe (65.88%). Indeed, conferences located in Africa and South America appear to accept mostly European papers (54.09% and 41.25% respectively), while conferences located in Oceania publish mostly Asian papers (41.15%). Interestingly, North America seems to be the less biased scenario, with 38.63% papers received from North America, 34.81% from Europe and 20.69% from Asia.
Countries will also tend to focus differently on conferences series that frequently change continent (i.e. intercontinental conferences series) and those that are generally local to a specific continent (i.e. continental conferences series; here defined as conferences series with at least 80% of instances within the same continent). The bubble chart in Fig. 3(d) highlights such dynamics. Each bubble represents a country, while its colour encodes the continent, and its area represents the number of papers published by the country in conferences within its own continent. The right hand side of the plot is populated by countries that focus mainly on continental conferences series, while the left hand side by countries that publish mostly in intercontinental ones. European countries (in blue, Germany the biggest) share a similar footprint as they appear strongly focused on continental (European) conferences series. Asian countries (in yellow, China the biggest) behave similarly, but they are slightly more open to intercontinental conferences series. USA (the biggest in red) and South American countries have a very different footprint and present most of the papers in intercontinental conferences series hosted in North America and South America respectively. Finally, Oceania exhibits a more balanced blend (approximately 50/50), while African countries appear fanned out with no remarkable pattern standing out.
As a conclusion of our macro analysis, we present the results emerged by applying our hypothesis on authors’ position, i.e., first author as the initiator of a research paper, and last author as the overseer. Figure 1(e) presents the total number of institutions involved in research over time (in blue) and compares the number of unique institutions appearing as affiliations of the first and last authors (in orange), and the unique institutions appearing only as middle author’s affiliations (in green). The figure suggests that there is a substantial gap between the number of institutions that initiate and oversee a research endeavour versus the total number of institutions involved in research. Also, this gap appears to grow over time raising from 166 unique affiliations never initiating or overseeing research papers in 1996 to over 700 in each of the last 3 years (2014–2016). Interestingly, this phenomenon is present despite the fact that the average number of authors per paper does not exhibit the same growth, oscillating steadily around 3.06 (
For the sake of completeness, we ran the same analysis for countries. Figure 1(f) highlights the trend of countries in function of the authors’ positions. Also in this case, we see a gap between the total number of countries involved in research and the number of first and last authors’ countries of affiliation; however, it does not exhibit the same striking growth as in the case of institutions. We believe that this is due to the naturally limited number of countries, as opposed to the virtually unbounded number of new institutions that keep appearing each year. However, the number of affiliation countries of middle authors passes from 0 to 5 over the whole observed period. We finally noticed that the countries that tend to not lead many research contributions are usually developing ones (e.g., Nicaragua, Burundi, Congo) or very little ones (e.g., San Marino, Monaco).
5.2.Micro analysis
Here we summarise the results obtained by analysing the three high-tier conferences (i.e., ISWC, ESWC and TPDL). Figures 5(a), 6(a), 7(a) and Figs 5(b), 6(b), 7(b) show respectively the number of contributions, and the number of papers and institutions contributing to the conferences over the years. Since we manually curated the three datasets, the percentage of unresolved affiliations is much lower than for the macro analysis. Again we can observe a high correlation between the number of papers accepted and the number of contributing institutions. Differently from the macro analysis, however, the number of papers and institutions are within the same order of magnitude. Indeed, the number of papers accepted each year by a conference is naturally limited, whereas there are no limitations to the number of institutions that can apply.
Fig. 5.
Results from the micro analysis of ISWC. (a) the trends of contributions with and without resolved authors’ affiliations. The amount of unresolved affiliations (in green) is relatively contained. (b) the trends of unique papers and institutions. (c) and (d) the distribution of papers and institutions among countries respectively. In figures’ inlays, the best fitting power law of the two distributions. (e) and (f) the breakdown of unique institutions and countries by authors’ position (i.e. first/last vs middle authors).
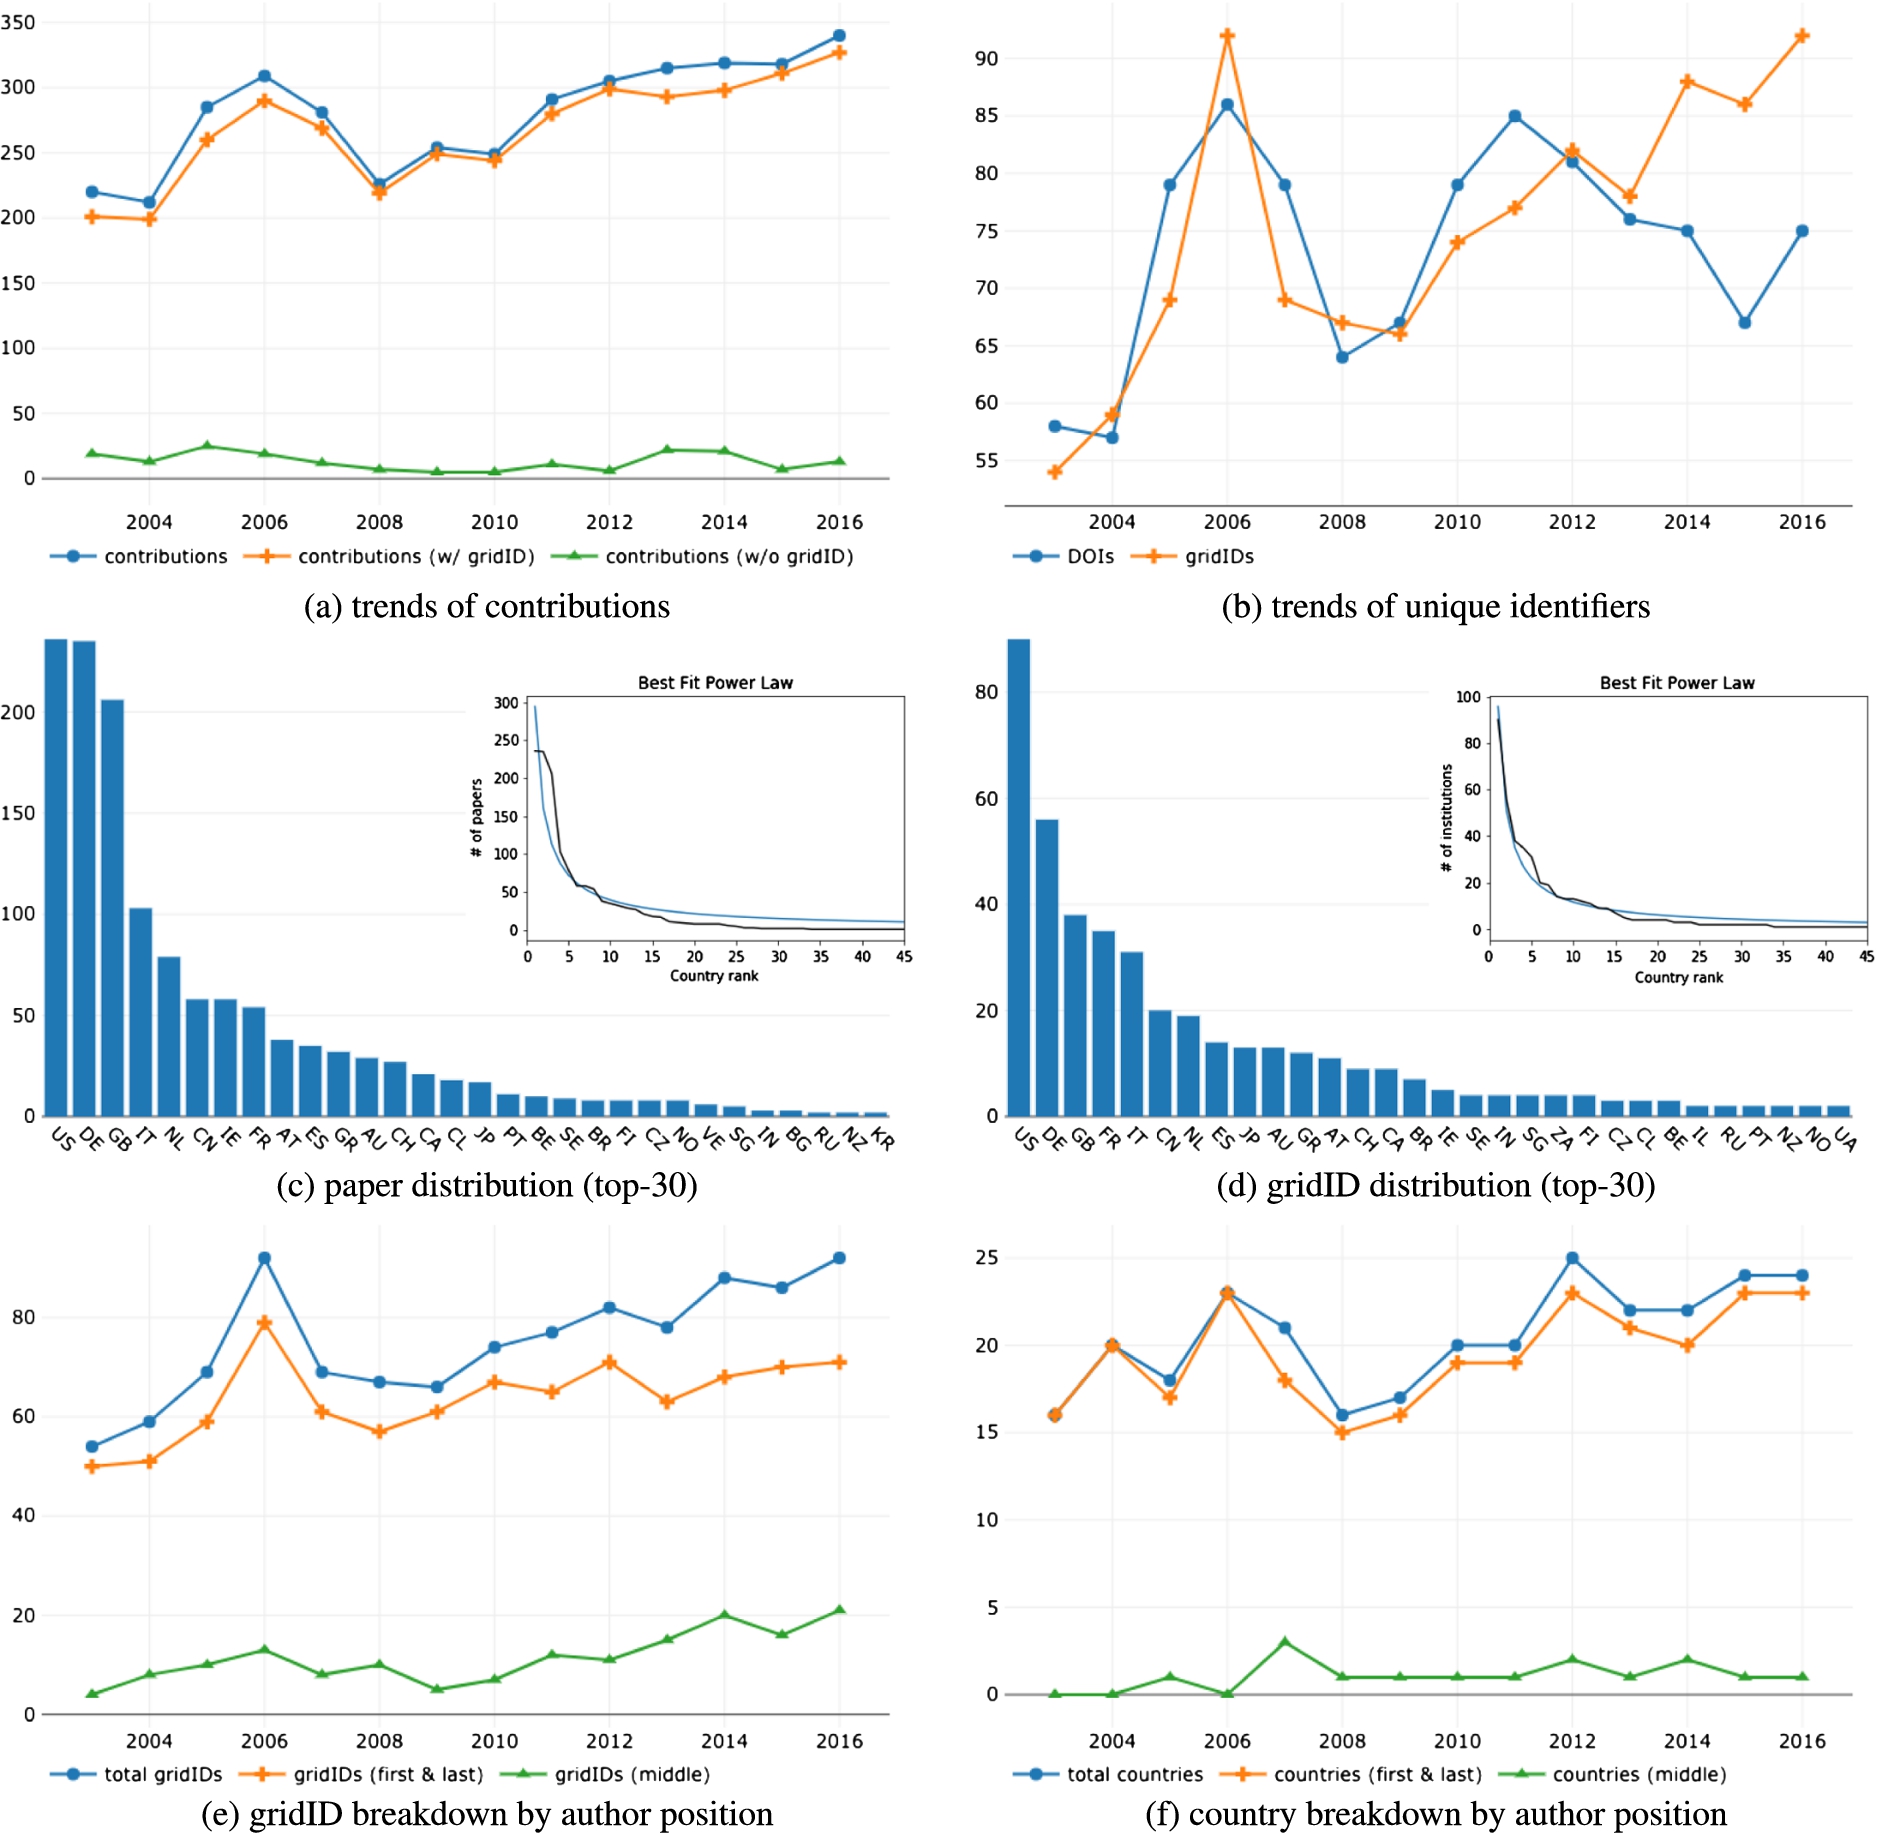
Fig. 6.
Results from the micro analysis of ESWC. (a) the trends of contributions with and without resolved authors’ affiliations. The amount of unresolved affiliations (in green) is relatively contained. (b) the trends of unique papers and institutions. (c) and (d) the distribution of papers and institutions among countries respectively. In figures’ inlays, the best fitting power law of the two distributions. (e) and (f) the breakdown of unique institutions and countries by authors’ position (i.e. first/last vs middle authors).
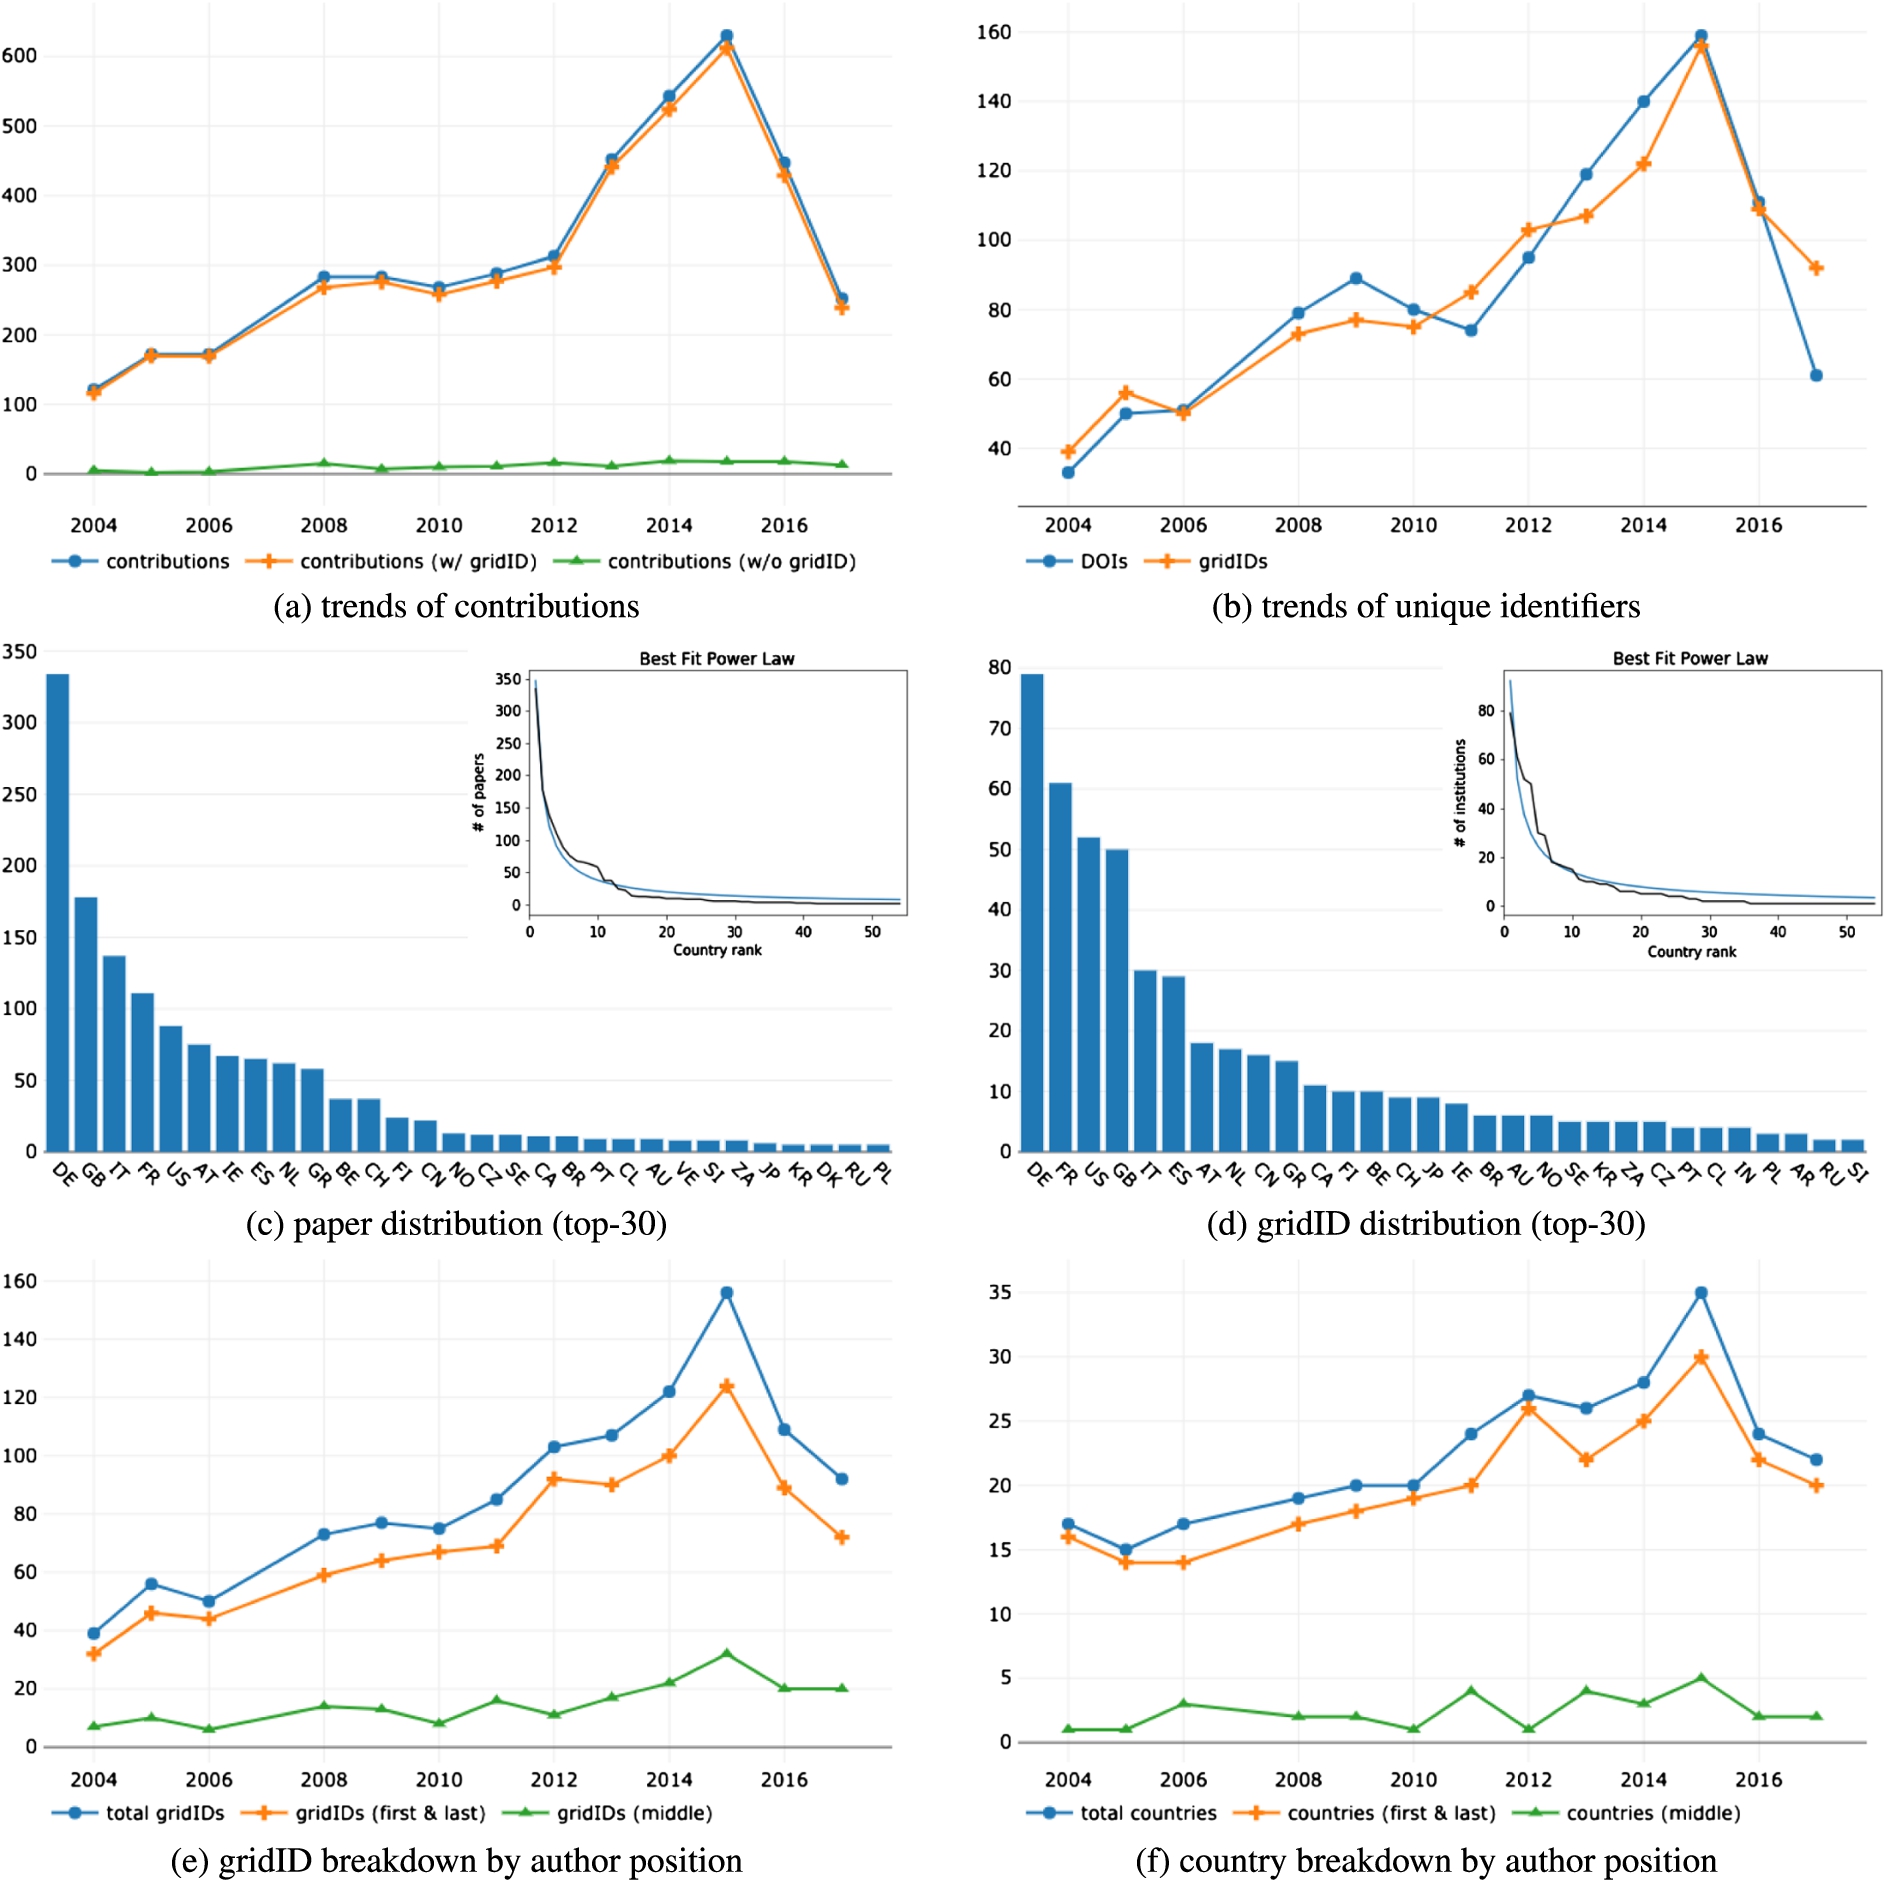
Fig. 7.
Results from the micro analysis of TPDL. (a) the trends of contributions with and without resolved authors’ affiliations. The amount of unresolved affiliations (in green) is relatively contained. (b) the trends of unique papers and institutions. (c) and (d) the distribution of papers and institutions among countries respectively. In figures’ inlays, the best fitting power law of the two distributions. (e) and (f) the breakdown of unique institutions and countries by authors’ position (i.e. first/last vs middle authors).
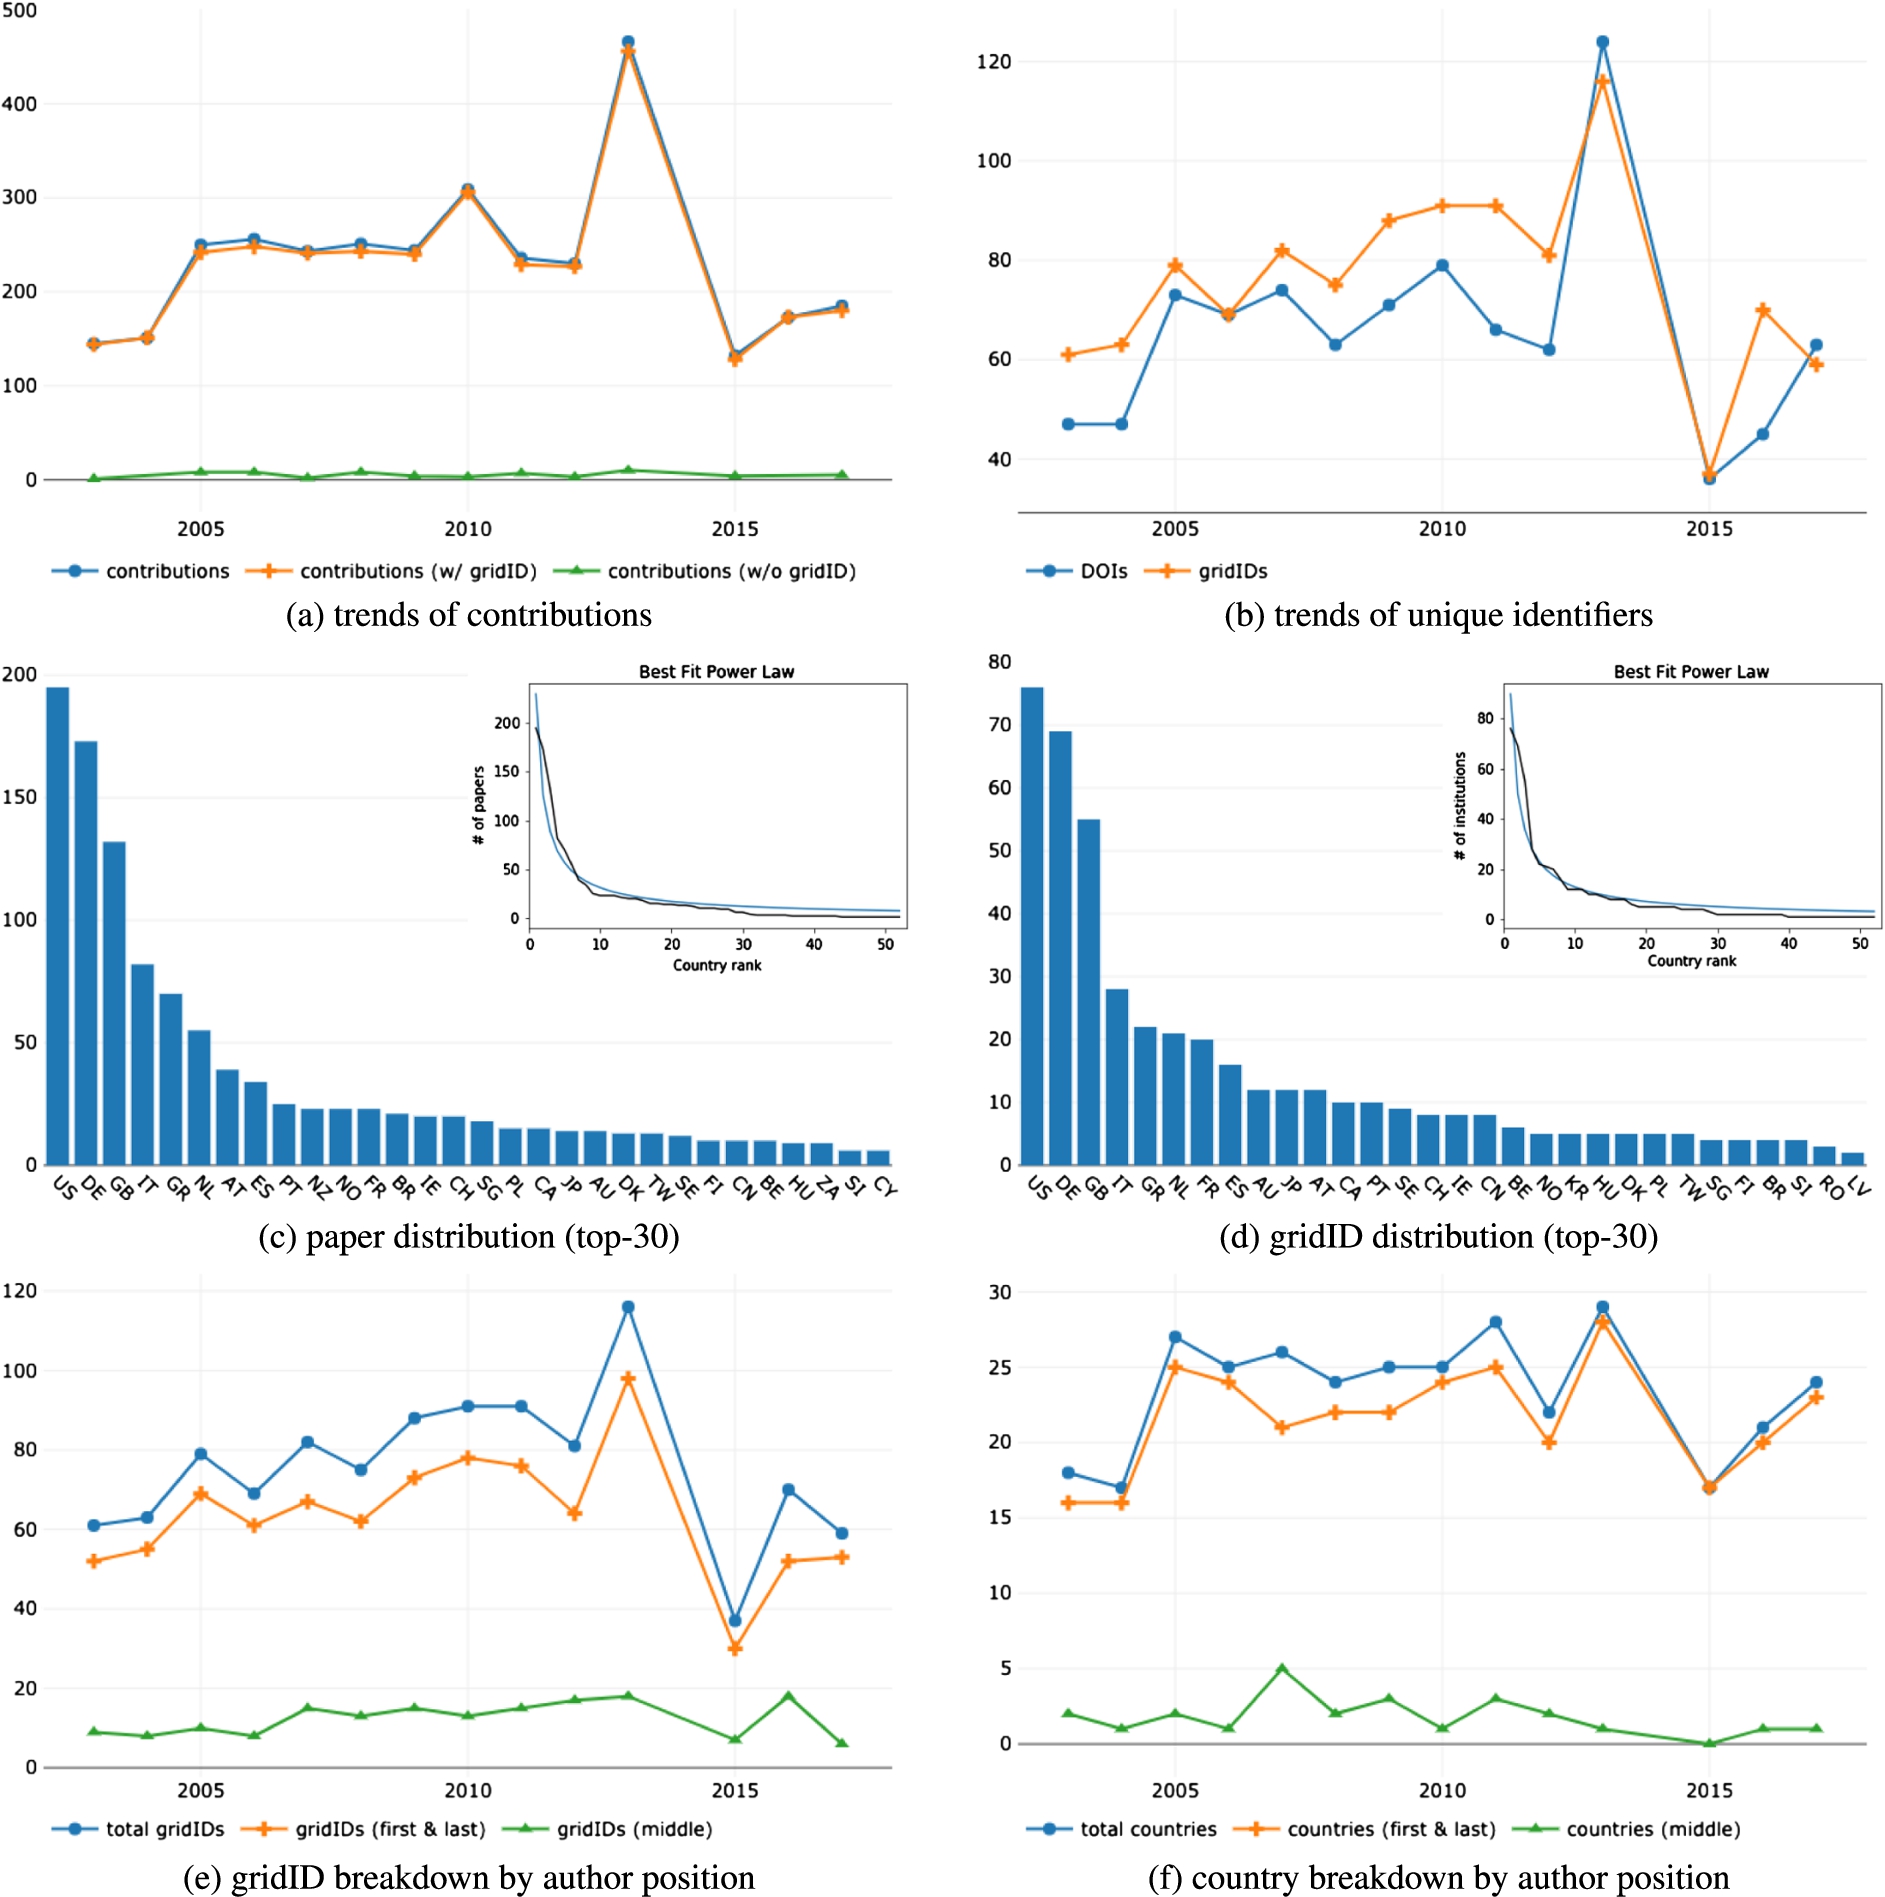
Figures 5(c), 6(c), 7(c) and Figs 5(d), 6(d), 7(d) confirm the results reported in the previous section showing that even in these conferences the distribution of papers and institutions across countries follows a power law. However, this is not always verified in a specific year mainly because of insufficient data points (i.e. in a single conference edition the number of papers is limited).
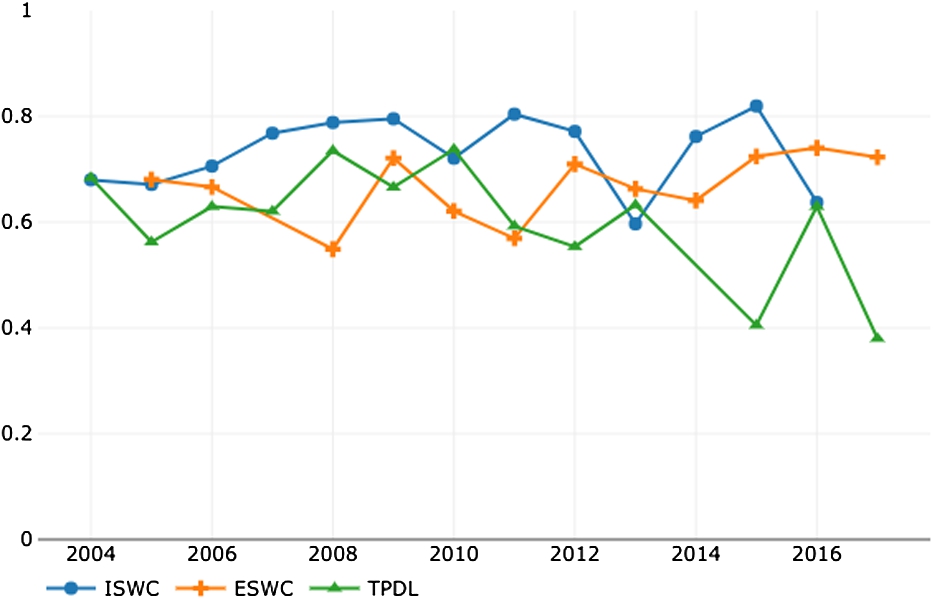
As before, we evaluated the stratified top-n rate of change for each single conference. We had to limit our analysis to top-5, top-10 and top-15 since the set of countries participating in a single year to such conferences can be quite limited. Table 2 reports the analysis on the turnover rates. When considering these specific conferences the situation is slightly more open to changes in yearly country rankings than in the macro analysis. The table also reports the average Spearman’s rho evaluated across the whole period and highlights for example that ISWC seems less prone to variations than its European counterpart, while TPDL appears to be the venue most open to changes among the three. This can be also noticed from the trend of Spearman’s rho over the year reported in Fig. 8. The trend for TPDL (in green) is decreasing over the years indicating more variability in country rankings. Not surprisingly, we noticed a stronger presence of European countries in ESWC than in the other two conferences; this is probably due to the initial local target of the conference. Also, China appears quite involved in the semantic web community, but is less active in the TPDL conference and never appears in the top-10.
Table 2
Average
| Average | Average Spearman’s rho | |||
| Top-5 | Top-10 | Top-15 | ||
| ISWC | 0.21 | 0.25 | 0.23 | 0.73 |
| ESWC | 0.30 | 0.20 | 0.23 | 0.66 |
| TPDL | 0.26 | 0.34 | 0.32 | 0.60 |
Fig. 8.
Country ranking similarity evaluated according to Spearman’s rho for the three selected conferences throughout the whole observed periods.
The analysis on authors’ position is fairly aligned with the macro analysis. Figures 5(e), 6(e), and 7(e) report the number of institutions contributing to the conferences and highlight the trends of the ones appearing as first and last authors’ affiliations, and the one relative to institutions appearing only as middle authors’ affiliations. As in the previous analysis, all the three conferences show a growing gap between the institutions associated with first/last authors and the total number of affiliations.
We investigated further and retrieved the sets of institutions never appearing as either first or last authors’ affiliations throughout the entire observed periods (available online). Here it can be noted how prestigious universities and research centres appear side by side with smaller firms, museums, national libraries, hospitals and less well-known universities. This result indicates that the gap is “populated” by institutions that at some point collaborated in semantic web research (or digital libraries) making it through, whereas they never stand out on their own (for reasons beyond our knowledge) by having affiliated authors in first/last position. Indeed, institutions like national libraries, museums, the European Bioinformatics Institute, the British Geological Survey, the National Institute of Standards and Technology, and so on, provided interesting research case studies or support that eventually culminated in a publication, but apparently never happened to lead a paper on their own (at least not in these communities). We also verified that the intersection between these sets across different conferences is not empty, suggesting that a few institutions struggled to surface as key contributors, despite being present in both communities.
For completeness, Figs 5(f), 6(f), and 7(f) show the trend of countries contributing to the conferences, highlighting country affiliations of first/last and middle authors. As for the macro analysis, results show that a gap is present most of the time, but this is not enough to spot out a clear, distinctive trend over the observed period. We believe this is due to the narrow focus of the micro analysis that restricts the view to a limited number of papers per year.
6.Discussion
The study of authors’ affiliations in the research literature has been performed for decades as it can provide answers to socioeconomic questions and frame academic research on a geopolitical canvas rather than studying it as an isolated complex system. In this work we analysed four datasets distilled from Springer Nature SciGraph and provided results on both a macro and a micro scale.
A possible limitation of our analysis lies immanently in the choice, somewhat forced, of SciGraph as our open dataset of reference, as it contains only Springer Nature material. This introduces a possible selection bias due to (i) single-publisher rather than pan-publisher viewpoint, and (ii) uneven distribution of academic disciplines. Indeed, some fields of study are under-represented in the dataset, while others are over-represented, such as computer science and engineering. Furthermore, SciGraph does not model citations to other papers, and, even so, the majority of them would by any rate fall outside Springer Nature domain. As a consequence, relevant metadata would be unavailable in SciGraph itself or available in other open datasets with insufficient affiliations’ details to support our analysis. Besides, the papers eventually accepted in conferences are a minimal fraction of the whole amount of submissions; a much clearer view about openness/closeness of conferences and research communities may be achieved by analysing also the data about rejected papers from conference management systems such as EasyChair2323 or ConfTool.2424 However, these data are only released by a very small group of conferences.
The results, in accordance with previous studies [18,22,25], showed that distributions of papers and institutions across countries still follow a power law in the period 1996–2016. In addition, our analysis of the turnover rate in country rankings highlights that not only top ranks in research are generally limited to a handful of countries and institutions, but that the situation appears also to be stagnant towards the lower ranks. In addition, we measured the Spearman’s rho between the ranking in consecutive years and found that it is raising steadily, with the exception of a brief period in which the emergence of China and a few of other countries temporarily inverted the trend. It thus appears that the ranking of countries in terms of scientific production is turning increasingly static over the years. This suggest that specific initiatives ought to be put in place, to widen participation in the relevant scientific venues. In general, this reflects the intuition that well-formed research communities may exhibit resistance towards the permeation of outsiders, not always sharing knowledge and set of best practices consolidated over the years. We believe that this phenomenon is worth studying further.
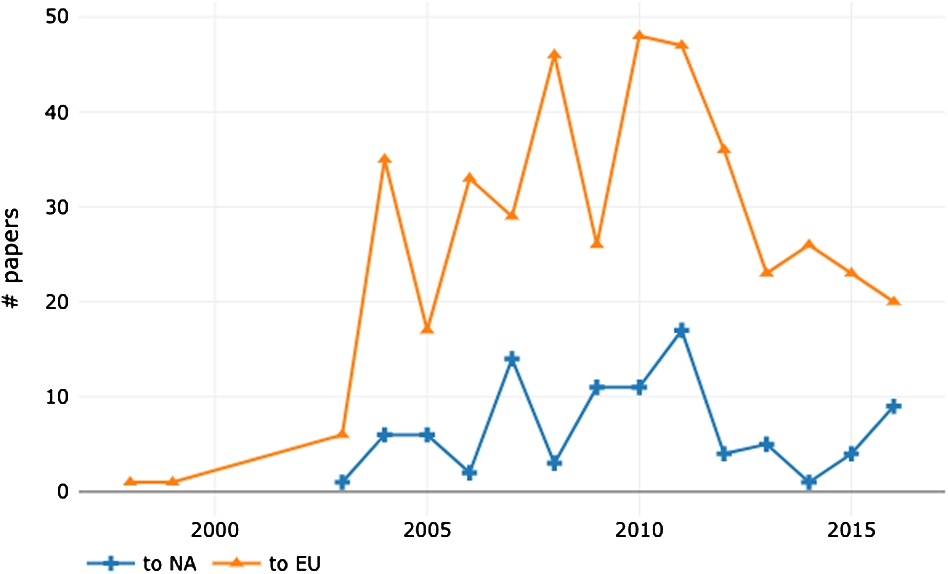
We also performed an analysis of the relationship between countries hosting and participating to scientific conferences, unveiling some interesting global trends. Europe stands out for its centrality in the research landscape, nonetheless also Asia exhibits a good network of “local” conferences and tight collaboration networks, probably in the attempt of recreating a fertile environment for knowledge diffusion similar to the one already present in Europe. We believe that considering mobility to venues offers a very context-rich dimension to investigate, which is often subject to economic and geopolitical factors such as geographic distance, budget availability for travels, and travel bans. In some cases, being physically present at the conference venue means taking long-haul flights; for some countries, such as Australia, New Zealand and similarly relatively isolated countries, the chances of being poorly connected to the conference venues are higher. In other cases, physical attendance might be hindered by economic factors, that in turn can depend on strategic and political decisions of specific countries. Finally, a plethora of factors driven by international politics and conflicts can play a major role too. In several occasions, travel bans disrupted scientists’ mobility. For example, in 2013 NASA prevented Chinese nationals to set foot in the space agency’s Ames research centre in California.2525 Furthermore, citizens of countries with a Muslim demographic majority are known to encounter more difficulties in getting travel visas to European or North American countries [24]. The travel ban2626 promulgated by USA president Donald Trump in 2017 recently sparkled a interesting discussion on this topic [24]. We are unable to analyse directly the effect of this particular travel ban since the current version of SciGraph does not cover 2017 adequately. However, it is interesting to study the trends of the involved countries in previous years. Figure 9 shows the overall number of publications, accepted in European and North American conferences, whose first authors are affiliated in Iran, Syria, Iraq, Libya, Somalia, Yemen, and Sudan during the 1996–2016 period (i.e. potentially issued visas). Interestingly, the production in North American and European conferences, which previously exhibited a positive trends, declined steadily after 2011 (year of the Syrian Civil War). This effect exist also in countries that did not experience any internal war over this period, such as Iran, suggesting that these trends may not be caused only by the internal turmoil, but also by the increasing difficulties in obtaining visas.
Fig. 9.
Number of papers sent to conferences hosted in Europe and North America by first authors affiliated to countries falling in president Trump’s travel ban list (Iran, Syria, Iraq, Libya, Somalia, Yemen, and Sudan).
Naturally, the concerns about researchers’ freedom of movement may affect only conference papers in which all the authors are subject to the same kind of restrictions; in the case of papers whose authors have heterogeneous affiliations (and nationalities), for example, the author with less restrictive constraints is, in principle, free to reach the venue and present the findings on behalf of the colleagues. However, in our dataset the average number of affiliation involved per multi-authored paper is
Finally, our results from the analysis on first and last authors’ affiliations show that, in principle, weighing authors’ contributions is an intuition that can provide different keys to interpret data. Other studies dealing with researchers’ seniority, for example, take into account the volume of publications produced by a single author throughout a sliding window of W years [34], or the number of consecutive years of research activity [17]. We intend to further investigate these techniques and further test our intuition in order to understand its applicability in other disciplines and extend the approach by including other metrics.
In conclusion, we advocate openness and transparency for research literature metadata so as to foster reproducibility and evaluation of different approaches within the field of scholarly knowledge analytics [19]. It is detrimental to this research to segregate information about venues, papers, authorships and much more in data silos hard (or almost impossible) to access and integrate. Datasets like SciGraph are a bless for researchers working in this field and such initiatives should be praised and set an example. Moreover, new best practices for declaring unambiguous authors’ affiliations should be devised in order to facilitate the work of researchers working with scholarly knowledge. Being able to access high quality, fine-grained research literature metadata is the key to enabling large-scale analytics and cross-correlating scholarly knowledge with external datasets with the aim to get a better and more thorough insight in the existing global dynamics prevailing in academic research.
Notes
1 Springer Nature SciGraph, https://www.springernature.com/gp/researchers/scigraph.
2 Mapping Scientific Excellence, www.excellencemapping.net.
3 Scopus, https://www.scopus.com.
4 Web of Science, https://clarivate.com/products/web-of-science.
5 Microsoft Academic, https://academic.microsoft.com. Disclaimer: we have an ongoing collaboration with Microsoft Academic, but the dataset has not been considered for this analysis according to the aforementioned reasons. We consider to integrate it in the future for the creation of dashboards and sense making tools.
6 Semantic Scholar, https://www.semanticscholar.org.
7 Crossref, https://www.crossref.org.
8 Crossref Metadata API JSON Format, https://github.com/Crossref/rest-api-doc/blob/master/api_format.md.
9 SciGraph datasets, http://scigraph.springernature.com/explorer/downloads/.
10 GRID, https://www.grid.ac.
11 As per the last available version at the time of writing, dated November 2017.
12 GRID dataset, https://www.grid.ac/downloads.
13 GraphDB, http://graphdb.ontotext.com.
14 This number may vary because the GRID database is actively maintained and enriched over time.
15 SPARQL extraction query, https://github.com/andremann/SAVE-SD-2018ext/blob/master/src/extract.sparql.
16 TPDL conference series on SpringerLink, https://link.springer.com/conference/tpdl.
17 Jupiter notebook, https://ipython.org/notebook.html.
18 Pandas library, https://pandas.pydata.org.
19 Code and datasets, https://github.com/andremann/SAVE-SD-2018ext.
20 Zenodo snapshot, https://zenodo.org/record/2583139.
21 Interactive Jupiter notebook and figures, https://nbviewer.jupyter.org/github/andremann/SAVE-SD-2018ext/blob/master/Geographical-trends-in-research-Analysis.ipynb.
22 The data, sorted from the largest to the lowest number of publications, may be represented by a power law function of the type
23 EasyChair conference management system, http://easychair.org.
24 ConfTool conference & event management software, http://www.conftool.net.
26 Travel ban list, https://edition.cnn.com/2017/01/29/politics/trump-travel-ban-countries/index.html.
Acknowledgements
We would like to thank Dr. Michele Pasin and the SciGraph team, whose work and prompt response made this study possible. SciGraph is actively maintained and, currently, a new major update is on the way and will be released in 2019.
References
[1] | P. Albarrán, J.A. Crespo, I. Ortuño and J. Ruiz-Castillo, The skewness of science in 219 sub-fields and a number of aggregates, Scientometrics 88: (2) ((2011) ), 385–397. doi:10.1007/s11192-011-0407-9. |
[2] | K. Börner and S. Penumarthy and M. Meiss and W. Ke, Mapping the diffusion of scholarly knowledge among major US research institutions, Scientometrics 68: (3) ((2006) ), 415–426. url: https://pdfs.semanticscholar.org/d438/6443e8cadfcae83ae69a4ec036d47def5c7d.pdf. doi:10.1007/s11192-006-0120-2. |
[3] | L. Bornmann and R. Mutz, Growth rates of modern science: A bibliometric analysis based on the number of publications and cited references, Journal of the Association for Information Science and Technology 66: (11) ((2015) ), 2215–2222. doi:10.1002/asi.23329. |
[4] | L. Bornmann, M. Stefaner, F. de Moya Anegón and R. Mutz, What is the effect of country-specific characteristics on the research performance of scientific institutions? Using multi-level statistical models to rank and map universities and research-focused institutions worldwide, Journal of Informetrics 8: (3) ((2014) ), 581–593. doi:10.1016/j.joi.2014.04.008. |
[5] | L. Bornmann and L. Waltman, The detection of “hot regions” in the geography of science – A visualization approach by using density maps, Journal of informetrics 5: (4) ((2011) ), 547–553. doi:10.1016/j.joi.2011.04.006. |
[6] | R. Carvalho and M. Batty, The geography of scientific productivity: Scaling in US computer science, Journal of Statistical Mechanics: Theory and Experiment 10: ((2006) ). ISBN 1742-5468. doi:10.1088/1742-5468/2006/10/P10012. |
[7] | G. Csomós, A spatial scientometric analysis of the publication output of cities worldwide, Journal of Informetrics 12: (2) ((2018) ), 547–566. doi:10.1016/j.joi.2018.05.003. |
[8] | L. Egghe, Power Laws in the Information Production Process: Lotkaian Informetrics, Emerald Group Publishing Limited, (2005) . ISBN 978-0-12-088753-8. doi:10.1108/S1876-0562(2005)05. |
[9] | M. Eisend and S. Schmidt, The influence of knowledge-based resources and business scholars’ internationalization strategies on research performance, Research Policy 43: (1) ((2014) ), 48–59. doi:10.1016/j.respol.2013.07.011. |
[10] | M.E. Falagas, A.I. Karavasiou and I.A. Bliziotis, A bibliometric analysis of global trends of research productivity in tropical medicine, Acta tropica 99: (2–3) ((2006) ), 155–159. doi:10.1016/j.actatropica.2006.07.011. |
[11] | M.E. Falagas, A.S. Michalopoulos, I.A. Bliziotis and E.S. Soteriades, A bibliometric analysis by geographic area of published research in several biomedical fields, 1995–2003, Canadian Medical Association Journal 175: (11) ((2006) ), 1389–1390. doi:10.1503/cmaj.060361. |
[12] | K. Frenken, S. Hardeman and J. Hoekman, Spatial scientometrics: Towards a cumulative research program, Journal of Informetrics 3: (3) ((2009) ), 222–232. ISBN 1751-1577. doi:10.1016/j.joi.2009.03.005. |
[13] | K. Frenken and J. Hoekman, Spatial scientometrics and scholarly impact: A review of recent studies, tools, and methods, in: Measuring Scholarly Impact, Springer, (2014) , pp. 127–146. doi:10.1007/978-3-319-10377-8_6. |
[14] | Z.-L. He, International collaboration does not have greater epistemic authority, Journal of the American Society for Information Science and Technology 60: (10) ((2009) ), 2151–2164. doi:10.1002/asi.21150. |
[15] | M.-H. Huang, H.-W. Chang and D.-Z. Chen, The trend of concentration in scientific research and technological innovation: A reduction of the predominant role of the US in world research & technology, Journal of Informetrics 6: (4) ((2012) ), 457–468. doi:10.1016/j.joi.2012.03.003. |
[16] | J. Hung, Trends of e-learning research from 2000 to 2008: Use of text mining and bibliometrics, British Journal of Educational Technology 43: (1) ((2012) ), 5–16. doi:10.1111/j.1467-8535.2010.01144.x. |
[17] | M. Jadidi, F. Karimi, H. Lietz and C. Wagner, Gender disparities in science? Dropout, productivity, collaborations and success of male and female computer scientists, Advances in Complex Systems ((2017) ), 1750011. doi:10.1142/S0219525917500114. |
[18] | D.A. King, The scientific impact of nations, Nature, 430: ((2004) ), 311–316, ISSN 1476-4687. doi:10.1038/430311a. |
[19] | S. La Bruzzo, P. Manghi and A. Mannocci, OpenAIRE’s DOIBoost – Boosting Crossref for research, in: Digital Libraries: Supporting Open Science (IRCDL 2019), Springer, Cham, (2019) , pp. 133–143. doi:10.1007/978-3-030-11226-4_11. |
[20] | M. Ley, DBLP: Some lessons learned, Proceedings of the VLDB Endowment 2: (2) ((2009) ), 1493–1500. doi:10.14778/1687553.1687577. |
[21] | A. Mannocci, F. Osborne and E. Motta, Geographical trends in research: A preliminary analysis on authors’ affiliations, in: Semantics, Analytics, Visualization: Enhancing Scholarly Dissemination (SAVE-SD), Springer, Cham, (2018) , pp. 61–77. doi:10.1007/978-3-030-01379-0_5. |
[22] | R.M. May, The scientific wealth of nations, Science 275: (5301) ((1997) ), 793–796. ISBN 0036-8075. doi:10.1126/science.275.5301.793. |
[23] | S. Mishra, B.D. Fegley, J. Diesner and V.I. Torvik, Self-citation is the hallmark of productive authors, of any gender, PLoS ONE ((2018) ). doi:10.1371/journal.pone.0195773. |
[24] | L. Morello, S. Reardon and Others, Scientists struggle with Trump immigration ban, Nature 542: (7639) ((2017) ), 13–14. doi:10.1038/nature.2017.21389. |
[25] | R.K. Pan, K. Kaski and S. Fortunato, World citation and collaboration networks: Uncovering the role of geography in science, Scientific Reports 2: ((2012) ). ISBN 2045-2322 (Electronic)∖2045-2322 (Linking). doi:10.1038/srep00902. |
[26] | V. Pareto, Manual of political economy: A variorum translation and critical edition, Oxford University Press UK (2014). ISBN 9780199607952. |
[27] | K. Pearson, Mathematical contributions to the theory of evolution. III. Regression, heredity, and panmixia, Philosophical Transactions of the Royal Society of London. Series A, containing papers of a mathematical or physical character 187: ((1896) ), 253–318. doi:10.1098/rsta.1896.0007. |
[28] | A.M. Petersen, S. Fortunato, R.K. Pan, K. Kaski, O. Penner, A. Rungi, M. Riccaboni, H.E. Stanley and F. Pammolli, Reputation and impact in academic careers, Proceedings of the National Academy of Sciences 111: (43) ((2014) ), 15316–15321. doi:10.1073/pnas.1323111111. |
[29] | E. Sarigöl, R. Pfitzner, I. Scholtes, A. Garas and F. Schweitzer, Predicting scientific success based on coauthorship networks, EPJ Data Science 3: (1) ((2014) ), 9. doi:10.1140/epjds/s13688-014-0009-x. |
[30] | S.-C.J. Sin, International coauthorship and citation impact: A bibliometric study of six LIS journals, 1980–2008, Journal of the American Society for Information Science and Technology 62: (9) ((2011) ), 1770–1783. doi:10.1002/asi.21572. |
[31] | C. Spearman, The proof and measurement of association between two things, The American journal of psychology 15: (1) ((1904) ), 72–101. doi:10.2307/1412159. |
[32] | M. Thelwall, Do females create higher impact research? Scopus citations and Mendeley readers for articles from five countries, Journal of Informetrics 12: (4) ((2018) ), 1–18. doi:10.1016/j.joi.2018.08.005. |
[33] | M. Thelwall, S. Haustein, V. Larivière and C.R. Sugimoto, Do altmetrics work? Twitter and ten other social web services, PloS one 8: (5) ((2013) ), e64841. doi:10.1371/journal.pone.0064841. |
[34] | F.T. Verleysen and A. Weeren, Clustering by publication patterns of senior authors in the social sciences and humanities, Journal of Informetrics 10: (1) ((2016) ), 254–272. doi:10.1016/j.joi.2016.01.004. |
[35] | M.D. Wilkinson, M. Dumontier, I.J. Aalbersberg, G. Appleton, M. Axton, A. Baak, N. Blomberg, J.-W. Boiten, L.B. da Silva Santos, P.E. Bourne and Others, The FAIR guiding principles for scientific data management and stewardship, Scientific data 3: ((2016) ). doi:10.1038/sdata.2016.18. |
[36] | T.S. Woodson, Research inequality in nanomedicine, Journal of Business Chemistry 9: (3) ((2012) ), 133–146. url: https://www.businesschemistry.org/downloads/issues/Issue10-2012.pdf#page=21. |
[37] | A. Zeng, Z. Shen, J. Zhou, J. Wu, Y. Fan, Y. Wang and H.E. Stanley, The science of science: From the perspective of complex systems, Physics Reports 714–715: ((2017) ), 1–73. doi:10.1016/j.physrep.2017.10.001. |
[38] | P. Zhou and L. Leydesdorff, The emergence of China as a leading nation in science, Research policy 35: (1) ((2006) ), 83–104. doi:10.1016/j.respol.2005.08.006. |


