
Identification of DNA methylation-regulated WEE1 with potential implications in prognosis and immunotherapy for low-grade glioma
Abstract
BACKGROUND:
WEE1 is a critical kinase in the DNA damage response pathway and has been shown to be effective in treating serous uterine cancer. However, its role in gliomas, specifically low-grade glioma (LGG), remains unclear. The impact of DNA methylation on WEE1 expression and its correlation with the immune landscape in gliomas also need further investigation.
METHODS:
This study used data from The Cancer Genome Atlas (TCGA), Chinese Glioma Genome Atlas (CGGA), and Gene Expression Omnibus (GEO) and utilized various bioinformatics tools to analyze gene expression, survival, gene correlation, immune score, immune infiltration, genomic alterations, tumor mutation burden, microsatellite instability, clinical characteristics of glioma patients, WEE1 DNA methylation, prognostic analysis, single-cell gene expression distribution in glioma tissue samples, and immunotherapy response prediction based on WEE1 expression.
RESULTS:
WEE1 was upregulated in LGG and glioblastoma (GBM), but it had a more significant prognostic impact in LGG compared to other cancers. High WEE1 expression was associated with poorer prognosis in LGG, particularly when combined with wild-type IDH. The WEE1 inhibitor MK-1775 effectively inhibited the proliferation and migration of LGG cell lines, which were more sensitive to WEE1 inhibition. DNA methylation negatively regulated WEE1, and high DNA hypermethylation of WEE1 was associated with better prognosis in LGG than in GBM. Combining WEE1 inhibition and DNA methyltransferase inhibition showed a synergistic effect. Additionally, downregulation of WEE1 had favorable predictive value in immunotherapy response. Co-expression network analysis identified key genes involved in WEE1-mediated regulation of immune landscape, differentiation, and metastasis in LGG.
CONCLUSION:
Our study shows that WEE1 is a promising indicator for targeted therapy and prognosis evaluation. Notably, significant differences were observed in the role of WEE1 between LGG and GBM. Further investigation into WEE1 inhibition, either in combination with DNA methyltransferase inhibition or immunotherapy, is warranted in the context of LGG.
1.Introduction
Diffuse glioma is highly malignant, accounting for about 80% of malignant brain tumors and are classified into astrocytoma, oligodendroglioma, and GBM on the basis of histological criteria (WHO Grade II-IV) [1, 2]. Chinese Glioma Genome Atlas (CGGA) and The Cancer Genome Atlas (TCGA) databases consider gliomas of grade II-III as LGG, and refer grade IV gliomas as GBM [3]. Patients with IDH-mutant LGG often have a good prognosis after surgical resection and chemoradiotherapy, usually with a median survival more than 10 years, whereas the median survival of patients with IDH-wildtype LGG is typically less than 5 years [4]. Due to the highly aggressive characteristic of some LGG and the inability to be completely removed, residual tumors are susceptible to relapse and malignant progression to GBM which represents one of the deadliest and most relapsed-prone solid tumors and accounts for 57% of all gliomas with a median survival under 2 years [5, 6]. A few diagnostic/prognostic biomarkers (e.g., mutation status of IDH/ATRX/TP53, the methylation of MGMT promoter, and 1p/19q codeletion status) have been currently identified for LGG [7, 8], but most of them display limited potency. In addition, effective medical treatment for LGG remains lacking, as LGG with wildtype IDH are more malignant with limited response to adjuvant therapies [5, 9]. Thus, more valuable biomarkers and new efficient pharmacotherapies are still needed for evaluating the prognostic outcomes and treating patients with LGG.
When DNA replication is complete, the DDR pathway regulates cell entry into mitosis and delays the initiation of mitosis in the presence of DNA damage. The DDR pathway is strictly regulated to prevents cells from suffering different kinds of DNA damage. In gliomas, oncogenes and tumor suppressors (e.g., TP53, RB1, ATRX) correlated with replication stress are usually changed [1, 2], and DDR components (e.g., CHK1, WEE1, PARP, ATM) are frequently overexpressed [10, 11, 12, 13]. Inspiringly, ATM and PARP inhibitors have been shown to cross the blood-brain barrier [14, 15] and are being studied as therapeutic options for numerous cancer entities in several clinical trials, implying broad prospects of DDR-related inhibitors in cancer treatment.
WEE1, an important G2/M checkpoint kinase that regulates cell cycle progression mainly through phosphorylation and inhibition of CDK1 [16]. A number of reports have shown that inhibition of WEE1 could sensitize multiple tumors (e.g., osteosarcoma, ovarian and colon cancers) to DNA damage induced by radiation or topoisomerase inhibition [17]. AZD1775, a potential WEE1 inhibitor, has been tested in clinical studies in multiple diseases, including GBM. It has been reported that WEE1 expression is upregulated in pediatric high-grade glioma [18], GBM [10, 19] and diffuse intrinsic pontine glioma (DIPG) [20], and activating WEE1 makes GBM resistant to PI3K inhibitors [21]. It is worth noting that WEE1 inhibition can enhance the radiotherapy effect on GBM, wherase the monotherapy of WEE1 inhibition has no obvious inhibition effect on GBM [10] or DIPG, as shown by previous studies [20]. Nevertheless, the role and targeting value of WEE1 in LGG are still unknown.
In this study, we compared the difference of WEE1 between LGG and GBM in many aspects, including WEE1 expression, diagnostic/prognostic value and methylation regulation, as well as the correlation with genomic changes and immune infiltration. Our results revealeded that WEE1 was associated with prognosis of LGG but not GBM, and WEE1 had better diagnostic value, and was positively correlated with immune infiltration in LGG. Moreover, WEE1 was negatively regulated by DNA methylation, and WEE1 DNA methylation level was positively correlated with prognosis of LGG patients and was negatively correlated with immune infiltration. Taken together, our results indicate that WEE1 may be a better prognostic predictor and a potential target for LGG rather than GBM.
2.Materials and methods
2.1Cell culture
LGG cell line SW1088 (grade III) and GBM cell line U251 (grade IV) were obtained from American Type Culture Collection (ATCC). Both of them were grown in high-glucose DMEM medium (China, Procell, PM150210) with 10% fetal bovine serum (China, Procell, 164210) and 1% antibiotic/antimycotic (China, Procell, PB180120) and were cultured at 37∘C in a 5% CO2 humidified atmosphere.
2.2Reagents and antibodies
MK-1775 (USA, Selleck, S1525), 5-Azacytidine (USA, Selleck, S1782) and temozolomide (USA, Selleck, S1237) were dissolved in DMSO and stored at
2.3Protein extraction and western blotting
Total proteins from glioma cells were extracted using RIPA buffer (China, Beyotime Biotechnology, P0013B) and separated by electrophoresis on 10% SDS-PAGE gels. The proteins were then transferred to polyvinylidene difluoride membranes (USA, Milipore, IPVH00010), blocked with 5% skimmed milk, and incubated overnight at 4∘C with specific primary antibodies. After incubation with HRP-conjugated secondary antibodies, protein signals were detected by chemiluminescence reagent (China, Beyotime Biotechnology, ECL) using high sensitivity chemiluminescence imaging system (China, Tanon 5200) and quantitatively analyzed using its associated analytical software.
2.4Cell viability analysis
To assess cell viability, the CCK-8 assay was performed. Specifically, 3
2.5Wound healing assay
2
2.6The criteria for the inclusion and exclusion of patients
The patient cohort selected from the bioinformatics databases was obtained based on specific criteria to ensure representativeness and minimize selection bias. Our inclusion/exclusion criteria were carefully defined to maintain consistency across the cohort. To ensure representativeness, we selected patients with glioma based on standardized diagnostic criteria, such as tumor grade and survival time. To explore differences of WEE1 expression between tumor grades, all patients without tumor grades or WEE1 expression were excluded. To explore differences of survival time between low- and high-WEE1 groups, all patients without survival time or WEE1 expression were excluded. We also considered clinical factors such as IDH mutation, 1p/19q codeletion, WEE1 mutation and WEE1 methylation levels to clarify what we needed to address.
2.7Analysis of WEE1 expression
WEE1 expression and clinical information of patients with LGG or GBM from CGGA [3], TCGA (https://portal.gdc.cancer.gov/), and GEO (https://www.ncbi.nlm.nih.gov/geo/) databases were obtained and analyzed by SangerBox bioinformatics tool (http://sangerbox.com/), CGGA analysis tool (http://www.cgga.org.cn/analyse/RNA-data.jsp) and the R2 Genomics Platform (https://hgserver1.amc.nl/cgi-bin/r2/main.cgi), respectively. Further, WEE1 expression was analyzed based on tumor stage, IDH mutation status, 1p/19q codeletion status, putative copy-number alterations, molecular and immune subtypes, respectively.
2.8Prognostic and diagnostic analysis
An analysis of gene expression and prognosis for all cancers was performed using SangerBox bioinformatics tool. GEPIA bioinformatics tool [22] was used to perform overall survival (OS) and disease free survival (DFS) analysis in LGG or GBM from TCGA database based on WEE1 expression. Xiantao bioinformatics tool (https://www.xiantao.love/) was utilized to conduct disease special survival (DSS) progression free interval (PFI) and diagnostic analysis (ROC curves) on patients with LGG or GBM from TCGA database. Statistical analysis and visualization of survival data were carried out through “survival” and “survminer” packages of R software (version: 3.6.3), respectively. ROC curves analysis was performed using “pROC” or “timeROC” package and visualized using “ggplot2” package. An analysis of OS in LGG and GBM patients from three datasets of the CGGA database was conducted using WEE1 expression, IDH mutations, and 1p/19q codeletion status. OS of patients with LGG or GBM from three datasets of GEO database was analyzed based on WEE1 expression. We divided the samples into low- and high-WEE1 groups base on the median expression of WEE1.
2.9Immune infiltration analysis and WEE1 expression
A relationship between the expression of WEE1 and immune score (proportion of immune ingredient), stromal score (proportion of stromal component) and estimate score (sum of the above two scores) on LGG or GBM patients from TCGA database was analyzed by the R packages “estimate” and “psych” using SangerBox bioinformatics tool. An analysis of the spearman correlation between WEE1 expression and abundance of tumor-infiltrating lymphocytes (TILs) in LGG and GBM from TCGA database was conducted using R-4.2.2 or TISIDB bioinformatics tool [23]. Gene expression profiles were used to infer the relative abundance of TILs using single-sample gene set enrichment analysis (ssGSEA), which is based on the gene set variation analysis (GSVA) package [24]. The correlation between WEE1 expression and immune infiltration based on sincorBatch and pancorBatch analysis was performed by GTBA bioinformatics tool (http://guotosky.vip:13838/GTBA/). SincorBatch was used to analyze genes associated with the input gene in a single cancer, while pancorBatch was used to analyze genes associated with the input gene in pan-cancers. The spearman correlation between WEE1 and markers of immune cells in LGG and GBM from TCGA database was analyzed by GEPIA bioinformatics tool.
3.DNA methylation and immune infiltration analysis
MEXPRESS bioinformatics tool [25] was used to analyzed and visualized the pearson correlation between WEE1 expression and its DNA methylation level in LGG and GBM from TCGA database. The spearman correlation between WEE1 DNA methylation level and TILs abundance in LGG and GBM from TCGA database was analyzed using TISIDB bioinformatics tool.
3.1DNA methylation and prognosis analysis
OS analysis of patients with LGG or GBM from TCGA database was performed using MethSurv bioinformatics tool [26] based on DNA methylation level of WEE1 at different sites. OS of patients with LGG or GBM from the Methyl_159 dataset of CGGA database was analyzed based on WEE1 DNA methylation level. A median value of DNA methylation level of WEE1 was utilized to divide the samples into two groups.
3.2WEE1 genomic alterations
We explored WEE1 genomic alterations using cBioPortal bioinformatics tool [27, 28] in LGG and GBM from TCGA database. The alteration frequency was counted. WEE1 expression in different types of genomic alterations were investigated.
3.3The relationship between genomic variation or common genetic mutations and WEE1 expression
Tumor mutational burden (TMB) and microsatellite instability (MSI) data of patients with LGG or GBM from TCGA database were obtained by using Assistant for Clinical Bioinformatics (https://www.aclbi.com). Spearman correlation between WEE1 expression and TMB or MSI was analyzed using GraphPad Prism 7.04 software. Correlation between WEE1 expression and common genetic mutations was performed using SangerBox bioinformatics tool.
3.4The relationship between clinical characteristics and gene expression
The relationship between different clinical characteristics and WEE1 expression in LGG and GBM from TCGA database was analyzed with Xiantao bioinformatics tool. The statistical significance was tested by Fisher exact test or Chi-square test.
3.5Single-cell RNA sequencing analysis
Twelve single cell datasets of primary gliomas without treatment were collected in Tumor Immune Single-cell Hub (TISCH) [29]. WEE1 expression in malignant cells, immune cells, stromal cells and others was analyzed and compared. Quality control, clustering and cell-type annotation are carried out in turn by using a uniform analysis pipeline – MAESTRO. The cell-type annotation was curated at the level of malignancy, major-lineage and minor-lineage after streamlined processing. Dimension reduction, KNN, and Louvain algorithm were performed by Principal component analysis (PCA) for clusters recognition. Further reduction of dimension and visualization of the clustering results were performed by Uniform manifold approximation and projection (UMAP). For identification of the clusters of malignant cells, the three combined methods refer to the previous description [30, 32].
3.6Immunotherapy response prediction
WEE1 expression was analyzed across mouse tumor cell lines after treatment of different cytokines and tumor tissues derived from transplanted mouse tumor cells after ICB (immune checkpoint blockade) treatment in TISMO database [33]. WEE1 expression was also analyzed in response patients or non-response patients after ICB therapy in ICBatlas database [34]. According to Response Evaluation Criteria in Solid Tumors (RECIST) v1.1, response or not was determined. responders (Res) included partial response (PR) and complete response (CR), while non-responders (Non-res) included stable disease (SD) and progressive disease (PD). Mouse tumor cell lines included are: 4T1 (Mammary cancer); LLC (Lung carcinoma); B16 (Melanoma); MOC1 (Head and neck squamous cell carcinoma); KPC (Pancreatic ductal adenocarcinoma). Mouse tumor models included were: 4T1, T11 and KPB25L (mammary cancer); CT26 (colorectal carcinoma); YTN16 (gastric adenocarcinoma); LLC (lung carcinoma); B16 (melanoma). human tumor models inclued are: NSCLC (Non-small cell lung cancer); gastric adenocarcinoma; RCC (renal cell carcinoma).
3.7Statistical analysis
The bioinformatics tools mentioned above were used, as well as version 7.0.4 of GraphPad Prism, to perform statistical analyses. The presented data in this study represent the mean
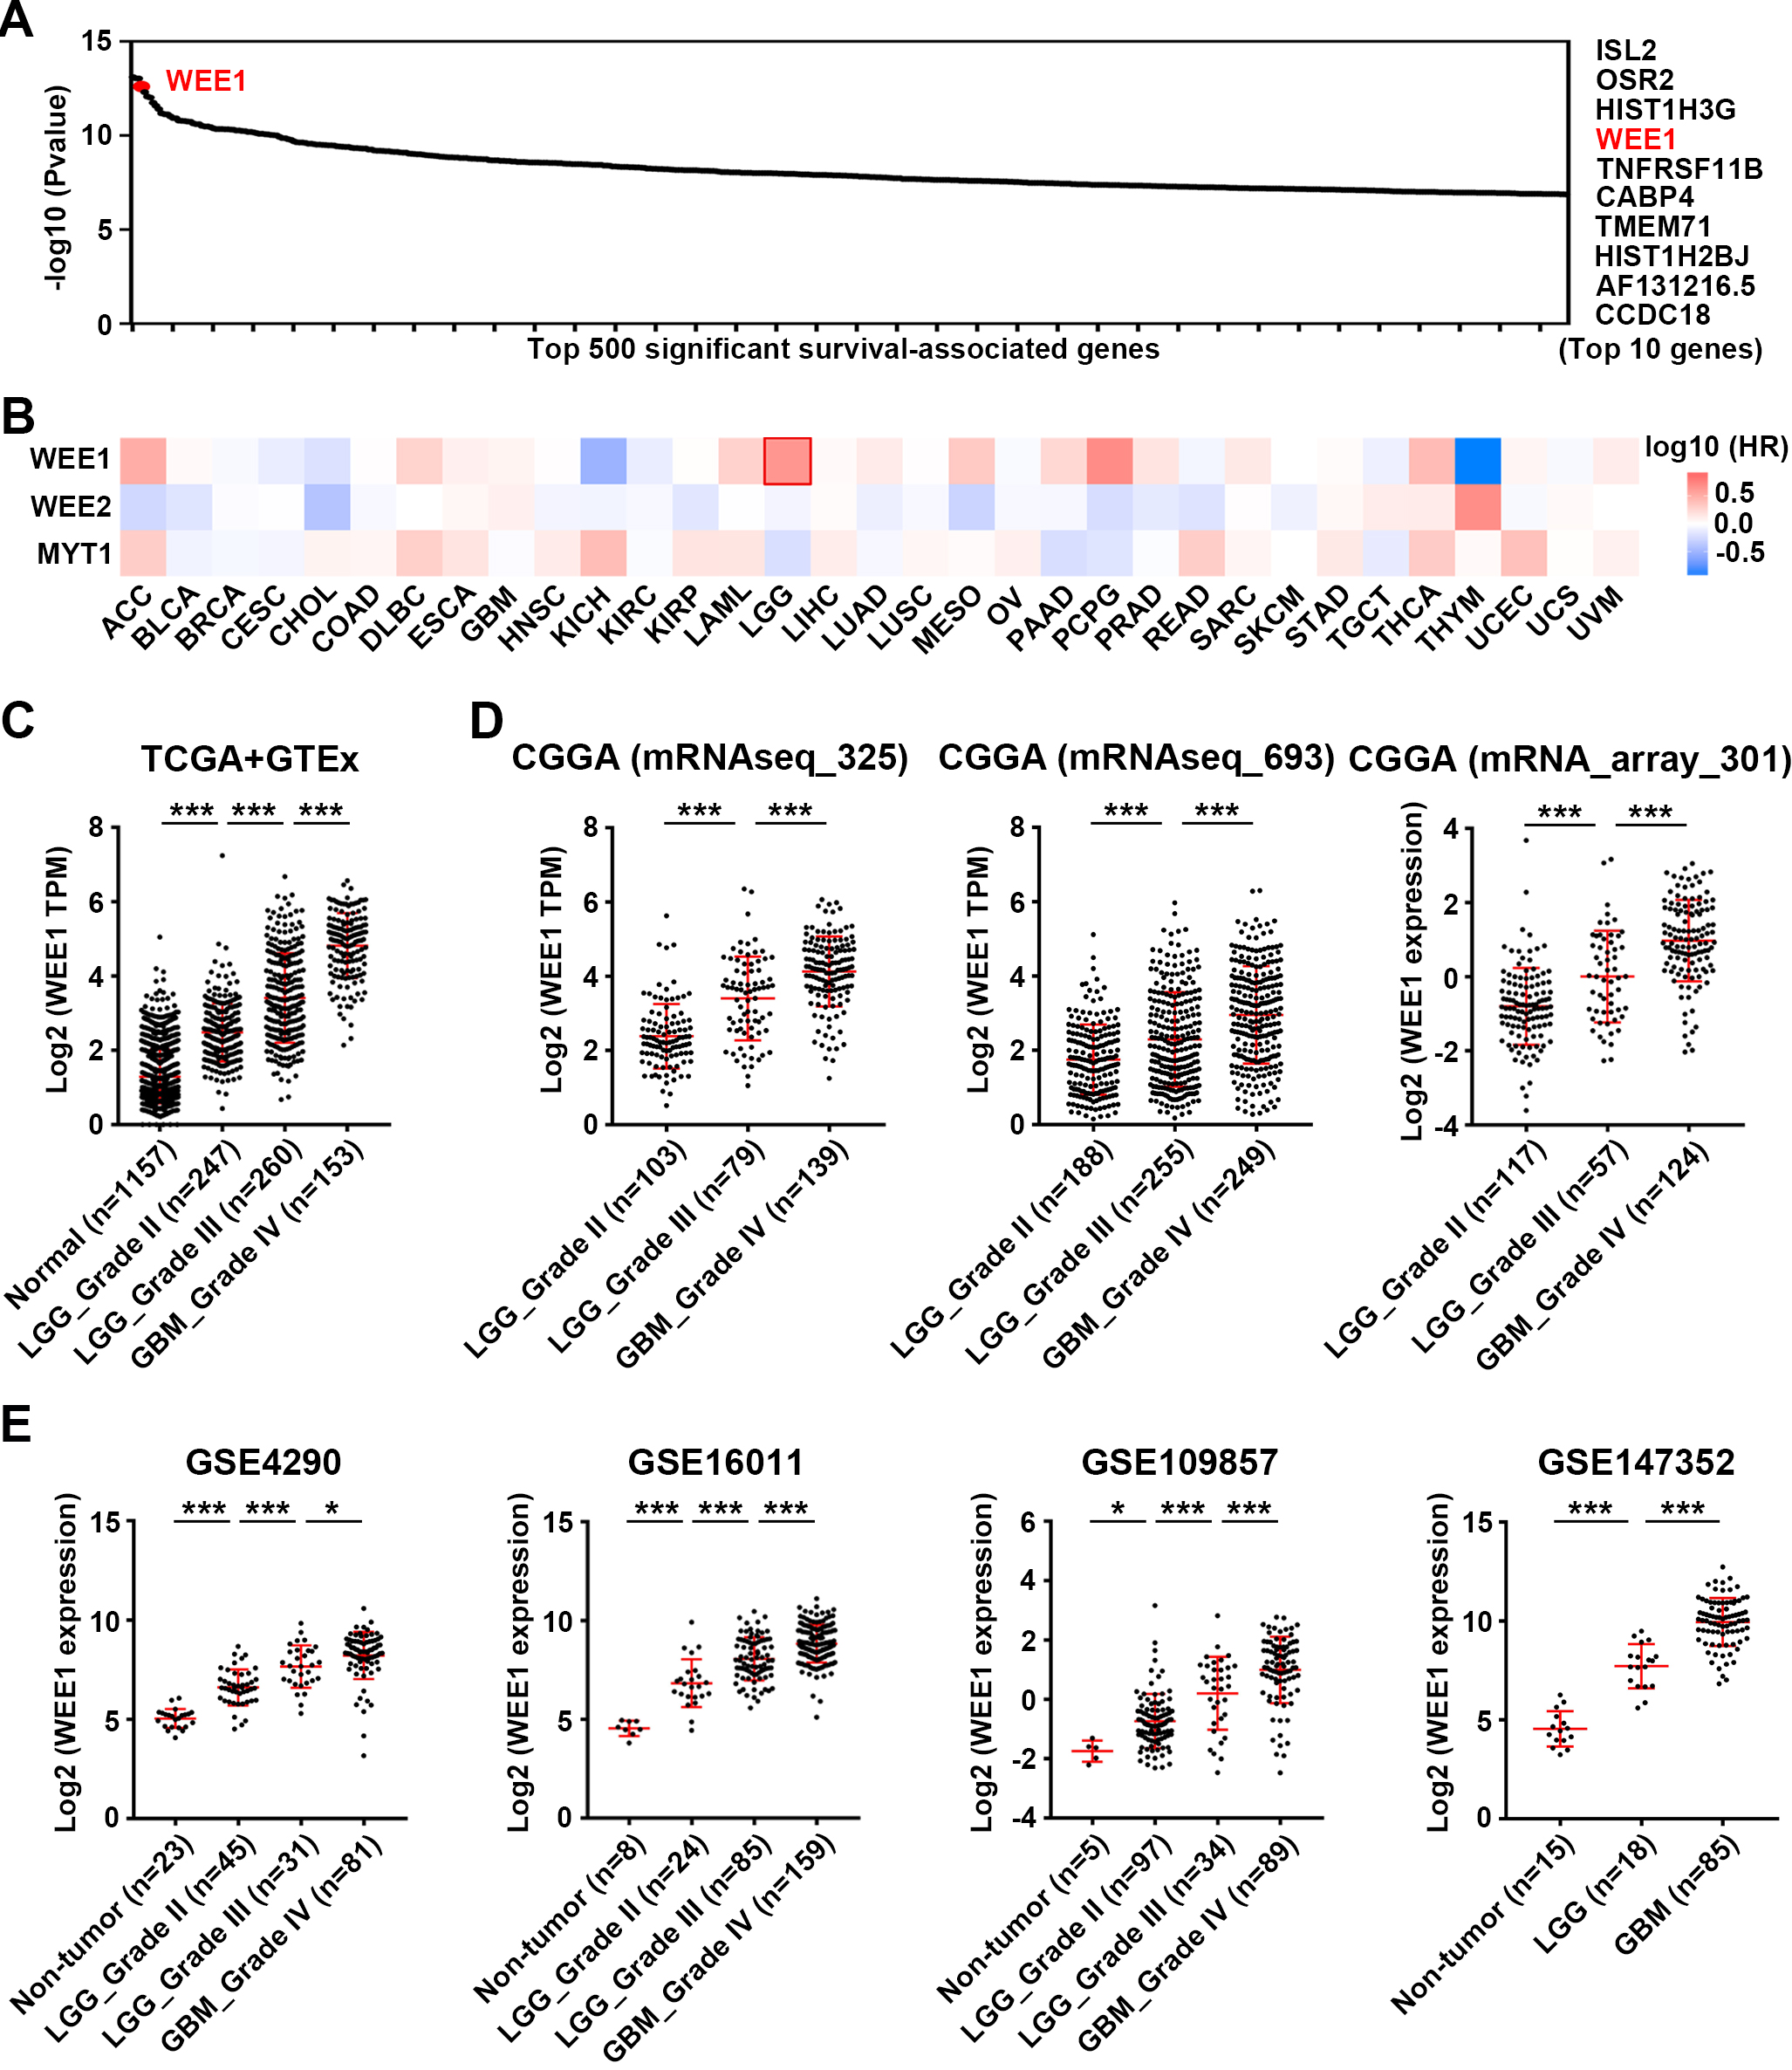
Figure 1.
Analysis of WEE1 expression in gliomas and its correlation with patient prognosis in multiple cancer types. (A) Analysis of top 500 significant survival-associated genes in LGG from TCGA database. (B) Pan-cancer survival analysis of WEE1 family members in TCGA database. Mantel-Cox test was performed. (C) The expression of WEE1 in two types of gliomas (LGG and GBM) and normal brain tissue in TCGA and GTEx database. (D–E) WEE1 expression in LGG and GBM from three datasets of CGGA database (D) and four datasets of GEO database (E). Data are shown as mean
4.Results
4.1WEE1 expression is upregulated in both LGG and GBM, but it is more relevant to the prognosis of LGG patients
We firstly focused on biomarkers with the top prognostic value in LGG and found WEE1 to be one of them (Fig. 1A). Pan-cancer analysis based on TCGA database showed that WEE1 was most significantly associated with OS of patients in LGG compared with other cancers (Fig. S1). WEE2 and MYT1, the other two members of the WEE1 family, were not associated with the prognosis of LGG patients (Fig. 1B). Consistent with previous studies [10, 19], WEE1 mRNA and protein levels were upregulated in glioma tissues (LGG and GBM) from TCGA, CGGA GEO and HPA databases, compared with normal brain tissues (Figs 1C–E and Fig. S2).
In the TCGA database, high WEE1 expression was significantly related to shorter OS, DFS, DSS and PFI in LGG patients, but not in GBM patients (Fig. S3A). In both LGG and GBM, WEE1 expression showed good diagnostic value in distinguishing tumor from normal samples, but time-dependent receiver operating characteristic (ROC) analysis suggested that WEE1 expression had better diagnostic value at 1-, 2-, 3-, and 5-year OS, DSS, and PFI of LGG patients, compared with GBM patients (Fig. S3B). Moreover, the expression of WEE1 was associated with age, WHO grade, IDH mutation status, 1p/19q codeletion staus, primary therapy outcome, and OS/DSS/PFI event in LGG, but it was only correlated with IDH status in GBM (Table S1). In three datasets of the CGGA database, high WEE1 expression was also significantly associated with shorter OS and DFS of LGG but not GBM patients (Fig. S4A). Time-dependent ROC analysis revealed that WEE1 had better diagnostic value for LGG patients at 1-, 3-, and 5-year OS, DSS, and PFI (Fig. S4B). In GSE16011 dataset from GEO database, WEE1 expression was also correlated with the OS of LGG rather than GBM (Fig. S5).
In summary, these findings imply that WEE1 has better diagnostic and prognostic value in LGG compared to GBM, and that WEE1 may make difference as an oncogene in the development of LGG.
Figure 2.
Prognosis analysis of WEE1 expression according to IDH mutation or 1p/19q codeletion status in LGG. Survival curves were used to analyze OS of patients with LGG from three datasets of CGGA database (Log-rank test). WT, wildtype; Mut, mutant; Codel, codeletion; Non-codel, Non-codeletion.
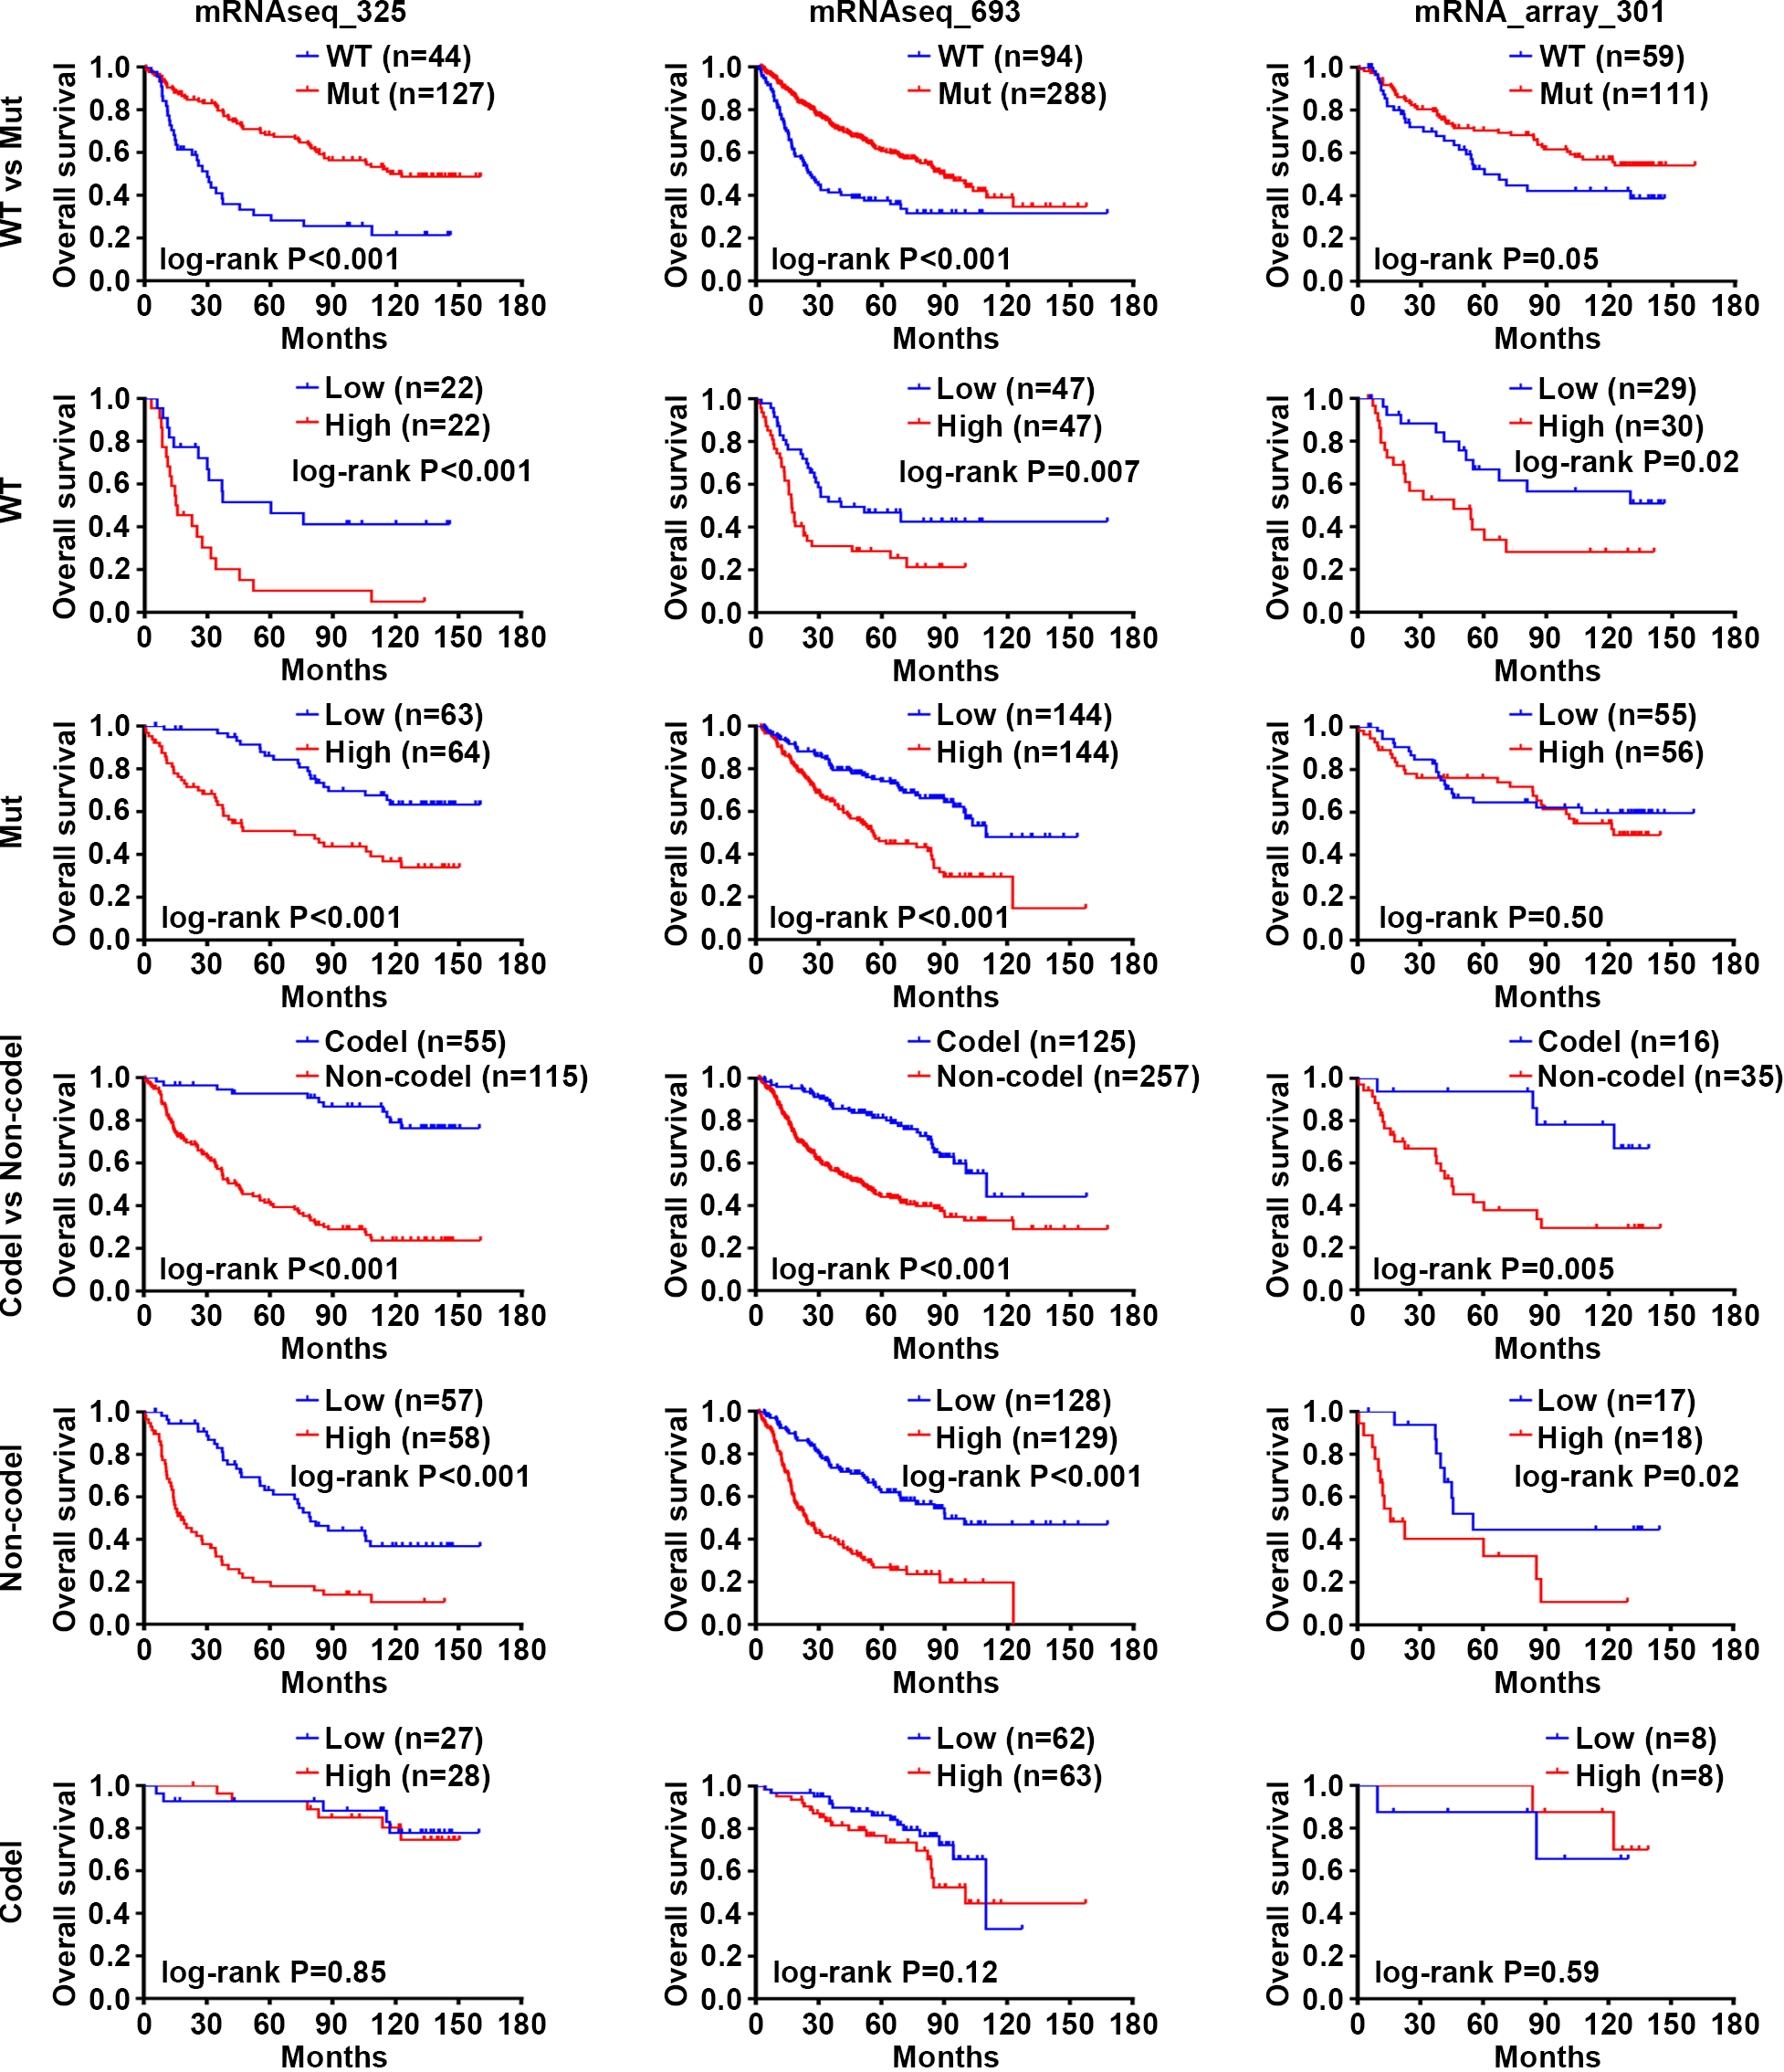
4.2WEE1 is an independent prognostic predictor, and the combination of high WEE1 expression and wild-type IDH predicts worse prognosis of LGG patients
As we know, mutations in IDH and 1p/19q codeletions are key markers of glioma classification [2, 35]. Our results indicated that WEE1 expression was significantly upregulated in LGG and GBM patients identified with wild-type IDH or non-codeletion 1p/19q in the CGGA database (Fig. S6A). Previous studies have found that glioma patients with wild-type IDH tend to have poor prognosis [4, 5], as evidenced by the shorter OS of LGG patients with wild-type IDH in the three CGGA datasets (Fig. 2). To our surprise, WEE1 had predictive value of prognosis in all three groups of LGG patients with wild-type IDH, mutated IDH and noncodeletion 1p/19q, respectively, and high WEE1 expression was associated with shorter OS (Fig. 2), suggesting that WEE1 could be an independent prognostic predictor of LGG. Furthermore, high WEE1 expression and wild-type IDH were combined to predict a shorter median survival time in LGG patients (Fig. S6B). These results suggest that WEE1 is an independent prognostic biomarker, and the combination of high WEE1 expression and wild-type IDH is a more valuable indicator for predicting worse prognosis of LGG patients.
Figure 3.
Analysis of the effects of WEE1 inhibition on proliferation and migration of LGG and GBM cell lines. (A) Confirm the effect of WEE1 inhibitor MK-1775 on WEE1/CDK1 signaling pathway. SW1088 and U251 cell lines were treated with 0.1, 0.2 and 0.4
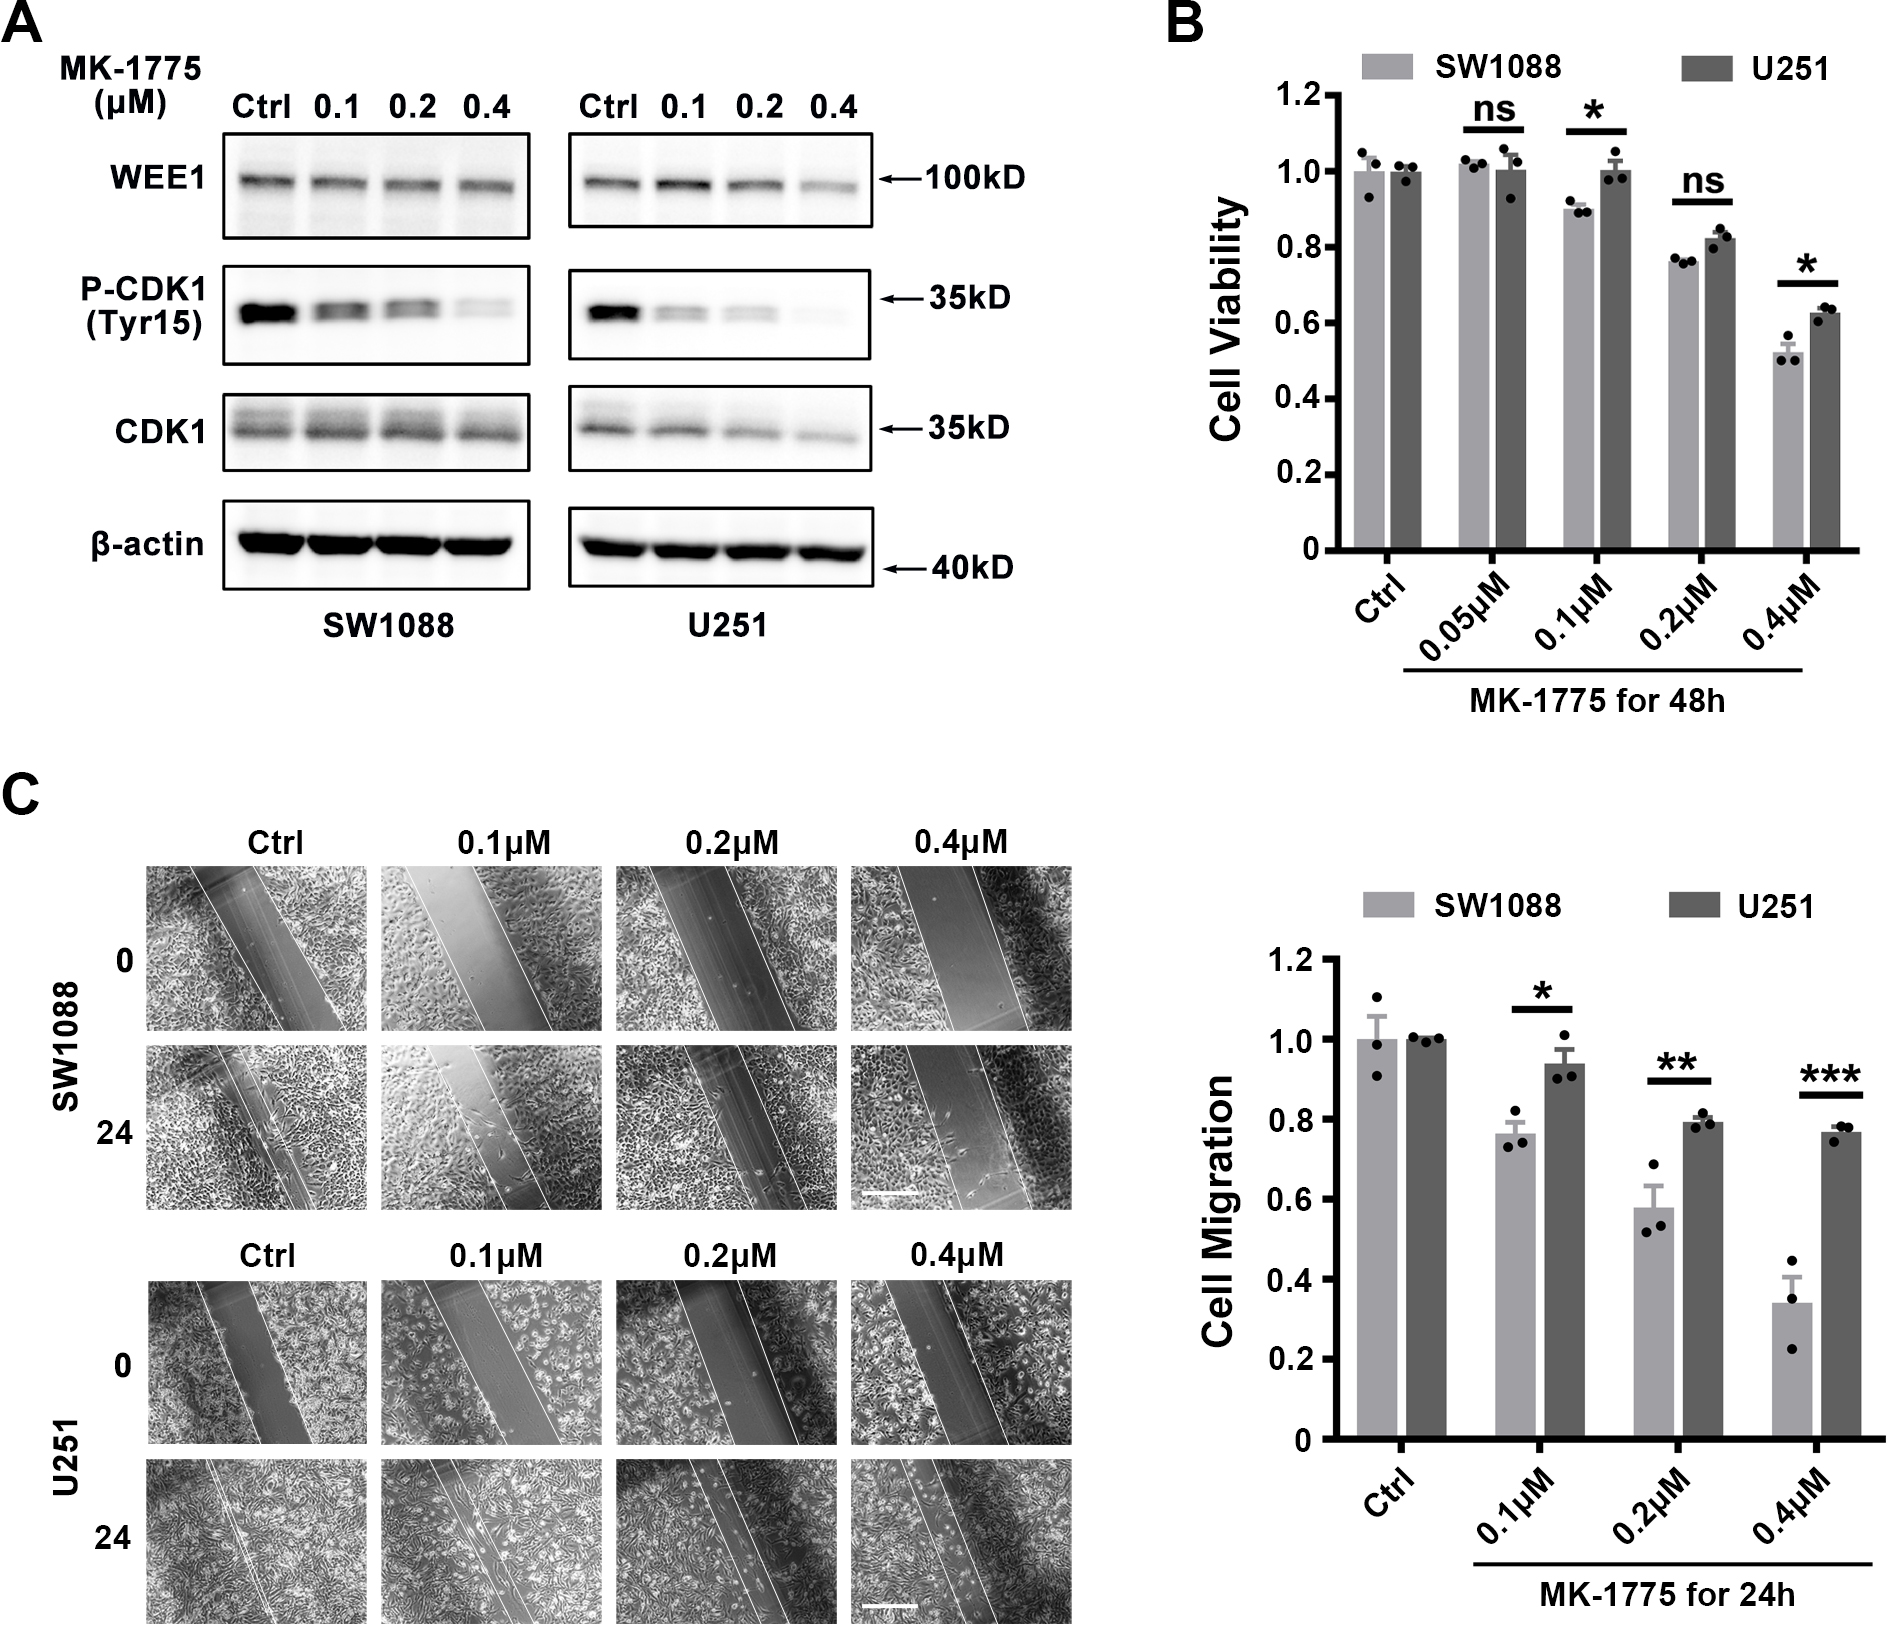
4.3Targeting WEE1 demonstrates a stronger inhibitory effect on proliferation and migration of LGG cell lines than GBM cell lines in vitro
Based on the above results, we hypothesized that LGG cell lines would exhibit higher sensitivity to WEE1 inhibition than GBM cell lines. To verify this, we evaluated the inhibitory effect of WEE1 inhibitor MK-1775 against LGG cell line SW1088 (Grade III) and GBM cell line U251 (Grade IV). MK-1775 significantly inhibited the phosphorylation of CDK1 protein downstream of WEE1, indicating its inhibitory effect on WEE1/CDK1 pathway (Fig. 3A). We subsequently found that MK-1775 inhibited the viability of LGG cell line SW1088 more strongly than GBM cell line U251 (Fig. 3B). Further, we used wound healing experiments to evaluate the effect of MK-1775 on the migration ability of LGG and GBM cell lines, and the results showed that MK-1775 had a stronger inhibitory effect on the migration ability of SW1088 than U251 (Fig. 3C). These results suggest that LGG cell lines are more sensitive to WEE1 inhibition than GBM cell lines.
Table 1
Spearman correlation analysis between levels of WEE1 and markers of immune cells in LGG and GBM from TCGA database
| Description | Gene markers | LGG | GBM | ||
| Cor |
| Cor |
| ||
| CD8+ T cell | CD8A | 0.13 | *** | * | |
| CD8B | 0.12 | * | |||
| T cell (general) | CD3D | 0.26 | *** | *** | |
| CD3E | 0.28 | *** | * | ||
| CD2 | 0.33 | *** | * | ||
| B cell | CD19 | 0.2 | *** | * | |
| CD79A | 0.13 | ** | 0.2 | ||
| Monocyte | CD86 | 0.22 | *** | 0.051 | |
| CD115(CSF1R) | 0.084 | 0.057 | 0.26 | ||
| TAM | CCL2 | 0.14 | ** | 0.59 | |
| CD68 | 0.27 | *** | 0.37 | ||
| IL10 | 0.2 | *** | ** | ||
| M1 Macrophage | INOS (NOS2) | 0.083 | 0.61 | 0.19 | * |
| IRF5 | 0.2 | *** | 0.21 | ||
| COX2(PTGS2) | 0.12 | ** | 0.22 | ** | |
| M2 Macrophage | CD163 | 0.25 | *** | 0.66 | |
| VSIG4 | 0.15 | *** | ** | ||
| MS4A4A | 0.22 | *** | * | ||
| Neutrophils | CD66b(CEACAM8) | 0.029 | 0.51 | 0.016 | 0.84 |
| CD11b (ITGAM) | 0.15 | *** | 0.052 | 0.51 | |
| CCR7 | 0.27 | *** | 0.31 | ||
| Natural killer cell | KIR2DL1 | 0.13 | ** | 0.4 | |
| KIR2DL3 | 0.17 | *** | 0.012 | 0.88 | |
| KIR2DL4 | 0.17 | *** | 0.72 | ||
| KIR3DL1 | 0.14 | ** | 0.52 | ||
| KIR3DL2 | 0.08 | 0.067 | 0.41 | ||
| KIR3DL3 | 0.031 | 0.48 | 0.14 | 0.068 | |
| KIR2DS4 | 0.11 | * | 0.19 | ||
| Dendritic cell | HLA-DPB1 | 0.31 | *** | * | |
| HLA-DQB1 | 0.23 | *** | 0.25 | ||
| HLA-DRA | 0.33 | *** | ** | ||
| HLA-DPA1 | 0.33 | *** | 0.066 | ||
| BDCA-1(CD1C) | 0.13 | ** | 0.69 | ||
| BDCA-4(NRP1) | 0.39 | *** | 0.28 | *** | |
| CD11c(ITGAX) | 0.18 | *** | 0.042 | 0.59 | |
*P < 0.05; **P < 0.01; ***P < 0.001.
Table 2
Spearman correlation analysis between levels of WEE1 and markers of different T cells sutypes in LGG and GBM from TCGA database
| Description | Gene markers | LGG | GBM | ||
|---|---|---|---|---|---|
| Cor |
| Cor |
| ||
| Th1 | TBX21 | 0.37 | *** | 0.0049 | 0.95 |
| STAT1 | 0.46 | *** | 0.31 | *** | |
| STAT4 | 0.27 | 0.14 | |||
| IFNG | 0.16 | *** | 0.24 | ||
| TNF | 0.55 | ** | |||
| IL12A | ** | 0.31 | *** | ||
| IL12B | 0.057 | 0.2 | * | ||
| Th1-like | HAVCR2 | 0.25 | *** | * | |
| IFNG | 0.16 | *** | 0.24 | ||
| CXCR3 | 0.3 | *** | 0.21 | ||
| BHLHE40 | 0.089 | * | 0.46 | *** | |
| CD4 | 0.23 | *** | 0.21 | ||
| Th2 | GATA3 | 0.32 | *** | 0.25 | ** |
| STAT6 | 0.15 | *** | 0.045 | 0.56 | |
| STAT5A | 0.29 | *** | 0.18 | * | |
| IL13 | 0.11 | * | 0.51 | 0.52 | |
| Th17 | STAT3 | 0.53 | *** | 0.54 | *** |
| IL17A | 0.08 | 0.68 | 0.47 | ||
| Tfh | BCL6 | 0.18 | *** | 0.38 | *** |
| IL21 | 0.15 | *** | 0.82 | ||
| Treg | FOXP3 | 0.13 | ** | 0.15 | 0.053 |
| CCR8 | 0.16 | *** | 0.92 | ||
| STAT5B | 0.32 | *** | 0.45 | *** | |
| TGFB1 | 0.21 | *** | 0.079 | 0.32 | |
| Resting Treg | FOXP3 | 0.13 | ** | 0.15 | 0.053 |
| IL2RA | 0.29 | *** | 0.96 | ||
| Effector Treg T-cell | FOXP3 | 0.13 | ** | 0.15 | 0.53 |
| CCR8 | 0.16 | *** | 0.94 | ||
| TNFRSF9 | 0.27 | *** | 0.046 | 0.56 | |
| Effector T-cell | CX3CR1 | 0.058 | 0.19 | 0.3 | |
| FGFBP2 | 0.059 | 0.18 | 0.61 | ||
| FCGR3A | 0.36 | *** | 0.12 | ||
| Naive T-cell | CCR7 | 0.27 | *** | 0.31 | |
| SELL | *** | 0.16 | |||
| Effector memory T-cell | DUSP4 | 0.28 | *** | 0.39 | *** |
| GZMK | 0.28 | *** | * | ||
| GZMA | 0.27 | *** | *** | ||
| Resident memory T-cell | CD69 | 0.32 | *** | 0.05 | |
| CXCR6 | *** | ** | |||
| MYADM | 0.25 | *** | 0.41 | *** | |
| General memory T-cell | CCR7 | 0.27 | *** | 0.31 | |
| SELL | 0.35 | *** | 0.16 | ||
| IL7R | 0.36 | *** | 0.023 | 0.7 | |
| Exhausted T-cell | PDCD1 | 0.3 | *** | 0.34 | |
| CTLA4 | 0.21 | *** | 0.76 | ||
| LAG3 | 0.26 | *** | 0.49 | ||
| HAVCR2 | 0.25 | *** | * | ||
| GZMB | 0.21 | *** | * | ||
| CXCL13 | 0.017 | 0.7 | 0.13 | ||
| LAYN | 0.12 | ** | * | ||
*P < 0.05; **P < 0.01; ***P < 0.001.
Figure 4.
Analysis of WEE1 expression in LGG and GBM in correlation with immune infiltration. (A) Comparison of the infiltration of 28 kinds of immune cells between high and low WEE1 expression subpopulations in TCGA_LGG and TCGA_GBM databases. (B–C) The correlation between the expression of WEE1 and the abundance of immune cells in LGG (B) and GBM (C) from TCGA database. Act CD4, Activated CD4 T cell; Act CD8, Activated CD8 T cell; Act B, Activated B cell; Tgd, Gamma delta T cell; Th1, Type 1 T helper cell; Act DC, Activated dendritic cell; Th2, Type 2 T helper cell; NK, Natural killer cell; MDSC, myeloid-derived suppressor cell; NKT, Natural killer T cell; Treg, Regulatory T cell; Tcm CD8, Central memory CD8 T cell; Tem CD8, Central memory CD8 T cell; Tcm CD4, Central memory CD4 T cell; Tem CD4, Central memory CD4 T cell; Tfh, T follicular helper cell; Th17, Type 17 T helper cell; CD56bright, CD56bright natural killer cell; CD56dim, CD56dim natural killer cell; Mem B, Memory B cell; pDC, Plasmacytoid dendritic cell; iDC, Immature dendritic cell. ns, no significance; *P < 0.05; **P < 0.01; ***P < 0.001; ****P < 0.001.
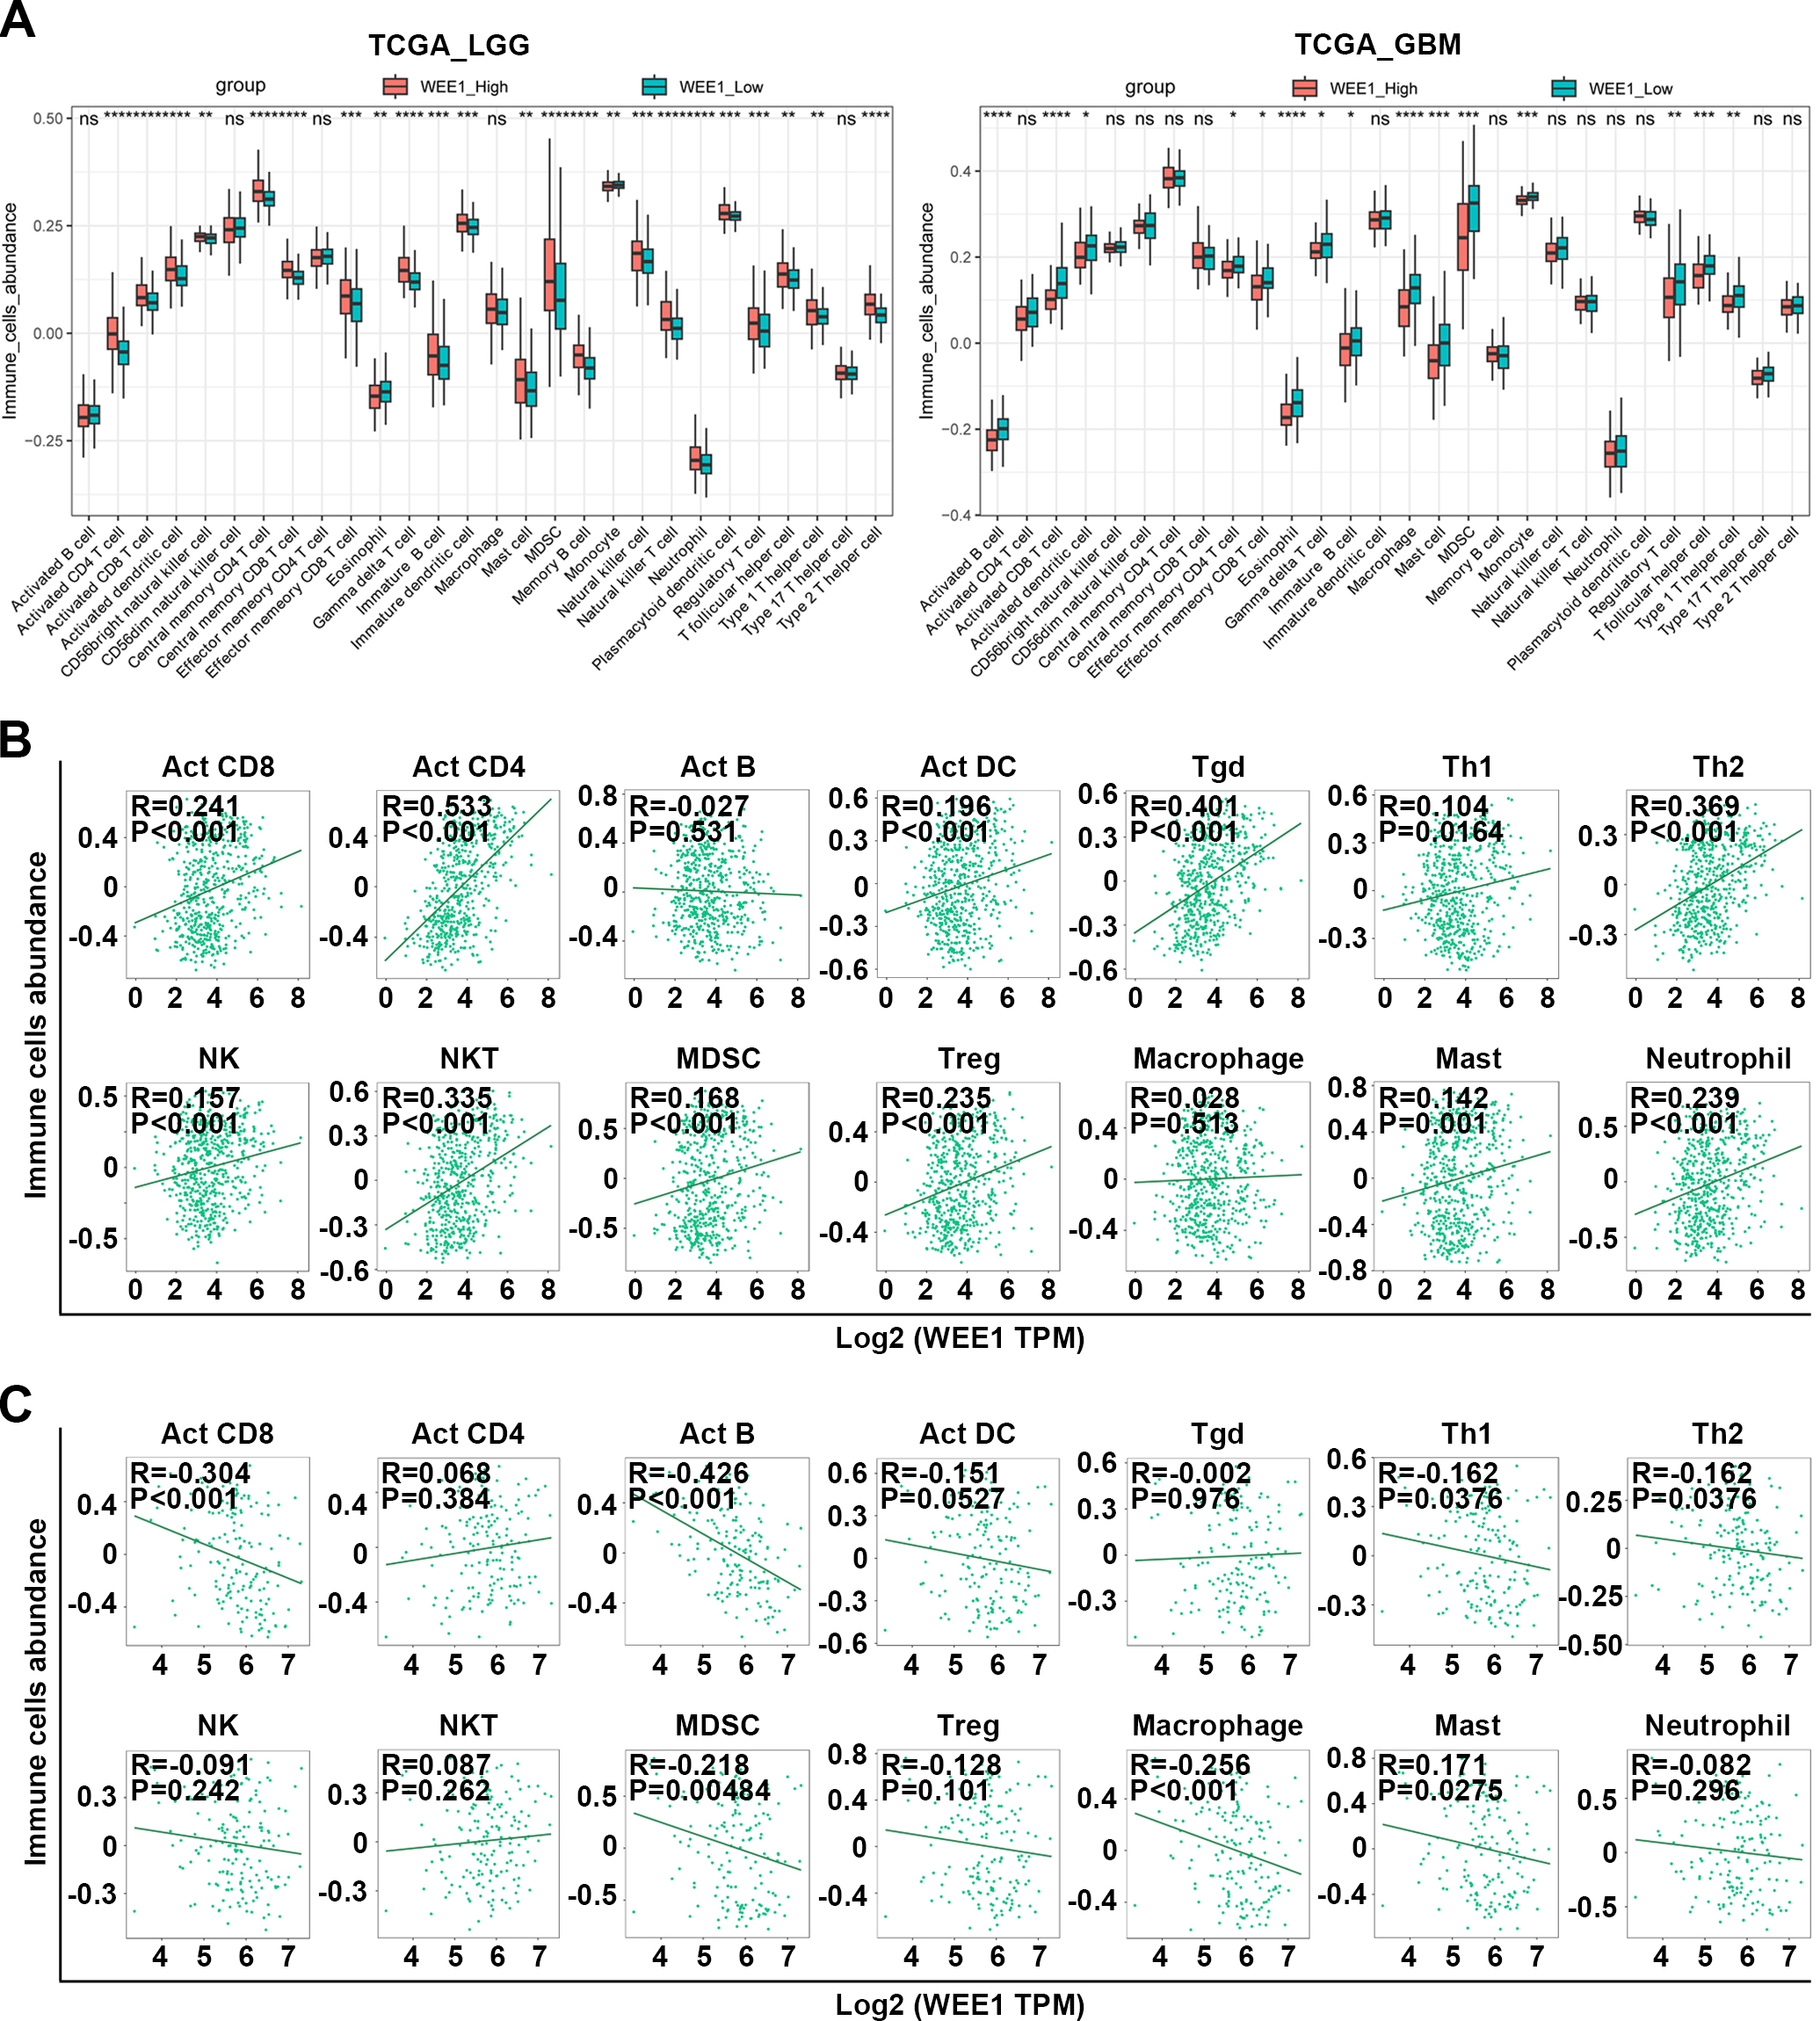
4.4WEE1 expression positively correlates with immune infiltration in LGG but negatively correlated in GBM
As WEE1 has not been studied in relation to glioma immune landscape, so we focused on that First, We found that high WEE1 expression in LGG was significantly associated with higher TMB, but not MSI, both of which are potential indicators of immunotherapy effectiveness and as compared to GBM, LGG had a higher correlation between WEE1 and TMB (Fig. S7A). In addition, WEE1 expression in different molecular subtypes [1] and immune subtypes of LGG was significantly different from that of GBM (Fig. S7B), suggesting that WEE1 might be related to immune landscape with differences between LGG and GBM. Actually, the association between WEE1 expression and immune score was opposite in LGG and GBM. As shown, LGG immune and stromal scores as well as estimated scores showed positive correlations with WEE1 expression (Fig. S7C). Further, WEE1 expression was positively related to infiltration infiltration of Act CD8, Act CD4 Act DC Tgd, Th1, Th2, NK, NKT, MDSC, Treg, Macrophage, Mast and Neutrophil cells in LGG, but negatively or not significantly related to infiltration of immune cells in GBM, according to pan-immune cell analysis (Figs 4A–C). The sincorBatch tool was also employed to analyze the TCGA data, and a positive correlation was found between WEE1 expression and immune infiltration in LGG, but a negative correlation was found in GBM (Table S2). Furthermore, pan-cancer analysis using the pancorBatch tool revealed that the correlation of WEE1 expression and immune infiltration was both universal and unique. As displayed, the expression of WEE1 was positively associated with Act CD4, Th2, Tcm CD4 and Tcm CD8 infiltration in a variety of cancers (Fig. S8). Consistent with the findings above, a positive correlation existed between WEE1 levels and the expression of markers of T cells and other immune cells in LGG, whereas the opposite was true in GBM (Tables 1 and 2). These findings suggest that the regulatory mechanisms of WEE1 which were involved in immune landscape of LGG and GBM may be very different, and the underlying cancer-promoting effects of WEE1 in LGG may be related to immune landscape.
4.5DNA methylation negatively regulates WEE1 expression, and high DNA methylation level of WEE1 is associated with better prognosis of LGG
We are curious about why WEE1 expression is upregulated in glioma. Genomic variation is an important factor in modulating gene expression As indicated by results, WEE1 amplification was found in only 1% of LGG, and WEE1 expression in these samples did not increase significantly (Fig. S9), suggesting that genomic variation may be not the cause of WEE1 upregulation. Then, we analyzed the relationship between WEE1 expression and common gene mutations, and found that WEE1 expression was significantly correlated with IDH1, CIC, TTN, EGFR, NFI, PTEN and other common gene mutations in LGG, whereas it was only correlated with HYDIN, FBN2, MROH2B and SVOPL gene mutations in GBM (Fig. S10 and Table S3).
Figure 5.
Correlation between WEE1 expression and DNA methylation. (A) Correlation analysis between the expression of WEE1 and three DNA methyltransferases in LGG and GBM from TCGA database. (B) Correlation analysis between WEE1 DNA methylation levels and WEE1 expression in LGG and GBM from TCGA database. Ten probes targeting methylation sites in the promoter region and nine probes targeting methylation sites in the gene body region were marked. (C) The correlation between WEE1 DNA methylation levels and immune cells abundance in LGG and GBM from TCGA database. *P < 0.05; **P < 0.01; ***P < 0.001. DNMT1_exp, DNMT1 expression; DNMT3A_exp, DNMT3A expression; DNMT3B_exp, DNMT3B expression; WEE1_exp, WEE1 expression.
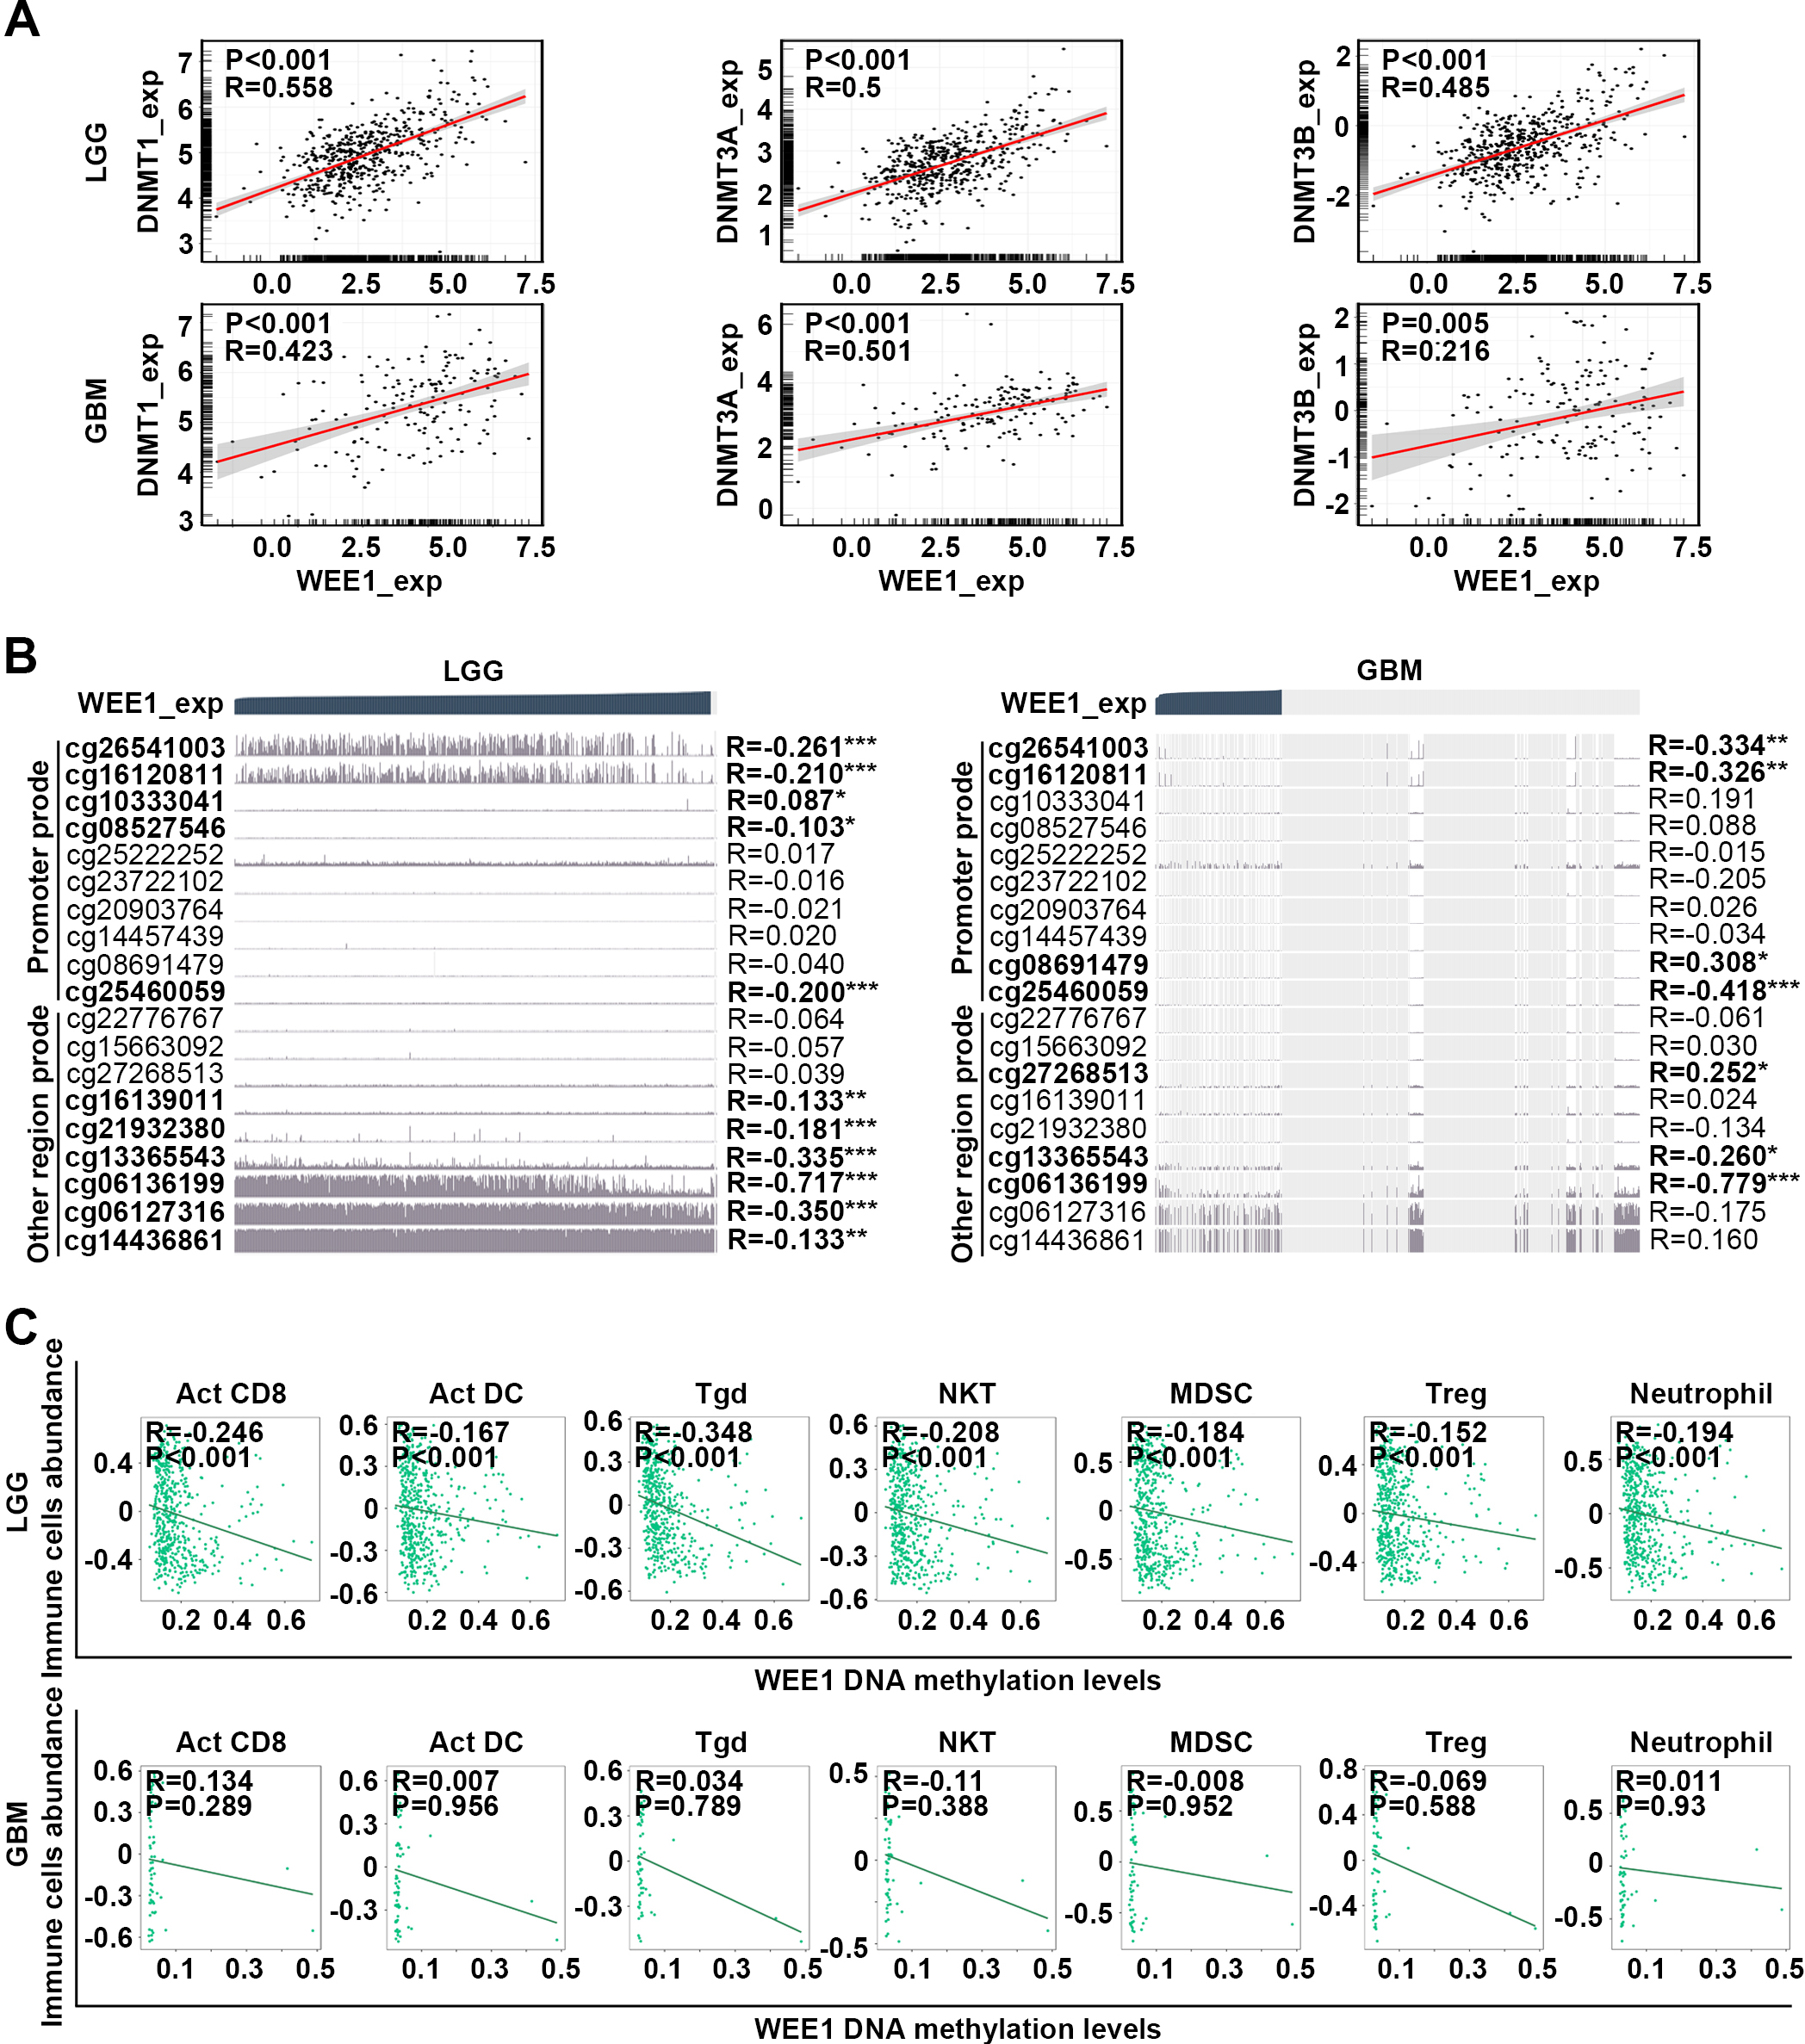
Figure 6.
Prognosis analysis of WEE1 DNA methylation in LGG and GBM. (A) Survival curves of patients with low- and high-methylation levels of six representative WEE1 DNA methylation sites in LGG and GBM from TCGA database were determined. (B) WEE1 DNA methylation levels in LGG and GBM from Methyl_159 dataset of CGGA database. (C) Survival curves of patients with low- and high-WEE1 DNA methylation levels in LGG and GBM from Methyl_159 dataset of CGGA database. Log-rank test was conducted (A, C). Data are shown as mean
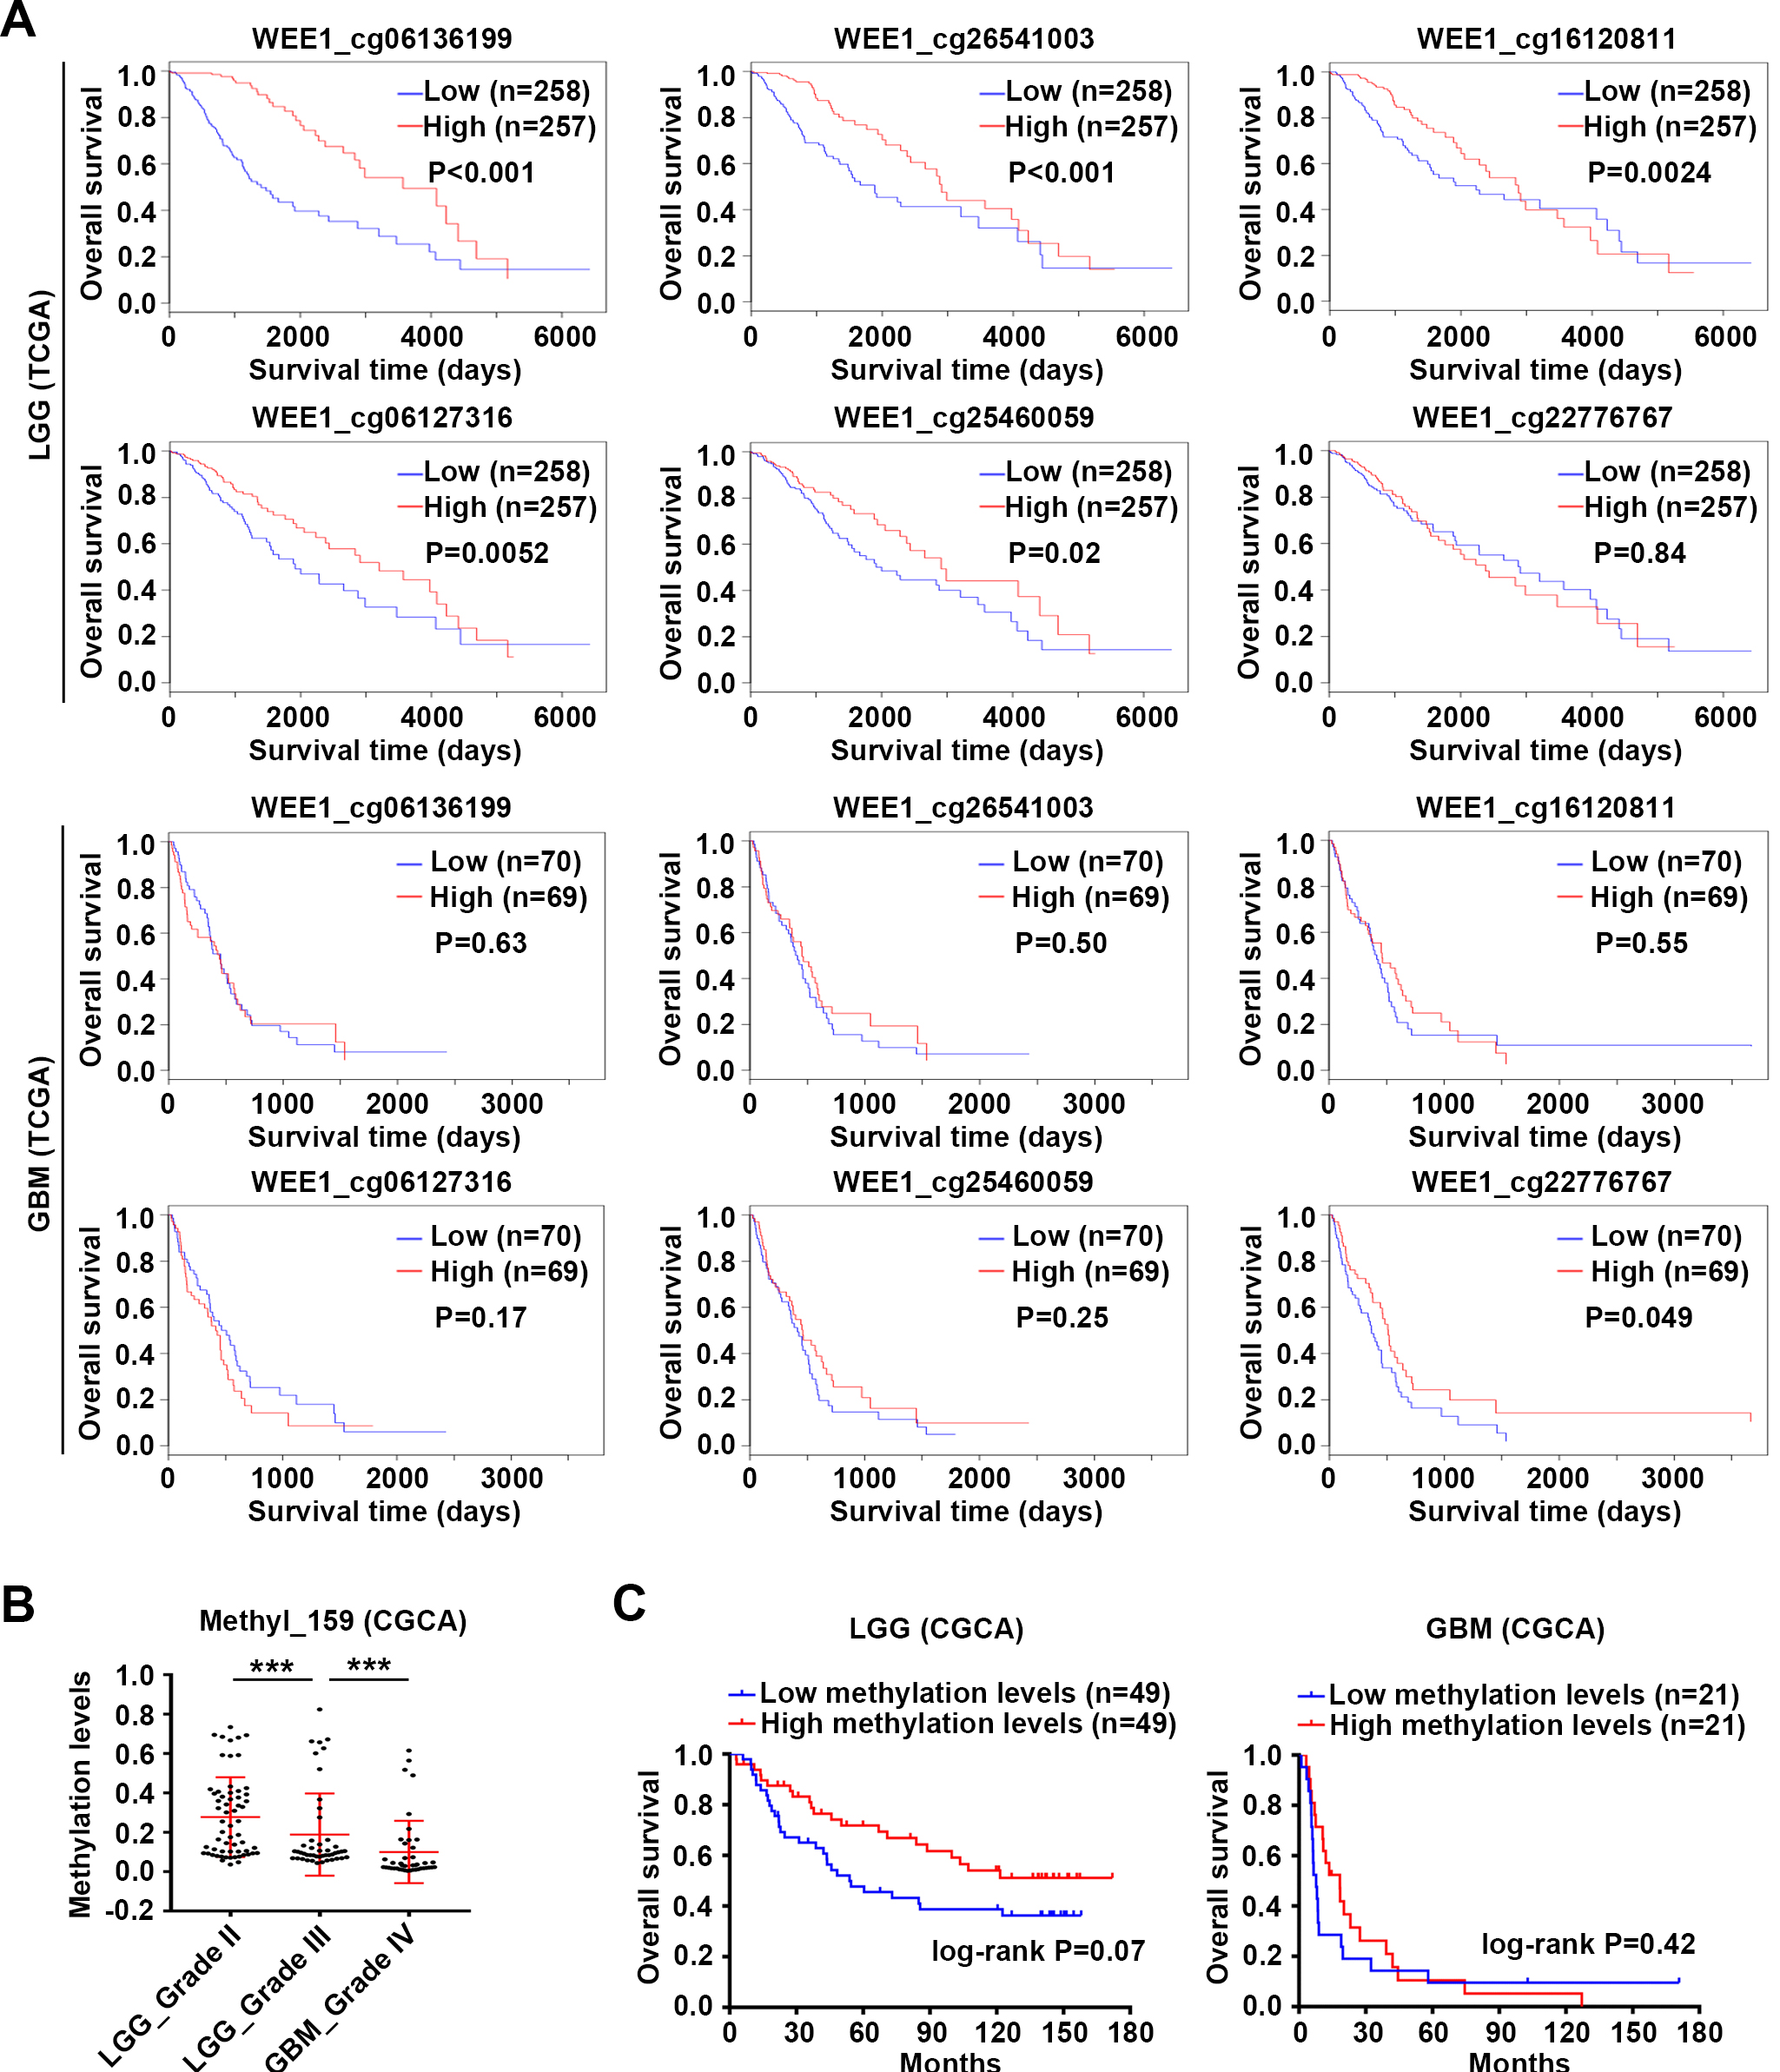
DNA methylation is a common epigenetic modification that regulates the expression of plentiful oncogenes and tumor suppressors [36, 37, 38]. Here, the expression of WEE1 and three DNA methylated transferases, including DNMT1, DNMT3A and DNMT3B, was positively correlated in LGG and GBM (Fig. 5A), and indeed in almost all other cancers (Fig. S11A). The expression of three methyltransferases was upregulated with the increase of glioma grade from three datasets of CGGA database (Fig. S11B). In addition, WEE1 DNA methylation level was negatively correlated with WEE1 expression, especially in LGG. The methylation level of WEE1-associated sites (cg26541003, cg16120811 cg10333041, cg08527546, cg25460059, cg16139011, cg21932380, cg13365543, cg06136199, cg06127316 and cg14436861) correlated negatively with the expression of WEE1 in LGG, while the methylation level of WEE1-associated sites (cg26541003, cg16120811 cg08691479, cg25460059, cg27268513, cg13365543 and cg06136199) correlated negatively with the expression of WEE1 in GBM (Fig. 5B). WEE1 DNA methylation sites are distributed in the promoter and other regions incuding 5’ UTR, gene body and 3’ UTR. Interestingly, consistent with the results mentioned above that WEE1 expression was positively correlated with immune infiltration in LGG, pan-immune cell analysis revealed that a negative correlation existed between the DNA methylation level of WEE1 and infiltration of Act CD8, Act DC Tgd, NKT, MDSC, Treg and Neutrophil cells in LGG but not in GBM (Fig. 5C). Crucially, in the TCGA dataset, high DNA methylation level of five sites (cg06136199, cg26541003, cg16120811, cg06127316 and cg25460059) of WEE1 correlated with the longer OS of LGG patients, while only one site (cg22776767) was correlated with OS of GBM patients (Fig. 6A and Table S4). In the CGGA dataset, WEE1 DNA methylation was attenuated with the increase of glioma grade (Fig. 6B), and the OS of LGG patients with high WEE1 DNA methylation level showed an increasing trend (Fig. 6C). These results imply that the upregulation of WEE1 expression may have relations with DNA methyltransferase, and that WEE1 DNA methylation negatively regulates its expression and makes difference in the initiation and development of LGG.
Figure 7.
Synergistic effect of WEE1 inhibition and DNA methyltransferase inhibitor or temozolomide on glioma cells. (A) Effects of DNA methyltransferase inhibitors on WEE1 expression. SW1088 and U251 cell lines were treated with 2, 5 and 10
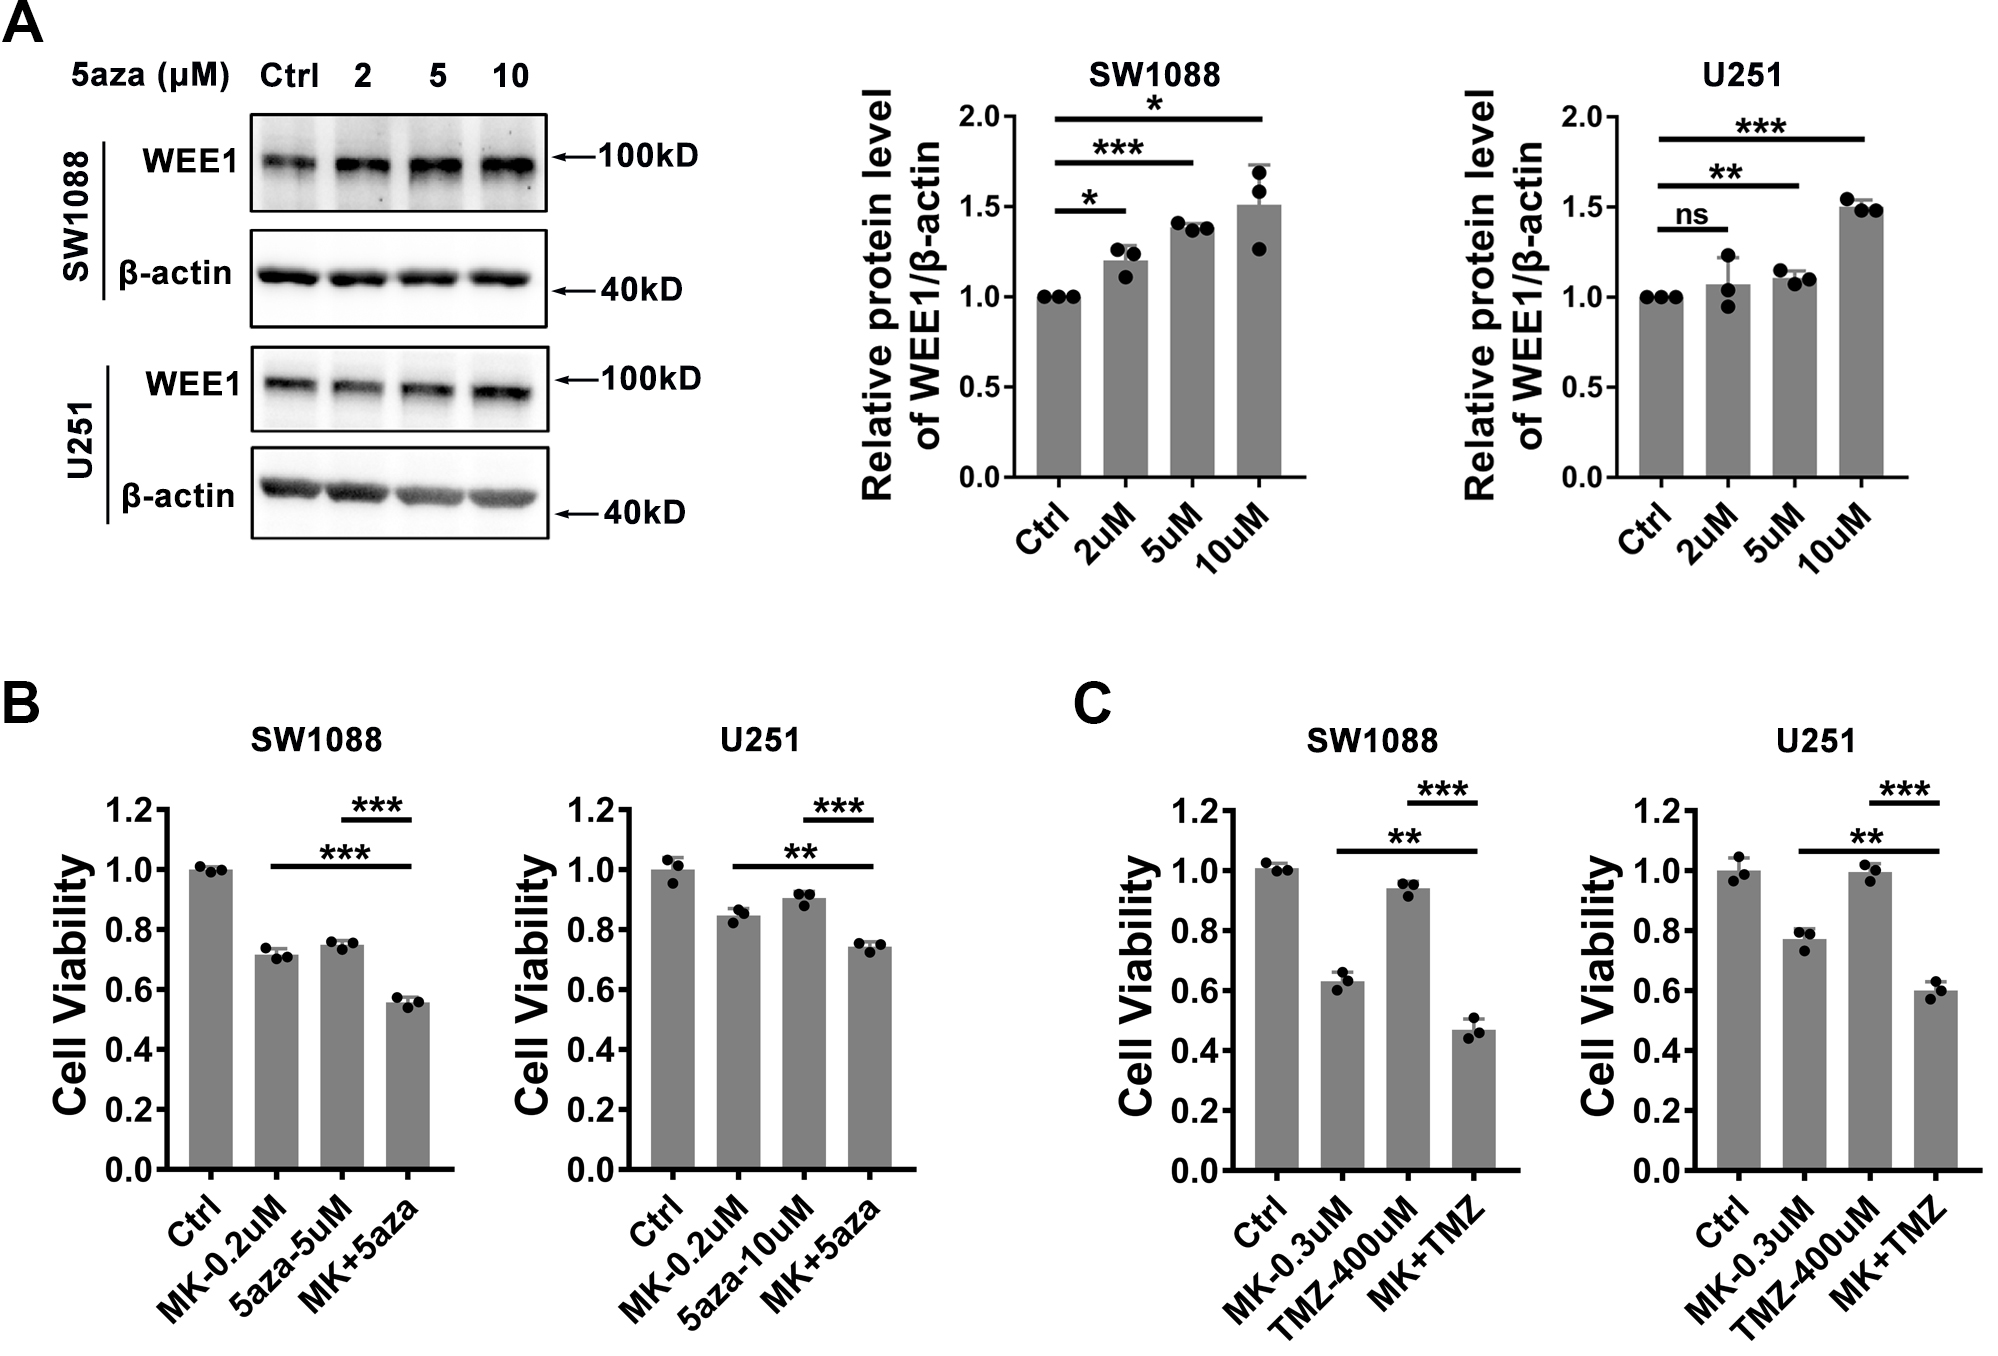
In order to demonstrate the regulation of DNA methylation on WEE1 expression, we treated SW1088 and U251 cell lines with DNA methyltransferase inhibitor 5-Azacytidine in vitro, and found that 5-Azacytidine could indeed up-regulate WEE1 protein level (Fig. 7A). Since both WEE1 and DNA methyltransferase are up-regulated in glioma, we speculated whether WEE1 inhibition and DNA methyltransferase inhibitors have synergistic effects. To our surprise, WEE1 inhibition and DNA methyltransferase inhibitor 5-Azacytidine synergistic inhibited the cell viability of SW1088 and U251 cell lines (Fig. 7B). In addition, we also found that the chemotherapeutic drug temozolomide can enhance the inhibitory effect of MK-1775 on SW1088 and U251 cell lines (Fig. 7C), indicating that WEE1 inhibition shows great potential in drug combination.
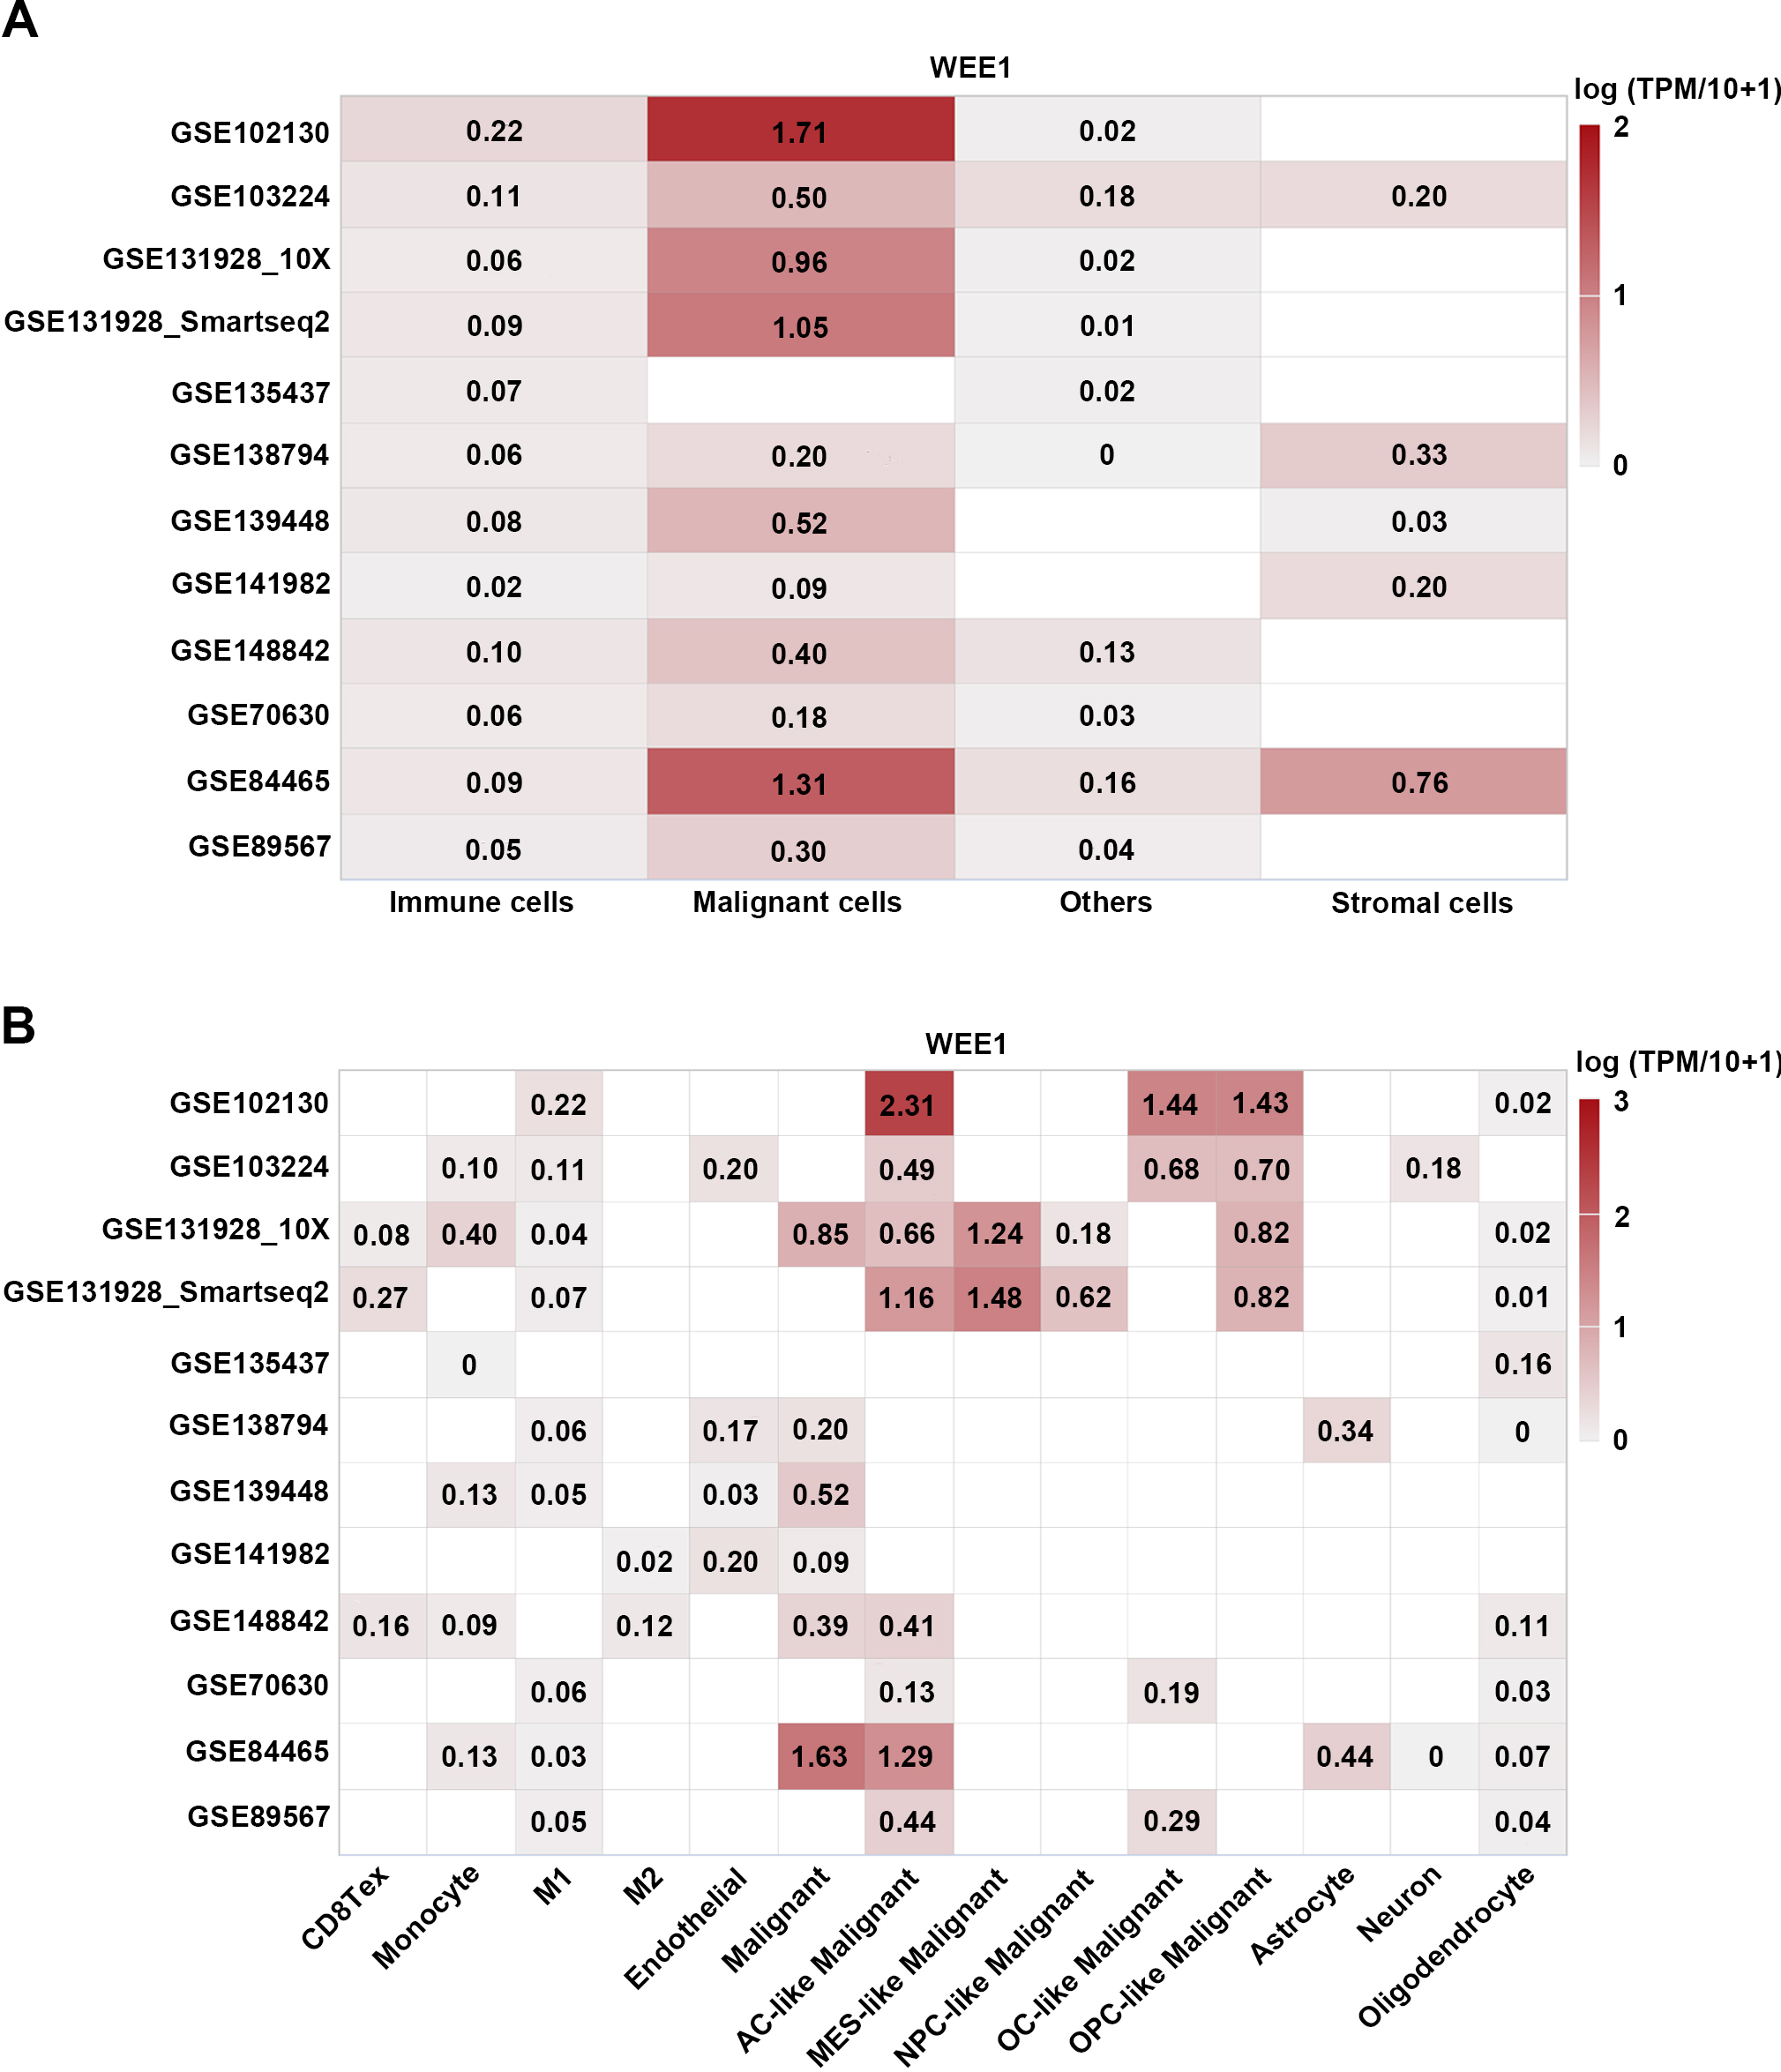
Figure 8.
Single-cell RNA-seq analysis of WEE1 expression in gliomas. (A) Heatmap of WEE1 expression in different cell types of gliomas from twelve datasets. (B) Heatmap of WEE1 expression in various cell subtypes of gliomas from twelve datasets. The average expression level of WEE1 in each cell type was showed. CD8Tex, exhausted CD8 T Cells; M1, M1 macrophages; M2, M2 macrophages; AC-like Malignant, astrocyte-like malignant cells; MES-like Malignant, mesenchymal-like malignant cells; OC-like Malignant, oligodendrocyte-like malignant cells; NPC-like Malignant, neural-progenitor-like malignant Cells; OPC-like Malignant, oligodendrocyte-precursor-cell-like malignant cells.
4.6Single cell analysis shows that WEE1 is mainly expressed in tumor cells with low levels in immune cells and other cells
Next, to clarify the expression of WEE1 in different cell types of gliomas, we analyzed 12 single-cell RNA sequencing datasets of gliomas from TISCH. Single cell analysis showed higher WEE1 expression in tumor cells, lower WEE1 expression in immune cells and other cells, and lowest WEE1 expression in stromal cells (Fig. 8A). Further analysis showed that WEE1 expression was higher in astrocyte-like malignant cells among all tumor cell types. In immune cells, the expression of WEE1 was higher in monocytes and M1 macrophages (Figs 8B and S12). These results suggest that WEE1 may mainly act on tumor cells, and also have potential regulatory effects on monocytes and M1 macrophages.
Figure 9.
Analysis of predictive value of WEE1 in immunotherapy response. (A) Analysis of WEE1 expression in mouse tumor cell lines before and after treatment with cytokines in vitro. (B) Analysis of WEE1 expression in the response group or non-response group after ICB treatment in mouse tumors. (C) Analysis of WEE1 expression in tumors of the response or non-response patients after ICB therapy. (D) Distribution of WEE1 expression in high- or low- immunophenoscore (IPS) group. Violin plot representation of WEE1 expression in high- or low- immunophenoscore (IPS) groups in TCGA-LGG cohort. Data are shown as mean
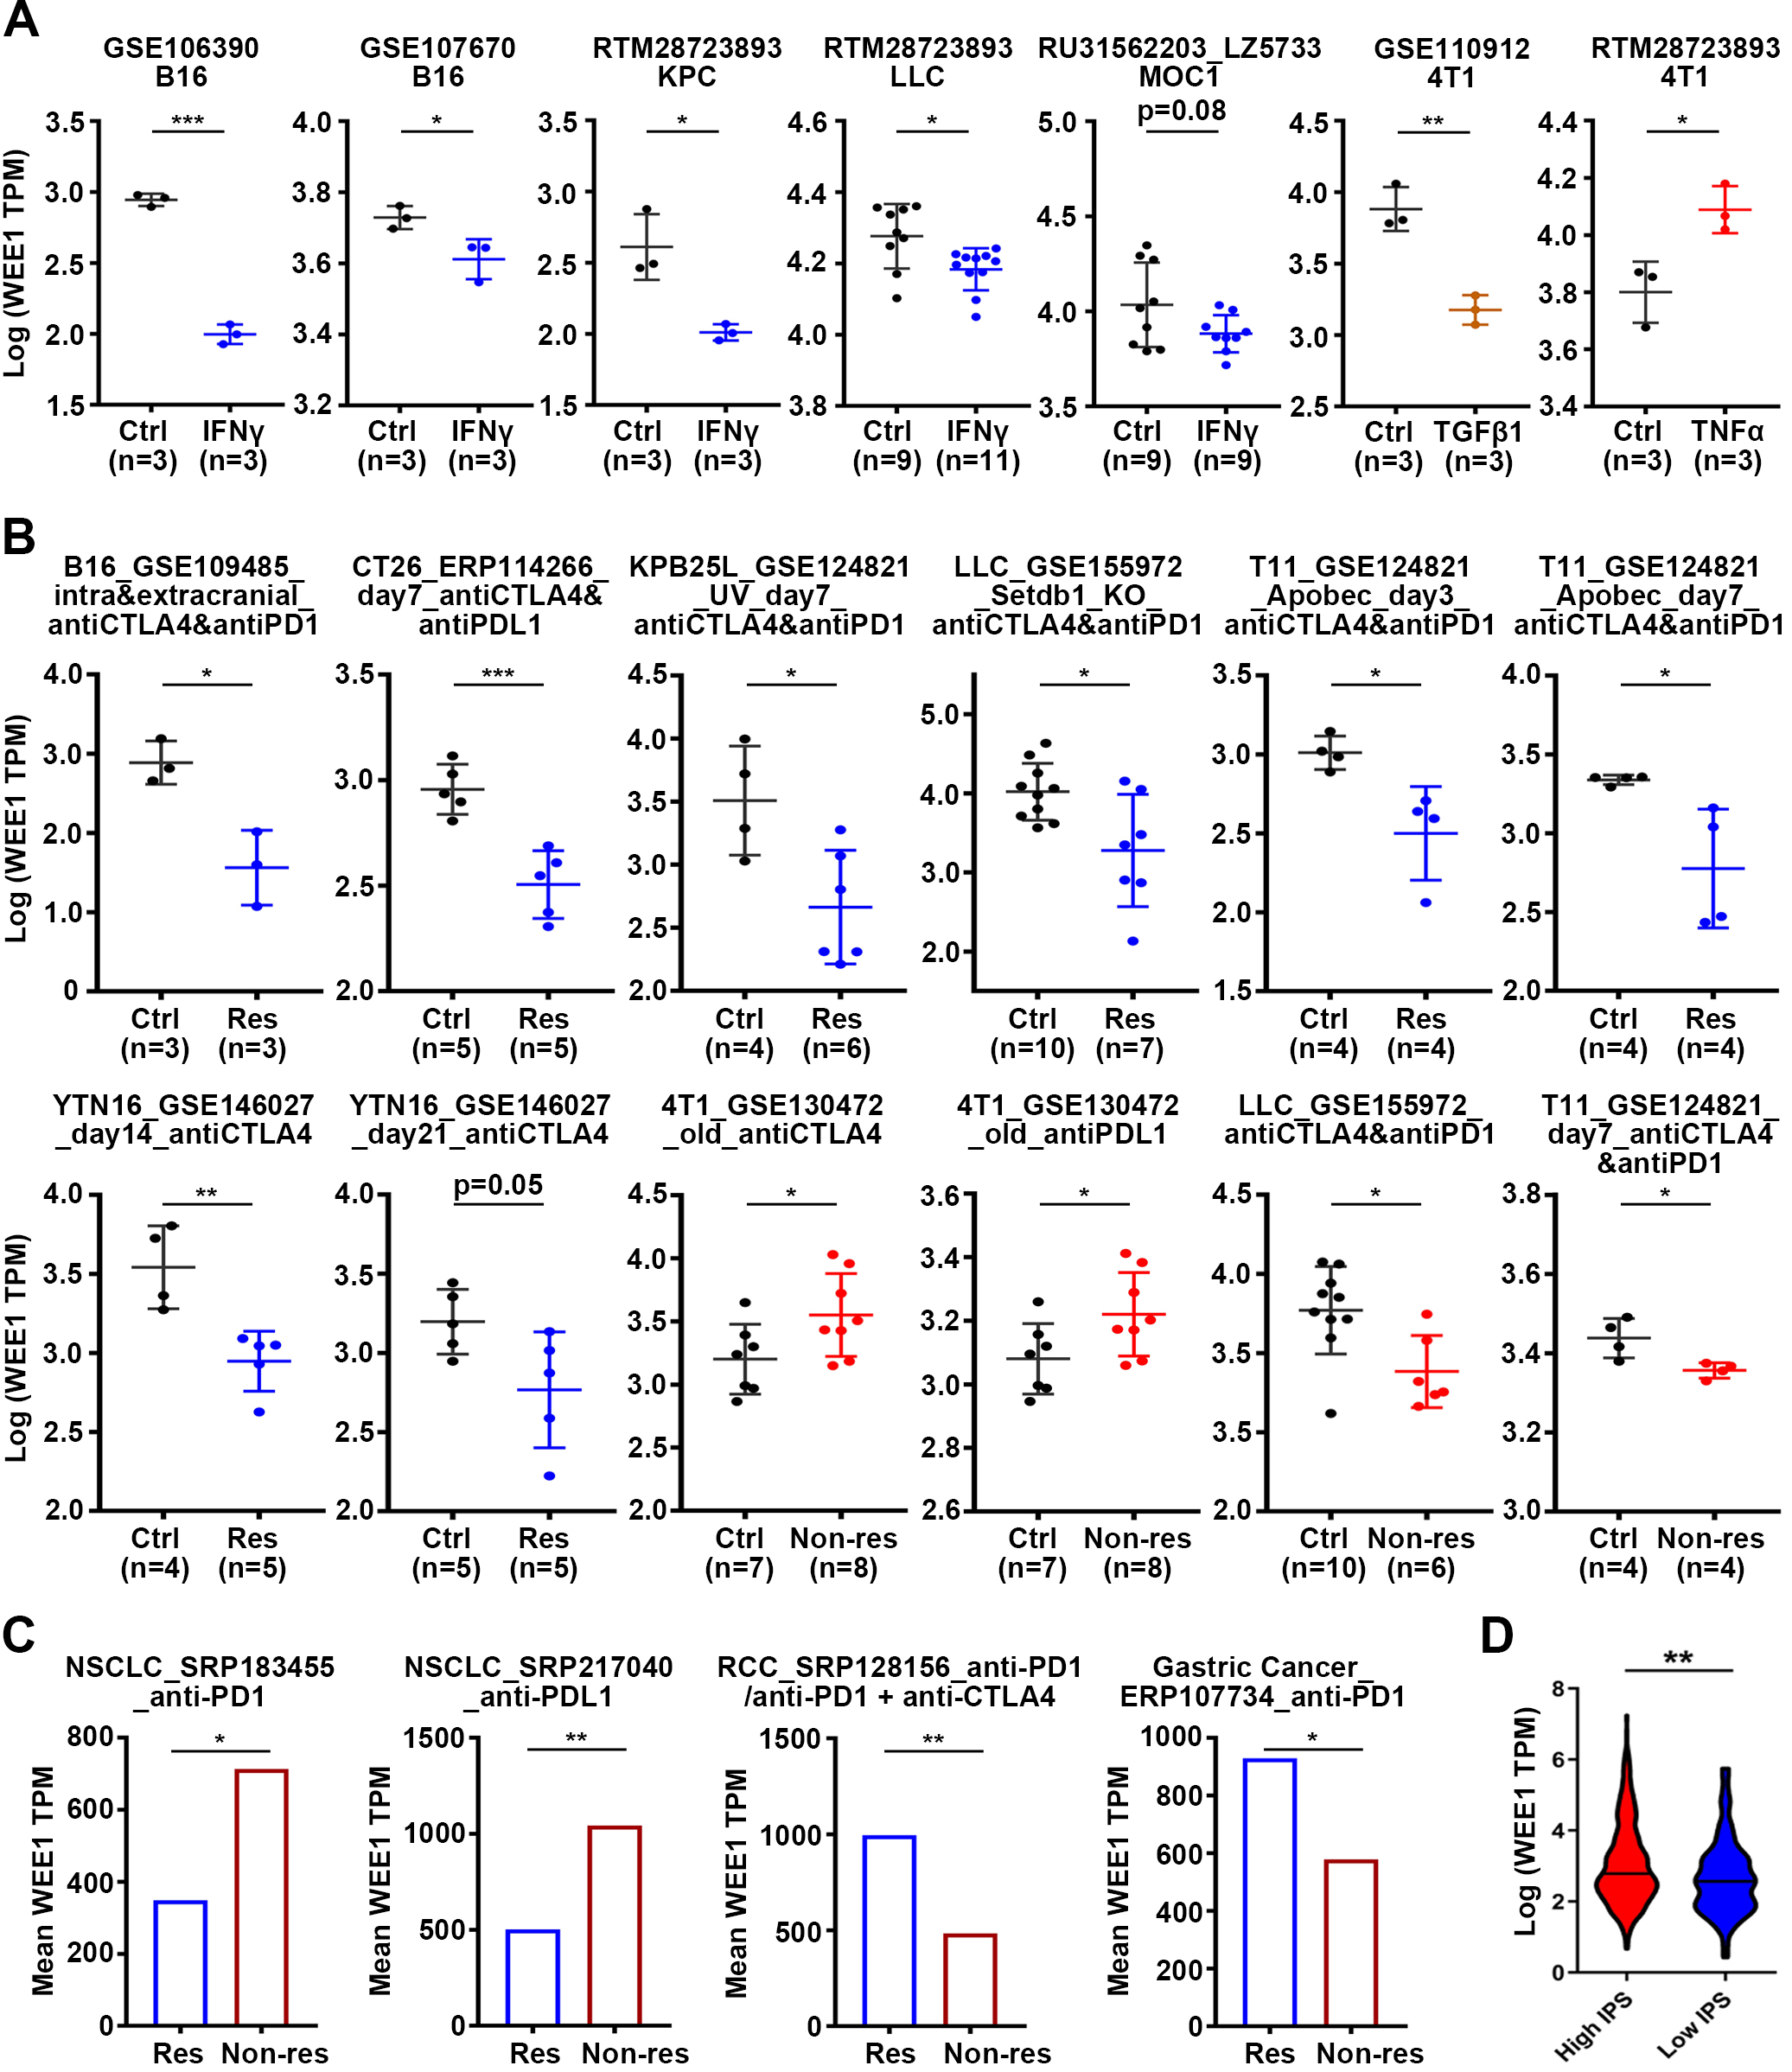
4.7WEE1 downregulation exhibits predictive value in immunotherapy response
As our results show that WEE1 may be related to immune infiltration, we speculate that WEE1 may have predictive value in immunotherapy. We analyzed the change of WEE1 expression in mouse tumor cell lines after cytokine treatment. It was found that IFN
4.8The mechanism underlying WEE1-mediated regulation of immune infiltration in LGG
Finally, we attempted to analyze the underlying mechanism of WEE1 in regulating immunity. The intersection of WEE1-co-expressed genes, the top 500 prognosis-associated genes in LGG and the differentially expressed genes in tumor tissues revealed 24 WEE1-related core genes with prognostic value (Fig. S13A and Table S8). GO enrichment analysis of these 24 genes indicated that immune and inflammation-related pathways, metastasis-related pathways and cell differentiation pathways were significantly enriched. The regulation of WEE1 on these pathways may be related to key molecules such as MYD88, FLNA and NOG (Fig. S13B and Table S9). Expression correlation analysis showed that WEE1 had a good correlation with MYD88 and FLNA in most tumors including LGG, while it only had a negative correlation with NOG in LGG, which was very unexpected (Fig. S13C). Prognostic analysis showed that MYD88, FLNA and NOG were all very valuable prognostic predictors, which had become our focus in the future (Fig. S13D). The roles of IL-23 and Toll-like receptor mediating immune and inflammatory pathways in the initiation and development of cancer have been emphasized [39, 40, 41, 43]. Our results suggest that WEE1 may regulate IL-23- and Toll-like receptor-mediated immune and inflammatory responses through MYD88.
Moreover, it was found that more genes were significantly co-expressed with WEE1 in LGG than in GBM (Fig. S14A and Table S10). The intersection of genes positively or negatively correlated with WEE1 in LGG and GBM showed that about 50% of WEE1-related genes in GBM appeared in LGG, while more than 80% of WEE1-related genes in LGG did not appear in GBM (Fig. S14B). KEGG pathway enrichment was conducted on genes positively or negatively correlated with WEE1. We found that among the top 20 positively correlated pathways, except for “ECM-receptor interaction”, “Homologous recombination” and “herpes simplex virus 1 infertion”, all the other pathways were different from each other in LGG and GBM. Among the top 20 pathways negatively associated with WEE1, “Synaptic vesicle cycle”, “GABAergic synapse”, “Glutamatergic synapse”, and “Retrograde endocannabinoid” appeared in both LGG and GBM, but all other pathways were different (Fig. S14C and Table S11). These results suggest that the role and mechanism of WEE1 in LGG and GBM are quite different.
5.Discussion
The mechanism of WEE1 regulating cell cycle G2/M transition in response to DNA damage is universal. WEE1 inhibition leads to aberrant mitosis, resulting in mitotic catastrophe and cell death, which inhibits the progression of various types of cancer [17, 44, 45, 46, 47, 48]. Meanwhile, studies have also shown that WEE1 may be involved in the progression of GBM, and WEE1 inhibition can increase the sensitivity of GBM to radiotherapy [10]. However, the role and potential mechanism of WEE1 in LGG remain unclear. Our study shows that WEE1 is the marker most associated with the prognosis of LGG patients among all tumors, and it is also among the top five markers significantly correlated with OS of LGG. In all three groups of LGG patients with wild-type IDH, mutated IDH and non-codeletion 1p/19q, high WEE1 expression is associated with poorer prognosis, suggesting that WEE1 may be an independent prognostic predictor. Importantly, the combination of high WEE1 expression and wild-type IDH predicts worse prognosis of LGG patients. WEE1 inhibitor MK-1775 significantly inhibited proliferation and migration of LGG cell lines in vitro, and LGG cell lines were more sensitive to MK-1775 than GBM cell lines.
WEE1 is a crucial target of the new generation of DDRtargeted therapies which has a promising prospect in the development of anti-tumor drug. At present, a large number of inhibitor drugs targeting WEE1 have been developed [47, 48]. Among them, AZD1775, ZN-c3 and IMP7068, the most promising drugs, are all in the 1/2 clinical stage [49, 50]. Excitingly, WEE1 inhibitors have shown significant results in the treatment of serous uterine cancer (USC) in clinical studies [51] However, unfortunately, there are no pre-clinical and clinical studies targeting WEE1 in LGG, and our study implies that WEE1 inhibition may have great potential in the treatment of LGG.
At the same time, we also found that WEE1 had a great difference in the correlation with prognosis between LGG and GBM, and the correlation with immune infiltration also showed an opposite trend, suggesting that the molecular and immune differences between LGG and GBM may be caused by genes like WEE1. It also indicates that the same targeting strategy may show different effects on the treatment of LGG and GBM, which should be paid more attention to. The 2016 and 2021 WHO classification of gliomas both announced that the IDH mutation status should be considered, emphasizing that wildtype IDH is an important biomarker of high-risk LGG. The molecular characteristics and clinical manifestations of LGG with wild-type IDH are similar to those of GBM. In the new guidelines, LGG with wildtype IDH has been redefined as GBM [2, 35]. Nevertheless, this study showed that WEE1 had good prognostic value in LGG with wild-type IDH, but not in GBM, suggesting that the molecular characteristics and functions of LGG with wild-type IDH and GBM were still different to some extent.
Recently, the relationship between WEE1 and immune landscape has been highlighted. WEE1 inhibition could stimulate anti-tumor immune response in a CD8 + T cell-dependent manner through the double-stranded RNA (dsRNA) viral defense pathway and enhance the sensitivity to ICB in multiple tumor models [45]. Inhibition of WEE1 could also facilitate immune response via CD8 + cytotoxic T cell infiltration by simultaneously activating STING and STAT1 pathways in small cell lung cancers [46]. In addition, targeting WEE1 and AKT simultaneously has been reported to restore p53-dependent NK cell activation in melanoma [52]. However, until now, the relationship between WEE1 and immunity in glioma is still unclear. Our results showed that LGG and GBM have different correlations between WEE1 and immune infiltration, with positive correlation in LGG but negative correlation in GBM It suggests that the regulation mechanism of WEE1-mediated immunity is completely opposite in LGG and GBM, and the effect of WEE1 inhibition combined with immunotherapy may also be very different. Indeed, GBM shows an immunosuppressive state [53, 54, 55, 56]. We even found that the positive correlation between WEE1 and activated CD8 T cell, MDSC and Gamma delta T cell was only presented in LGG through pan-cancer analysis, suggesting that the correlation of WEE1 and immune infiltration is unique in LGG and worthy of further study Our results are consistent with previous reports on the involvement of DDR signaling pathways in immune regulation. Chen et al. found that a higher DDR signal was positively correlated with immune infiltration [57]. Koch et al. found that perturbing DDR signals with ATR inhibitors could regulate the CAN-2409-associated immune cell composition in glioma [58]. Of note, the study by Chen and his colleagues did not distinguish between LGG and GBM, and it is likely that the correlation between DDR and immunity is reversed in LGG and GBM based on our results. Combined with our findings, we believe that it is worth further exploring the effect of WEE1 inhibition in combination with immunotherapy in LGG, although it will take longer to conduct clinical trials of immunotherapy in LGG [59]. Of course, the regulatory effect of WEE1 on immune function in LGG also needs to be further clarified in preclinical studies.
DNA methyltransferases (DNMTs) catalyze DNA methylation to inhibit the expression of tumor suppressors and targeting DNMTs has shown great potential in the treatment of cancer, especially leukemia [60, 61]. Accumulating evidence has revealed that DNMTs mediate transcriptional silencing in gliomas [62], but the mechanism of DNMTs in glioma is far from clear. This study found that the DNMT1, DNMT3A and DNMT3B levels were positively associated with WEE1 expression in gliomas. Accordingly, we consider that the upregulation of WEE1 expression might be related to these DNMTs in gliomas. Unexpectedly, WEE1 inhibition and DNA methyltransferase inhibition have synergistic effects on glioma. However, it is very confusing that the expression of three DNMTs was upregulated with the increase of tumor grade in glioma, while WEE1 DNA methylation was attenuated. Is it possible that the decrease of WEE1 DNA methylation level has nothing to do with DNMT1, DNMT3A and DNMT3B, but is regulated by other methylation-related genes? This is the question that we’re going to focus on.
WEE1related genes showed great differences between LGG and GBM, suggesting that the function mechanism of WEE1 in LGG and GBM is also different. Molecules related to WEE1 and prognosis were found in LGG, among which MYD88, FLNA and NOG had great potential to mediate the effect of WEE1. WEE1 may regulate biological processes such as immune response, inflammation, metastasis and differentiation through these key downstream molecules. Although we do not have enough evidence at present, we will further explore their regulatory mechanisms by in vivo animal models and cell models, and finally clarify the key mechanism of WEE1 function.
Despite the valuable insights provided by this study, there are several limitations that should be acknowledged. Firstly, in selecting LGG and GBM cell lines for our in vitro experiments, we only chose one representative cell line for each subtype. While this appropriately addresses our research questions, it is important to supplement our findings with additional cell lines to ensure a more comprehensive and robust study. Secondly, although this study incorporated clinical data and in vitro experiments, it lacks in vivo experiments such as validation using animal models to confirm our conclusions. Future research efforts will focus on addressing this limitation and incorporating in vivo experiments to strengthen the translational relevance of our findings. Lastly, further exploration of the downstream mechanisms of WEE1 and the differences in its role between LGG and GBM is needed. This study provides valuable insights into the prognostic impact and therapeutic potential of WEE1, but a deeper understanding of its downstream targets and specific molecular mechanisms in both tumor types would enhance our knowledge of glioma biology and inform potential therapeutic strategies.
Availability of data and materials
This article/Supplementary Material contains the original contributions presented in the study. For further information, please contact the corresponding authors.
Ethics approval and consent to participate
Informed consent was obtained from the individual(s) for publishing any potentially identifiable images or data in this article. The project received approval from the ethics committee of Huizhou Third People’s Hospital.
Author contributions
Conception: W-JZ, L-ZZ.
Interpretation or analysis of data: W-JZ, L-ZZ, FY, LY, QZ.
Preparation of the manuscript: W-JZ, L-ZZ.
Revision for important intellectual content: W-JZ, L-ZZ, LL, XL.
Supervision: LL, XL.
Funding
This work was supported by grants from GuangDong Basic and Applied Basic Research Foundation – Regional Joint Fund (No. 2022A1515140039 and No. 2022A1515140056) and Key Technologies Research and Development Program of Huizhou (No. 2022CZ010428).
Supplementary data
The supplementary files are available to download from http://dx.doi.org/10.3233/CBM-230517.
Acknowledgments
Thanks to Shipeng Guo for developing the GTBA bioinformatics tool.
Conflict of interest
No commercial or financial relationships could be construed as potential conflicts of interest by the authors.
References
[1] | M. Ceccarelli, et al., Molecular Profiling Reveals Biologically Discrete Subsets and Pathways of Progression in Diffuse Glioma, Cell 164: ((2016) ), 550–563. |
[2] | D.N. Louis, et al., The 2021 WHO Classification of Tumors of the Central Nervous System: a summary, Neuro-Oncology 23: ((2021) ), 1231–1251. |
[3] | Z. Zhao, et al., Chinese Glioma Genome Atlas (CGGA): A Comprehensive Resource with Functional Genomic Data from Chinese Glioma Patients, Genomics, Proteomics & Bioinformatics 19: ((2021) ), 1–12. |
[4] | S. Lapointe, A. Perry and N.A. Butowski, Primary brain tumours in adults, Lancet (London, England) 392: ((2018) ), 432–446. |
[5] | A. Picca, G. Berzero and M. Sanson, Current therapeutic approaches to diffuse grade II and III gliomas, Therapeutic Advances in Neurological Disorders 11: ((2018) ), 1756285617752039. |
[6] | M. Weller and E. Le Rhun, How did lomustine become standard of care in recurrent glioblastoma? Cancer Treatment Reviews 87: ((2020) ), 102029. |
[7] | J.E. Eckel-Passow et al., Glioma Groups Based on 1p/19q, IDH, and TERT Promoter Mutations in Tumors, The New England Journal of Medicine 372: ((2015) ), 2499–2508. |
[8] | M. Weller, et al., EANO guidelines on the diagnosis and treatment of diffuse gliomas of adulthood, Nature reviews, Clinical Oncology 18: ((2021) ), 170–186. |
[9] | L.B. Nabors, et al., Central Nervous System Cancers, Version 3.2020, NCCN Clinical Practice Guidelines in Oncology, Journal of the National Comprehensive Cancer Network: JNCCN 18: ((2020) ), 1537–1570. |
[10] | S.E. Mir, et al., In silico analysis of kinase expression identifies WEE1 as a gatekeeper against mitotic catastrophe in glioblastoma, Cancer Cell 18: ((2010) ), 244–257. |
[11] | A. Khanna, et al., Constitutive CHK1 Expression Drives a pSTAT3-CIP2A Circuit that Promotes Glioblastoma Cell Survival and Growth, Molecular Cancer Research: MCR 18: ((2020) ), 709–722. |
[12] | A. Ghorai, et al., Sustained inhibition of PARP-1 activity delays glioblastoma recurrence by enhancing radiation-induced senescence, Cancer Letters 490: ((2020) ), 44–53. |
[13] | S. Agnihotri, et al., ATM regulates 3-methylpurine-DNA glycosylase and promotes therapeutic resistance to alkylating agents, Cancer Discovery 4: ((2014) ), 1198–1213. |
[14] | Y. Xiong, et al., Pamiparib is a potent and selective PARP inhibitor with unique potential for the treatment of brain tumor, Neoplasia (New York, N.Y.) 22: ((2020) ), 431–440. |
[15] | J. Karlin, et al., Orally Bioavailable and Blood-Brain Barrier-Penetrating ATM Inhibitor (AZ32) Radiosensitizes Intracranial Gliomas in Mice, Molecular Cancer Therapeutics 17: ((2018) ), 1637–1647. |
[16] | K. Do, J.H. Doroshow and S. Kummar, Wee1 kinase as a target for cancer therapy, Cell cycle (Georgetown, Tex.) 12: ((2013) ), 3159–3164. |
[17] | J. PosthumaDeBoer, et al., WEE1 inhibition sensitizes osteosarcoma to radiotherapy, BMC Cancer 11: ((2011) ), 156. |
[18] | S. Mueller, et al., Targeting Wee1 for the treatment of pediatric high-grade gliomas, Neuro-Oncology 16: ((2014) ), 352–360. |
[19] | D. Music, et al., Expression and prognostic value of the WEE1 kinase in gliomas, Journal of Neuro-Oncology 127: ((2016) ), 381–389. |
[20] | V. Caretti, et al., WEE1 kinase inhibition enhances the radiation response of diffuse intrinsic pontine gliomas, Molecular Cancer Therapeutics 12: ((2013) ), 141–150. |
[21] | S. Wu, et al., Activation of WEE1 confers resistance to PI3K inhibition in glioblastoma, Neuro-Oncology 20: ((2018) ), 78–91. |
[22] | Z. Tang, et al., GEPIA: a web server for cancer and normal gene expression profiling and interactive analyses, Nucleic Acids Research 45: ((2017) ), W98–w102. |
[23] | B. Ru, et al., TISIDB: an integrated repository portal for tumor-immune system interactions, Bioinformatics (Oxford, England) 35: ((2019) ), 4200–4202. |
[24] | S. Hänzelmann, R. Castelo and J. Guinney, GSVA: gene set variation analysis for microarray and RNA-seq data, BMC Bioinformatics 14: ((2013) ), 7. |
[25] | A. Koch, et al., MEXPRESS: visualizing expression, DNA methylation and clinical TCGA data, BMC Genomics 16: ((2015) ), 636. |
[26] | V. Modhukur, et al., MethSurv: a web tool to perform multivariable survival analysis using DNA methylation data, Epigenomics 10: ((2018) ), 277–288. |
[27] | E. Cerami, et al., The cBio cancer genomics portal: an open platform for exploring multidimensional cancer genomics data, Cancer Discovery 2: ((2012) ), 401–404. |
[28] | J. Gao, et al., Integrative analysis of complex cancer genomics and clinical profiles using the cBioPortal, Science Signaling 6: ((2013) ), pl1. |
[29] | D. Sun, et al., TISCH: a comprehensive web resource enabling interactive single-cell transcriptome visualization of tumor microenvironment, Nucleic Acids Research 49: ((2021) ), D1420–d1430. |
[30] | A.M. Newman, et al., Robust enumeration of cell subsets from tissue expression profiles, Nature Methods 12: ((2015) ), 453–457. |
[31] | K.E. Yost, et al., Clonal replacement of tumor-specific T cells following PD-1 blockade, Nature Medicine 25: ((2019) ), 1251–1259. |
[32] | L. Zhang, et al., Lineage tracking reveals dynamic relationships of T cells in colorectal cancer, Nature 564: ((2018) ), 268–272. |
[33] | Z. Zeng, et al., TISMO: syngeneic mouse tumor database to model tumor immunity and immunotherapy response, Nucleic Acids Research 50: ((2022) ), D1391–D1397. |
[34] | M. Yang, et al., ICBatlas: A Comprehensive Resource for Depicting Immune Checkpoint Blockade Therapy Characteristics from Transcriptome Profiles, Cancer Immunology Research 10: ((2022) ), 1398–1406. |
[35] | D.N. Louis, et al., The 2016 World Health Organization Classification of Tumors of the Central Nervous System: a summary, Acta Neuropathologica 131: ((2016) ), 803–820. |
[36] | M. Busslinger, J. Hurst and R.A. Flavell, DNA methylation and the regulation of globin gene expression, Cell 34: ((1983) ), 197–206. |
[37] | A. Nishiyama and M. Nakanishi, Navigating the DNA methylation landscape of cancer, Trends in genetics: TIG 37: ((2021) ), 1012–1027. |
[38] | Z. Siegfried, et al., DNA methylation represses transcription in vivo, Nature Genetics 22: ((1999) ), 203–206. |
[39] | S. Rakoff-Nahoum and R. Medzhitov, Toll-like receptors and cancer, Nature reviews. Cancer 9: ((2009) ), 57–63. |
[40] | S. Subhadarshani, N. Yusuf and C.A. Elmets, IL-23 and the Tumor Microenvironment, Advances in Experimental Medicine and Biology 1290: ((2021) ), 89–98. |
[41] | M.W. Teng, et al., IL-23 suppresses innate immune response independently of IL-17A during carcinogenesis and metastasis, Proceedings of the National Academy of Sciences of the United States of America 107: ((2010) ), 8328–8333. |
[42] | M.W. Teng, et al., IL-12 and IL-23 cytokines: from discovery to targeted therapies for immune-mediated inflammatory diseases, Nature Medicine 21: ((2015) ), 719–729. |
[43] | Y. Xun, et al., Toll-like receptors and toll-like receptor-targeted immunotherapy against glioma, Journal of Hematology & Oncology 14: ((2021) ), 176. |
[44] | E. Weisberg, et al., Identification of Wee1 as a novel therapeutic target for mutant RAS-driven acute leukemia and other malignancies, Leukemia 29: ((2015) ), 27–37. |
[45] | E. Guo, et al., WEE1 inhibition induces anti-tumor immunity by activating ERV and the dsRNA pathway, The Journal of Experimental Medicine 219: ((2022) ). |
[46] | H. Taniguchi, et al., WEE1 inhibition enhances the antitumor immune response to PD-L1 blockade by the concomitant activation of STING and STAT1 pathways in SCLC, Cell Reports 39: ((2022) ), 110814. |
[47] | A.B. Bukhari, G.K. Chan and A.M. Gamper, Targeting the DNA Damage Response for Cancer Therapy by Inhibiting the Kinase Wee1, Frontiers in Oncology 12: ((2022) ), 828684. |
[48] | A. Ghelli Luserna di Rora, et al., A WEE1 family business: regulation of mitosis, cancer progression, and therapeutic target, Journal of Hematology & Oncology 13: ((2020) ), 126. |
[49] | P.Q. Huang, et al., Discovery of ZN-c3, a Highly Potent and Selective Wee1 Inhibitor Undergoing Evaluation in Clinical Trials for the Treatment of Cancer, Journal of Medicinal Chemistry 64: ((2021) ), 13004–13024. |
[50] | S. Lheureux, et al., Adavosertib plus gemcitabine for platinum-resistant or platinum-refractory recurrent ovarian cancer: a double-blind, randomised, placebo-controlled, phase 2 trial, Lancet (London, England) 397: ((2021) ), 281–292. |
[51] | J.F. Liu, et al., Phase II Study of the WEE1 Inhibitor Adavosertib in Recurrent Uterine Serous Carcinoma, Journal of Clinical Oncology: Official Journal of the American Society of Clinical Oncology 39: ((2021) ), 1531–1539. |
[52] | S.S. Dinavahi, et al., Targeting WEE1/AKT Restores p53-Dependent Natural Killer-Cell Activation to Induce Immune Checkpoint Blockade Responses in “Cold” Melanoma, Cancer Immunology Research 10: ((2022) ), 757–769. |
[53] | K. Ayasoufi, et al., Brain cancer induces systemic immunosuppression through release of non-steroid soluble mediators, Brain: A Journal of Neurology 143: ((2020) ), 3629–3652. |
[54] | P. Chongsathidkiet, et al., Sequestration of T cells in bone marrow in the setting of glioblastoma and other intracranial tumors, Nature Medicine 24: ((2018) ), 1459–1468. |
[55] | M.P. Gustafson, et al., Systemic immune suppression in glioblastoma: the interplay between CD14+HLA-DRlo/neg monocytes, tumor factors, and dexamethasone, Neuro-Oncology 12: ((2010) ), 631–644. |
[56] | I.F. Parney, Basic concepts in glioma immunology, Advances in Experimental Medicine and Biology 746: ((2012) ), 42–52. |
[57] | M. Chen, et al., DNA Damage Response Evaluation Provides Novel Insights for Personalized Immunotherapy in Glioma, Frontiers in Immunology 13: ((2022) ), 875648. |
[58] | M.S. Koch, et al., Perturbing DDR signaling enhances cytotoxic effects of local oncolytic virotherapy and modulates the immune environment in glioma, Molecular Therapy Oncolytics 26: ((2022) ), 275–288. |
[59] | A.F. Haddad, et al., The immunology of low-grade gliomas, Neurosurgical Focus 52: ((2022) ), E2. |
[60] | K.N. Mohan, DNMT1: catalytic and non-catalytic roles in different biological processes, Epigenomics 14: ((2022) ), 629–643. |
[61] | K.K. Wong, C.H. Lawrie and T.M. Green, Oncogenic Roles and Inhibitors of DNMT1, DNMT3A, and DNMT3B in Acute Myeloid Leukaemia, Biomarker Insights 14: ((2019) ), 1177271919846454. |
[62] | G. Foltz, et al., DNA methyltransferase-mediated transcriptional silencing in malignant glioma: a combined whole-genome microarray and promoter array analysis, Oncogene 28: ((2009) ), 2667–2677. |


