
Identification of a novel necroptosis-related LncRNA signature for prognostic prediction and immune response in oral squamous cell carcinoma
Abstract
BACKGROUND:
Necroptosis is a caspase-independent regulated necrotic cell death modality that elicits strong adaptive immune responses, and has the potential to activate antitumor immunity. Long non-coding RNAs (lncRNAs) have critical effects on oral squamous cell carcinoma (OSCC), which are closely associated with the prognosis and immune regulation of OSCC patients.
OBJECTIVE:
This study aimed to identify a novel necroptosis-related lncRNAs signature to predict the prognosis and immune response of OSCC patients and provide patients with anti-tumor drug selection through bioinformatics analysis and in vitro experiments.
METHODS:
A series of analyses, including differential lncRNA screening, survival analysis, Cox regression analysis, ROC analysis, nomogram prediction, enrichment analysis, tumor-infiltrating immune cells, drug sensitivity analysis, and consensus cluster analysis, were performed to determine and validate the prognostic value of necroptosis-associated lncRNAs signature in OSCC. And real-time quantitative polymerase chain reaction (RT-qPCR) was used to determine the expression levels of these lncRNAs.
RESULTS:
This signature including 5 lncRNAs (AC099850.3, StarD4-AS1, AC011978.1, LINC01503, CDKN2A-DT) in OSCC associated with necroptosis were established and verified by bioinformatics. Further, ROC, K-M, univariate/multivariate Cox regression, and nomogram analysis were used to evaluate the model’s features for OSCC prognosis. Using multiple bioinformatics techniques, the levels of tumor-infiltrating immune cells, immune checkpoints and semi-inhibitory concentrations showed significant differences across risk subtypes. By consensus cluster analysis, there were significant differences between clusters in survival, immune checkpoint expression, clinicopathological correlation, and tumor immunity. RT-qPCR showed that AC099850.3, AC011978.1, LINC01503 were up-regulated, STARD4-AS1 and CDKN2A-DT were down-regulated in OSCC cell lines compared with human normal oral keratinoid cell line.
CONCLUSION:
We established 5-NRLs markers, which is useful for assessing OSCC immune response and prognosis, recommending personalized antitumor drugs. The expression level of 5-NRLs in OSCC was identified in vitro, and the results preliminarily verified this model. And this study would generate new insights for future experimental research.
1.Introduction
Oral squamous cell carcinoma (OSCC) is one of the most prevalent cancers that jeopardize human health, which makes up 40% of cases of head and neck squamous cell carcinoma (HNSCC) [1]. Despite the fast advancement of cancer therapies, the 5-year survival rate of OSCC patients is no more than 60% in the past decades [2]. Currently emerging therapeutic strategies, such as targeted therapy and immunotherapy, are gaining traction in the field of cancer treatment. The targeted therapy focuses on specific molecular markers or pathways within cancer cells, allowing for more precise treatment with fewer side effects. Immunotherapy, which harnesses the body’s immune system to fight cancer, has shown promise in various cancer types, including OSCC [3]. Among these current treatments, PD1/PDL-1 treatment has attracted much attention. Nevertheless, the overall response rate in HNSCC cases treated with PD-1 inhibitors is as low as 20% [4]. The discovery of a new regulated cell death (RCD) process, necroptosis, is expected to overcome this resistance mechanism. Therefore, it is important to identify the molecular mechanisms associated with necroptosis and OSCC occurrence and progression, explore new ideas for OSCC resistance, and identify novel prognostic risk models that are effective and reliable for the management of this type of cancer.
Since most cancers develop natural resistance to apoptosis, cell death induction pathways like necroptosis become the potential treatment modality [5]. Necroptosis is a unique type of programmed cell death (PCD) [6]. In contrast to apoptosis, necrotizing features of cells include membrane permeability, cell swelling, and the release of damage associated molecular patterns (DAMPs) [7]. Necroptosis has a significant impact on tumor biology, which leads to a potent adaptive immune response and prevents tumor progression [8]. Several therapeutic agents are currently being investigated to treat cancer by inducing or manipulating necroptosis [9]. Therefore, necroptosis-related genes probably have critical effects on assessing the prognosis and immunotherapy of OSCC.
The novel non-protein-coding transcripts known as long non-coding RNAs (lncRNAs) are
Therefore, this study constructed through bioinformatics analysis consists of five necroptosis-related characteristics of prognostic markers (AC099850.3,StarD4-AS1,AC011978.1, LINC01503, CDKN2A-DT) to predict prognosis of OSCC. Based on this signature, it could provide clues for personalized immunotherapy and sensitive drug selection for OSCC patients. Finally, to verify our findings, RT-qPCR was used to detect the expression level of 5-NRLs in OSCC.
2.Materials and methods
2.1The data extraction
The clinical information and RNA sequences of OSCC patients’ were retrieved from the TCGA database (as of March 1, 2022, https://portal.gdc.cancer.gov/ repository). Later, RNA sequence (RNA-seq) data from the TCGA database were normalized to million fragments per thousand bases (FPKM). This study only included samples with complete clinicopathological data, which were then analyzed and preprocessed using the Strawberry Perl programming language (version -5.30.0.1; https://www.perl.org) to increase the study’s accuracy. Following that, patient data were randomized to a training or testing set using the R software “Caret” package (version of 4.1.0; https://www.r-project). GSEA and previous reports yielded a total of genes associated with necroptosis.
2.2Identification of necroptosis-related signatures (NRLs) in OSCC
Using the GENCODE website (https://www.gencodegenes.org/, as of September 3, 2021) to retrieve signature GTF annotation files, 14,056 signatures were identified from the TCGA–seq HNSC RNA data to distinguish the mRNA and signature. Pearson’s correlation analysis which was considered an accepted method was used to investigate the correlation between coding genes and lncRNAs to examine the co-expression of necroptosis-related genes (NRGs) in each signature among OSCC samples. These Signatures are thought to be significantly associated with necroptosis mRNAs (for the cutoff,
2.3Construction and verification of NRLs signature for OSCC
For the purpose of screening lncRNAs in relationship to prognosis, Univariate Cox regression analysis was adopted. In addition, LASSO regression analysis was used to screen for lncRNAs that were significantly associated with overall survival (OS) in OSCC patients. This study conducted a multifactorial Cox regression analysis to generate the best model. Finally, five lncRNAs associated with necroptosis were considered as prognostic factors. RS was determined using the following formula:
2.4Establishment of nomogram and correlation between prognostic markers and clinicopathological signatures
To ensure that the NRLs signal was independent, univariate and multivariate Cox regression was used to assess the relation between clinical characteristics and NRLs markers with OS. Specifically, the role of NRLs markers as risk factors independent of additional clinicopathological characteristics like age, sex, stage, grade, and TNM classification was investigated. Survival analysis was conducted in the present study based on different clinicopathological signatures to confirm the applicability of the NRLs-based set. The “RMS” package used NOMO plots for independent prognostic factors employed to predict the OS rates of OSCC patients at 1, 3, and 5 years. Finally, receiver operating characteristic (ROC) curves were plotted to ascertain if the above factors were precise and specific in predicting the OSCC prognosis.
2.5Levels of tumor-infiltrating immune cells (TIICs)
The most recent technology was used to calculate the immune penetration status in TCGA samples, including QUANTISEQ (http://icbi.at/quantiseq), XCELL (http://xcell.ucsf.edu/), MCPCOUNTER, TIMER (version 2.0; http://timer.cistrome. org/), EPIC (http://epic. gfellerlab.org), CIBERSORT (http://ciber sort.stanford. edu/), and CIBERSORT-abs to determine the correlation between TIICs levels and a risk score. Moreover, this work also utilized the Wilcoxon test for assessing the difference in tumor invasive immune cell content of both risk groups. In addition, this study conducted Spearman’s correlation analysis to find a relationship between RS and TIICs levels. The R software limma, scales, GGplot2, and GGText packages are used for data visualization. In addition, a single-sample gene set concentration analysis (SsGSEA) score was determined to assess the concentration levels of immune-related functions in both groups. This work also detected differences in immune checkpoint (ICP) molecules between the two populations for evaluating the gene set in predicting immunotherapy for OSCC.
2.6Pathway enrichment
To clarify different pathways enriched in two risk groups, this work utilized Gene Set Enrichment Analysis (GSEA) software (version 4.10) for Kyoto Encyclopedia of Genes and Genomes (KEGG) pathway enrichment.
2.7Significance of NRLs-based signatures in antitumor drugs
This study used a “pRophetic” program package to evaluate the median inhibitory concentration (IC50) of 138 common antitumor agents, including paclitaxel, cisplatin, and imatinib, in order to predict the response to chemotherapy agents in patients with OSCC in two different risk subgroups. (AJCC) The IC50 values between the two risk groups were analyzed by the Wilcoxon signed-rank test.
2.8Consensus clustering
For exploring potential molecular subtypes in MIBC patients,the “ConsensusClusterPlus” R package was used to sort out the optimal cluster value based on determined prognostic NLRs. After that, we used the “Rtsne” R package to accomplish principal component analysis (PCA).
2.9Cell culture
Human oral squamous cell lines CAL-27, SCC-25 and normal oral keratinocytes cell lines HOK were used in this study. The cell lines were purchased from the United States Type Culture Repository (ATCC, Manassas, USA). All cells were subcultured and stored in Shanxi Province Key Laboratory of Oral Diseases Prevention and New Materials, and tested regularly to ensure mycoplasma negative. All cells were cultured in high glucose DMEM medium (Gibco, CA, USA) containing 10% fetal bovine serum (Gibco, CA, USA) and 1% penicillin/streptomycin solution at 37∘C and 5% CO2.
2.10Real-time PCR
Totol RNA was extracted from cells using the M5 Universal RNA Mini Kit(Mei5 Biotechnology,China) according to the instructions. Totol RNA(Mei5 Biotechnology,China) was then reverse-transcribed into cDNA using the M5 Hiper lncRNA cDNA Synthesis Kit with gDNA remover lncRNA cDNA. Real-time quantitative PCR amplification was performed using the M5 Hiper lncRNA Fluorescence quantitative detection kit(Mei5 Biotechnology,China). Using GAPDH as reference, the mRNA relative expression was measured by 2 - ΔΔCT. Primer sequence is shown in Supplementary Table S1.
2.11Statistical analysis
Before conducting statistical analyses, the data were checked for normality to ensure they follow the assumptions required for parametric tests. The normality of the data was assessed using the Shapiro-Wilk test and by visual inspection of Q-Q plots. If the data did not conform to a normal distribution, appropriate non-parametric tests were used. This step was critical to ensure the validity of the statistical analyses applied in the study. Statistical analysis was performed using R software (version 4.1.0). Student’s t-test and one-way ANOVA were used to calculate differences between two groups or more. The association between necroptosis-related signature genes, risk scores, and clinical signatures was calculated by the chi-square test. A log-rank test with the best cutoff value was used to plot a Kaplan-Meier (KM) survival curve to analyze OS. Further, a Cox regression model (univariate or multivariate) was used to establish the relationships between various variables with clinical outcomes. The statistical significance level was
3.Results
3.1Identification of necroptosis-related signatures (NRLs) within OSCC
Figure 1.
Flowchart. General flow is shown in the figure.
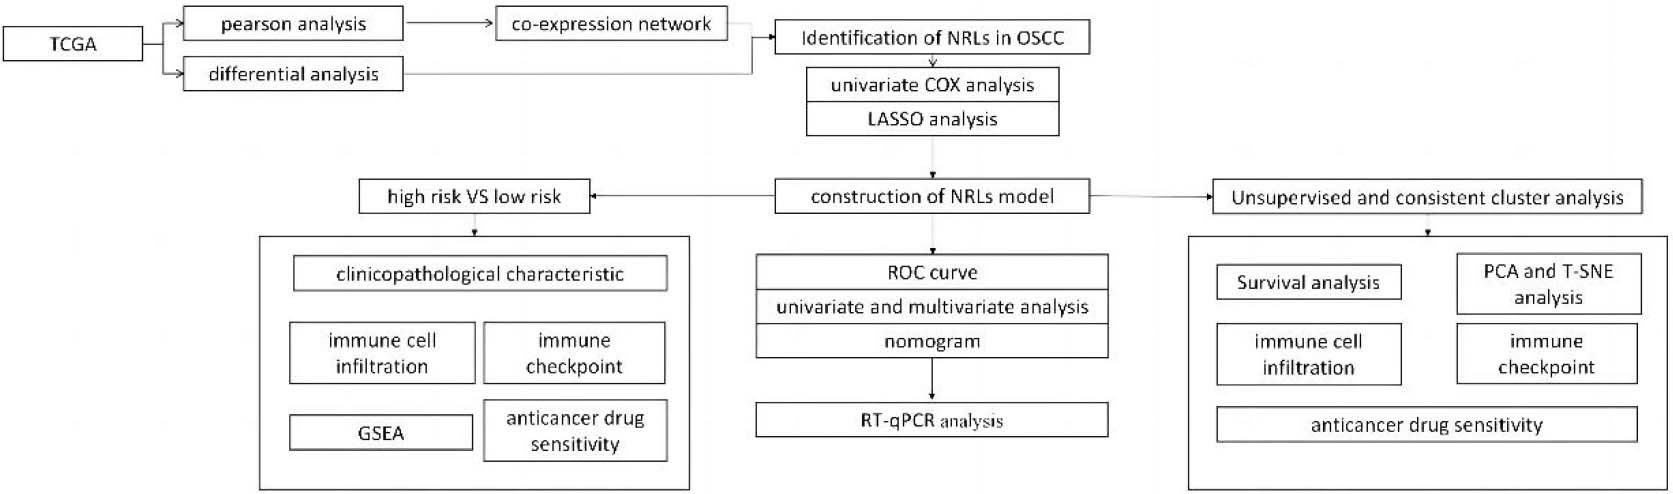
Figure 2.
Identification of different expressions of signatures associated with necroptosis in OSCC. (A) mRNA co-expression network diagram of Signatures and necroptosis. (B–C) Volcano map and heat map of long non-coding RNA (signature) with differential expression in OSCC compared with para-carcinoma samples. (
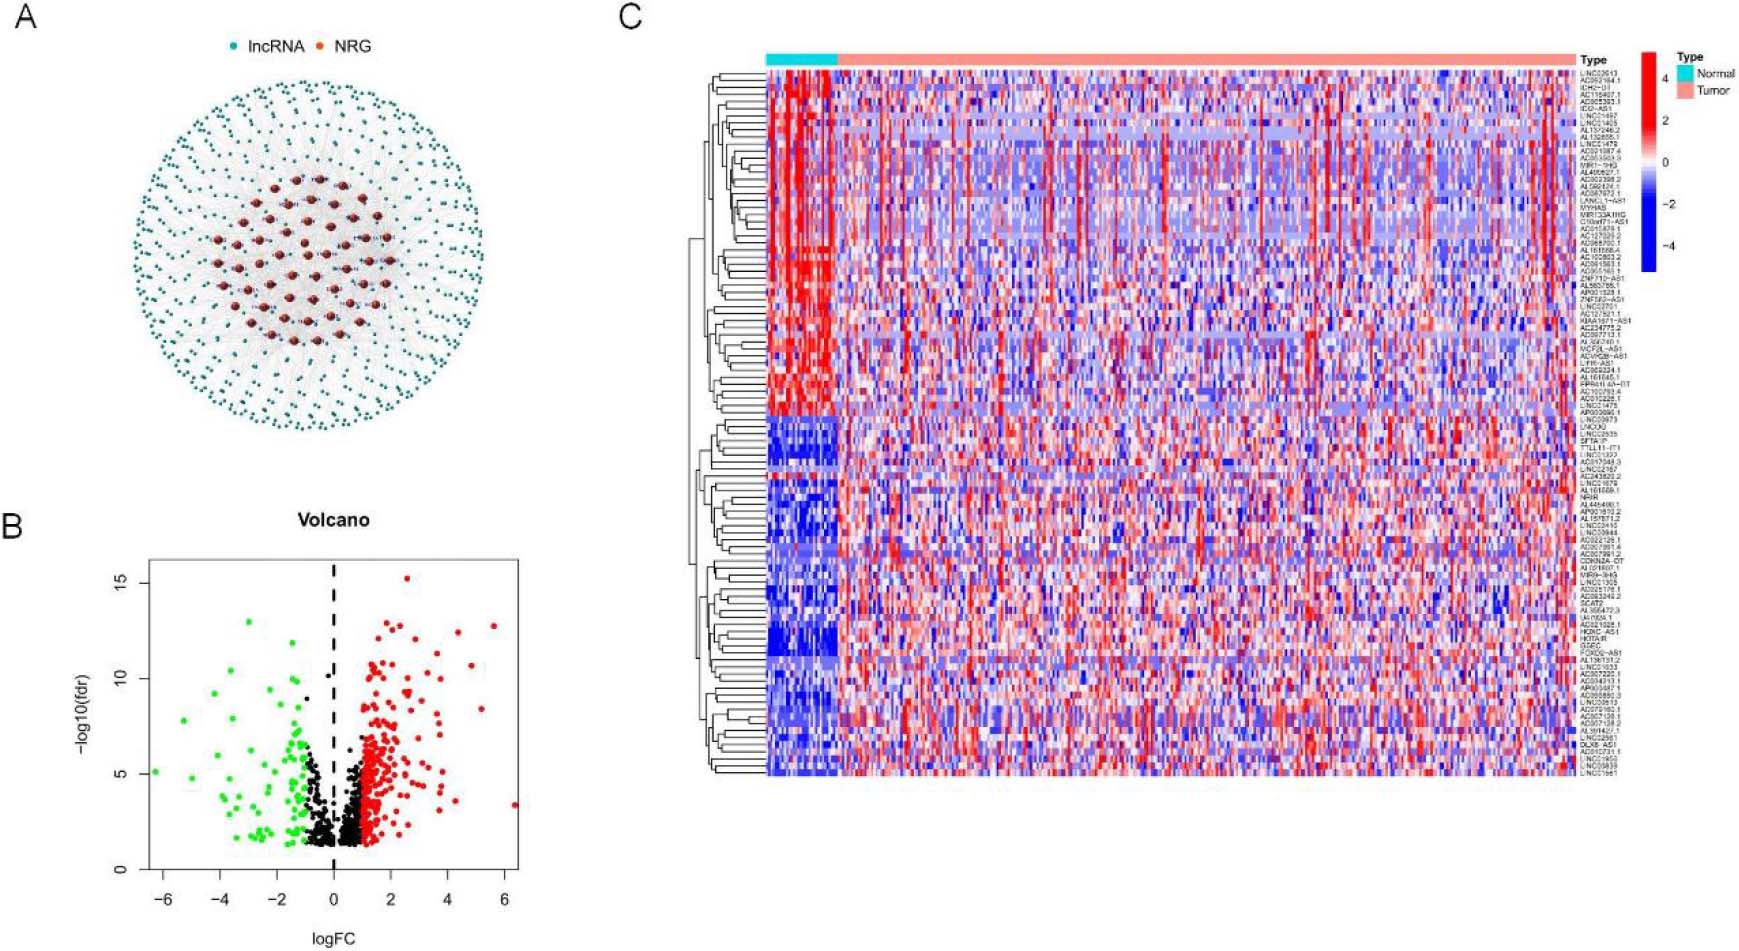
Figure 1 depicts the flow chart created in the present work. This study retrieved transcriptome RNA-Seq data from 330 TCGA-OSCC cases, including 330 OSCC tissues and 30 nearby normal tissues, with pertinent clinical information. The present study included samples with adequate clinical data for further analysis. There were 14,056 signatures detected from the TCGA-HNSC gene expression file based on the GTF annotation file for human signatures. GSEA and previous reports yielded 67 genes (nrmRNA) associated with necroptosis
(Supplementary Table S2). Pearson’s correlation analysis yielded 666 signature necroptosis-related genes (nrmRNA) with significant correlation (
Figure 3.
NRLs prognostic gene set establishment. (A) Forest map showing prognostic signatures. 8 OS-related signatures among OSCC cases were screened through univariate Cox proportional hazards regression (
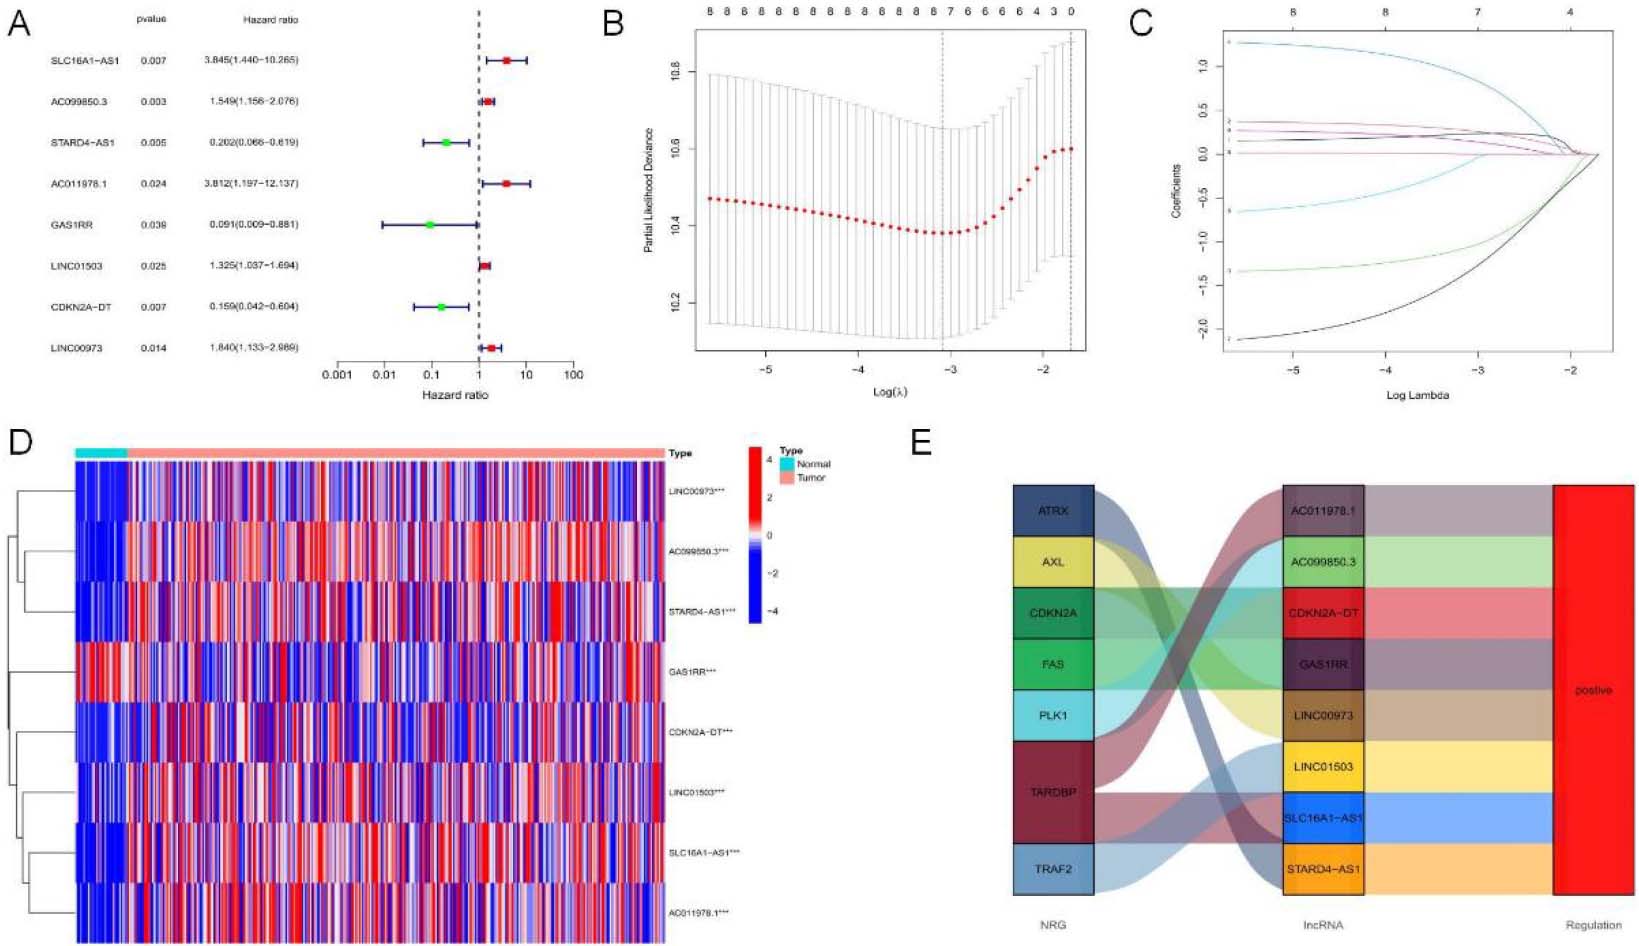
To identify lncRNAs with prognostic significance, single-factor Cox analysis was adopted for detecting 8 NRLs (SLC16A1-AS1, GAS1RR, AC099850.3, STARD4-AS1, AC011978.1, LINC01503, CDKN2A-DT, LINC00973) (
3.2Construction of NRLs signatures
To assess the prognostic risk of OSCC patients, a risk model was established with eight cuproptosis-related lncRNAs. Each OSCC patient in the TCGA database was set a risk score based on the formula: RS
3.3Analysis and validation of risk score based on 5-NRLs signature
Figure 4.
Analysis and verification of necrotic apoptosis-related signature risk score in OSCC patients. (A–C) KM analysis on low-and high-risk OSCC cases from all samples, Train group, and Test group. (D–F) Distribution of risk scores. (G–I) Scatter plot showing the relation of survival time with RS. (J–L) Heat map of 5NRLs expression profile in OSCC patients between low-and high-risk groups.
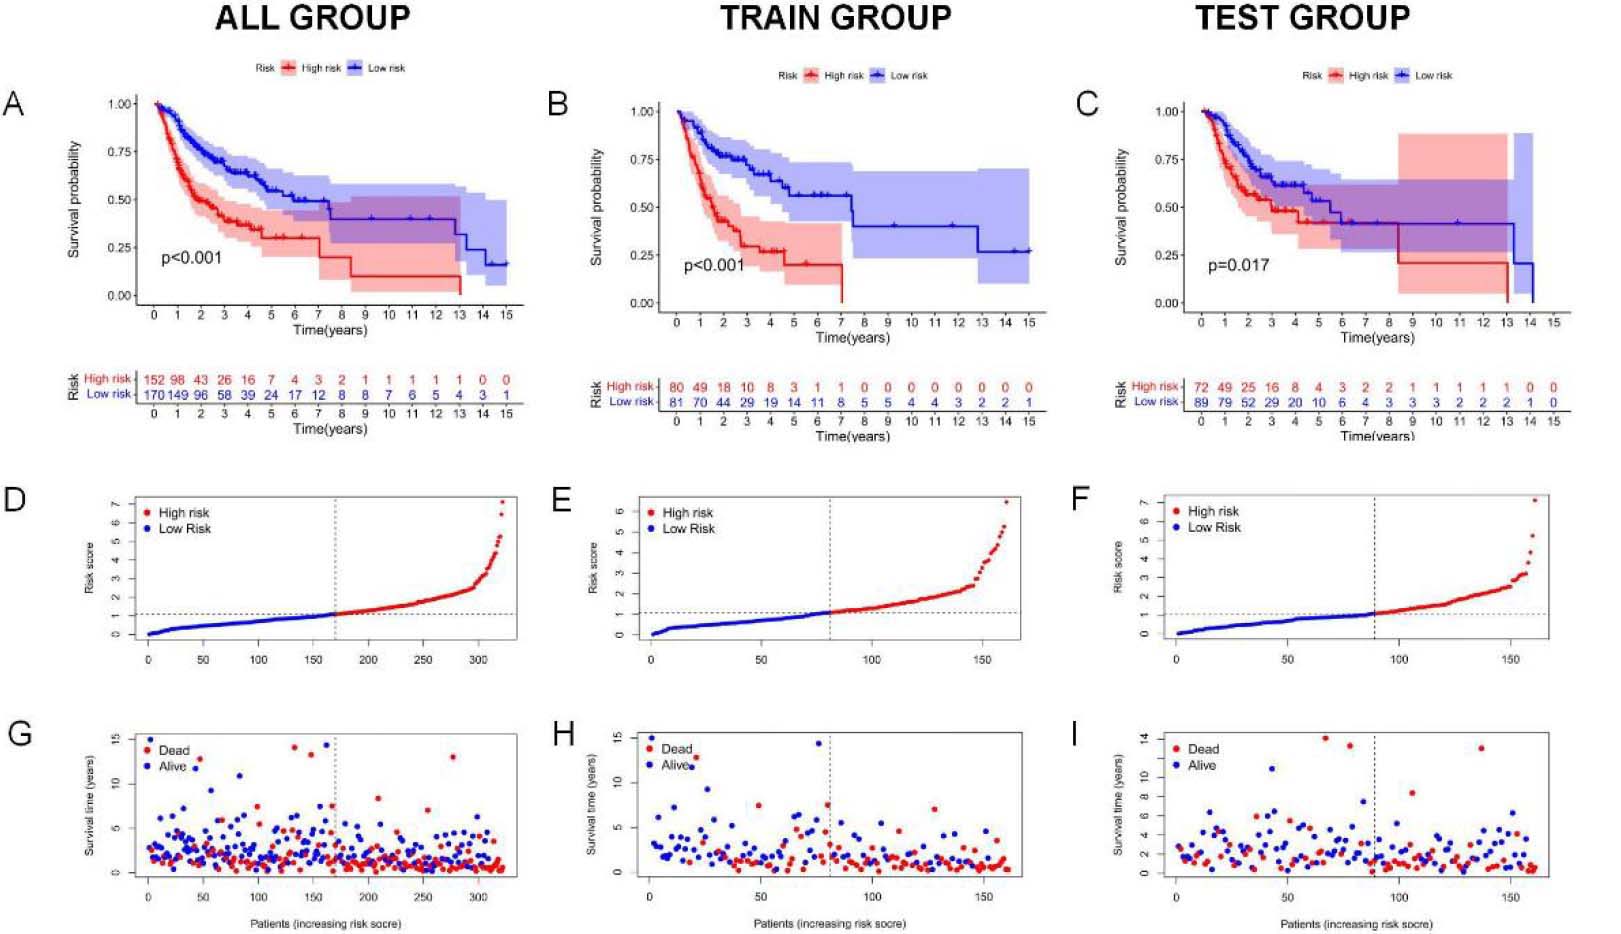
Figure 4.
continued. (M) 1-, 3-and 5-year t-ROC curves. (N) Analysis of receiver operating characteristic curve of risk score. Relative to additional clinicopathological signatures, our signature-based RS showed increased AUC.
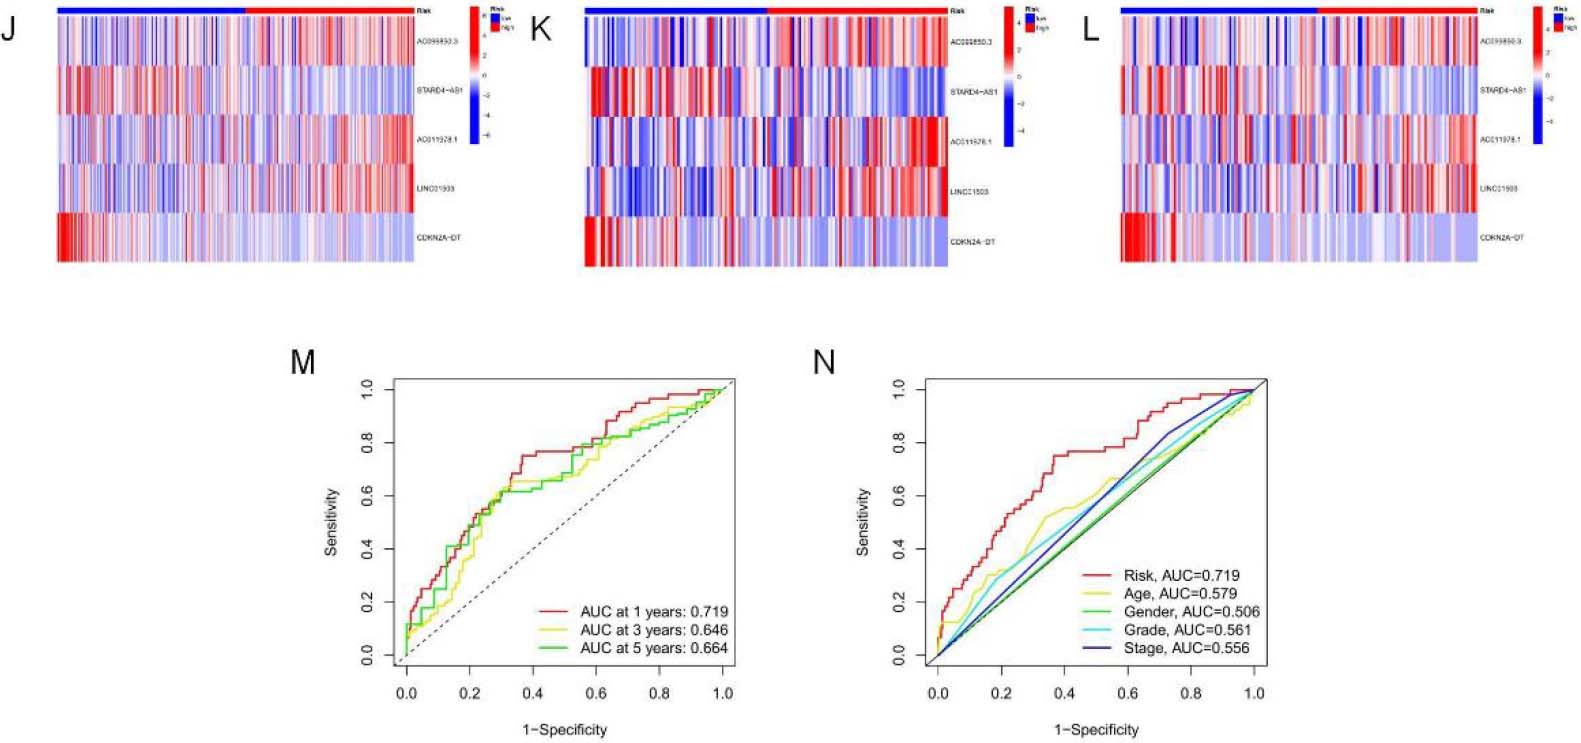
Kaplan-Meier survival analysis was used to evaluate the independent prognostic performance of the 5-NRLs prognostic gene set among OSCC cases. The high-risk group exhibited a significantly lower overall survival (OS) compared to the low-risk group (
Time-dependent ROC (t-ROC) curves for 1-, 3-, and 5-year survival were plotted to evaluate RS’s predictive performance, with the area under the curve (AUC) measuring 0.719, 0.646, and 0.664, respectively. The first-year AUC value was higher than those for the third and fifth years, indicating that the signature was particularly accurate for predicting OS in OSCC (Fig. 4M). Moreover, compared to age (0.579), gender (0.506), tumor pathological grade (0.561), and tumor stage (0.555), the AUC score for OS (0.719) was considerably higher (Fig. 4N), underscoring the utility of the constructed signature in predicting OSCC prognosis.
3.4Correlation of 5-NRLs prognostic markers with clinicopathological parameters and their independent prognostic value
Figure 5.
An Independent assessment of the association of NRLs markers with patient outcomes. (A) Univariate Cox regression showing the significant relationship between the survival and signature-based RS (
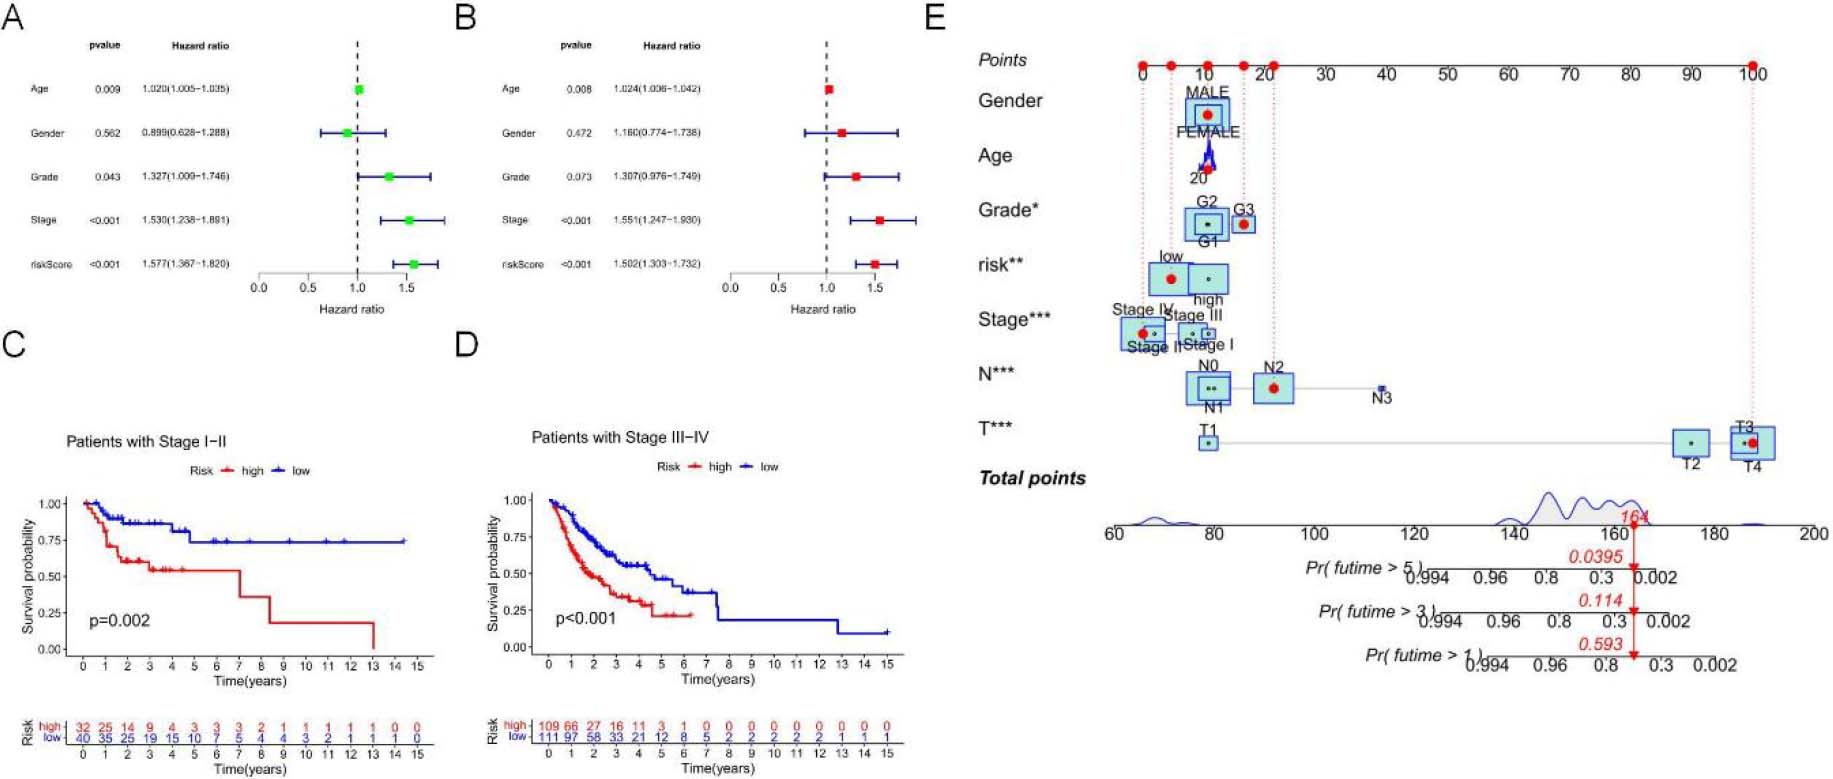
To further evaluate the role of signatures associated with necrotic apoptosis in the development of OSCC, univariate Cox regression analysis demonstrated that the risk score (RS) independently predicted OSCC prognosis (hazard ratio [HR]
Additionally, by adopting a stepwise Cox regression model, we combined the necrotic apoptosis-related RS with clinicopathological characteristics to create a clinically adaptive nomogram to estimate and quantify the 1-, 3-, and 5-year survival probabilities for OSCC patients (Fig. 5E). These findings suggest that this signature can be used for prognostic prediction.
3.5Functional analysis based on the risk model
Figure 6.
5-GSEA pathway enrichment analysis of NRLs. (A) The top 5 enriched pathways for both risk groups (B) Enriched pathways for the high-risk group. (C) Enriched pathways for the low-risk group.
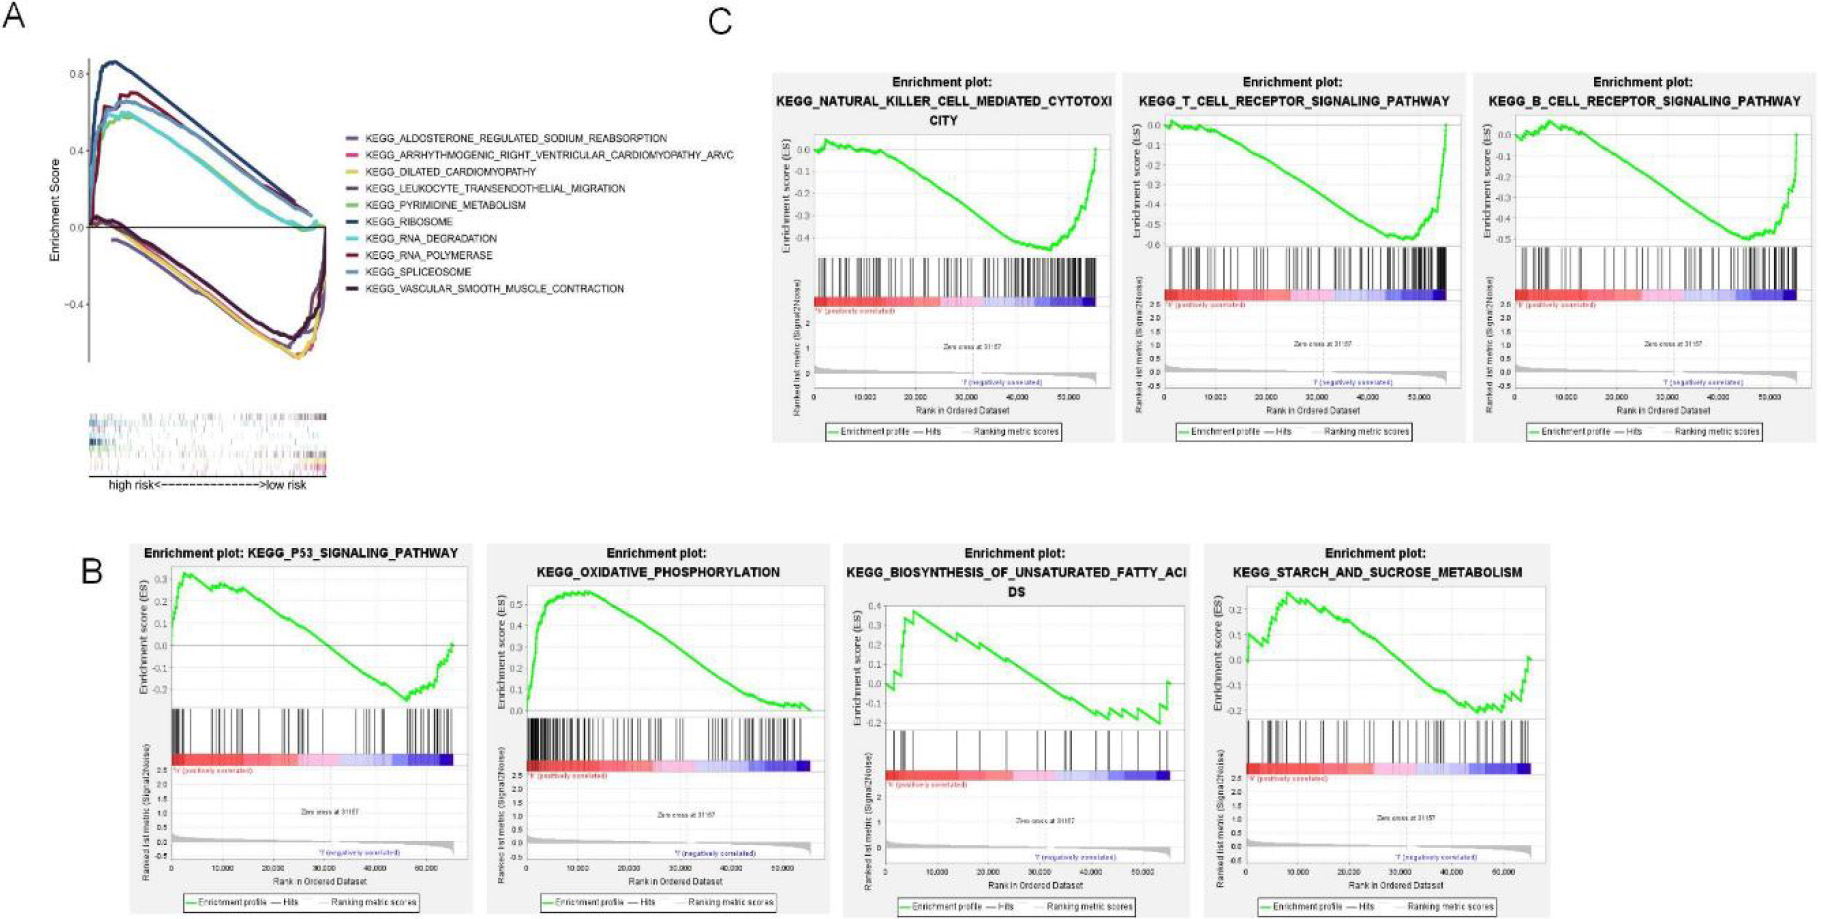
This study used GSEA to perform KEGG pathway enrichment to elucidate different pathways enriched into high-and low-risk groups. As a result, the five most significantly enriched pathways in the high-risk group included RNA polymerase, pyrimidine metabolism, spliceosome, ribosome, and RNA degradation (Fig. 6A), as well as multiple oncogenic pathways, such as oxidative phosphorylation, P53 signaling pathway, mutual conversion of pentose and glycoside, starch and sucrose metabolism (Fig. 6B). Forty-four pathways, were markedly related to the low-risk subset. Among them, the top five were arrhythmogenic right ventricular cardiomyopathy, aldosterone-regulated sodium reabsorption, dilated cardiomyopathy, vascular smooth muscle contraction, and transendothelial migration of white blood cells (Fig. 6A). B-cell receptor signaling, T-cell receptor signaling, antigen processing and presentation, and natural killer cell-mediated cytotoxicity were associated with the low-risk group (Fig. 6C). Supplementary Table S3 and Supplementary Table S4 shows all the enrichment pathways for both risk groups.
3.6TME features and TIICs for both risk groups based on 5-NRLs
Figure 7.
TME features and TIICs between two risk subpopulations based on 5-NRLS. (A) Study on the correlation of TIICs with RS. (B) TIICs in high and low-risk subsets. (C) ICP in high and low-risk subsets. (D–F) The difference in ESTIMATE score,immune score and stomal score between low-risk and high-risk groups. (G) Comparison analysis between two risk groups according to the ICP gene expression profiles (***P< 0.001; **P< 0.01; *P< 0.05).
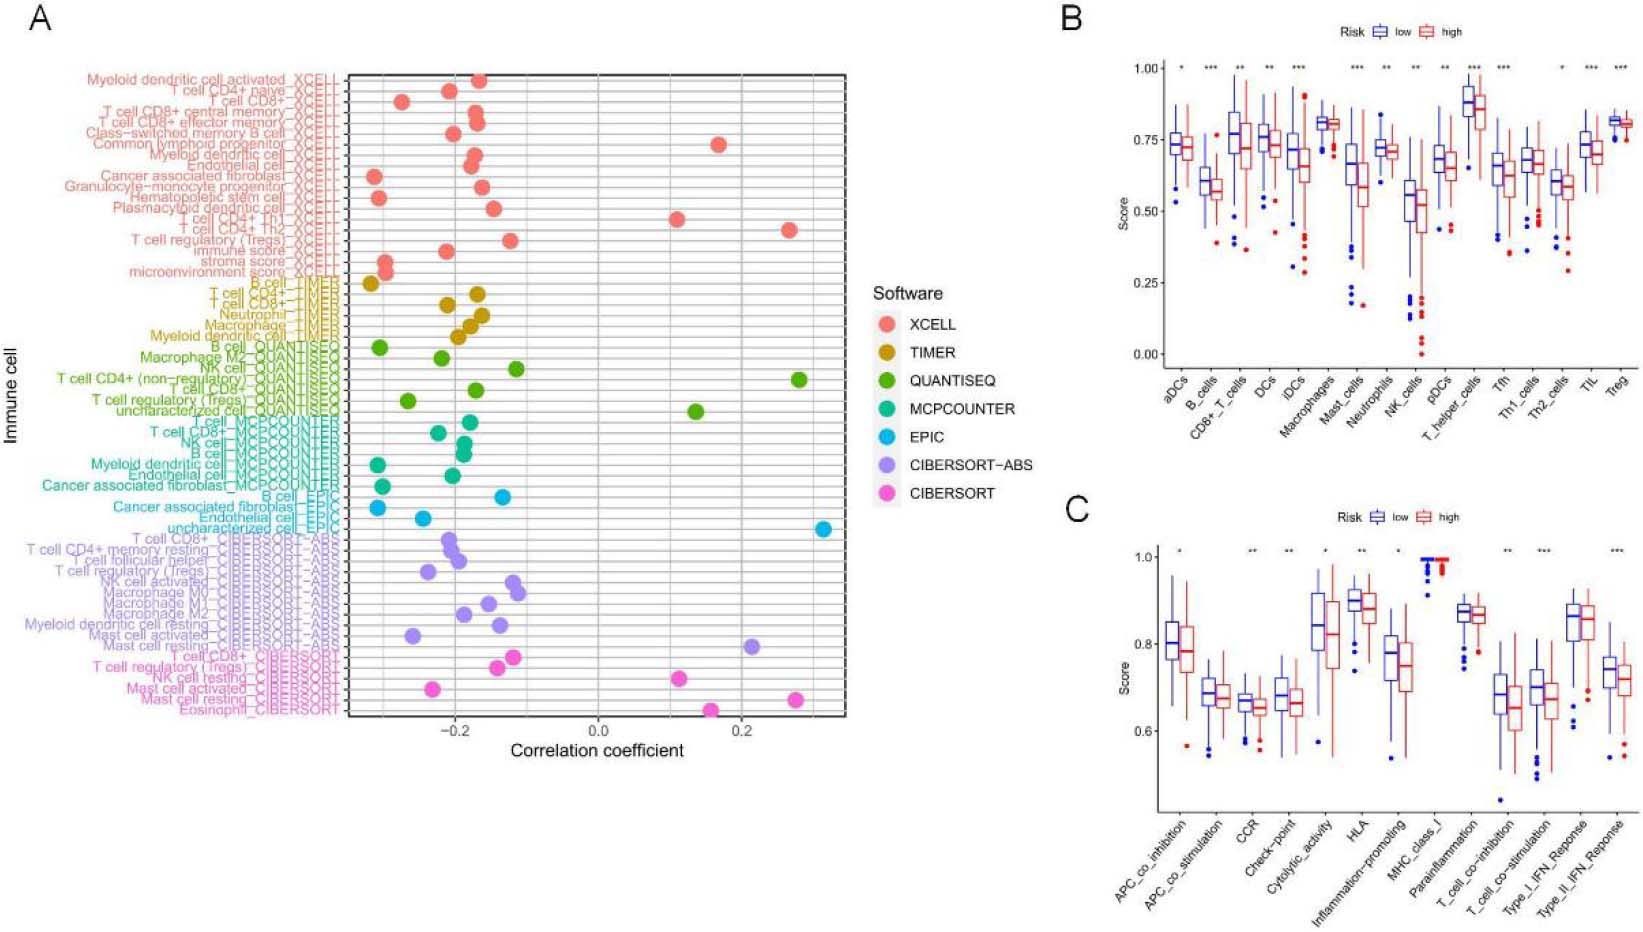
Figure 7.
continued.
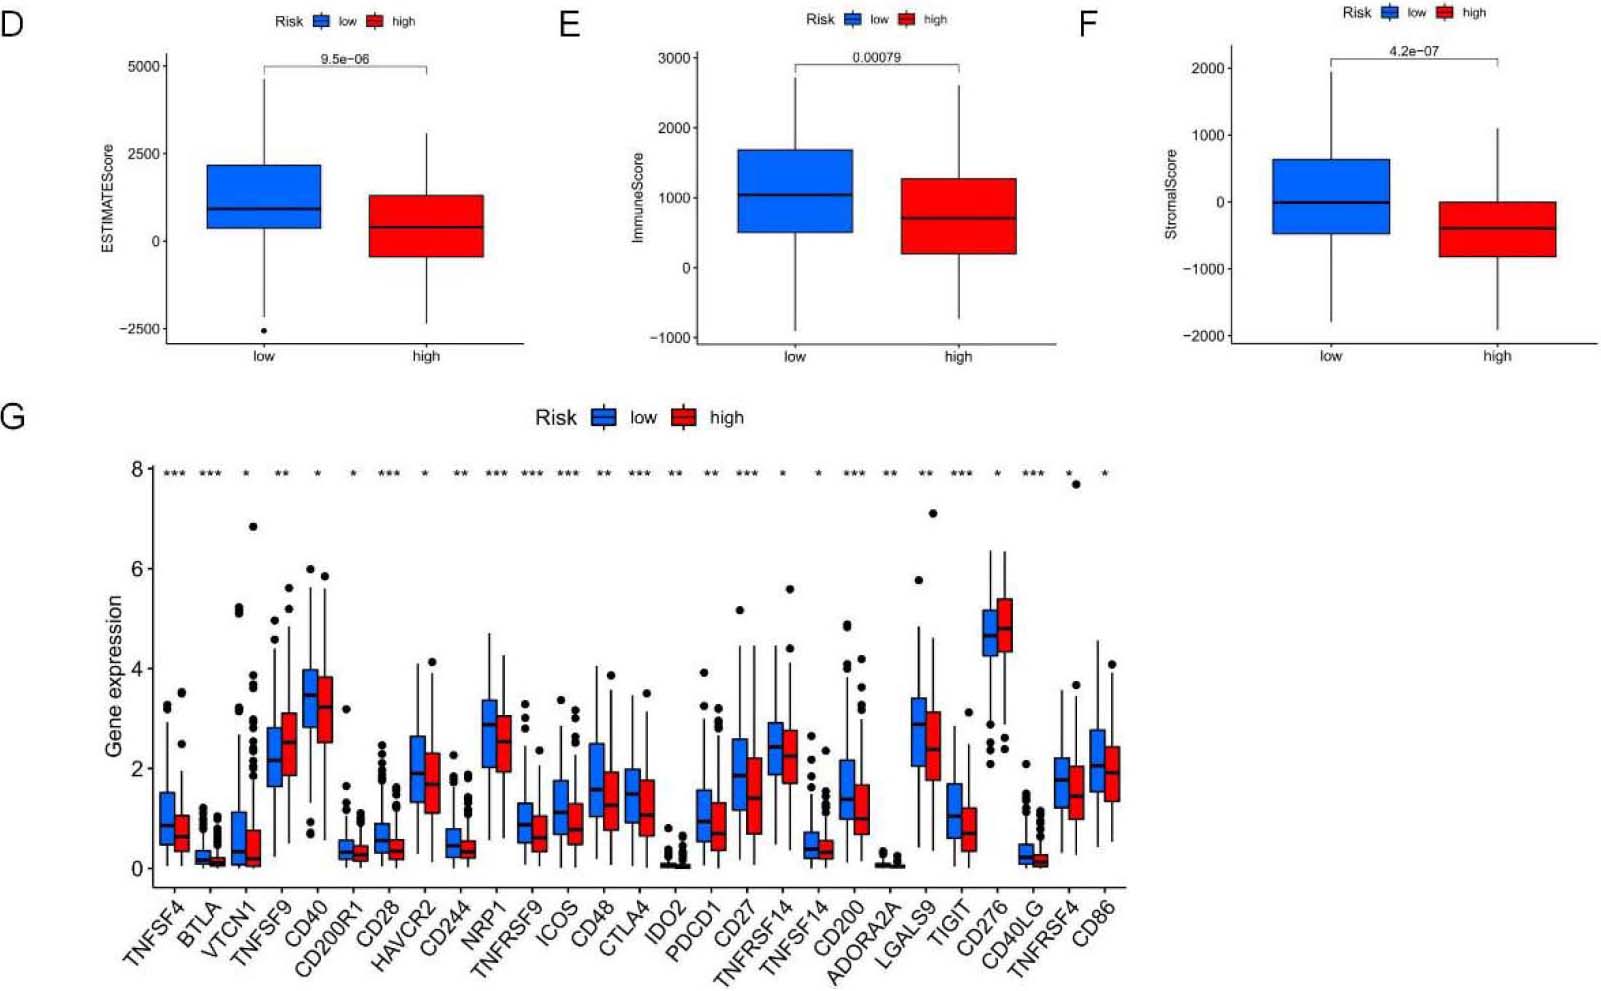
The TME comprises stromal cells, immune cells, and tumor cells. The present study used the “ESTIMATE” package to measure the significant difference in TME between two risk groups and calculate expression levels of 60 common TIICs. As a result, the infiltration levels of 10 common TIICs showed positive relations to RS, like non-regulatory T cell CD4
3.7The importance of NRLs in antitumor drugs
Figure 8.
Sensitivity analysis of 24 anticancer drugs among high-risk OSCC cases.
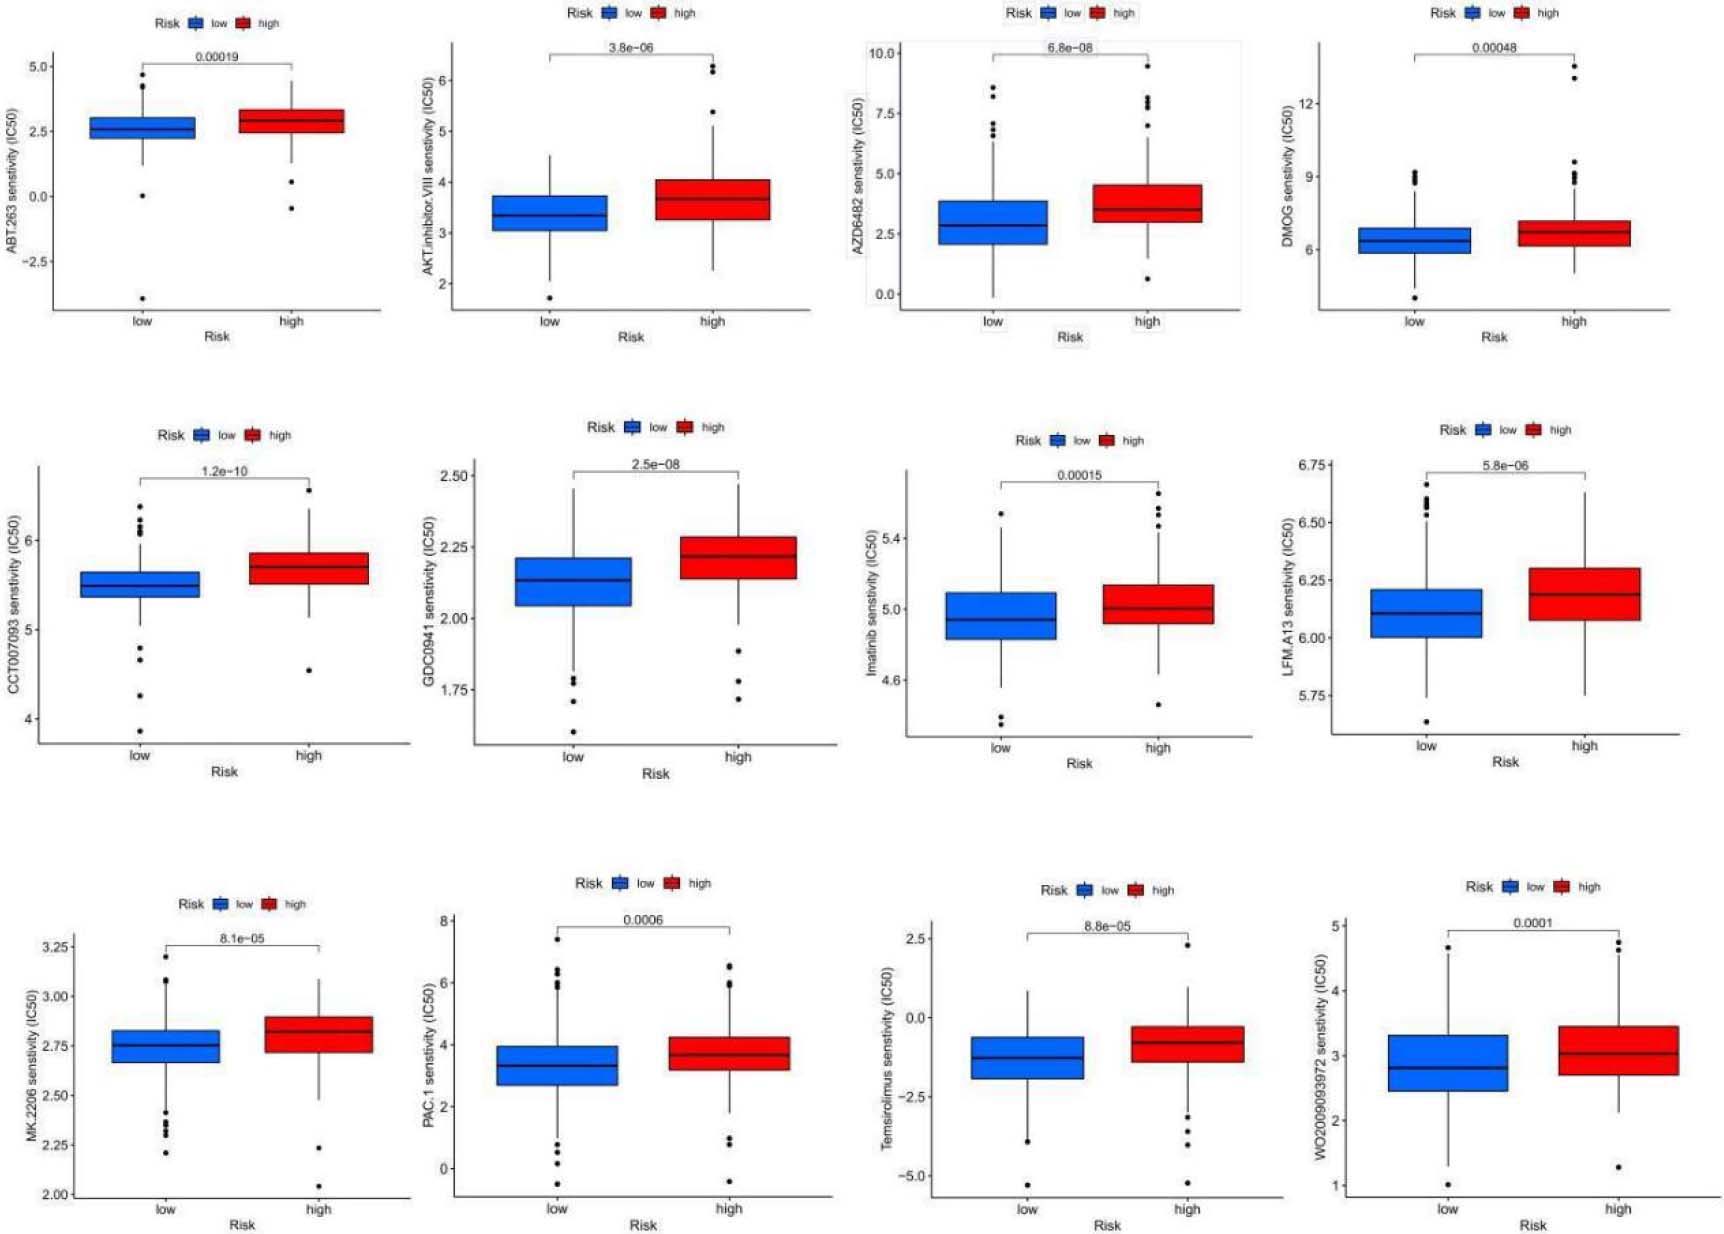
Figure 8.
continued.
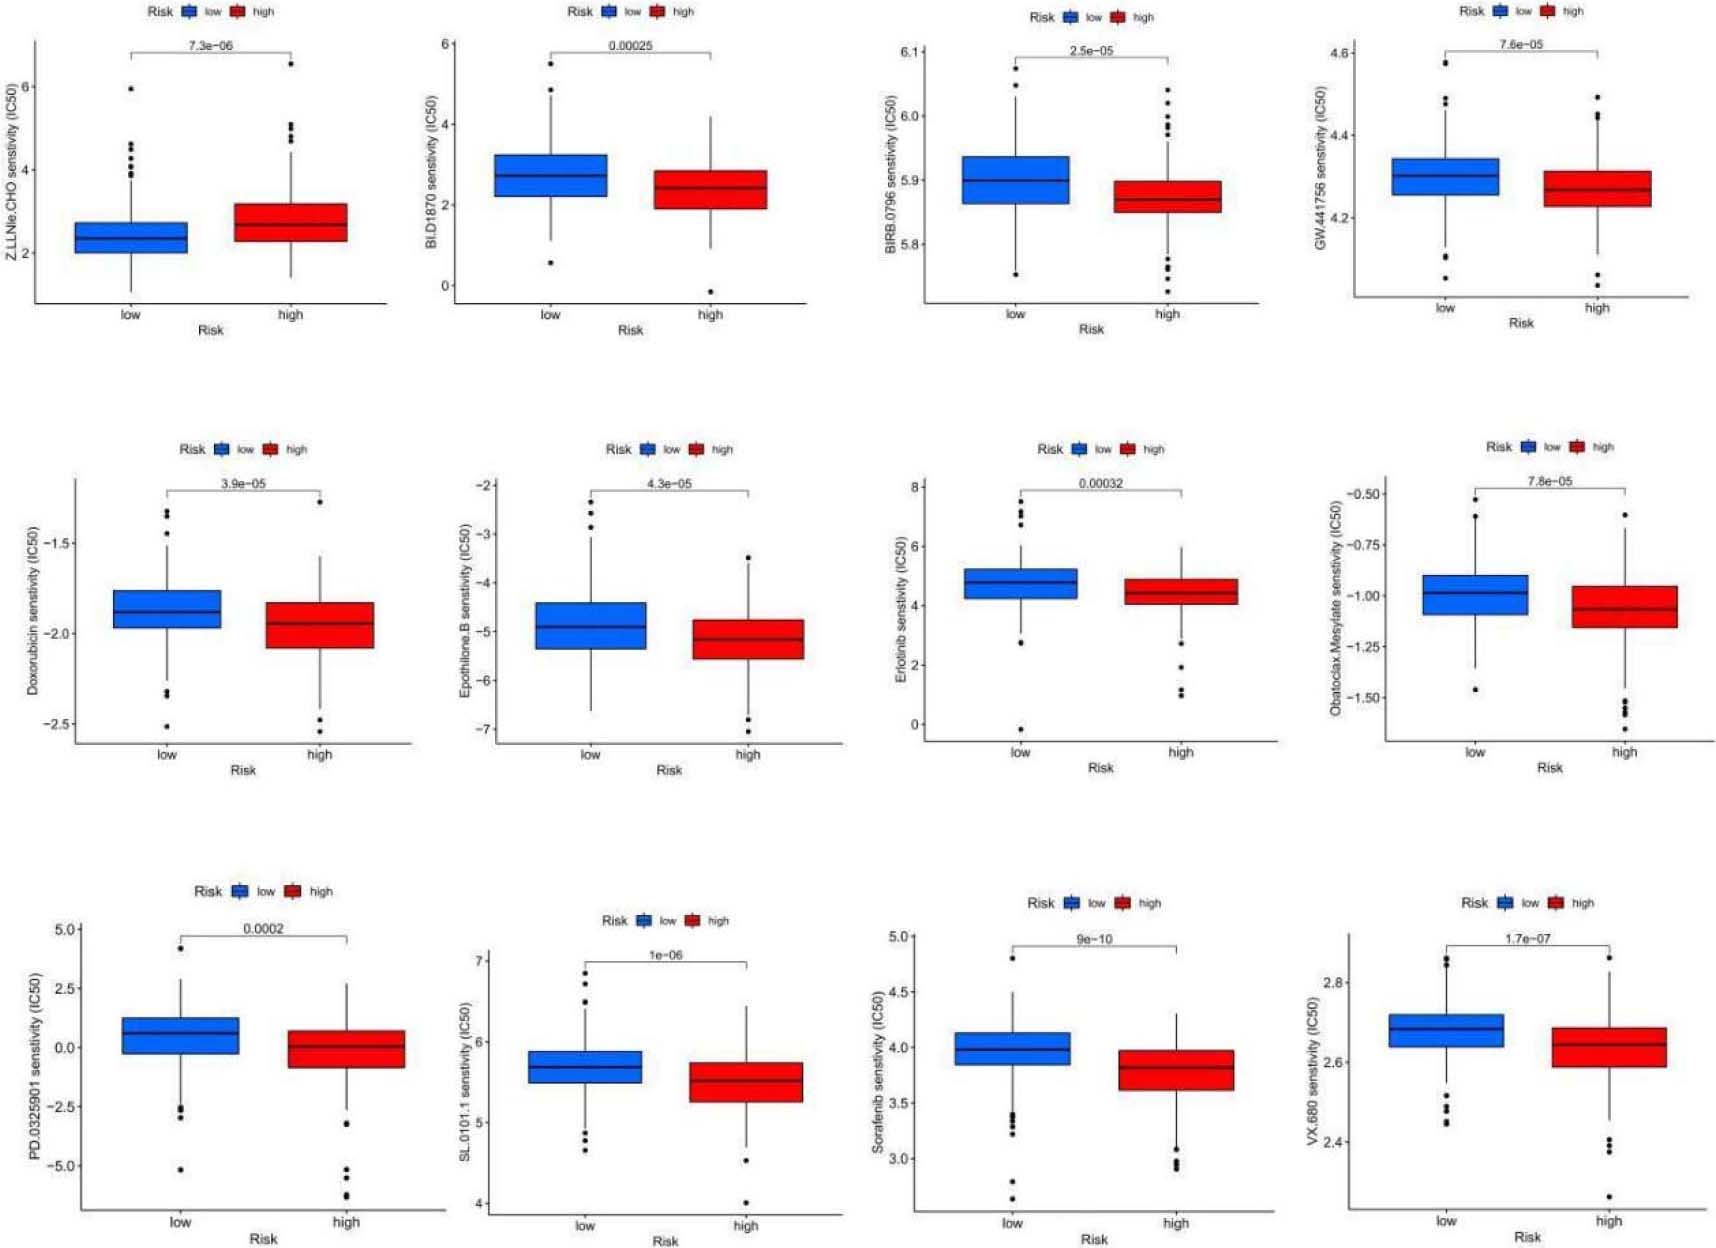
Table 1
13 antitumor drugs that are more sensitive to patients in the low-risk group
| Antitumor drugs | Description |
|---|---|
| ABT.263 | Bcl-2 inhibitor |
| AKT inhibitor | AKT inhibitor |
| AZD6482 | PI3K |
| CCT007093 | PPM1D/Wip1 inhibitor |
| DMOG | HIF-PH inhibitor |
| GDC0941 | PI3K inhibitor |
| Imatinib | BCR/ABL tyrosine kinase inhibitor |
| LFM.A13 | BTKK inase inhibitor |
| MK.2206 | Akt1/2/3 inhibitor |
| PAC.1 | Caspase activator |
| Temsirolimus | Antitumor agents acting on mTOR |
OSCC exhibits relatively low sensitivity to various antitumor drugs, limiting their widespread use in clinical practice. We used the “pRRophetic” algorithm to evaluate the half-maximal inhibitory concentration (IC50) for different chemotherapy agents in two risk groups to tailor chemotherapy accordingly. The results indicated significant differences in response to 24 anticancer drugs between the groups (Fig. 8). The low-risk subgroup showed higher sensitivity to 13 anticancer drugs, including ABT.263, AKT inhibitors, AZD6482, CCT007093, DMOG, GDC0941, Imatinib, LFM.A13, MK.2206, PAC.1, Temsirolimus, WO2009093972, and Z.llnle.CHO, suggesting that low-risk patients might benefit from these chemotherapy agents (Table 1).
Table 2
11 antitumor drugs that are more sensitive to patients in the high-risk group
| Antitumor drugs | Description |
|---|---|
| BIRB.0796 | P38MAPK inhibitor |
| BI.D1870 | ATP competitive RSK inhibitor |
| Doxorubicin | Decreased phosphorylation of AMPK and its downstream target acetyl-CoA carboxylase also induced apoptosis and autophagy |
| Erlotinib | HER1/EGFR tyrosine kinase inhibitor |
| Epothilone.B | Macrolide antitumor factors |
| GW.441756 | TRkA inhibitors |
| Obatoclax.Mesylate | Bcl2 inhibitors |
| PD.0325901 | MEK inhibitors |
| SL.0101.1 | RSK inhibitors |
| Sorafenib | The serine/threonine kinase activities of RAF-1 and B-Raf and tyrosine kinase activities of VGFR-2, VEGF-3, PDGF- |
| VX.680 | Aurora kinase inhibitor |
Conversely, the IC50 values for drugs such as Bi.d1870, BIRB.0796, Doxorubicin, Epothilone.b, Erlotinib, GW.441756, Obatoclax.mesylate, PD.0325901, SL.0101.1, Sorafenib, and VX.680 were higher among high-risk patients. This might indicate that these drugs are more suitable for cases with an elevated risk score based on the 5-NRLs characteristics (Table 2).
3.85-NRLs cluster analysis and the relationship between clusters and overall survival and tumor microenvironment
Figure 9.
5-NRLs cluster analysis and the relationship between clusters and overall survival and tumor microenvironment. (A) Clustering sample distribution. (B) Four clusters and the relationship between the overall survival rate. (C) The sankey diagram, each subgroup and the relationship between the high and low risk distribution. (D–J) PCA and T-SNE distribution in each subgroup and the relationship between the tumor microenvironment score. (K) Each subgroup immune cells expressing quantity heat map. (L) Immune checkpoint expression in each subgroup analysis of the differences. (M–N) Sensitivity analysis of PD.0325901 and PD.0332991 among clusters.
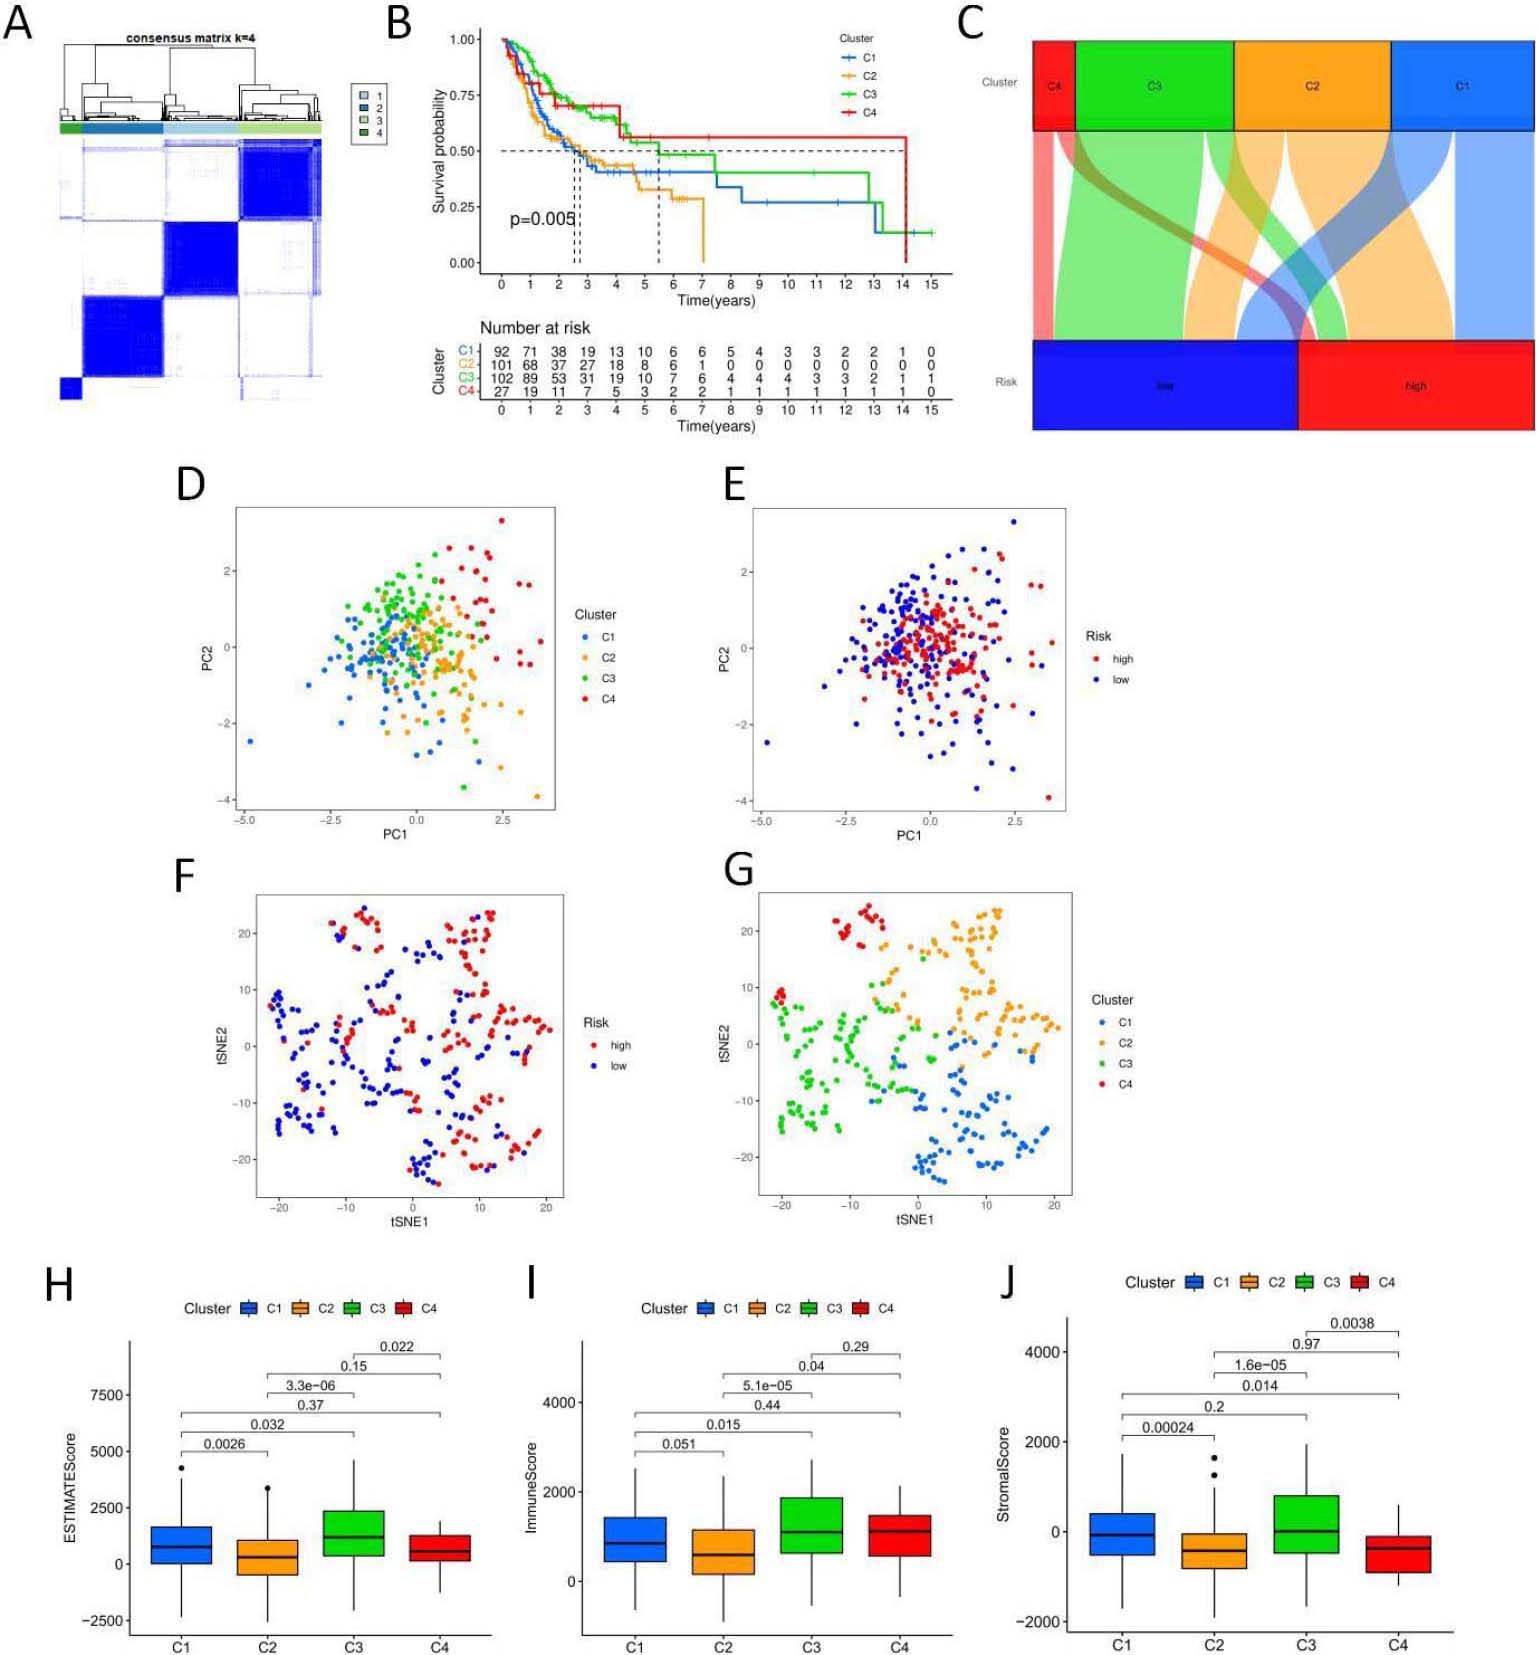
Figure 9.
continued.
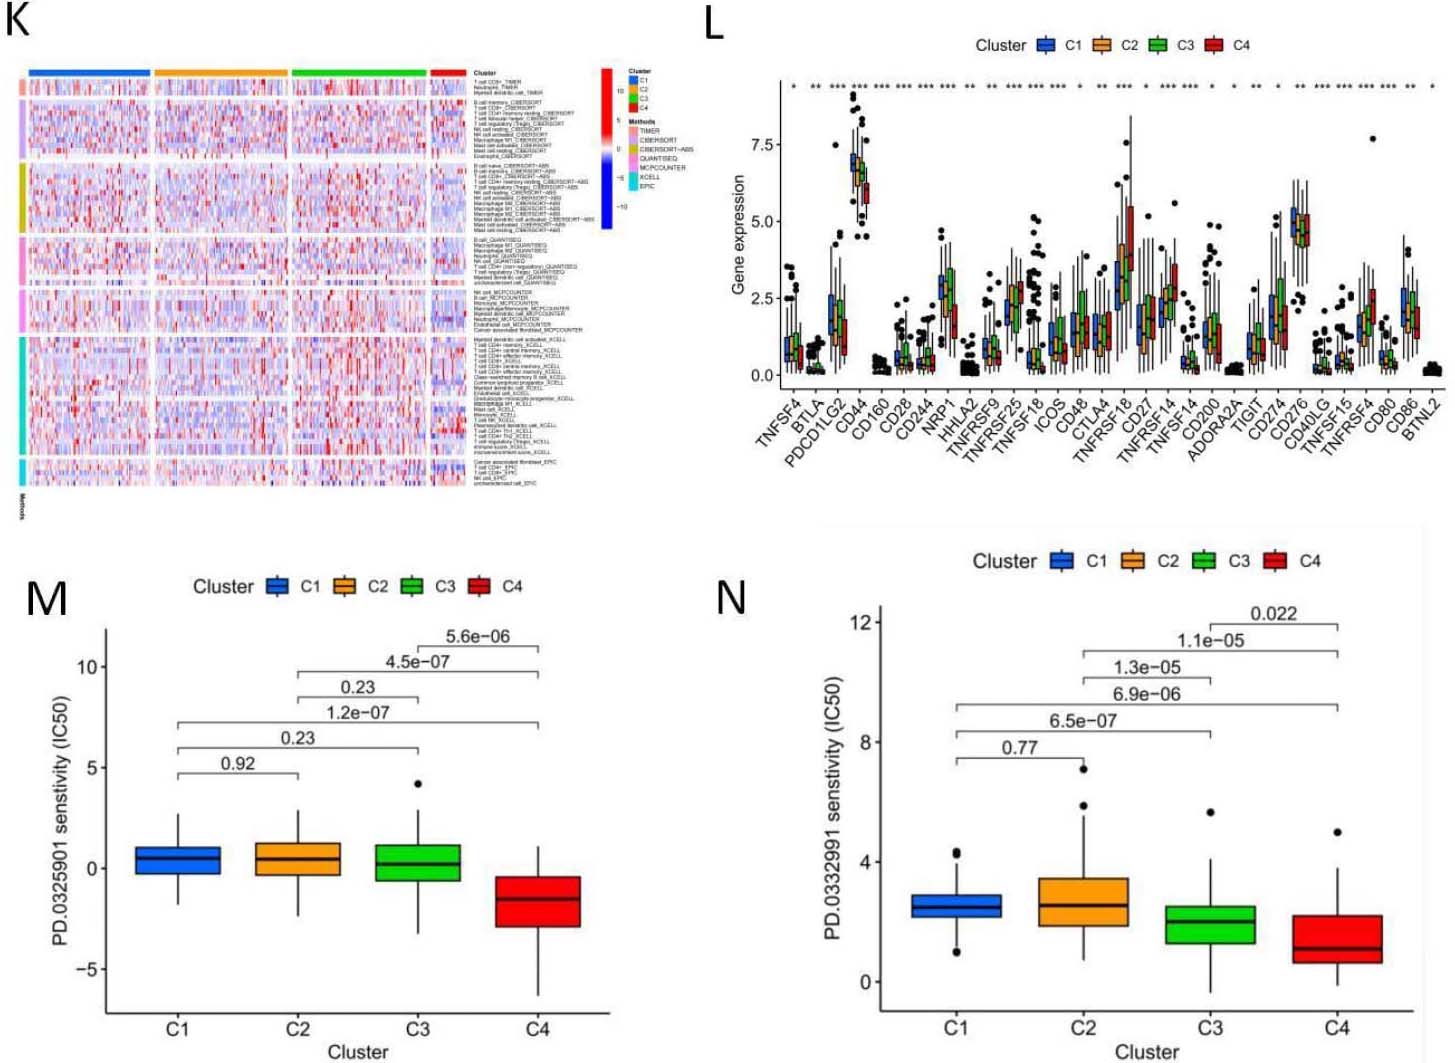
To explore the relationship between genes associated with necrotic apoptosis and OSCC subtypes, we performed an unsupervised and consistent cluster analysis based on the expressions of necrotic lncRNAs by changing the cluster variable (k) from 2 to 9 through Consensus ClusterPlus R package (Fig. 9A). The distribution diagram of cluster samples with
3.9Verification of 5- NRLs expression levels in OSCC
Figure 10.
The expression of 5-NRLs in oral normal keratinoid epithelial normal cell lines and OSCC cell lines was determined by RT-qPCR. (A) AC011978.1; (B) AC099850.3; (C) LINC01503; (D) CDKN2A-DT; (E) STARD4-AS1; (*P< 0.05, **P< 0.01 and ***P< 0.001, ns: non-significant).
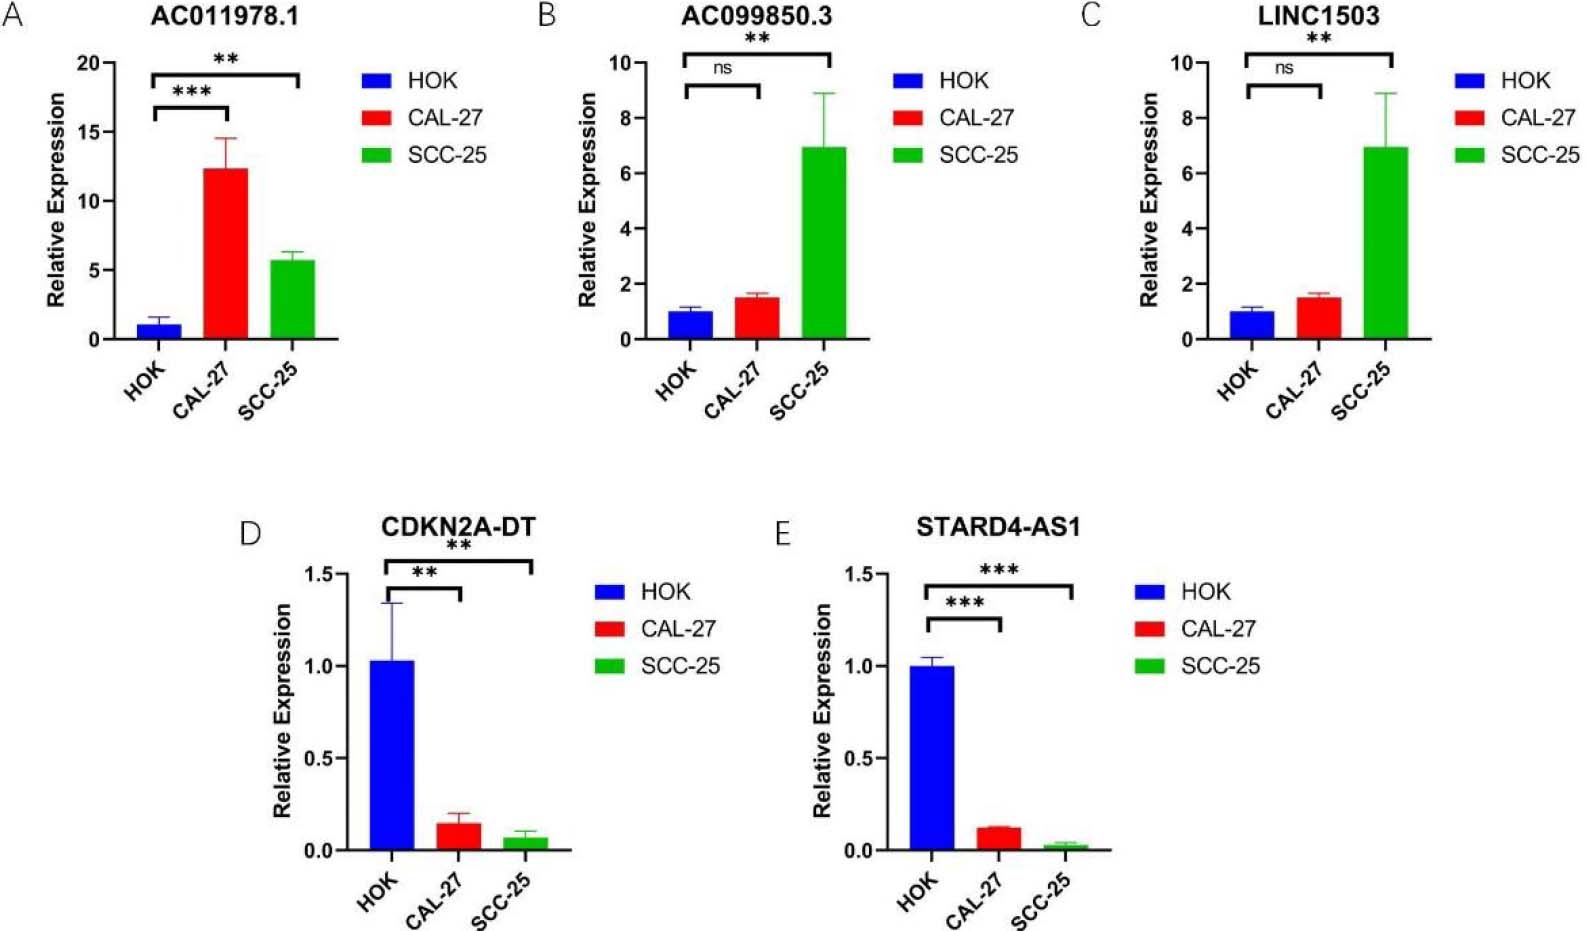
In order to further explore the expression of 5-NRLs, we used RT-qPCR analysis. The data were analyzed using one-way ANOVA to compare the expression levels across the human normal oral keratinocyte line (HOK), SCC25, and Cal27 cells. The results showed that compared with HOK, the expression levels of AC099850.3, AC011978.1, and LINC01503 were up-regulated in SCC25 and Cal27 cells (Fig. 10A–C). However, the expression levels of STARD4-AS1 and CDKN2A-DT were down-regulated in OSCC cell lines (Fig. 10D–E). Overall, these experimental results further validate the reliability of our established risk model and suggest that 5-NRLs may play an important role in the occurrence and progression of OSCC.
4.Discussion
Necroptosis, a novel, tightly controlled cell death mode, is primarily regulated by activating RIPK1 and RIPK3, which is then carried out via MLKL (phosphorylation, membrane translocation, and oligomerization), ultimately inducing cell death [15]. Several key molecules of the necrotizing signaling pathway are downregulated in different types of cancer cells [8]. RIPK3 expression, for instance, was reduced in cancer patient samples [16, 17], including colorectal cancer (CRC) [18, 19], breast cancer (BC) [17], melanoma [16], and acute myeloid leukemia (AML) [20, 21], implying that cancer cells may escape the necrotizing signaling pathway to survive. Antitumor drugs are ineffective because tumor cells have inherent or acquired caspase-dependent apoptosis resistance. To a large extent, the resistance to apoptosis induced by anticancer drugs is a hallmark of cancer, and it is the major obstacle to chemotherapy failure in cancer treatment. The resistance to apoptosis is expected to overcome the shortcomings of traditional apoptosis-inducing chemotherapy drugs through their apoptosis-independent properties. Recent studies have shown that immunogenic substances released by necroptosis can exert potent antitumor immune effects together with ICP blockade [22]. Therefore, induction of necroptosis may offer promising therapeutic prospects, especially for patients resistant to conventional chemotherapy or immunotherapy.
Many studies have demonstrated the effect of lncRNAs on the genesis, metastasis, and progression of OSCC, predicting survival as novel biomarkers. The lncRNA CASC9, for example, increases cancer occurrence by inhibiting autophagy-dependent apoptosis of OSCC via the AKT/mTOR pathway [23]. Recent research has identified lncRNAs based markers for cancer prognosis, such as ferroptosis-related lncRNAs, m6A methylation-driven lncRNAs, and autophagy-related lncRNAs in OSCC. However, research on the effects of necroptosis-related lncRNAs in OSCC is severely lacking. Therefore, the present work built the risk coefficient model necessary to assess the prognosis of OSCC patients according to necroptosis-associated lncRNA pairs. It is essential to study NRL’s molecular features and prognostic significance among OSCC patients in diagnosis and immunotherapy.
At present, several studies have used LASSO regression to construct prognostic prediction models because of its own advantages [24, 25]. Firstly, LASSO can automatically select significant variables by shrinking some regression coefficients to zero, effectively removing less impactful predictors. At the same time, LASSO mitigates the risk of overfitting by constraining the size of regression coefficients, further improving the model’s generalization capability. This characteristic makes LASSO an ideal choice for prognostic models, as it reduces model complexity and enhances interpretability. Although due to the complexity of cancer prognosis, a small percentage of gene expression may not be enough to influence all the potential factors for survival. However, compared with other commonly used methods to construct prediction models, including stepwise Cox regression [26], random forest [27] and artificial neural network [28], LASSO regression is still favored in the construction of prognosis prediction models for its unique advantages [29, 30] .
Therefore, in this study, we identified, generated, and tested the applicability and prognostic features of lncRNAs associated with necroptosis(AC099850.3, StarD4-AS1, AC011978.1, LINC01503, and CDKN2A-DT) by taking advantage of these methods. AC099850.3 and Linc01503 are lncRNAs in the model that play an important role in cancer development. However, there are no reports of lncRNAs (StarD4-AS1, CDKN2A-DT, and AC011978.1) and their role in predicting the prognosis of necroptosis to date. As a result, more extensive research into lncRNAs and their effects on OSCC and tumor cell necroptosis are required.
AC099850.3 has a critical effect on cancer. AC099850.3, for example, has been shown to significantly promote HCC cell growth [31], invasion, and migration via the PRR11/PI3K/AKT pathway [32]. Furthermore, the correlation analysis revealed that AC099850.3 had a significant effect on the TIME of HCC, with a positive correlation with ICP molecules (such as PD-1, PD-L1, PD-L2, and CTLA4), which was consistent with our findings. According to our results, AC099850.3 showed high expression within tumors and is tightly associated with lung adenocarcinoma (LUAD) [33] and non-small cell lung cancer (NSCLC) [34] genesis and progression. Besides that, AC099850.3 showed a relation to autophagy, which predicted OS in OSCC patients [32], suggesting AC099850.3 as an oncogene for OSCC prediction. However,no studies have shown that related drugs can directly act on this target to play an important role in cancer, and further research is needed.
Linc01503 is a novel signature located on human chromosome 19, possibly associated with the occurrence of human cancer [35]. Linc01503 was the first oncogene in invasive squamous cell carcinoma (SCC) [36]. According to previous research, cancers such as cervical cancer, gastric cancer (GC) [35, 37], hepatocellular carcinoma (HCC) [38], cholangio-carcinoma [39], ovarian cancer [39], and NSCLC [29, 40]. May be significantly affected by linc01503.
According to our results, KM analysis indicated the relation between the high-risk group and dismal OS. The relationship between RS and its clinical features was further examined. As a result, necroptosis-related RS was remarkably positively related to tumor stage, tumor-lymph node metastasis (TNM) stage, and pathological grade. The increased RS value predicts the more advanced tumor pathological grade, TNM stage, and dismal survival. The necroptosis-associated signature scoring model constructed using the ROC curve was highly sensitive and specific, with remarkably enhanced predictive ability compared with additional clinicopathological features, providing patients with personalized biomonitoring.
We performed a functional annotation to explore the possible alterations across risk groups. Further, we found that multiple metabolic and immune infiltrating pathways were significantly enriched in the high-risk and low-risk groups, respectively. TIICs infiltrating into TME usually progress with tumor initiation and progression. According to our results, the low-risk subgroup showed increased immune scores based on TME scores, confirming functional enrichment. The association between TIICs and the high-risk group was then examined using seven widely used approaches, namely, XCELL, TIMER, QUANTISEQ, CIBERSORT, MCPCOUNTER, EPIC, and CIBERSORT-abs. The high-risk group showed a positive correlation with TIICs like CD4
Recently, ICI-based immunotherapies for cancer have attained great clinical success [23]. Given its importance, we examined the differences in ICP molecules of both risk subpopulations to assess whether OSCC cases were sensitive to immunotherapies. According to ssGSEA analysis, nine ICP levels, namely, APC costimulation, CCR, CD8
Antitumor drug therapy combined with immunotherapy has become the prime treatment modality for oral squamous cell carcinoma. The FDA approved nivolumab and pembrolizumab for use in oral cancer treatment in 2016 [41]. Pembrolizumab, also called MK-3475, represents the first PD-1 mab approved for use in relapsed or metastatic head and neck squamous cell carcinoma (HNSCC) in clinical trials. Clinical study results, on the other hand, revealed that 49.3% of patients had stable disease or partial response, with 78% showing PD-L1 positivity, resulting in a 20% response rate. The rate of side effects was low, with 7.6% of drug-related adverse reactions being grade III or higher in 86% of cases [42]. Because TME alteration may be associated with immune-targeted resistance, it is critical to find new drugs with high sensitivity for clinical treatment. We compared common antitumor drugs for their sensitivity between high-and low-risk subgroups. As a result, 24 drugs were sensitive between the two risk subgroups, most of which were targeted therapy drugs, and 93 drugs showed sensitivity in four clusters, including PD.0332991 and PD.0325901, thus providing new ideas for guiding clinicians to select appropriate anticancer drugs for OSCC patients. Therefore, we anticipate that the best approach to cancer therapy may involve focusing on the genes that cause necroptosis. Nonetheless, the mechanisms of such agents in affecting necroptosis gene expression and cancer development require further investigation.
In addition, the preliminary verification by RT-qPCR showed that AC099850.3, AC011978.1, LINC01503 were up-regulated in OSCC cell line compared with human normal oral keratinoid cell line (HOK). The expressions of STARD4-AS1 and CDKN2A-DT were down-regulated in OSCC cell line. The results of RT-qPCR proved the accuracy of our prognostic model to a certain extent. Therefore, the 5-NRLs marker found in our study provides a new target for future mechanism studies and a certain basis for further in vivo and in vitro experimental studies.
The data for this study were sourced from the TCGA (The Cancer Genome Atlas) database, which is recognized globally for its high-quality genomics and clinical data. There are several advantages to using the TCGA database for our analysis. TCGA contains a significant number of cancer samples across various cancer types, providing researchers with ample data for analysis and the potential to draw reliable conclusions. TCGA offers not only transcriptomics data but also genome sequencing, methylation, proteomics, and clinical information. This diversity allows researchers to analyze and validate data from multiple perspectives. To ensure that our research is based on high quality and reliable data, we chose the TCGA database. Nevertheless, there are some limitations which is expected to be improved. Firstly, we encountered some clinical features with missing data in the TCGA dataset. To ensure the accuracy and consistency of the analysis, we deleted the samples with missing values to avoid potentially misleading results. In future studies, more sophisticated ways to process the lost data need to be explored. Secondly, the GEO dataset has good applicability, and adding additional cohorts in future studies can indeed further strengthen the robustness of the results, and the GEO cohorts is worth being investigated next.
There are several limitations to our current study. Although the expression of 5-NRLs in oral squamous cell cancer cell lines has been preliminarily validated, more sample sizes are needed for human tissue experiments to determine the participation of signatures and the interactions between 5-NRLs, and to verify the accuracy of these signatures. Finding from this research have to be backed up with in vitro or in vivo experiments which will have more value. And although bioinformatics was used to preliminarily screen chemotherapy sensitivity and ideal drugs, these results need to be further studied through clinical trials supplementing chemotherapy drug treatment cohorts. Furthermore, it is planned to explore metabolomics, ATAC-omics, and proteomics in future studies, which will add power and credibility to our study.
5.Conclusions
A necroptosis-related risk model was established based on 5-NRLs (AC099850.3, StarD4-AS1, AC011978.1, LINC01503, CDKN2A-DT) to predict the prognosis of OSCC in this study, and this model should facilitate the selection of immunotherapy and antitumor drugs for OSCC patients with different risk levels. The expression level of 5-NRLs in OSCC was identified in vitro, and the results preliminarily verified this model. In vivo and animal experiments will be further carried out in the future.
Author contributions
Conception: Lanting Ji.
Interpretation or analysis of data: Lanting Ji and Shuang Liang.
Preparation of the manuscript: Lanting Ji.
Revision for important intellectual content: Ruifang Gao, Wenpeng Yan, YaHsin Cheng.
Supervision: Fang Pang and Fang Zhang.
All authors agree to be accountable for all aspects of work ensuring integrity and accuracy.
Ethical approval
Ethical approval is not applicable for this article.
Human and animal rights
This article does not contain any studies with human or animal subjects.
Informed consent
There are no human subjects in this article and informed consent is not applicable.
Availability of data and materials
Publicly available datasets were analyzed in this study. This data can be found here: TCGA (https://portal.gdc.cancer.gov/repository).
Supplementary data
The supplementary files are available to download from http://dx.doi.org/10.3233/CBM-230407.
Acknowledgments
This study was funded by the second batch of Basic Research Program of Shanxi Province (Free Exploration) project of Shanxi Provincial Science and Technology Department in 2021, Grant/Award Number: 202103021223235.
Conflict of interest
The author reports no conflicts of interest in this work.
References
[1] | S. Hyuna et al., Global cancer statistics 2020: GLOBOCAN estimates of incidence and mortality worldwide for 36 cancers in 185 countries, CA: A Cancer Journal for Clinicians 71: (3) ((2021) ), 209–249. |
[2] | Z. Ling, B. Cheng and X. Tao, Epithelial-to-mesenchymal transition in oral squamous cell carcinoma: Challenges and opportunities, Int J Cancer 148: (7) ((2021) ), 1548–1561. |
[3] | S. Dutta, S. Singhal, R.B. Shah et al., Immunotherapy and targeted therapy in the management of oral cancers, Crit Rev Oncog 27: (4) ((2022) ), 23–37. |
[4] | O. Kujan, S.B. Van and C.S. Farah, Immune checkpoint inhibitors in oral cavity squamous cell carcinoma and oral potentially malignant disorders: A systematic review, Cancers (Basel) 12: (7) ((2020) ), 1937. |
[5] | J. Yan, P. Wan, S. Choksi et al., Necroptosis and tumor progression, Trends Cancer 8: (1) ((2022) ), 21–27. |
[6] | A. Degterev, Z. Huang, M. Boyce et al., Chemical inhibitor of nonapoptotic cell death with therapeutic potential for ischemic brain injury, Nat Chem Biol 1: (2) ((2005) ), 112–119. |
[7] | Z. Su, Z. Yang, Y. Xu et al., Apoptosis, autophagy, necroptosis, and cancer metastasis, Mol Cancer 14: ((2015) ), 48. |
[8] | Y. Gong, Z. Fan, G. Luo et al., The role of necroptosis in cancer biology and therapy, Mol Cancer 18: (1) ((2019) ), 100. |
[9] | K. Newton and G. Manning, Necroptosis and Inflammation, Annu Rev Biochem 85: ((2016) ), 743–763. |
[10] | H. Chen, Z. Xie, Q. Li et al., Risk coefficient model of necroptosis-related lncRNA in predicting the prognosis of patients with lung adenocarcinoma, Sci Rep 12: (1) ((2022) ), 11005. |
[11] | L. Luo, L. Li, L. Liu et al., A Necroptosis-Related lncRNA-Based Signature to Predict Prognosis and Probe Molecular Characteristics of Stomach Adenocarcinoma, Front Genet 13: ((2022) ), 833–928. |
[12] | D.C. Peltier, A. Roberts and P. Reddy, LNCing RNA to immunity, Trends Immunol 43: (6) ((2022) ), 478–495. |
[13] | L. Shi, Y. Yang, M. Li et al., LncRNA IFITM4P promotes immune escape by up-regulating PD-L1 via dual mechanism in oral carcinogenesis, Mol Ther 30: (4) ((2022) ), 1564–1577. |
[14] | C. Zou, S. Wu, H. Wei et al., LINC01355 contributes to malignant phenotype of oral squamous cell carcinoma and cytotoxic T cell infiltration via activating notch signaling pathway, J Immunol Res ((2021) ), 1830790. |
[15] | H. Wang, L. Sun, L. Su et al., Mixed lineage kinase domain-like protein MLKL causes necrotic membrane disruption upon phosphorylation by RIP3, Mol Cell 54: (1) ((2014) ), 133–146. |
[16] | P. Geserick, J. Wang, R. Schilling et al., Absence of RIPK3 predicts necroptosis resistance in malignant melanoma, Cell Death Dis 6: (9) ((2015) ), e1884. |
[17] | G.B. Koo, M.J. Morgan, D.G. Lee et al., Methylation-dependent loss of RIP3 expression in cancer represses programmed necrosis in response to chemotherapeutics, Cell Res 25: (6) ((2015) ), 707–725. |
[18] | X. Feng, Q. Song, A. Yu et al., Receptor-interacting protein kinase 3 is a predictor of survival and plays a tumor suppressive role in colorectal cancer, Neoplasma 62: (4) ((2015) ), 592–601. |
[19] | K. Moriwaki, J. Bertin, P.J. Gough et al., Differential roles of RIPK1 and RIPK3 in TNF-induced necroptosis and chemotherapeutic agent-induced cell death, Cell Death Dis 6: (2) ((2015) ), e1636. |
[20] | U. Hockendorf, M. Yabal, T. Herold et al., RIPK3 restricts myeloid leukemogenesis by promoting cell death and differentiation of leukemia initiating cells, Cancer Cell 30: (1) ((2016) ), 75–91. |
[21] | A.L. Nugues, B.H. El, D. Hetuin et al., RIP3 is downregulated in human myeloid leukemia cells and modulates apoptosis and caspase-mediated p65/RelA cleavage, Cell Death Dis 5: (8) ((2014) ), e1384. |
[22] | R. Tang, J. Xu, B. Zhang et al., Ferroptosis, necroptosis, and pyroptosis in anticancer immunity, Hematol Oncol 13: (1) ((2020) ), 110. |
[23] | Y. Yang, D. Chen, H. Liu et al., Increased expression of lncRNA CASC9 promotes tumor progression by suppressing autophagy-mediated cell apoptosis via the AKT/mTOR pathway in oral squamous cell carcinoma, Cell Death Dis 10: (2) ((2019) ), 41. |
[24] | X. Li, Z. Zhao, J. Wang et al., m7G Methylation-Related Genes as Biomarkers for Predicting Overall Survival Outcomes for Hepatocellular Carcinoma, Front Bioeng Biotechnol 10: ((2022) ), 849756. |
[25] | J. Zou, Z. Li, W. Jiao et al., A multi-omics-based investigation of the prognostic and immunological impact of necroptosis-related mRNA in patients with cervical squamous carcinoma and adenocarcinoma, Sci Rep 12: (1) ((2022) ), 16773. |
[26] | Y. Shen, X. Peng and C. Shen, Identification and validation of immune-related lncRNA prognostic signature for breast cancer, Genomics 112: (3) ((2020) ), 2640–2646. |
[27] | R. Liu, Y. Liu, F. Zhang et al., A cuproptosis random forest cox score model-based evaluation of prognosis, mutation characterization, immune infiltration, and drug sensitivity in hepatocellular carcinoma, Front Immunol 14: ((2023) ), 1146411. |
[28] | Y. Luo, H. Yuan, Q. Pei et al., Artificial neural network-based diagnostic models for lung cancer combining conventional indicators with tumor markers, Exp Biol Med (Maywood) 248: (10) ((2023) ), 829–838. |
[29] | Z. Lin, J. Zou, X. Sui et al., Necroptosis-related lncRNA signature predicts prognosis and immune response for cervical squamous cell carcinoma and endocervical adenocarcinomas, Sci Rep 12: (1) ((2022) ), 16285. |
[30] | J. Zhao, J. Zou, W. Jiao et al., Construction of N-7 methylguanine-related mRNA prognostic model in uterine corpus endometrial carcinoma based on multi-omics data and immune-related analysis, Sci Rep 12: (1) ((2022) ), 18813. |
[31] | F. Wu, H. We, G. Liu et al., Bioinformatics profiling of five immune-related lncRNAs for a prognostic model of hepatocellular carcinoma, Front Oncol 11: ((2021) ), 667904. |
[32] | F. Zhong, S. Liu, D. Hu et al., LncRNA AC099850.3 promotes hepatocellular carcinoma proliferation and invasion through PRR11/PI3K/AKT axis and is associated with patients prognosis, J Cancer 13: (3) ((2022) ), 1048–1060. |
[33] | J. Zhou, M. Zhang, H. Dong et al., Comprehensive analysis of acetylation-related lncRNAs and identified AC099850.3 as prognostic biomarker in non-small cell lung cancer, J Oncol ((2021) ), 4405697. |
[34] | X. Chen, J. Guo, F. Zhou et al., Over-expression of long non-coding RNA-AC099850.3 correlates with tumor progression and poor prognosis in lung adenocarcinoma, Front Oncol 12: ((2022) ), 895708. |
[35] | J. Ding, F. Shi, G. Xie et al., Long non-coding RNA LINC01503 promotes gastric cancer cell proliferation and invasion by regulating wnt signaling, Dig Dis Sci 66: (2) ((2021) ), 452–459. |
[36] | J. Xie, Y. Jiang, Y. Jiang et al., Super-enhancer-driven long non-coding RNA LINC01503, regulated by TP63, is over-expressed and oncogenic in squamous cell carcinoma, Gastroenterology 154: (8) ((2018) ), 2137–2151. |
[37] | Z. Ma, X. Gao, Y. Shuai et al., EGR1-mediated linc01503 promotes cell cycle progression and tumorigenesis in gastric cancer, Cell Prolif 54: (1) ((2021) ), e12922. |
[38] | M. Wang, D. Fang, MP. Di et al., Long non-coding RNA LINC01503 promotes the progression of hepatocellular arcinoma via activating MAPK/ERK pathway, Int J Med Sci 17: (9) ((2020) ), 1224–1234. |
[39] | J. Feng, F.Y. Gao, Y.Y. Li et al., Upregulation of LINC01503 promotes cervical cancer progression by targeting the miR-615-3p/CCND1 axis, J Cancer 12: (15) ((2021) ), 4552–4560. |
[40] | M. Zhang, T. Zhao, W. Du et al., C-MYC-induced upregulation of LINC01503 promotes progression of non-small cell lung cancer, Eur Rev Med Pharmacol Sci 24: (21) ((2020) ), 11120–11127. |
[41] | R.L. Ferris, G.J. Blumenschein, J. Fayette et al., Nivolumab vs investigator’s choice in recurrent or metastatic squamous cell carcinoma of the head and neck: 2-year long-term survival update of CheckMate 141 with analyses by tumor PD-L1 expression, Oral Oncol 81: ((2018) ), 45–51. |
[42] | P.J. Polverini, N.J. D’Silva and Y.L. Lei, Precision therapy of head and neck squamous cell carcinoma, J Dent Res 97: (6) ((2018) ), 614–621. |


