
GINS2 promotes the progression of human HNSCC by altering RRM2 expression
Abstract
INTRODUCTION:
GINS2 exerts a carcinogenic effect in multiple human malignancies, while it is still unclear that the potential roles and underlying mechanisms of GINS2 in HNSCC.
METHODS:
TCGA database was used to screen out genes with significant differences in expression in HNSCC. Immunohistochemistry and qRT-PCR were used to measure the expression of GINS2 in HNSCC tissues and cells. GINS2 was detected by qRT-PCR or western blot after knockdown or overexpression. Celigo cell counting, MTT, colony formation, and flow cytometric assay were used to check the ability of proliferation and apoptosis. Bioinformatics and microarray were used to screen out the downstream genes of GINS2.
RESULTS:
GINS2 in HNSCC tissues and cells was up-regulated, which was correlated with poor prognosis. GINS2 gene expression was successfully inhibited and overexpressed in HNSCC cells. Knockdown of GINS2 could inhibit proliferation and increase apoptosis of cells. Meanwhile, overexpression of GINS2 could enhance cell proliferation and colony formation. Knockdown of RRM2 may inhibit HNSCC cell proliferation, while overexpression of RRM2 rescued the effect of reducing GINS2 expression.
CONCLUSION:
Our study reported the role of GINS2 in HNSCC for the first time. The results demonstrated that in HNSCC cells, GINS2 promoted proliferation and inhibited apoptosis via altering RRM2 expression. Therefore, GINS2 might play a carcinogen in HNSCC, and become a specific promising therapeutic target.
1.Introduction
Head and neck squamous cell carcinomas (HNSCC), covering larynx, pharynx, and oral cavity cancers, is the sixth most common malignant tumor globally [1, 2]. Although the current systemic comprehensive treatments such as platinum-based chemoradiotherapy have been relatively mature, the prognosis of HNSCC patients is still not optimistic [3]. Some recent reports suggest that certain biomarkers can predict HNSCC progress, such as MAPKAPK2 and ETS1 [4, 5]; however, their practical usefulness remains to be determined. This study was aimed to find a more effective molecular target with diagnosis and therapeutic potential for HNSCC.
Go-Ichi-Ni-San (GINS), a ring-like protein involving GINS1 (Psf1), GINS2 (Psf2), GINS3 (Psf3), and GINS4 (Sld5), were originally extracted from yeast protein by Kubota and Takayamain 2003 [6, 7]. The GINS complex family is closely associated with DNA damage and replication in eukaryotic cells, involving cycle-related regulation, and functions as a critical role in proliferation and apoptosis [8].
GINS complex subunit 2 (GINS2), also called Psf2, is on human chromosome 16q24 [6]. The mRNA length is 1196bp, and the relative molecular weight of the coding is 21000Da [9]. Earlier studies pointed that GINS2 is usually expressed at a high level in certain malignant tumors, which promotes tumor occurrence and development [6, 8, 9, 10, 11]. However, the relevant role of GINS2 in HNSCC has not yet been clarified.
There was no study on the expression and mechanism of GINS2 in HNSCC by now. Our findings suggested that GINS2 was overexpressed in HNSCC tissues and cells, which was associated with a poor prognosis. Also, we explored the effect of interference with GINS2 on cell proliferation and apoptosis, as well as the possible downstream regulatory mechanisms.
2.Materials and methods
2.1TCGA gene expression datasets
We downloaded the transcriptome datasets and matched clinical data from the website of The Cancer Genome Atlas (TCGA) datasets (https://tcga-data.nci. nih.gov/tcga/). In the TCGA database, we found that there were only 40 pairs of HNSCC RNAseq datasets for tumor-adjacent histologically-normal tissues and tumor tissues (S1 Table), including the oral cavity, larynx, oral tongue, the base of the tongue, and floor of the mouth. The Trimmed Mean of the M-values method was used for data standardization. Quality control was carried out by calculating the biological coefficient of variation (BCV). In S2 Fig., we could see that the Normal (next to cancer) and Cancer samples were separated, indicating that the sample data of different batches had high stability and could be used for subsequent analysis. Since we would like to screen for genes whose expression level is related to stage, we classified these datasets according to the clinical stage of HNSCC: 2 pairs in stage I, 13 in stage II, 17 in stage III, and 8 in stage IV. Due to the small amount of data in stage I, we merged the datasets of stage I and stage II for further analysis. Finally, 40 pairs of samples were classified into 3 groups: stage I
2.2HNSCC samples and immunohistochemistry (IHC)
From August 2011 to May 2015, we collected 70 HNSCC tumor samples from Jiangsu Cancer Hospital. The demographic and clinical data were searched from electric records. All patients had not received any treatment before this research. All samples used to detect the expression level of GINS2 were collected with informed consent. The research protocol was permitted by the Ethics committee of Jiangsu Cancer Hospital. All samples were proven to be HNSCC pathologically. There were 17 cases of Nasopharyngeal cancer, 21 hypopharyngeal cancer, 18 laryngeal cancer, 14 tongue cancer. We performed GINS2 IHC staining on all samples: Fix the tissue using 4% paraformaldehyde, the sections were incubated with primary antibody at 4∘C overnight, immunostain the DAB chromogen, followed by nuclear staining with hematoxylin. Two pathologists were blinded to the patients’ clinical information. The histopathological features were assessed and the degree of immunostaining was scored. The scores were based on the ratio of positively stained tumor cells [0 (negative), 1 (1–25% positive), 2 (26–50% positive), 3 (51–75% positive) or 4 (76–100% positive)] and staining intensity [0 (no staining), 1 (weak, light-yellow), 2 (moderate, yellow-brown) or 3 (strong, brown)]. Multiplying the two parameters resulted in an immunoreactivity score of 0 to 12 (0, 1, 2, 3, 4, 6, 8, and 12). We used the median as the cutoff value for the high or low expression. Staining index
2.3Cell culture
Human HNSCC cell lines CNE-2Z, 5-8F, FaDu, Tca-8113, Hep-2 were obtained from Jiangsu Cancer Hospital. All the cell lines were approved by the Institutional Ethical Review Board of Jiangsu Cancer Hospital. In addition, the cell lines we used were authenticated by STR profile. All cells were tested negative for mycoplasma contamination. The cell culture conditions were: RPMI 1640 medium (Gibco, NY) containing 5% fetal bovine serum (Gibco, USA), 95% air, and 5% CO2 at 37∘C.
2.4Cell transfection
Lentiviral (sh-GINS2, shRRM2, shYAP1, shSKP2, sh-Control, oe-RRM2, oe-GINS2, oe-vector) were all synthesized and packaged by Shanghai Jikai Gene Technology Co., Ltd (Shanghai, China). Cells (1
2.5In vivo nude mouse xenograft tumor models
Sixteen female BALB/C nude mice (5–6 weeks), purchased from the Vital River Laboratory Animal Technology (Beijing, China), were maintained under specific pathogen-free conditions and applied for ectopic tumor construction. CNE-2Z cells (5
2.6Quantitative real-time polymerase chain reaction (qRT-PCR)
Cells were collected in Trizol (Invitrogen, CA) to extract total RNA. Then, reverse transcription was carried out to generate cDNA using M-MLV Reverse Transcriptase (Promega, Madison, WI, USA). qRT-PCR reactions were conducted with the SYBR Green Master Mix kit (Takara, Japan) according to the manufacturer’s instructions. The following primers were used: GINS2, forward primer 5’-CAGAAATGTCGCCTGCTCC-3’ and reverse primer 5’-GGATTTCGTCTGCCTTCG-3’; GAPDH, forward primer 5’-TGACTTCAACAGCGACACCCA-3’ and reverse primer 5’-CACCCTGTTGCTGTAGCCAAA-3’.
2.7Western blot (WB) analysis
The method of detecting proteins from protein lysates has been described previously [12]. Primary antibodies were listed as follows: GINS2 (Sigma, USA), YAP1 (Cell Signaling Technology, USA), CCNE2 (Abcam, UK), MKI67 (Abcam, UK), SKP2 (Abcam, UK), RRM2 (Abcam, UK) and GAPDH (Santa-Cruz, USA).
2.8Cellomics ArrayScan infinity
Cells were seeded in triplicates into 96-well plates (2,000 cells per well), at 37∘C, 5% CO2 for 5 days evaluation. Load samples onto a suitable slide, ensuring proper controls and replicates. Set up the acquisition parameters, including exposure time, filter settings, and imaging modes. Fluorescent cell quantification was conducted under a Cellomics ArrayScan Infinity system to detect cell proliferation ability. Generate quantitative data and statistical analyses based on the image analysis results.
2.9Celigo cell counting assay
Cells were seeded into 96-well plates (2,000 cells per well), at 37∘C, 5% CO2 for 5 days, and measured daily by Celigo Imaging Cytometer (Nexcelom Bioscience, USA).
2.10MTT assay
Cells were seeded into 96-well plates (2,000 cells per well), at 37∘C, 5% CO2 for 5 days, and added MTT (20
2.11Colony formation assay
Cells were seeded into 6-well plates (400 cells per well), at 37∘C, 5% CO2 for 14 days. The medium replacement was repeated every 2 or 3 days. Finally, cells were fixed with 4% paraformaldehyde, stained with Giemsa, counted, and photographed.
2.12Flow cytometric (FCM) analysis
Cells were seeded into 6-well plates (1
2.13Microarray and bioinformatics
Total RNA in shCtrl and shGINS2 groups was extracted using Trizol. The RNA that passed the quality inspection would be further analyzed.
2.14Statistical analysis
Differences between groups were analyzed using Student’s
3.Results
3.1GINS2 was overexpressed in HNSCC and associated with clinical stage and poor prognosis
By analyzing the RNAseq datasets of HNSCC in the TCGA database, we have identified 40 highly-expressed genes in HNSCC for subsequent analysis. We knocked down the 40 highly-expressed genes and then verified the proliferation ability through Cellomics ArrayScan Infinity in CNE-2Z cells. Results indicated that the NC group proliferated normally, and the cell multiplication rate reached 6.21 on the 5th day. However, the proliferation of the positive control cell group significantly slowed down, and the multiplication rate was only 1.16 on the 5th day (S4 Fig.). Among the 40 highly expressed genes, those with Fold change
Table 1
The expression level and related information of five highly expressed genes in proliferation inhibition assay
| Name of gene | Experimental group | Synonyms | Description | Cell localization | Fold change (day5 NC/ experimental group) |
|---|---|---|---|---|---|
| GINS2 | GINS2-siRNA | HSPC037 | GINS complex subunit 2 (Psf2 homolog) | Nucleus (By similarity) | 6.73 |
| CSGALNACT2 | CSGALNACT2-siRNA | CHGN2 | Chondroitin sulfate N-acetylgalactosaminyltransferase 2 | Golgi apparatus, Golgi stack membrane; Single-pass type II membrane protein (Probable) | 2.11 |
| TMEFF1 | TMEFF1-siRNA | C9orf2 | Transmembrane protein with EGF-like and two follistatin-like domains 1 | Cell membrane; Single-pass type I membrane protein | 3.63 |
| SPINK6 | SPINK6-siRNA | BUSI2 | Serine peptidase inhibitor, Kazal type 6 | Secreted (Potential) | 4.20 |
| IL1F9 | IL1F9-siRNA | IL-1F9 | Interleukin 36, gamma | Secreted | 3.50 |
The fold change of CSGALNACT2, IL1F9, TMEFF1, SPINK6 and GINS2 were all
We performed IHC analysis on 70 HNSCC samples collected clinically to explore the clinical correlation between GINS2 expression and HNSCC progression. We noticed that the tissue expression level of GINS2 was related to the clinical stage in HNSCC patients (Table 2). With the increase of clinical-stage, the proportion of high expression of GINS2 in each group also increased. Moreover, IHC results revealed that GINS2 was almost non-existent in adjacent normal tissues, but it was highly expressed in HNSCC and was mainly located in the nucleus (Fig. 1A–H).
Table 2
Relationship between GINS2 expression and clinical characteristics of HNSCC patients
| Characteristics | No of patients ( | GINS2 high group | GINS2 low group | |
|---|---|---|---|---|
| Age (years) | ||||
| | 16 | 3 | 13 | 0.468 |
| | 54 | 15 | 39 | |
| Sex | ||||
| Female | 10 | 0 | 10 | 0.044 |
| Male | 60 | 18 | 42 | |
| TNM stage | ||||
| I–III | 45 | 7 | 38 | 0.009 |
| IV | 25 | 11 | 14 | |
| T classification | ||||
| T1–T2 | 38 | 7 | 31 | 0.128 |
| T3–T4 | 32 | 11 | 21 | |
| N classification | ||||
| N0–N1 | 52 | 11 | 41 | 0.138 |
| N2–N3 | 18 | 7 | 11 |
Figure 1.
High expression of GINS2 was correlated with poor clinical outcomes. (A) Negative staining of GINS2 (magnification 100
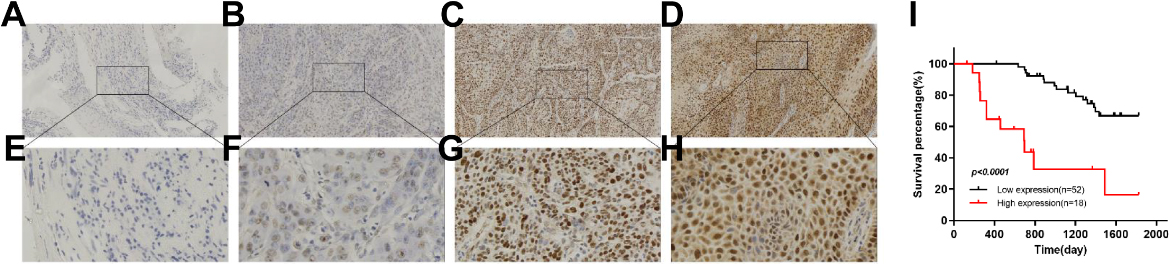
Subsequently, we used survival analysis to further clarify the impact of GINS2 overexpression on the prognosis of HNSCC patients. Through the survival curve, we found that the overall survival (OS) of patients with high GINS2 expression (
We further obtained GINS2 expression in HNSCC and normal samples from starBase v3.0 software. The results showed that the expression level of GINS2 in 502 cases of HNSCC was 7.38, while in 44 normal samples was only 2.06, with a fold change of 3.59 (
Table 3
GINS2 mRNA expression in HNSCC cell lines
| Sample | Average | SD |
|---|---|---|
| CNE-2Z | 9.68 | 0.245 |
| FaDu | 7.64 | 0.121 |
| Tca-8113 | 7.42 | 0.214 |
| Hep-2 | 6.70 | 0.040 |
| 5-8F | 6.01 | 0.098 |
Figure 2.
GINS2 expression and transfection efficiency determination in HNSCC cell lines. (A) GINS2 was up-regulated in HNSCC patients. The expressions of GINS2 in HNSCC (
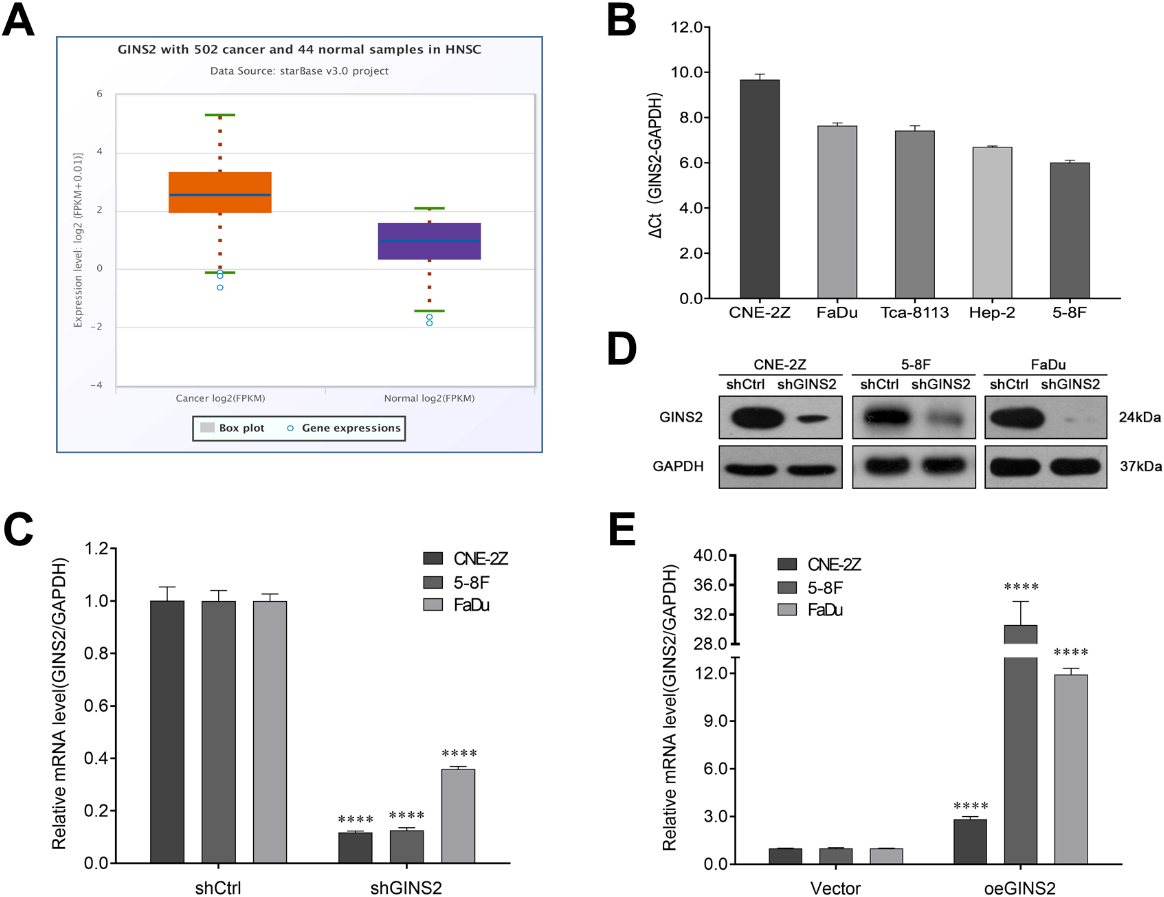
Figure 3.
Effects of GINS2 knockdown or overexpression on HNSCC cell proliferation and apoptosis. (A) Celigo cell counting assay results of GINS2 knockdown on cell growth. (B) MTT assay results of GINS2 knockdown on cell proliferation. (C) MTT assay results of GINS2 overexpression on cell proliferation. (D) Colony formation assay results of GINS2 knockdown on HNSCC cells. (E) Colony formation assay results of GINS2 overexpression on HNSCC cells. (F) Apoptosis assay results of GINS2 knockdown on HNSCC cells. *P < 0.05, **P < 0.01, ***P < 0.001, ****P < 0.0001.
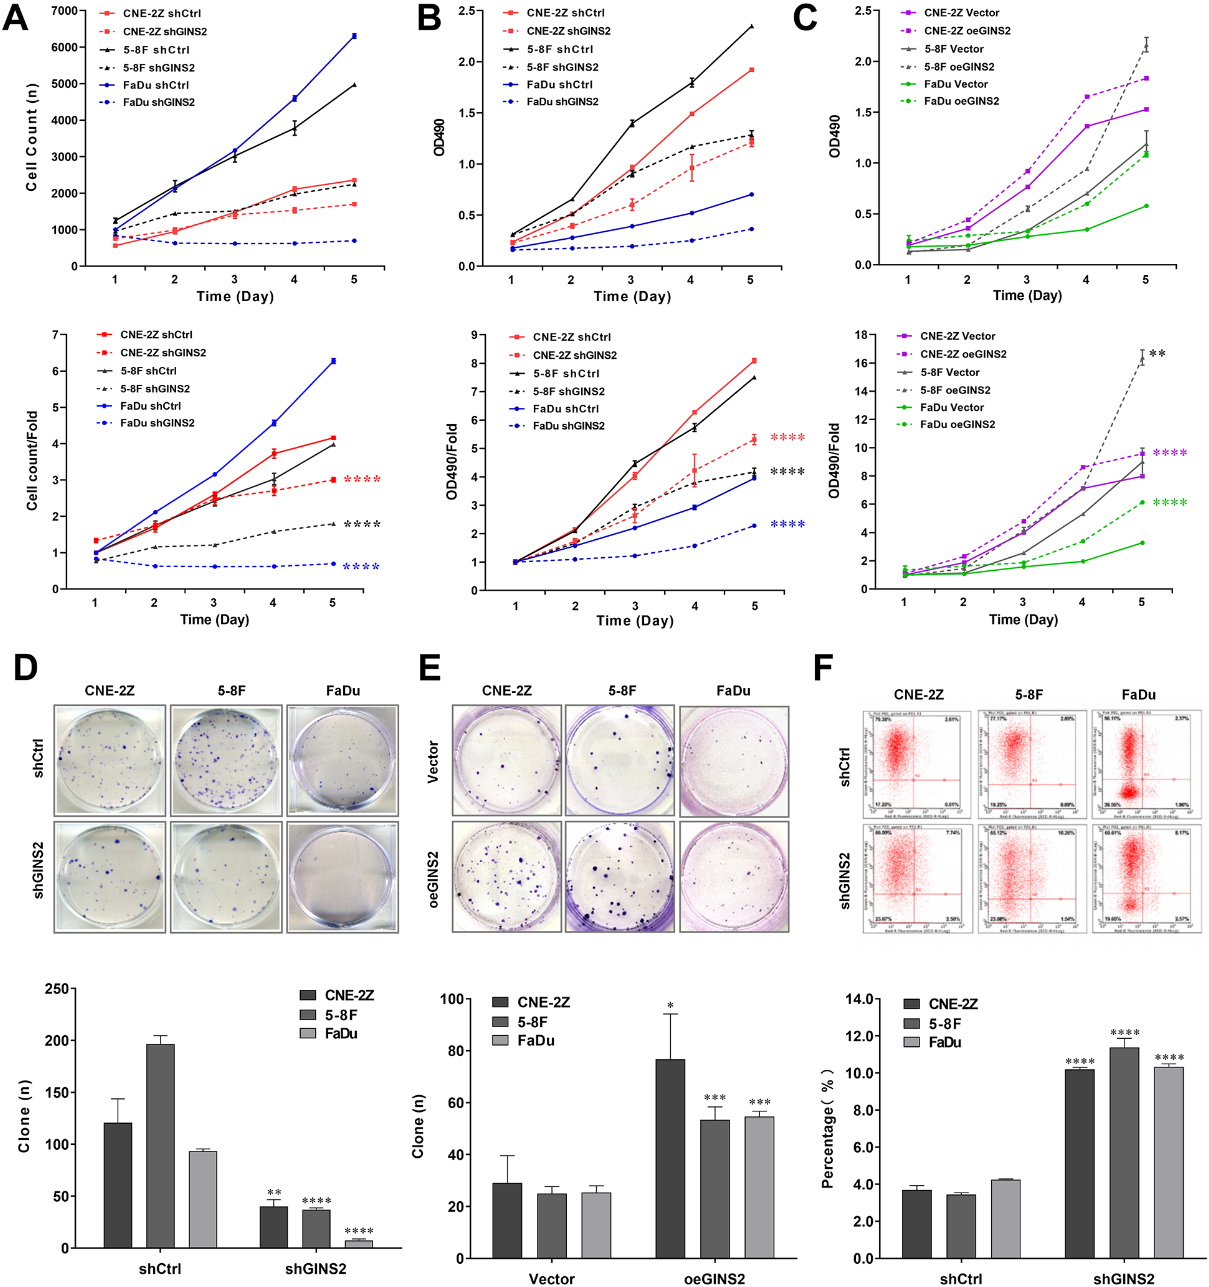
Figure 4.
Knockdown of GINS2 inhibited the MYC signaling pathway and downregulated RRM2. (A) Heatmap showed the differentially expressed genes between shCtrl and shGINS2 groups. Up-regulated genes are red, and down-regulated genes are green. (B, C) Histogram and Heatmap showed the functional classification of GINS2 regulatory genes. (D, E) The network of molecules on MYC and its pathway. (F) The mRNA expressions of 12 genes (PPKACB, DDX18, RRM2, SKP2, KRAS, MKI67, CCNE2, DDX5, EIF4A1, MTBP, YAP1, and NUDT21) determined by qRT-PCR. (G) The protein expressions of RRM2, SKP2, MKI67, CCNE2, and YAP1 were determined by WB. *P < 0.05, **P < 0.01, ***P < 0.001, ****P < 0.0001. IPA, Ingenuity Pathway Analysis.
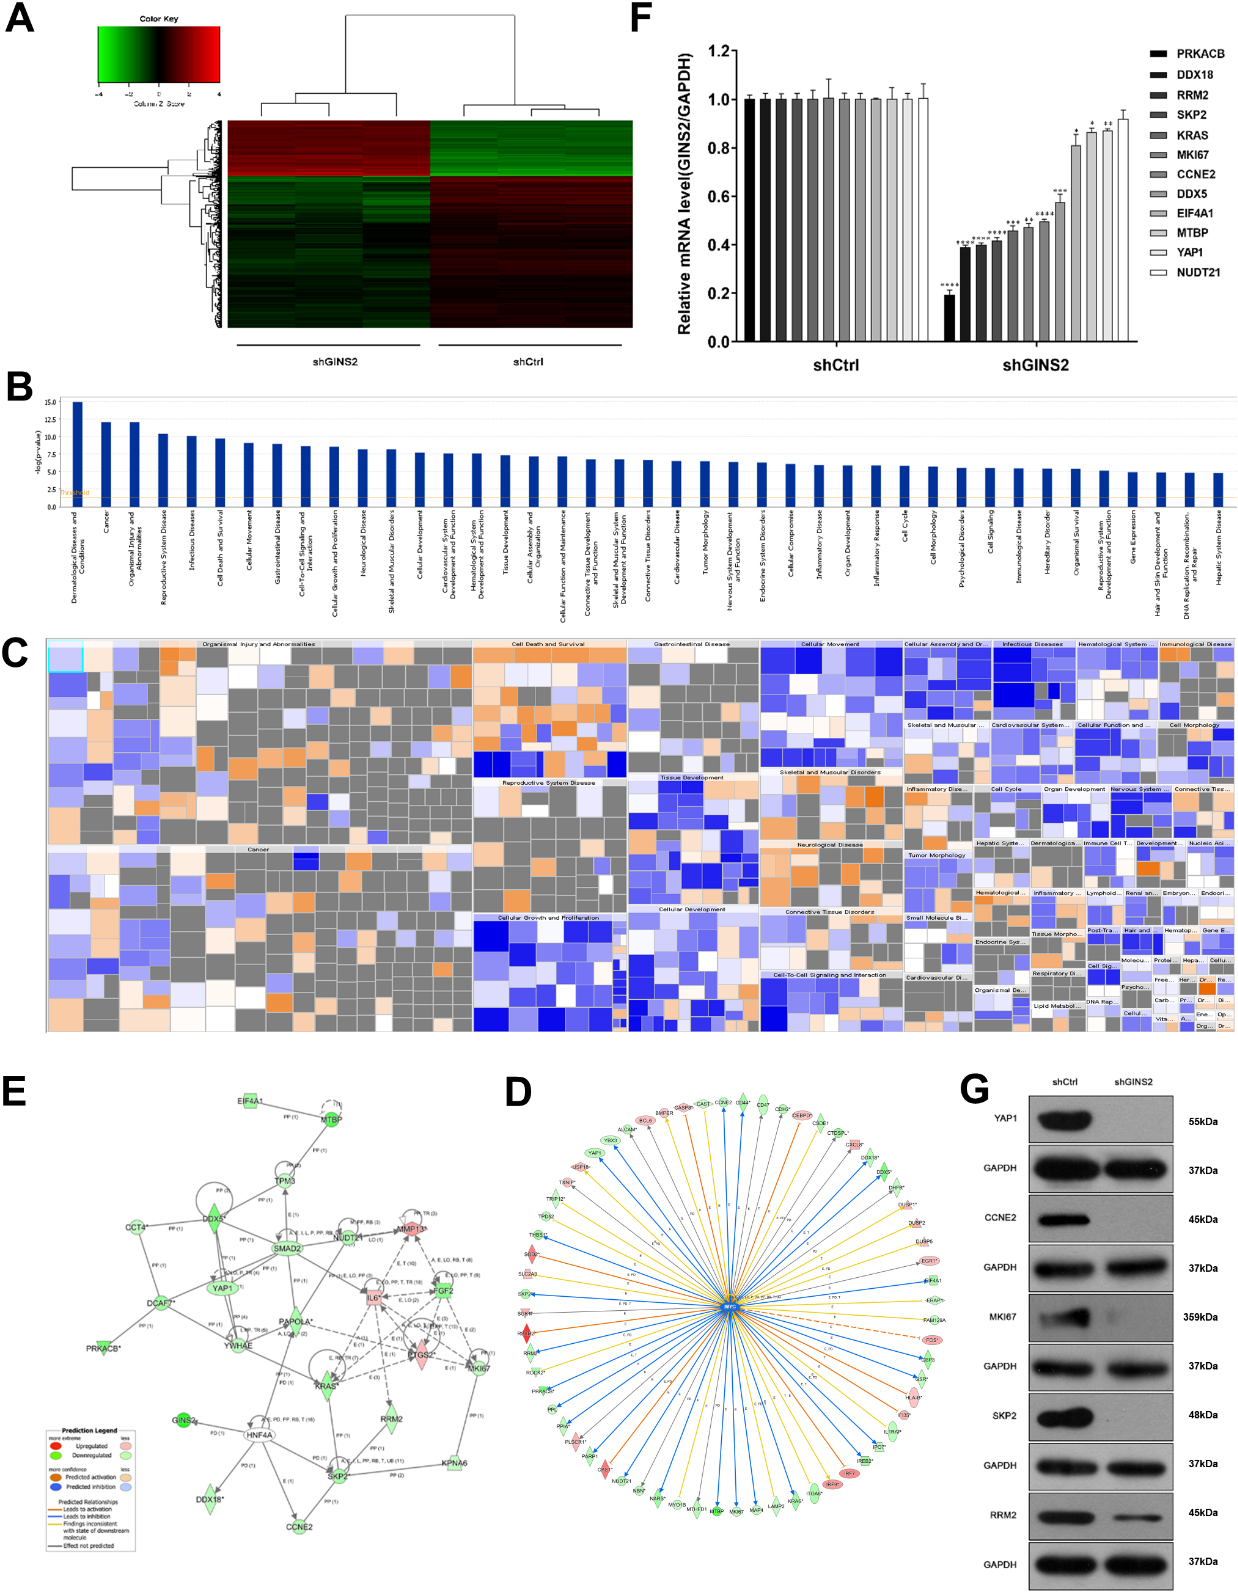
Figure 5.
Effects of RRM2, SKP2, and YAP1 knockdown on cell growth, and the relationship of RRM2 and GINS2 in HNSCC. (A) RRM2, SKP2, and YAP1 were knocked down successfully in FaDu cells. The mRNA expressions were determined by qRT-PCR. (B) Celigo cell counting assay results of RRM2, SKP2, and YAP1 knockdown on cell growth in FaDu cells. (C) RRM2 was knocked down successfully in CNE-2Z cells. The RRM2 mRNA expression was determined by qRT-PCR. (D) Celigo cell counting assay results of RRM2 knockdown on cell growth in CNE-2Z cells. (E) A positive correlation was found between GINS2 and RRM2. ***P < 0.001, ****P < 0.0001.
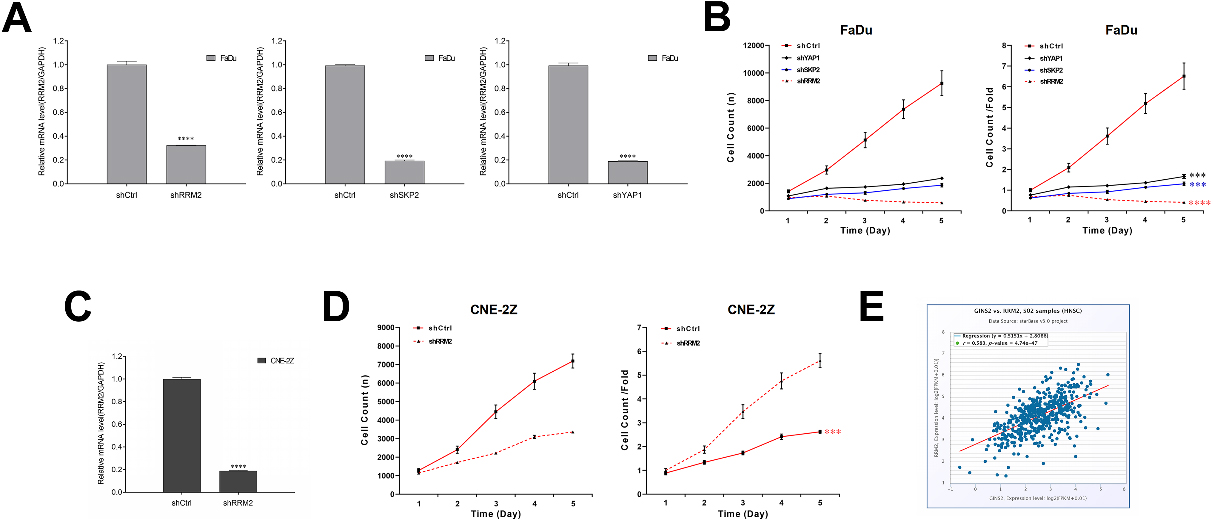
Figure 6.
RRM2 rescued the effect of GINS2 in HNSCC cells. (A) The protein expressions of RRM2 were determined by WB in CNE-2Z and FaDu cells. (B) MTT results of the rescue assay. (C) Apoptosis results of the rescue assay. ****P < 0.0001.
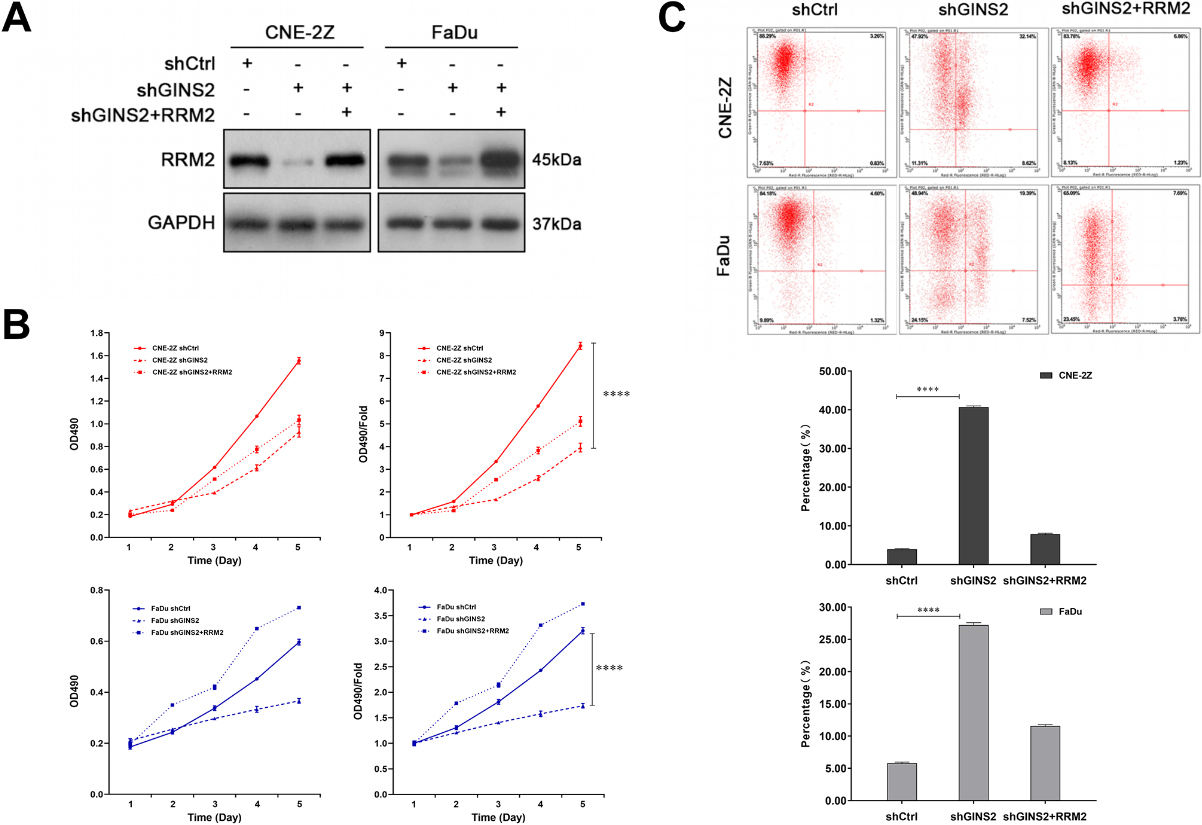
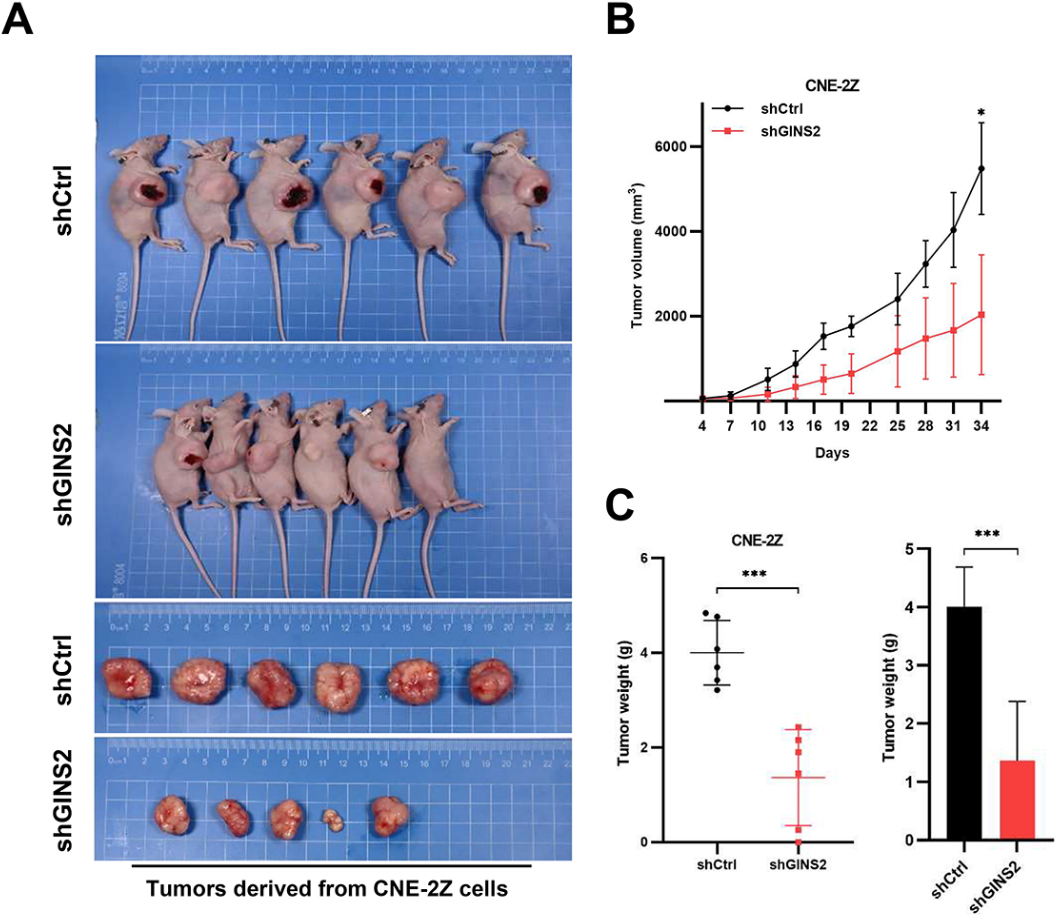
Figure 7.
Knockdown of GINS2 suppresses tumor growth in vivo. (A) Xenograft models in nu/nu mice were generated using CNE-2Z cells transfected with Ctrl-shRNA (
3.2GINS2 was knocked down or overexpressed in HNSCC cells
We first knocked down GINS2 in CNE-2Z, 5-8F, and FaDu cells. According to the results of qRT-PCR (
3.3GINS2 promoted the proliferation of HNSCC cells
To explore the role of GINS2 expression in the growth of HNSCC cell lines, we conducted a series of proliferation-related experiments. The results of the Celigo cell counting assay indicated that knocking down GINS2 lowered the total number of cells as well as cell growth rate in CNE-2Z, 5-8F, and FaDu cell lines (
3.4GINS2 knockdown induced apoptosis of HNSCC cells in vitro
Tumor progression is generally accompanied by the occurrence of anti-apoptosis. The results of apoptosis assay in CNE-2Z, 5-8F, and FaDu cells revealed that the apoptosis rates of shGINS2 groups were higher than the control groups (
3.5GINS2 inhibition downregulated the expression of RRM2
Since GINS2 affected proliferation and apoptosis of HNSCC as demonstrated above, we checked the gene expression profiles of the GINS2 knockdown group and the control group in CNE-2Z cells, hoping to explore its possible mechanism. Compared with the shCtrl group, the shGINS2 group had 169 genes up-regulated, and 449 genes down-regulated (Fig. 4A). Then, we selected the top 500 genes whose expression levels changed significantly after GINS2 knockdown and used IPA to conduct functional classification. The analysis results prompted that these genes were notably enhanced in many biological functions, such as cell proliferation, organismal death, congenital anomaly of the musculoskeletal system, and viral infection (Fig. 4B and C). Subsequently, we again used IPA to screen the regulatory factors related to GINS2, and the data validated that the z-score for MYC was
The MYC pathway is a well-known signaling pathway closely related to cancer. The pathway contains many genes (Fig. 4D), which constitute a complex regulating network map (Fig. 4E). Then, the expression of 12 genes (PPKACB, DDX18, RRM2, SKP2, KRAS, MKI67, CCNE2, DDX5, EIF4A1, MTBP, YAP1, and NUDT21) in the pathway were verified by qRT-PCR. Except for NUDT21 (
3.6RRM2, positively correlated with GINS2, its knockdown suppressed cell proliferation in HNSCC
To prove our conjecture, we chose to knock down RRM2, SKP2, and YAP1 in FaDu cells via lentivirus infection. The efficiency of transfection was confirmed by qRT-PCR (
3.7RRM2 partially rescued the effect of GINS2 in HNSCC cells
Later, CNE-2Z and FaDu cells were transfected with shGINS2, or co-transfected with shGINS2 and oe-RRM2 in rescue assays. The transfection effect was tested by WB analysis (Fig. 6A). Essentially, in MTT analysis, the overexpression of RRM2 rescued the repression of shGINS2 on cell proliferation in CNE-2Z cells, as well as in FaDu Cells (Fig. 6B). Meanwhile, in apoptosis assay, the overexpression of RRM2 also partially abolished shGINS2-mediated enhancement of cell apoptosis in CNE-2Z and FaDu cells (Fig. 6C).
3.8GINS2 knockdown inhibited in vivo tumor growth
To extend the in vitro observations, we investigated the effects of GINS2 knockdown on tumor growth in vivo. CNE-2Z cells that were transfected with either GINS2-shRNA or Ctrl-shRNA lentivirus were injected into nude mice, and the tumor growth was monitored. Tumors formed by GINS2-silenced CNE-2Z cells were much smaller during the experimental period than the control tumor (Fig. 7A and B). Furthermore, the excised Ctrl-shRNA tumors weighed on an average of 4006 mg whereas GINS2-shRNA tumors averaged 1368 mg (Fig. 7C). Collectively, these results emphasize the in vivo promoting role of GINS2 in cancer progression.
4.Discussion
HNSCC, diagnosed in
The GINS complex, which plays an irreplaceable role in initiating chromosome replication and normal operation of the DNA replication forks, is composed of GINS1, GINS2, GINS3, and GINS4 [6, 8]. Earlier studies pointed out that the GINS complex is closely correlated with tumor development [8]. For instance, in lung cancer, GINS1 affects cell proliferation and cycle arrest, and GINS3 affects OS [13, 14]. In bladder cancer, the expression of GINS4 increases and promotes proliferation [15].
It has been reported that the expression level of GINS2 is high in cancer cells, such as cervical cancer, non-small-cell lung cancer (NSCLC), and breast cancer [16, 17]. However, to date, little was known about the function of GINS2 in HNSCC. Here, we conducted IHC in 85 clinical HNSCC samples. GINS2 was highly expressed in HNSCC tissues and was correlated with the clinical staging, which consistent with our TCGA and starBase v3.0 database analyses in HNSCC, as well as previous research in other cancers [10, 11]. Similarly, cell experiments also confirmed that GINS2 is highly expressed in HNSCC. In terms of prognostic prediction, like previous studies in glioma, we also confirmed that GINS2 expression was negatively correlated with OS in HNSCC.
GINS2, as a subunit of the GINS complex, participates in the regulation of tumor cell proliferation, apoptosis, and cycle [6]. Our experimental findings notified that inhibiting GINS2 could reduce cell proliferation and induce cell apoptosis, while overexpression of GINS2 had the opposite effect. This was also consistent with the view that GINS2 plays an oncogene in NSCLC in other studies [8, 10].
Although the aforementioned results have revealed the functions of GINS2 in terms of proliferation and apoptosis in HNSCC, its regulatory mechanism is still unclear. To this end, we used IPA for modulator analysis and found that after GINS2 inhibition, the MYC pathway was significantly inhibited. MYC, an oncogenic protein, which was first discovered in 1982, is activated in up to 70% of human cancers and can cause genome instability in various human tumors [18, 19]. According to previous researches, it seems that knocking down MYC in cancer cell lines established in vitro could ultimately reduce cell proliferation and in some cases induce apoptosis [18]. In short, MYC, as a well-known transcription regulator, is at a key position in many growth-promoting signal transduction pathways. The MYC pathway activation is a key driver for multiple cancers [20]. Combing the IPA results and previous researches, we selected the MYC pathway as a potential research target in our following research.
With a network map of the molecules on the MYC pathway, we further conducted qRT-PCR and WB in CNE-2Z shGINS2 cells, implying that GINS2 knockdown might influence HNSCC cells by down-regulating RRM2, SKP2, MKI67, CCNE2, and YAP1. Afterward, we carried out the Celigo cell counting assay on cell growth. According to the results, the RRM2 knockdown group showed the most significant growth inhibition. Given the above results, it is highly likely that GINS2 may promote HNSCC by positively regulating RRM2. Therefore, starBase was run to predict the relationship between GINS2 and RRM2. Indeed, the prediction results showed that they were positively correlated. Through reviewing previous research, we gradually formed an understanding of RRM2, which encodes the catalytic subunit of ribonucleotide reductase (RNR) [21]. RNR can catalyze the conversion of ribonucleotides to deoxyribonucleotides (dNTPs), which are essential for the replication and repair of DNA synthesis [22]. Notably, knockdown of RRM2 caused DNA replication stress and DNA damage [21]. Similar to GINS2, RRM2 is overexpressed and plays an oncogenic role in several cancers, containing gastric, breast, ovarian, and so on [23, 24, 25]. Upregulation of RRM2 in oral, lung, adrenocortical, and pancreatic cancer cells could lead to resistance of gemcitabine [26, 27, 28]. Increasing evidence demonstrated that RRM2 upregulation was correlated with worsen survival of various cancers [23, 29]. High expression of RRM2 enhanced proliferation, migration, and invasion but inhibited apoptosis of human cancer cells [21, 29]. Afterward, the rescue assay was performed in our study, which proved that RRM2 overexpression partially abolished the shGINS2-mediated effect of cell proliferation and apoptosis in HNSCC. Taken together, we have more reason to believe that GINS2 may promote HNSCC by positively modulating the expression of RRM2.
In addition to its biological significance in proliferation and apoptosis, GINS2 also involves in cell cycle and radioresistance in cancers. In GBM, studies on GINS2 demonstrated that silencing GINS2 expression caused cell cycle arrest at G1-phase and increased sensitivity to radiotherapy. A high level of GINS2 might enhance the radioresistance of glioma stem cells [30]. Based on the above, we may further explore the relevant mechanisms of GINS2 in terms of cell cycle and radioresistance of HNSCC in our follow-up research.
In summary, through this study, we enhanced our comprehension of the HNSCC development mechanism. All the above findings indicated that GINS2, which is highly expressed in HNSCC, might be a carcinogenic factor related to proliferation and apoptosis, and may promote tumor development by up-regulating RRM2. Therefore, GINS2 might serve as a prognostic predictor and therapeutic biomarker for HNSCC patients.
Ethical statement
The study was conducted in accordance with the Declaration of Helsinki (as revised in 2013). The study was approved by the Ethics committee of Jiangsu Cancer Hospital (20111025003), and written informed consent was obtained from the patients.
Author contributions
Interpretation of data: L Yin, X He.
Preparation of the manuscript: TX Wang, LX Qian, PC Zhang, FY Peng, CY Yao.
Revision for important intellectual content: MY Du, J Wu, R Yin.
Supervision: L Yin, X He.
Supplementary data
The supplementary files are available to download from http://dx.doi.org/10.3233/CBM-230337.
Acknowledgments
This work was supported by the National Natural Science Foundation of China (81872192), Jiangsu Provincial Key Research and Development Program (BE2019756), China Postdoctoral Science Foundation (2018M632266), and Excellent Talents Plan of Jiangsu Cancer Hospital (2017YYCJH-02).
Conflict of interest
Conflict of interest relevant to this article was not reported.
References
[1] | S.J. Hill and A.D. D’Andrea, Predictive potential of head and neck squamous cell carcinoma organoids, Cancer Discovery 9: (7) ((2019) ), 828–830. |
[2] | B. Burtness et al., Afatinib vs placebo as adjuvant therapy after chemoradiotherapy in squamous cell carcinoma of the head and neck: A randomized clinical trial, JAMA Oncology 5: (8) ((2019) ), 1170–1180. |
[3] | E.E.W. Cohen et al., Pembrolizumab versus methotrexate, docetaxel, or cetuximab for recurrent or metastatic head-and-neck squamous cell carcinoma (KEYNOTE-040): A randomised, open-label, phase 3 study, Lancet (London, England) 393: (10167) ((2019) ), 156–167. |
[4] | K.L. Berggren et al., MAPKAPK2 (MK2) inhibition mediates radiation-induced inflammatory cytokine production and tumor growth in head and neck squamous cell carcinoma, Oncogene 38: (48) ((2019) ), 7329–7341. |
[5] | C. Gluck et al., Molecular dissection of the oncogenic role of ETS1 in the mesenchymal subtypes of head and neck squamous cell carcinoma, PLoS Genetics 15: (7) ((2019) ), e1008250. |
[6] | Y. Ye et al., GINS2 promotes cell proliferation and inhibits cell apoptosis in thyroid cancer by regulating CITED2 and LOXL2, Cancer Gene Therapy 26: (3–4) ((2019) ), 103–113. |
[7] | Y. Takayama et al., GINS, a novel multiprotein complex required for chromosomal DNA replication in budding yeast, Genes & Development 17: (9) ((2003) ), 1153–1165. |
[8] | X.L. Liu et al., GINS2 facilitates epithelial-to-mesenchymal transition in non-small-cell lung cancer through modulating PI3K/Akt and MEK/ERK signaling, Journal of Cellular Physiology 235: (11) ((2019) ), 7747–7756. |
[9] | Y.L. Shen et al., Loss of GINS2 inhibits cell proliferation and tumorigenesis in human gliomas, CNS Neuroscience & Therapeutics 25: (2) ((2019) ), 273–287. |
[10] | F. Chi et al., Knockdown of GINS2 inhibits proliferation and promotes apoptosis through the p53/GADD45A pathway in non-small-cell lung cancer, Bioscience Reports 40: (4) ((2020) ), BSR20193949. |
[11] | L. Peng et al., GINS2 regulates matrix metallopeptidase 9 expression and cancer stem cell property in human triple negative Breast cancer, Biomedicine & pharmacotherapy = Biomedecine & pharmacotherapie, (2016) , 1568–1574. |
[12] | J.J. Gu et al., Inhibition of ACK1 delays and overcomes acquired resistance of EGFR mutant NSCLC cells to the third generation EGFR inhibitor, osimertinib, Lung cancer (Amsterdam, Netherlands), (2020) , 26–35. |
[13] | J.Y. Zhang et al., Knockdown of PSF1 expression inhibits cell proliferation in lung cancer cells in vitro, Tumour Biology: The Journal of the International Society for Oncodevelopmental Biology and Medicine 36: (3) ((2015) ), 2163–2168. |
[14] | S. Tane et al., Significant role of Psf3 expression in non-small-cell lung cancer, Cancer Science 106: (11) ((2015) ), 1625–1634. |
[15] | K. Yamane et al., Regulation of SLD5 gene expression by miR-370 during acute growth of cancer cells, Scientific reports, (2016) ), 30941. |
[16] | F. Ouyang et al., GINS2 is a novel prognostic biomarker and promotes tumor progression in early-stage cervical cancer, Oncology Reports 37: (5) ((2017) ), 2652–2562. |
[17] | M. Zheng et al., High GINS2 transcript level predicts poor prognosis and correlates with high histological grade and endocrine therapy resistance through mammary cancer stem cells in breast cancer patients, Breast Cancer Research and Treatment 148: (2) ((2014) ), 423–436. |
[18] | C.V. Dang, MYC on the path to cancer, Cell 149: (1) ((2012) ), 22–35. |
[19] | K. Jin et al., Long non-coding RNA PVT1 interacts with MYC and its downstream molecules to synergistically promote tumorigenesis, Cellular and Molecular Life Sciences: CMLS 76: (21) ((2019) ), 4275–4289. |
[20] | P. Llabata et al., Multi-Omics Analysis Identifies MGA as a Negative Regulator of the MYC Pathway in Lung Adenocarcinoma, Molecular Cancer Research: MCR 18: (4) ((2020) ), 574–584. |
[21] | R.D. Rasmussen et al., BRCA1-regulated RRM2 expression protects glioblastoma cells from endogenous replication stress and promotes tumorigenicity, Nature communications, (2016) , 13398. |
[22] | V. D’Angiolella et al., Cyclin F-mediated degradation of ribonucleotide reductase M2 controls genome integrity and DNA repair, Cell 149: (5) ((2012) ), 1023–1034. |
[23] | V.K. Grolmusz et al., Cell cycle dependent RRM2 may serve as proliferation marker and pharmaceutical target in adrenocortical cancer, American Journal of Cancer Research 6: (9) ((2016) ), 2041–2053. |
[24] | Y.Z. Mazzu et al., Ribonucleotide reductase small subunit M2 is a master driver of aggressive prostate cancer, Molecular Oncology 14: (8) ((2020) ), 1881–1897. |
[25] | D. Quan et al., Identification of lncRNA NEAT1/miR-21/ RRM2 axis as a novel biomarker in breast cancer, Journal of Cellular Physiology 235: (4) ((2020) ), 3372–3381. |
[26] | K. Iwamoto et al., Ribonucleotide reductase M2 is a promising molecular target for the treatment of oral squamous cell carcinoma, International Journal of Oncology 46: (5) ((2015) ), 1971–1977. |
[27] | P. Chen et al., Gemcitabine resistance mediated by ribonucleotide reductase M2 in lung squamous cell carcinoma is reversed by GW8510 through autophagy induction, Clinical Science (London, England: 1979) 132: (13) ((2018) ), 1417–1433. |
[28] | X. Zhao et al., Precision design of nanomedicines to restore gemcitabine chemosensitivity for personalized pancreatic ductal adenocarcinoma treatment, Biomaterials ((2018) ), 44–55. |
[29] | Y. Yang et al., RRM2 Regulated By LINC00667/miR-143-3p Signal Is Responsible For Non-Small Cell Lung Cancer Cell Progression, OncoTargets and therapy, (2019) , 9927–9939. |
[30] | C. Wang et al., Upregulation of DNA metabolism-related genes contributes to radioresistance of glioblastoma, Human Gene Therapy Clinical Development 30: (2) ((2019) ), 74–87. |


