
Multi-omics comprehensive analysis reveals the predictive value of N6-methyladenosine- related genes in prognosis and immune escape of bladder cancer
Abstract
BACKGROUND:
N6-methyladenosine (m6A) is the most frequent RNA modification in mammals, and its role in bladder cancer (BC) remains rarely revealed.
OBJECTIVE:
To predict the value of m6A-related genes in prognosis and immunity in BC.
METHODS:
We performed multiple omics analysis of 618 TCGA and GEO patients and used principal component analysis (PCA) to calculate the m6A score for BC patients.
RESULTS:
We described the multiple omics status of 23 m6A methylation-related genes (MRGs), and four m6A clusters were identified, which showed significant differences in immune infiltration and biological pathways. Next, we intersected the differential genes among m6A clusters, and 11 survival-related genes were identified, which were used to calculate the m6A score for the patients. We found that the high-score (HS) group showed lower tumor mutation burden (TMB) and TP53 mutations and better prognosis than the low-score (LS) group. Lower immune infiltration, higher expression of PD-L1, PD-1, and CTLA4, and higher immune dysfunction and immune exclusion scores were identified in the LS group, suggesting a higher possibility of immune escape. Finally, the experimental verification shows that the m6A related genes, such as IGFBP1, plays an important role in the growth and metastasis of bladder cancer.
CONCLUSIONS:
These findings revealed the important roles of m6A MRGs in predicting prognosis, TMB status, TP53 mutation, immune functions and immunotherapeutic response in BC.
Abbreviations
| BC | bladder cancer |
| ICIs | immune checkpoint inhibitors |
| m6A | N6-methyladenosine |
| MRGs | methylation-related genes |
| TMB | tumor mutation burden |
| TCGA | The Cancer Genome Atlas |
| GEO | Gene Expression Omnibus |
| PCA | principal components analysis |
| CNV | copy number variation |
| DEGs | differentially expressed genes |
| OSRGs | OS-related genes |
| IGF | insulin-like growth factor |
| HS group | high-score group |
| LS group | low-score group |
| PPI | protein-protein interaction |
| GO | Gene Ontology |
| KEGG | Kyoto Encyclopedia of Genes and |
| Genomes | |
| GSEA | Gene set enrichment analysis |
| DSS | Disease-specific survival |
| OS | Overall survival |
1.Introduction
Bladder cancer (BC) is among the top 10 malignancies worldwide, with the highest incidence and mortality in the urinary system, which places a heavy burden on society as a whole [1, 2]. At present, the initiation mechanism of BC is still unclear. somehow, several risk factors, such as age, gender, cigarettes, chemical contact, heredity and other elements, have been identified [3]. So far, the common therapies for BC, including surgery, chemotherapy, and immune therapy, have achieved great improvement in BC prognosis, but many BC patients still suffer from high recurrence possibilities, even with noneffective methods for advanced or metastatic BC [4]. Therefore, investigating novel methods that could help with the early diagnosis of BC or predict prognosis is urgently needed.
N6-methyladenosine (m6A) is the most frequent RNA modification in mammalian cells [5]. The basic m6A process includes 3 types of genes and their downstream proteins: writers (such as METTL3, METTL14, METTL16, WTAP, VIRMA, ZC3H13, RBM15 and RBM15B), readers (such as YTHDC1, YTHDC2, YTHDF1, YTHDF2, YTHDF3, HNRNPC, FMR1, LRPPRC, HNRNPA2B1, IGFBP1, IGFBP2, IGFBP3 and RBMX), and erasers (such as FTO and ALKBH5), which add, identify and delete m6A-modified sites [6]. These m6A regulation genes are reported to play important roles in tumorigenesis and tumor progression [7, 8, 9]. For example, it has been reported that knockdown of METTL3 (one of the writers) inhibits BC cells in vitro and tumorigenesis in vivo, while overexpression of METTL3 improves BC invasion [10]. Meanwhile, the high expression of YTHDF2 (one of the readers) has a close relationship with poor survival, and cell proliferation and migration were significantly inhibited after knocking down YTHDF2 in prostate cancer [11]. Additionally, FTO (one of the erasers) is known as an oncogene that is closely associated with BC progression [12]. Obviously, these findings suggest the important roles of m6A regulatory genes in tumors.
Immunotherapy has become an important treatment strategy in BC, especially advanced BC and metastatic BC, which has ameliorated the prognosis. Currently, immune checkpoint inhibitors (ICIs) are the first-line treatment for BC, and PD-1, PD-L1 and CTLA4 expression levels are considered to be associated with the immunotherapy response [13]. Although ICIs have made great improvements in BC prognosis, only a few patients gain clear benefit from ICI treatment, and some patients suffer side effects and medicine toxicity [14]. Therefore, it is imperative to explore novel effective therapeutic methods and molecular targets to improve the immunotherapy effect of patients. Interestingly, it has been reported that BC patients who have high CD8
Liu et al. showed the importance of the multiomic characteristics of m6A related genes in exploring the biological function of bladder cancer. Due to the complex functions of m6A related genes, more evidence needs to be further explored [17]. In this work, we aimed to reveal the important roles of m6A methylation-related genes (MRGs) in predicting prognosis, TMB status, TP53 mutation, immune functions and immunotherapeutic response in BC and to offer novel molecular targets for the precision treatment of BC.
2.Material and methods
2.1Data sources
In this work, transcriptome data, single nucleotide polymorphism (SNP) data, copy number variation (CNV) data and related clinical information were downloaded from the TCGA database (https://tcga-data. nci.nih.gov/tcga/) for 430 cases (411 BC cases and 19 normal cases). Firstly, raw data of each case was extracted and generated a matrix by using Perl software. Then, case IDs were conformed into a consistent layout, as well as annotated gene names accurately in the matrix. Next, a standardized transcriptomic matrix was generated by applying formula log2 (x
2.2Identification of differentially expressed genes
Before analysis, we standardized all transcriptomics data by applying log2 (x
2.3Protein-protein interaction network
We generated a protein-protein interaction network (PPI) for MRGs by using STRING (https://string-db. org/) and Cytoscape software.
2.4Enrichment analysis
We applied Gene Set Variation Analysis (GSVA), Gene Ontology (GO) and Kyoto Encyclopedia of Genes and Genomes (KEGG) for functional or pathway enrichment analysis. Briefly, expression profiles of DEGs or MRGs were put into R software to perform the enrichment analysis, calculating enrichment scores, estimating significance levels and performing multiple hypothesis, which finally indicated the potential gene functions and pathways.
2.5M6A scores were evaluated for patients
Principal components analysis (PCA) is an effective technique for reducing data dimensionality. Calculation steps (assuming that the sample data is n-dimensional, with a total of m): 1. Organize these sample data into a matrix Xnm by column; 2. Row-wise averaging X, which means first calculating the average value of each row, and then subtracting this average value from each element in that row; 3. Calculate the covariance matrix; 4. Find the eigenvalues of the covariance matrix, which are the corresponding eigenvectors; 5. Arrange the feature vectors into a matrix by row from top to bottom according to the corresponding feature values, and take the first k rows to form a matrix P; 6. Then Y
2.6Cell culture
In this study, human bladder cancer cell lines UMUC3 and RT112 were cultured in RPMI-1640 (Gibco, USA) supplemented with 10% fetal bovine serum and 1% penicillin/streptomycin, as well as cultured at 37∘C and in 5% CO2.
2.7Transfection assay
We obtained the overexpression plasmid of IGFBP1 and paired empty plasmid from GeneCopoeia (Guangzhou, China). Firstly, we planted BC cells into 6-well plates and waited for cell density reached at 80%–90%. Then, we changed the culture medium into 1.5 ml Opti-MEM (Gibco) for each well at two hours before transfection. Meanwhile, we set two groups for transfection: negative control group (NC) and knockdown group (SH). For each well in SH group, 10 ul IGFBP1 knockdown plasmid was added into 240 ul Opti-MEM, as well as 5 ul lipo2000 (Thermo, USA) was supplanted into 245 ul Opti-MEM and set still at room temperature for 5 minutes. Next, we mixture plasmid solution with lipo2000 solution and set still at room temperature for 10 minutes, following adding total 500 ul transfection solution into 1.5 ml Opti-MEM culture medium to form 2 ml volume transfection system in each well. The NC group followed the same protocol but changed the knockdown plasmid into empty plasmid. After 8 hours transfection, we changed the transfection culture medium into 2 ml RPMI-1640 supplemented with 10% serum. The transfected efficacy was confirmed by examining the fluorescence percentage. We chose the wells that had a minimum of 80% fluorescence percentage for further investigation.
2.8RT-PCR
The reactions were performed on the QuantStudio 5 Real-Time PCR instrument (Thermo Fisher, USA) using 2x SYBR Green Pro Taq HS Premix II (AgBio, China). Normalization of mRNA levels was against GAPDH levels. For calculating the relative gene expression, the 2-
2.9CCK8 assay
This assay was followed by the protocol of Beyotime CCK8 kit. Briefly, we adjusted the cell density of transfected and control cells to 5000/100 ul. Then, we added 100 ul cell suspension into each well of 96-well plate, supplemented with 10 ul CCK8 solution, and cultured at 37∘C for one hour. Afterward, we examined the optical density at 450 nm wavelength to examine the cell proliferation. This assay was repeated at least three times.
2.10Wound healing assay
We seeded the transfected cells into six-well plates and waited for the cell density reaching more than 90%. Then we scratched several vertical lines by using a 200 ul pipette tip. After three times washing with PBS solution, we changed the culture medium to 2 ml serum-free culture medium. Photos of this assay at 0 hour, 24 hour were taken to examine the wound healing rates.
2.11Transwell assay
The transfected cells were incubated in serum-free medium for 12 h and then adjusted to a density of 1*106 cells/ml. Next, 200 mL of cell suspension was added to the transwell chambers (Corning, NO.3422), which were fit into the wells of 24-well plates. The wells of the plates also each contained 500 ml of RPMI-1640 medium supplemented with 10% FBS. After 24 hours of incubation, cells on the upper membrane were removed with cotton wool, whereas cells adhering to the lower surface were fixed in methanol for 30 min and then stained with 0.1% crystal violet for 10 minutes. After natural air drying, the migrating cells on the lower surface of the membrane were counted under an optical microscope at 200 folds magnification.
2.12Statistical analysis
We employed one-way ANOVA and t tests for comparisons between groups, and the comparison of two or more constituent ratios was performed by the chi-square test. Correlation analysis, heatmap, waterfall curve and box plots were completed by R software (version 3.5.1). We processed all statistical analyses by applying SPSS 19.0 software (SPSS. Inc., Chicago, IL, USA) or R software. In this work, we set the significance level to
Figure 1.
m6A MRGs significantly affect the survival of bladder cancer patients. (A, B) Overall survival (OS) and disease-specific survival (DSS) prognostic networks were constructed according to 17 MRGs. (C–I) Kaplan-Meier analysis of OS for m6A MRG genes.
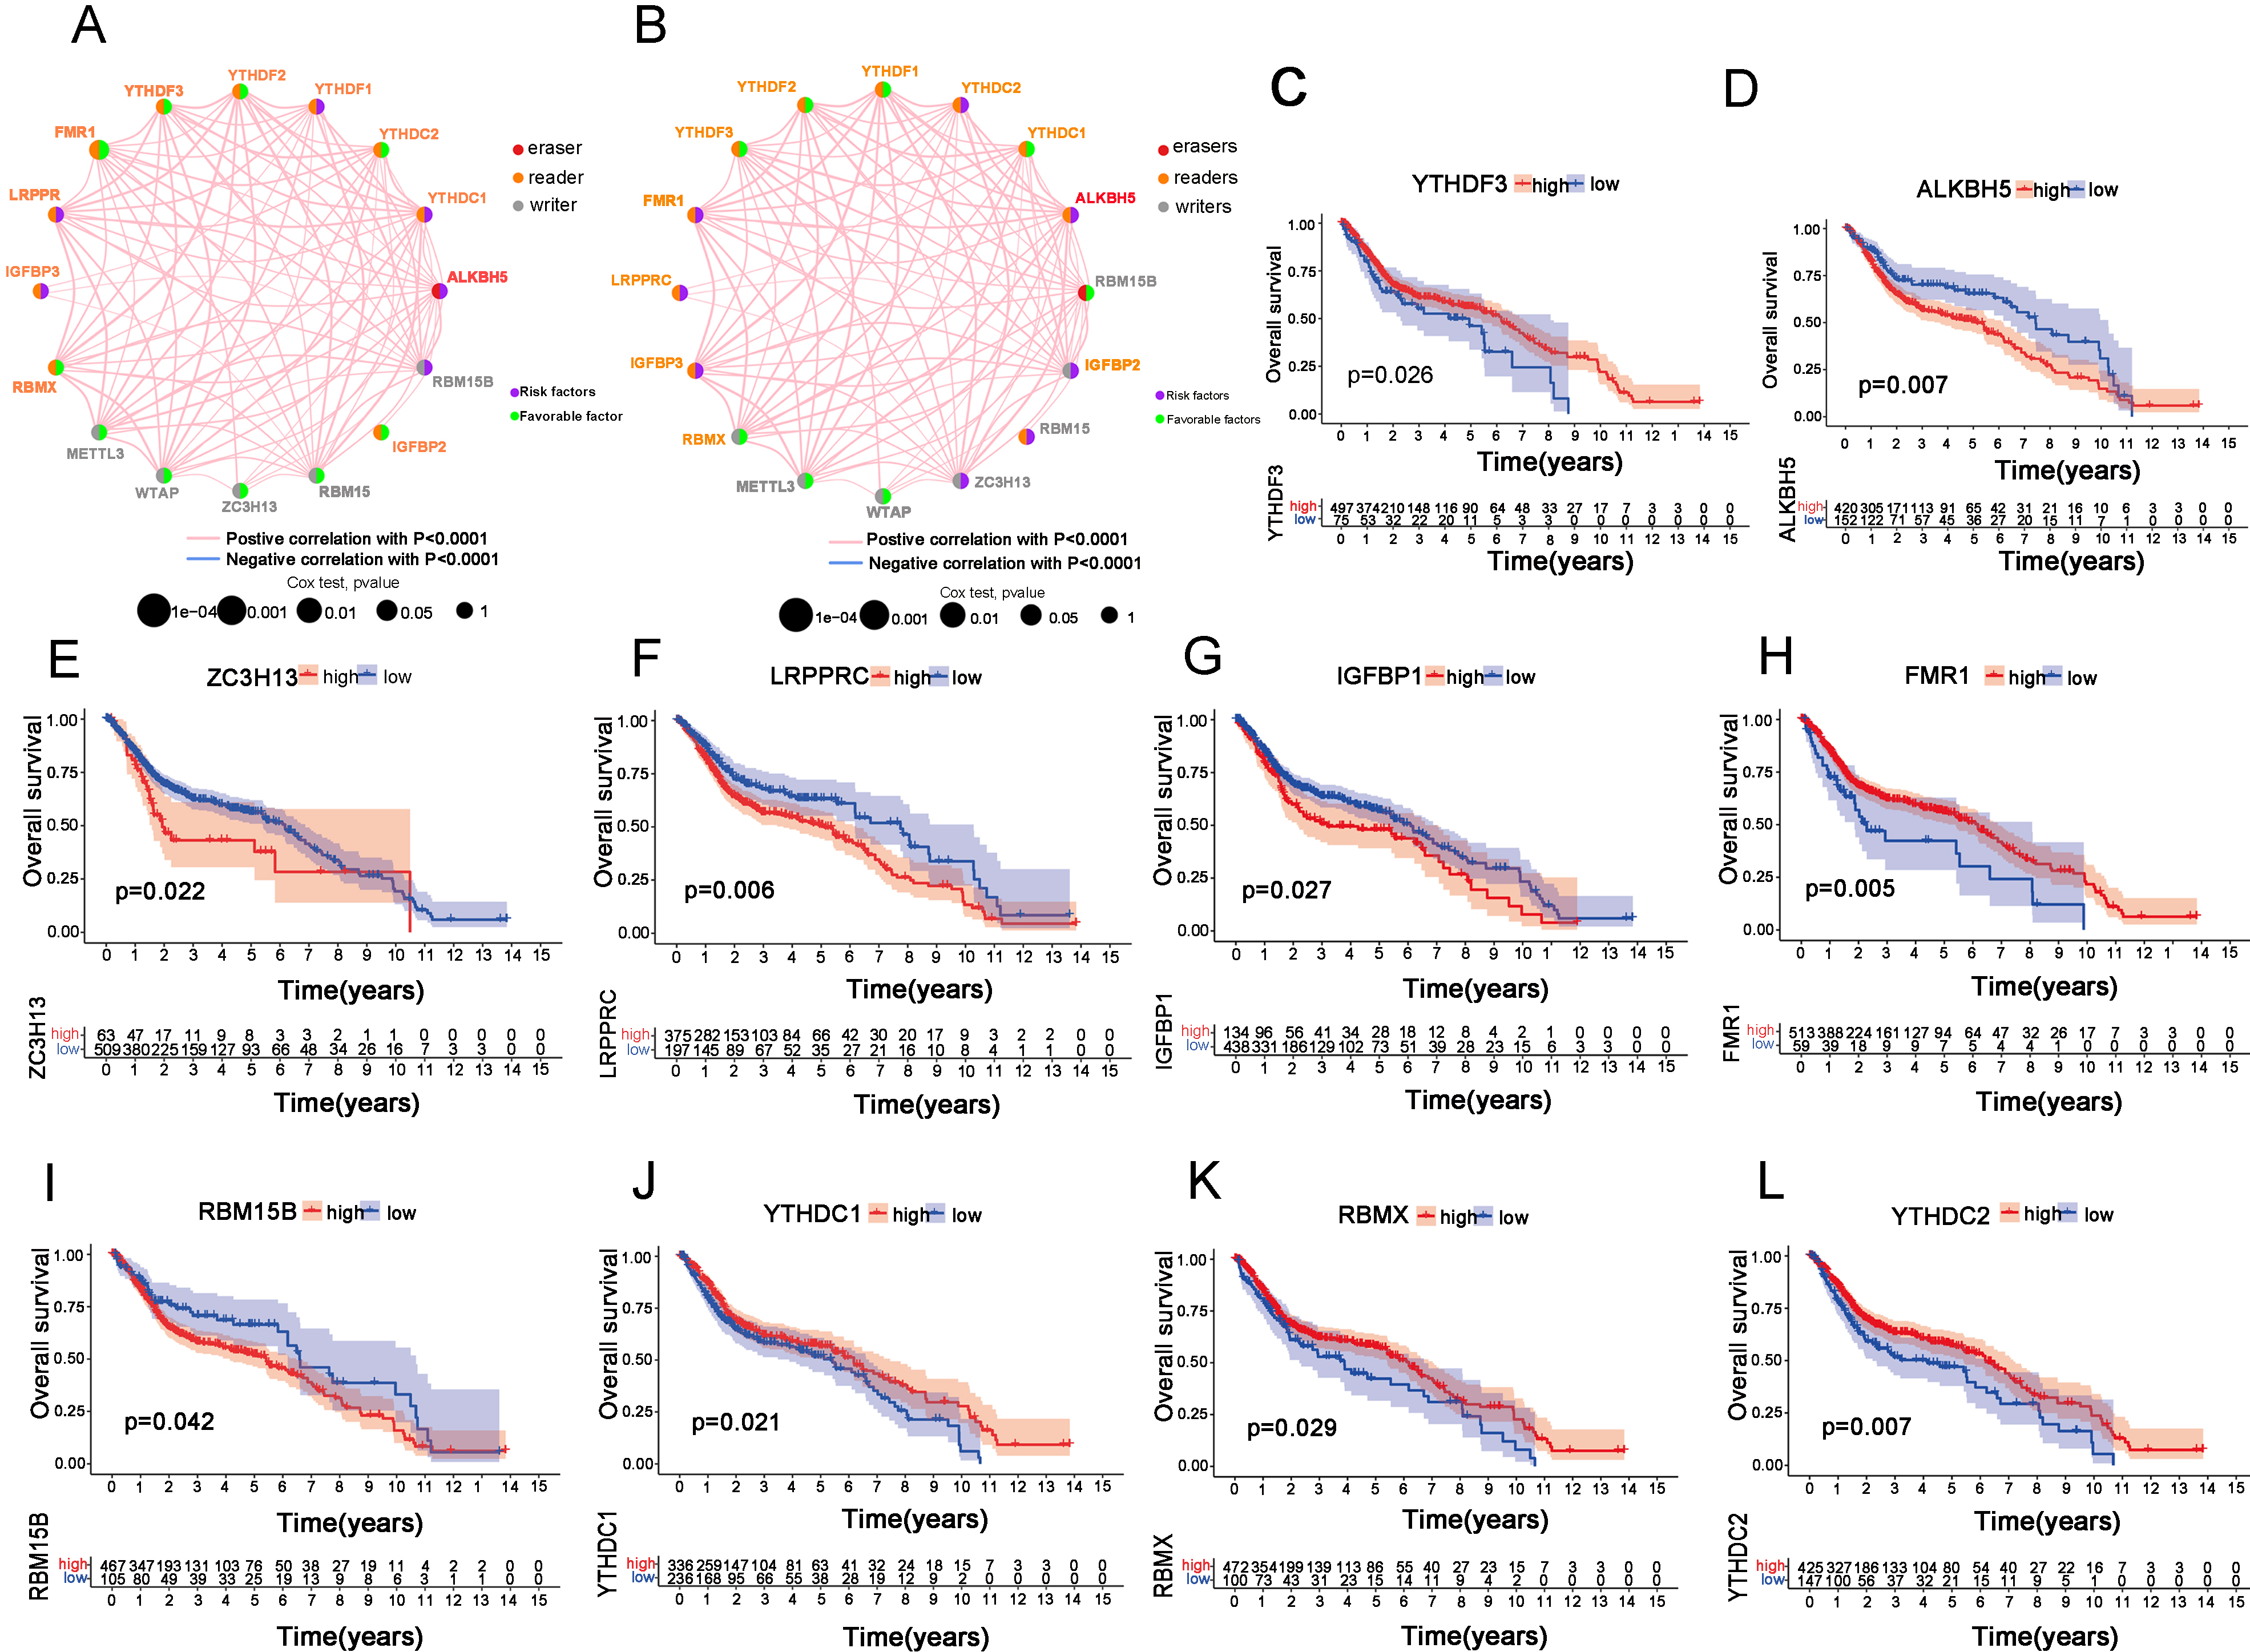
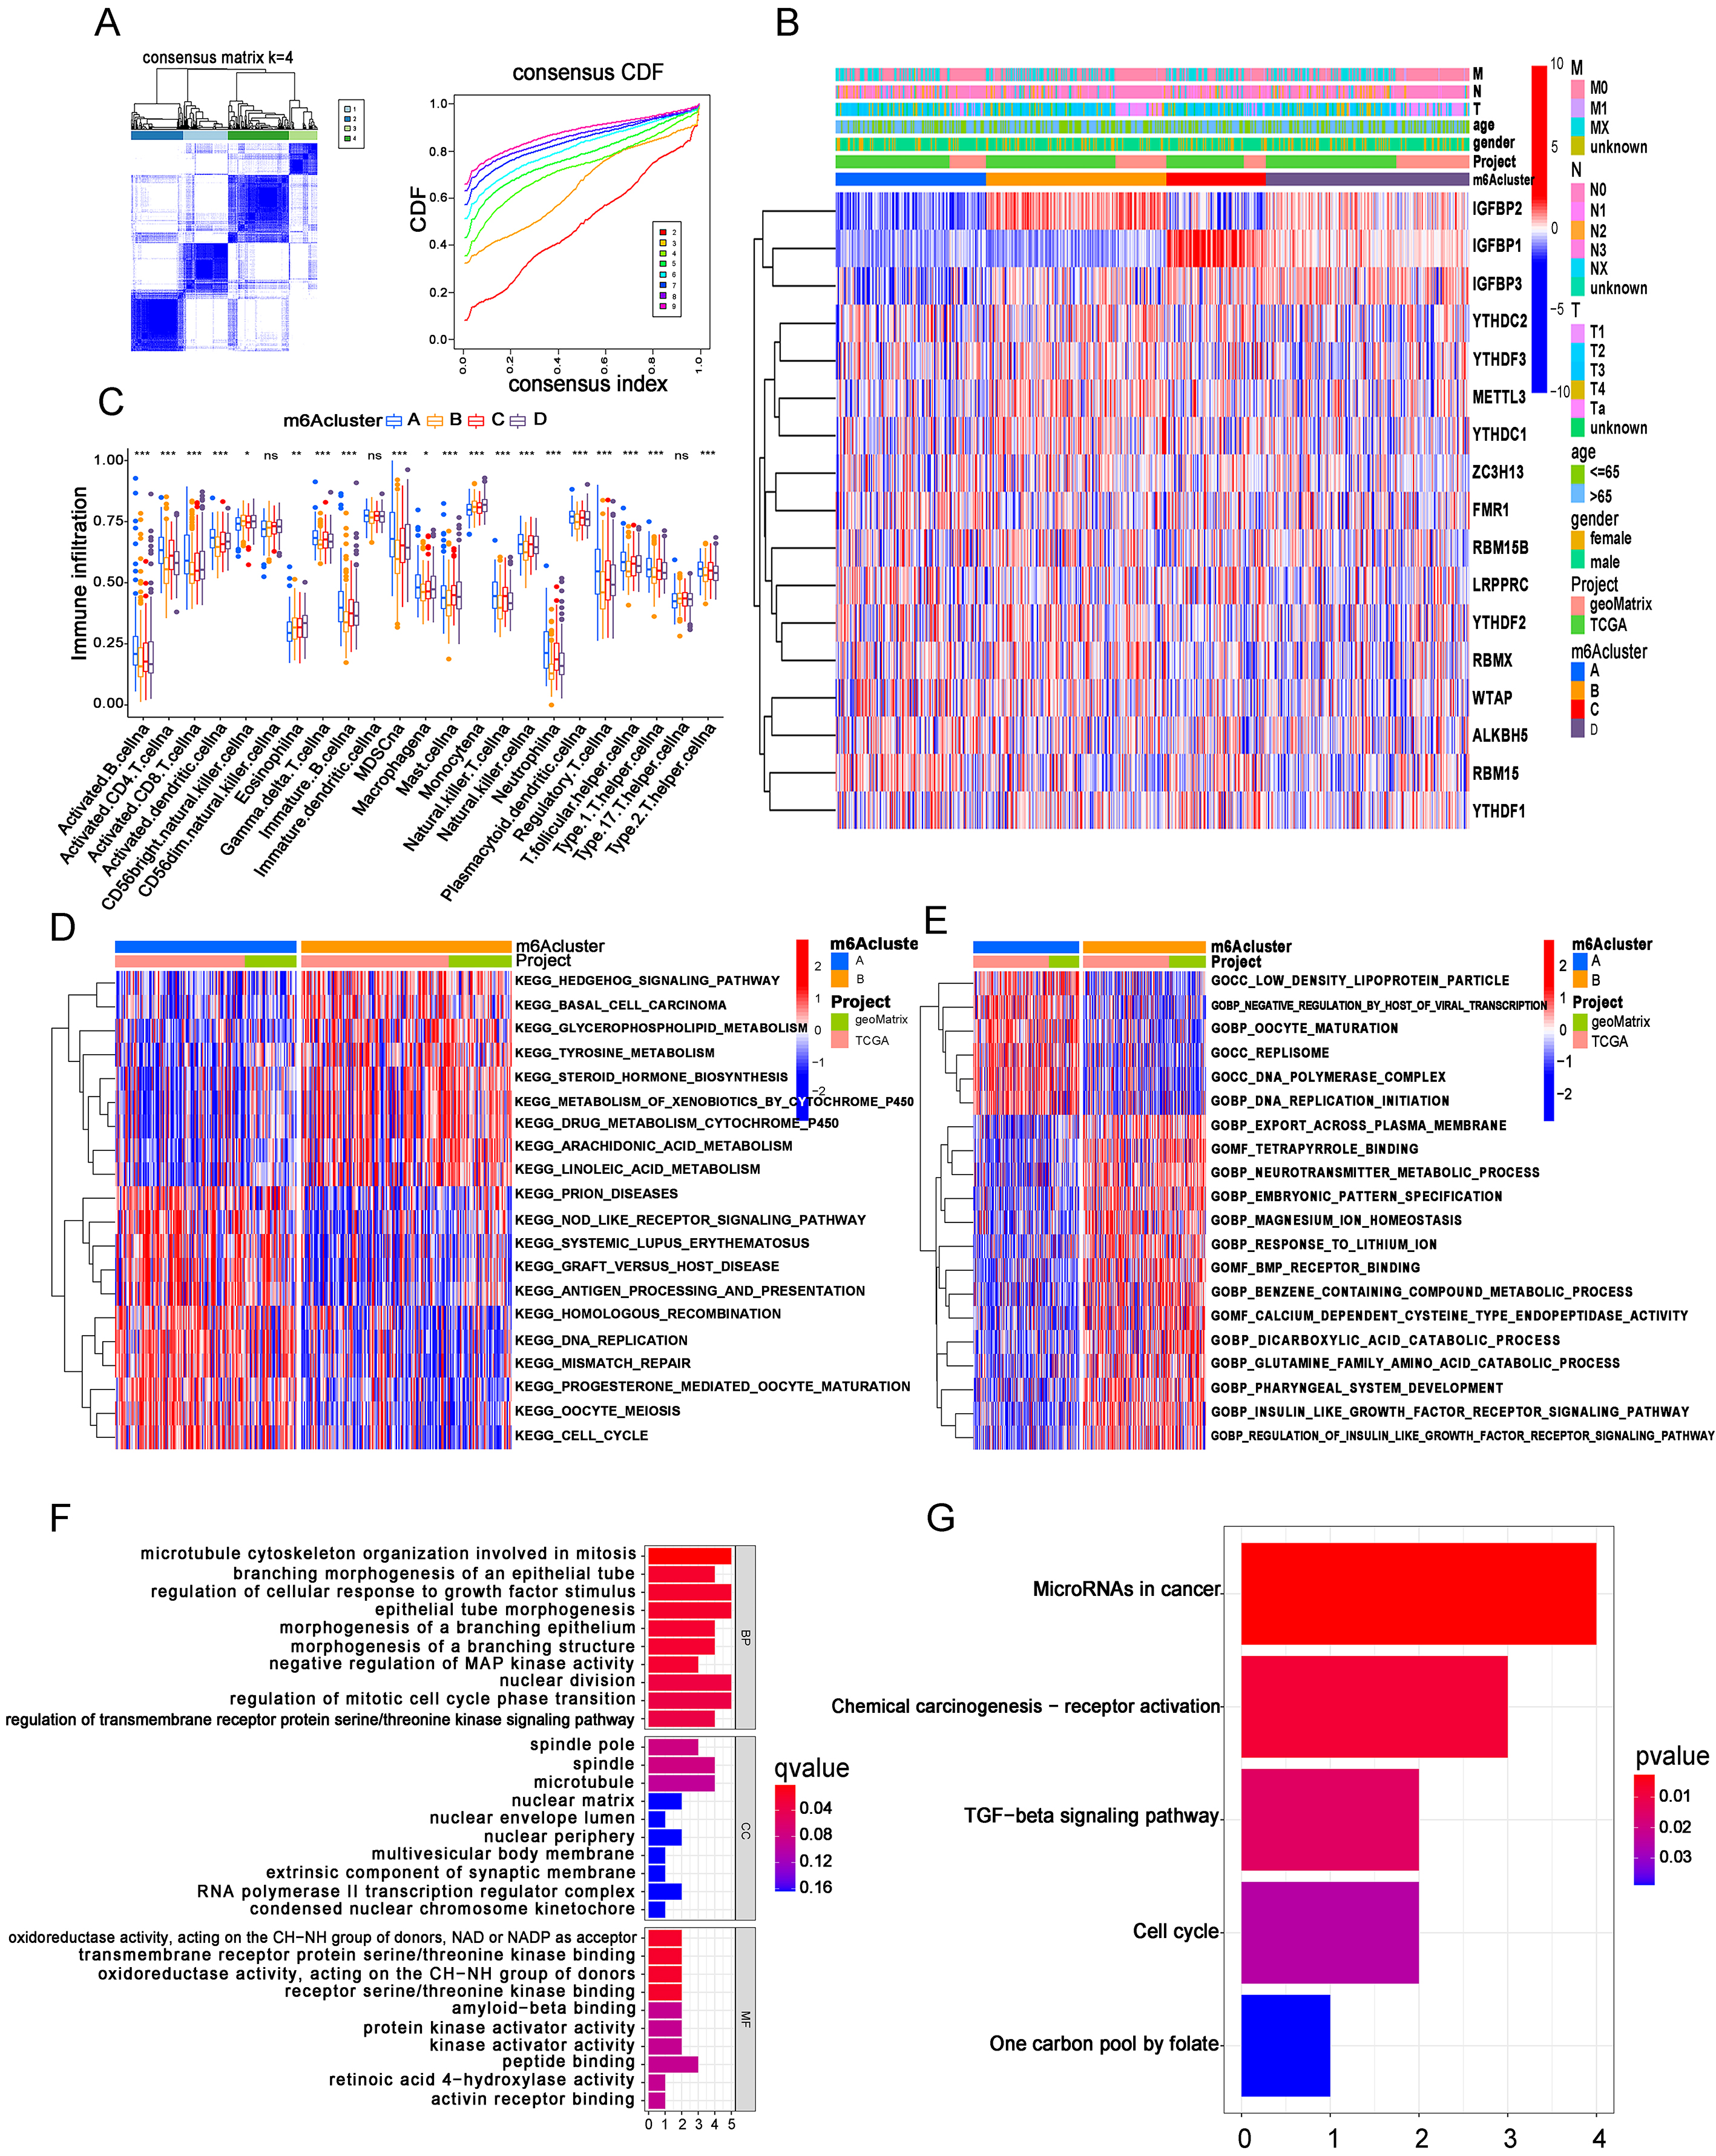
Figure 2.
m6A clusters were identified based on MRGs in BC patients. (A) BC samples (
3.Results
3.1Multi-omics biological characteristics of m6A MRGs and its relationship with survival in BC
First, we investigated the CNV status of 23 m6A MRGs in TCGA patients with BC. The results showed that 56.52% (13/23) of m6A-related genes gained more CNV frequencies than they lost, and VIRMA had the highest frequency. In contrast, 43.48% (10/23) of genes lost more CNV frequencies than they gained, and YTHDF2 had the top percentage (Supplementary Fig. 1A). Moreover, the localization of these genes in the chromosome was described as well (Supplementary Fig. 1B). Then, we found a good protein-protein interaction network, which revealed a potential regulatory relationship among these genes (Supplementary Fig. 1C). Next, we compared the expression statuses of these genes from 411 BC cases with 19 normal cases and found that HNRNPA2B1 and HNRNPC had the most significant differences (Supplementary Fig. 1D). After that, we found that these 23 genes were mutated in 24.51% of 411 TCGA BC patients, of which METTL3 was the most frequently mutated (Supplementary Fig. 1E). Furthermore, we investigated the expression status of 22 other genes when the METTL3 gene was mutated or not. The results showed that 17 genes were differentially expressed in METTL3 mutant or wild-type cells, and the results of RBM15 and YHDF2 are shown as examples (Supplementary Fig. 1F and G), which indicated that METTL3 was one of the key m6A MRGs in BC.
We combined 411 BC cases in TCGA and 188 GEO BC cases and finally identified 17 MRGs with complete data for subsequent analysis. Next, we constructed overall survival (OS) and disease-specific survival (DSS) prognostic networks according to these 17 MRGs (Fig. 1A and B). More precisely, the networks exhibited the detailed function of these MRGs in m6A methylation (erasers, readers or writers), as well as the correlation between genes and the role of the gene as a protective or risk factor in OS and DSS. Then, we investigated every single gene by Kaplan-Meier analysis and finally found that ALKBH5, ZC3H13, LRPPRC, IGFBP1, and RBM15B were associated with poor OS and that FMR1, YTHDF3, YTHDC1, RBMX and YTHDC2 were associated with better OS (Fig. 1C–L). Additionally, we performed Kapan-Meier analysis for DSS and found that 9 of 17 MRGs were statistically significant (Supplementary Fig. 2A–I). All these findings highlight the important roles of m6A MRGs in the prognosis of BC.
3.2m6A clusters were identified based on MRGs in BC patients
Based on the gene expression of these 17 m6A MRGs, a consensus clustering analysis was performed for 596 BC cases (408 from TCGA and 188 from GEO), and the results showed that our patients were well divided into 4 m6A clusters when
Consistently, we also performed GO functional analysis between m6A clusters. From the results of the comparison between clusters A and B, we noticed that several GO biological processes (GOBP), such as DNA replication initiation, and GO cellular components (GOCC), such as replisome, were at higher levels in cluster A, while some GOBPs and GO molecular functions (GOMF) were downregulated in cluster A. Interestingly, we noticed that insulin-like growth factor (IGF)-related GOBP levels were lower in patients from cluster A, whose prognosis and m6A score were the worst, while IGF levels were commonly upregulated in advanced malignancies (Fig. 2E) [17, 18]. Nevertheless, comparisons of GO function analysis between cluster A and other m6A clusters were also performed (Supplementary Fig. 4A and B). In addition, we also conducted pairwise comparisons of GO functions between other m6A clusters (Supplementary Fig. 4C–E). After that, we distinguished the differentially expressed genes by comparing every two m6A clusters (clusters A and B, A and C, A and D, B and C, B and D, and C and D) and further intersected these differentially expressed genes among these comparisons to process Unicox analysis, which finally identified 11 OS-related genes (OSRGs) (CRTAC1, SMAD6, CDC25B, ZNF552, KLHL3, TPX2, WDR62, MTHFD2, PAQR4, KPNA2 and CLIC4). Additionally, we employed GO and KEGG enrichment analysis for these 11 OSRGs. We found that these genes were mainly enriched in microtubule cytoskeleton organization involved in mitosis, regulation of cellular response to growth factor stimulus and epithelial tube morphogenesis (Fig. 2F). At the same time, we noticed that OSRGs were mainly enriched in microRNAs in cancer, as well as TGF-
3.3m6A score was established to predict the prognosis of BC patients
Figure 3.
The m6A score was established to predict the prognosis of BC patients. (A) BC samples (
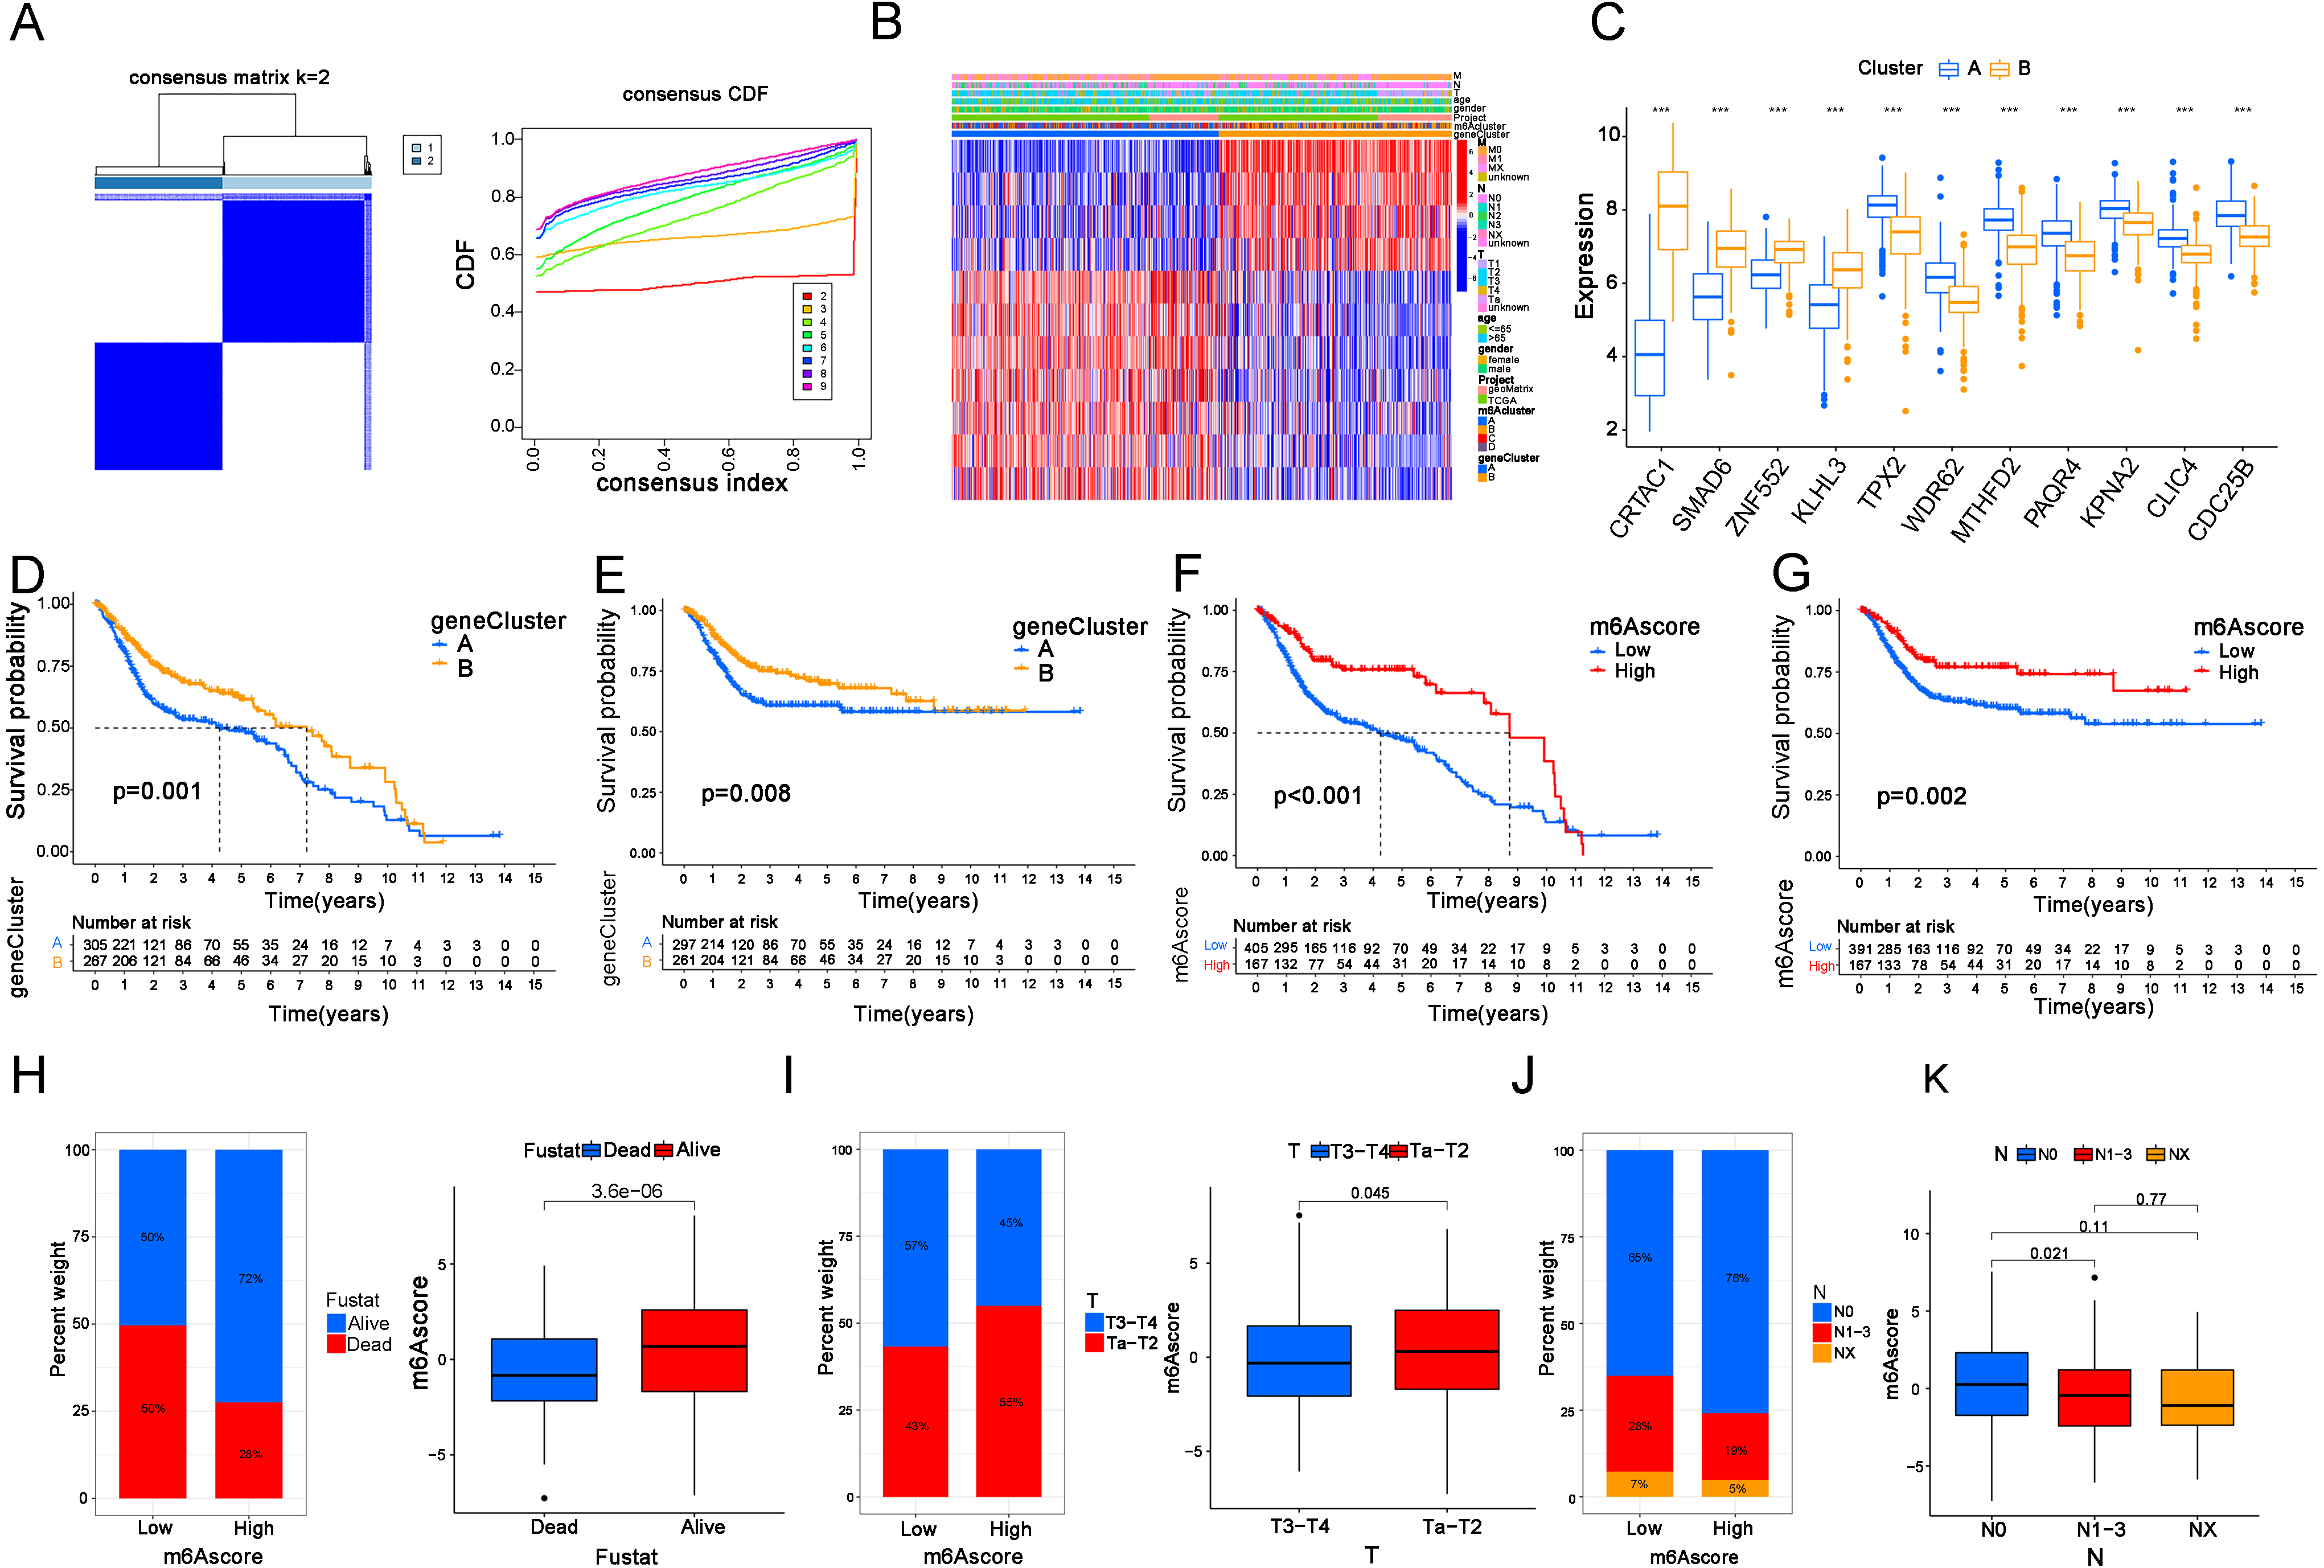
To further investigate the roles of these 11 OSRGs in our patients, a new consensus clustering analysis was performed. When
3.4m6A score is closely related to TMB and gene mutations in BC patients
Figure 4.
The m6A score is closely related to TMB and gene mutations in BC patients. (A) m6A score levels in m6A cluster groups. (B) m6A score levels in gene clusters. (C) Corresponding relations between the m6A cluster, gene cluster, m6A score and Fustat in our patients. (D) TMB levels in the m6A score groups. (E) The correlations between TMB levels and m6A score. (F) Kaplan-Meier analysis of OS in patients with high and low TMB levels. (G) Kaplan-Meier analysis for OS in cases with four combinations that consisted of different TMB levels and different m6A scores. (H, I) The top 20 mutant genes in the HS (H) and LS groups (I).
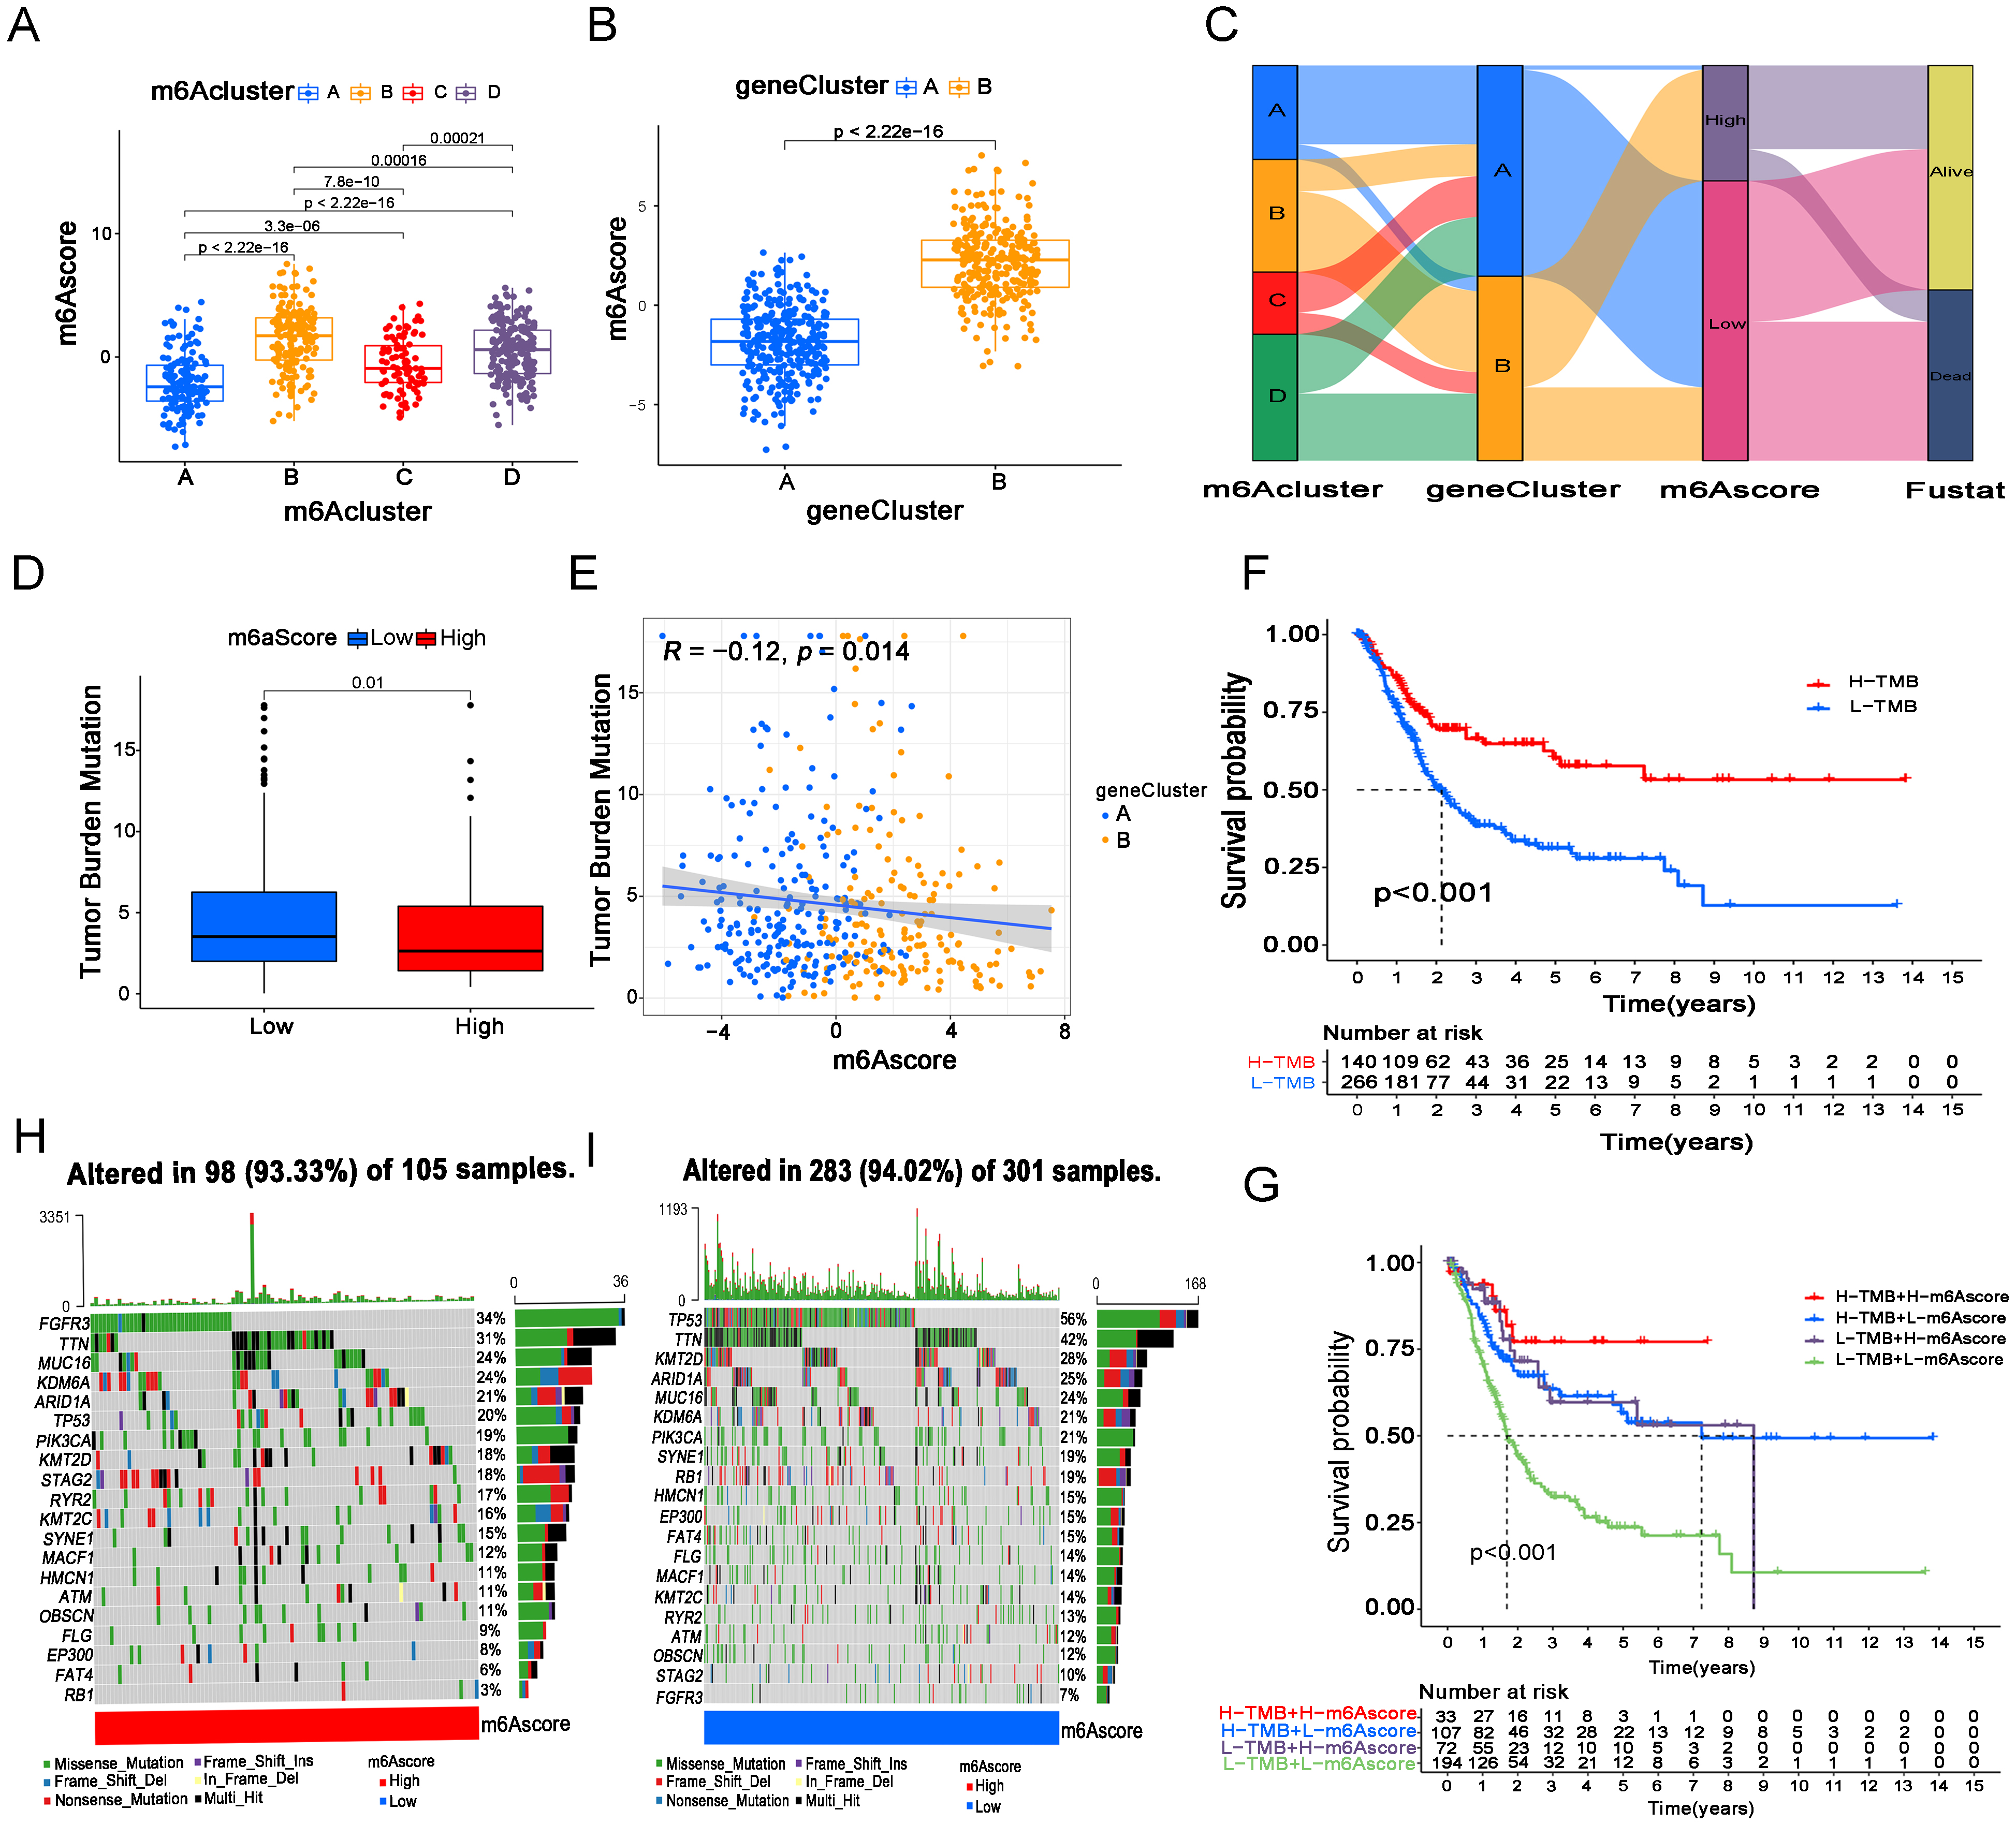
First, we examined the relationship between the m6A score and m6A clusters and gene clusters (Fig. 4A and B). From the results, we found that patients in m6A cluster B, m6A cluster D and gene cluster B had higher m6A scores, suggesting a better prognosis, which is basically consistent with our previous conclusion. Next, a more intuitive Sankey diagram showed the corresponding relationship among the m6A cluster, gene cluster, m6A score and fustat status among 596 BC cases (Fig. 4C). Next, we found that the m6A score was negatively correlated with the TMB level, and the HS group was associated with a lower TMB level than the LS group (Fig. 4D and E). Then, we investigated the prognosis of BC with high and low TMB levels via Kaplan-Meier analysis for OS. Surprisingly, the results showed that patients with higher TMB levels gained better survival possibilities than those with lower TMB levels (Fig. 4F). Moreover, patients with high TBM and high m6A scores had the best prognosis, while patients with low TMB and low m6A scores had the worst prognosis (Fig. 4G). Nevertheless, we know that the effect of TMB on cancer patients is double-sided. In our results, high m6A score and high TMB both showed better prognosis, while the inverse association between TMB and m6A score seems puzzling, but it is not contradictory since the overall outcome is usually caused by multiple biological factors. A single factor of TMB is not sufficient to alter the final outcome in our patients.
Additionally, we assessed the gene mutation status of 406 cases in the m6A score groups via Maftools (Fig. 4H and I). From the results we noticed that the total mutant frequencies between HS group and LS group were similar (93.33% vs 94.02%), but FGFR3 was the most common mutant gene in cases from HS group, while TP53 in LS group. The differences in gene mutation status between m6A score groups could partly explain the different outcomes of cases in different groups.
3.5The LS group predicts a higher risk of immune escape in BC patients
Figure 5.
The LS group predicts a higher risk of immune escape in BC patients. (A, B) The immune score of Treg cells (A) and CD8
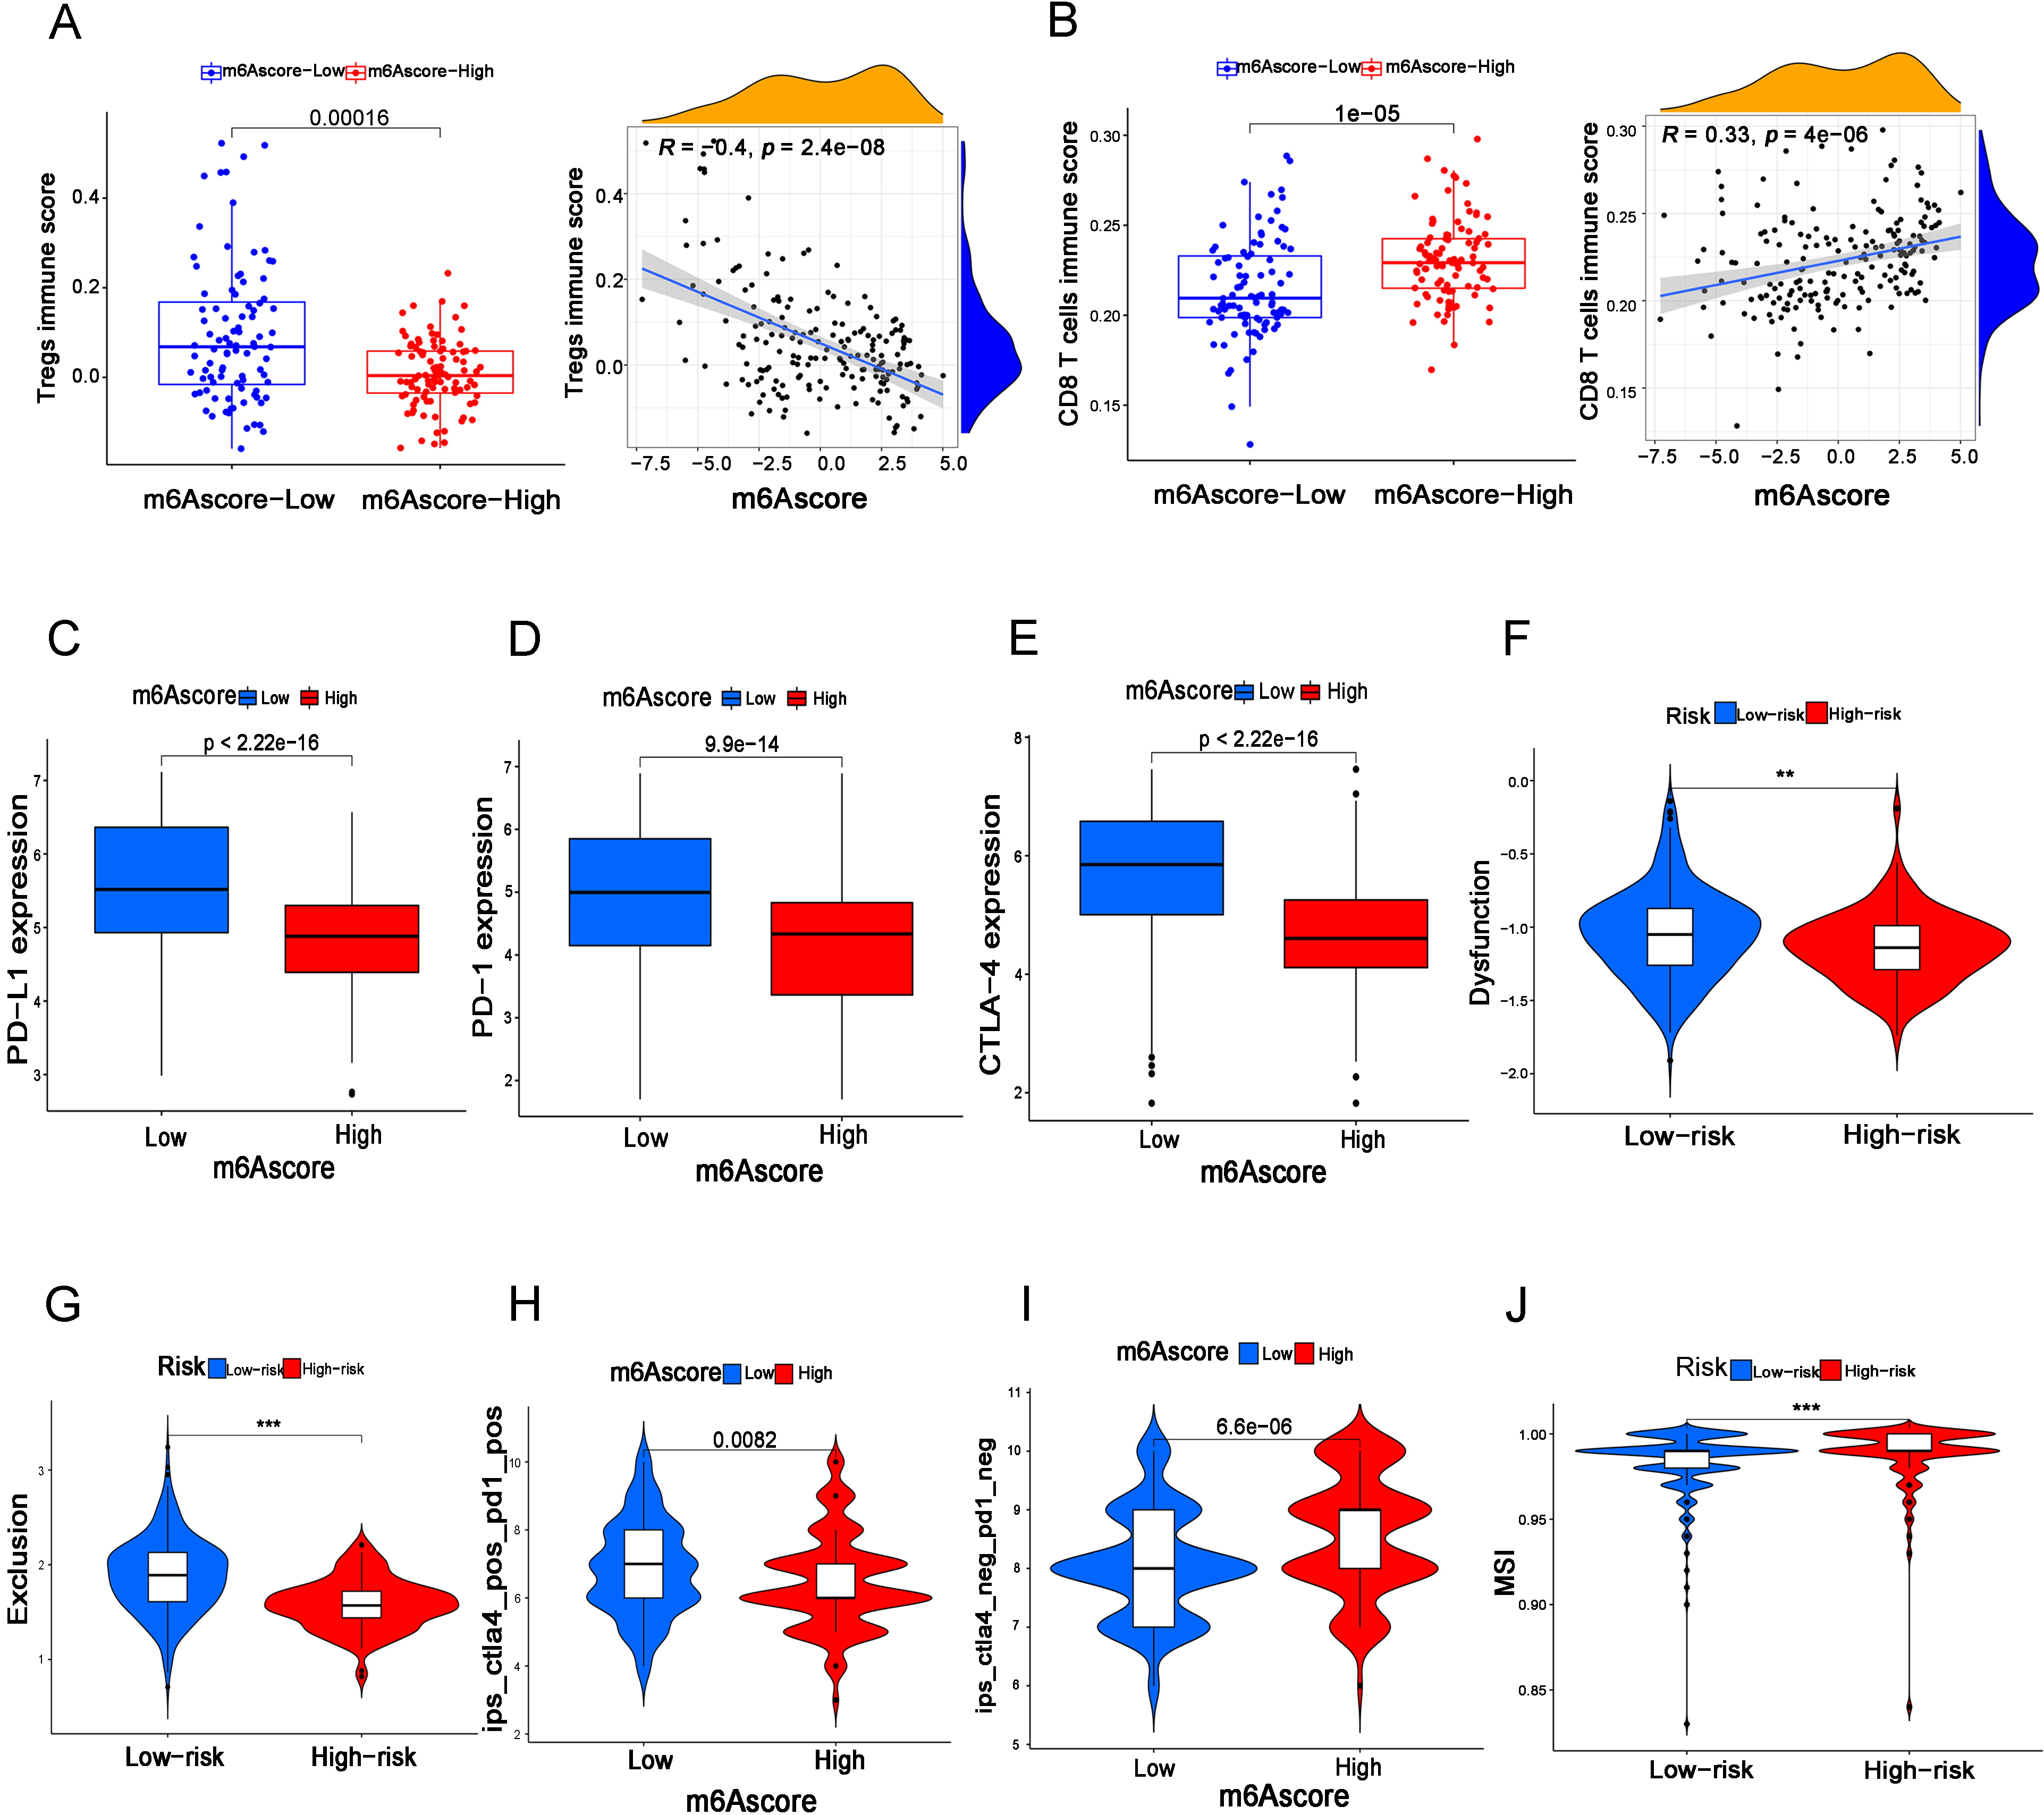
Furthermore, we assessed the correlation of the m6A score with tumor immunity in BC. According to the results, we found that the m6A score was closely related to immune cell infiltration, and the LS group had higher infiltration of Treg cells and lower infiltration of CD8
Figure 6.
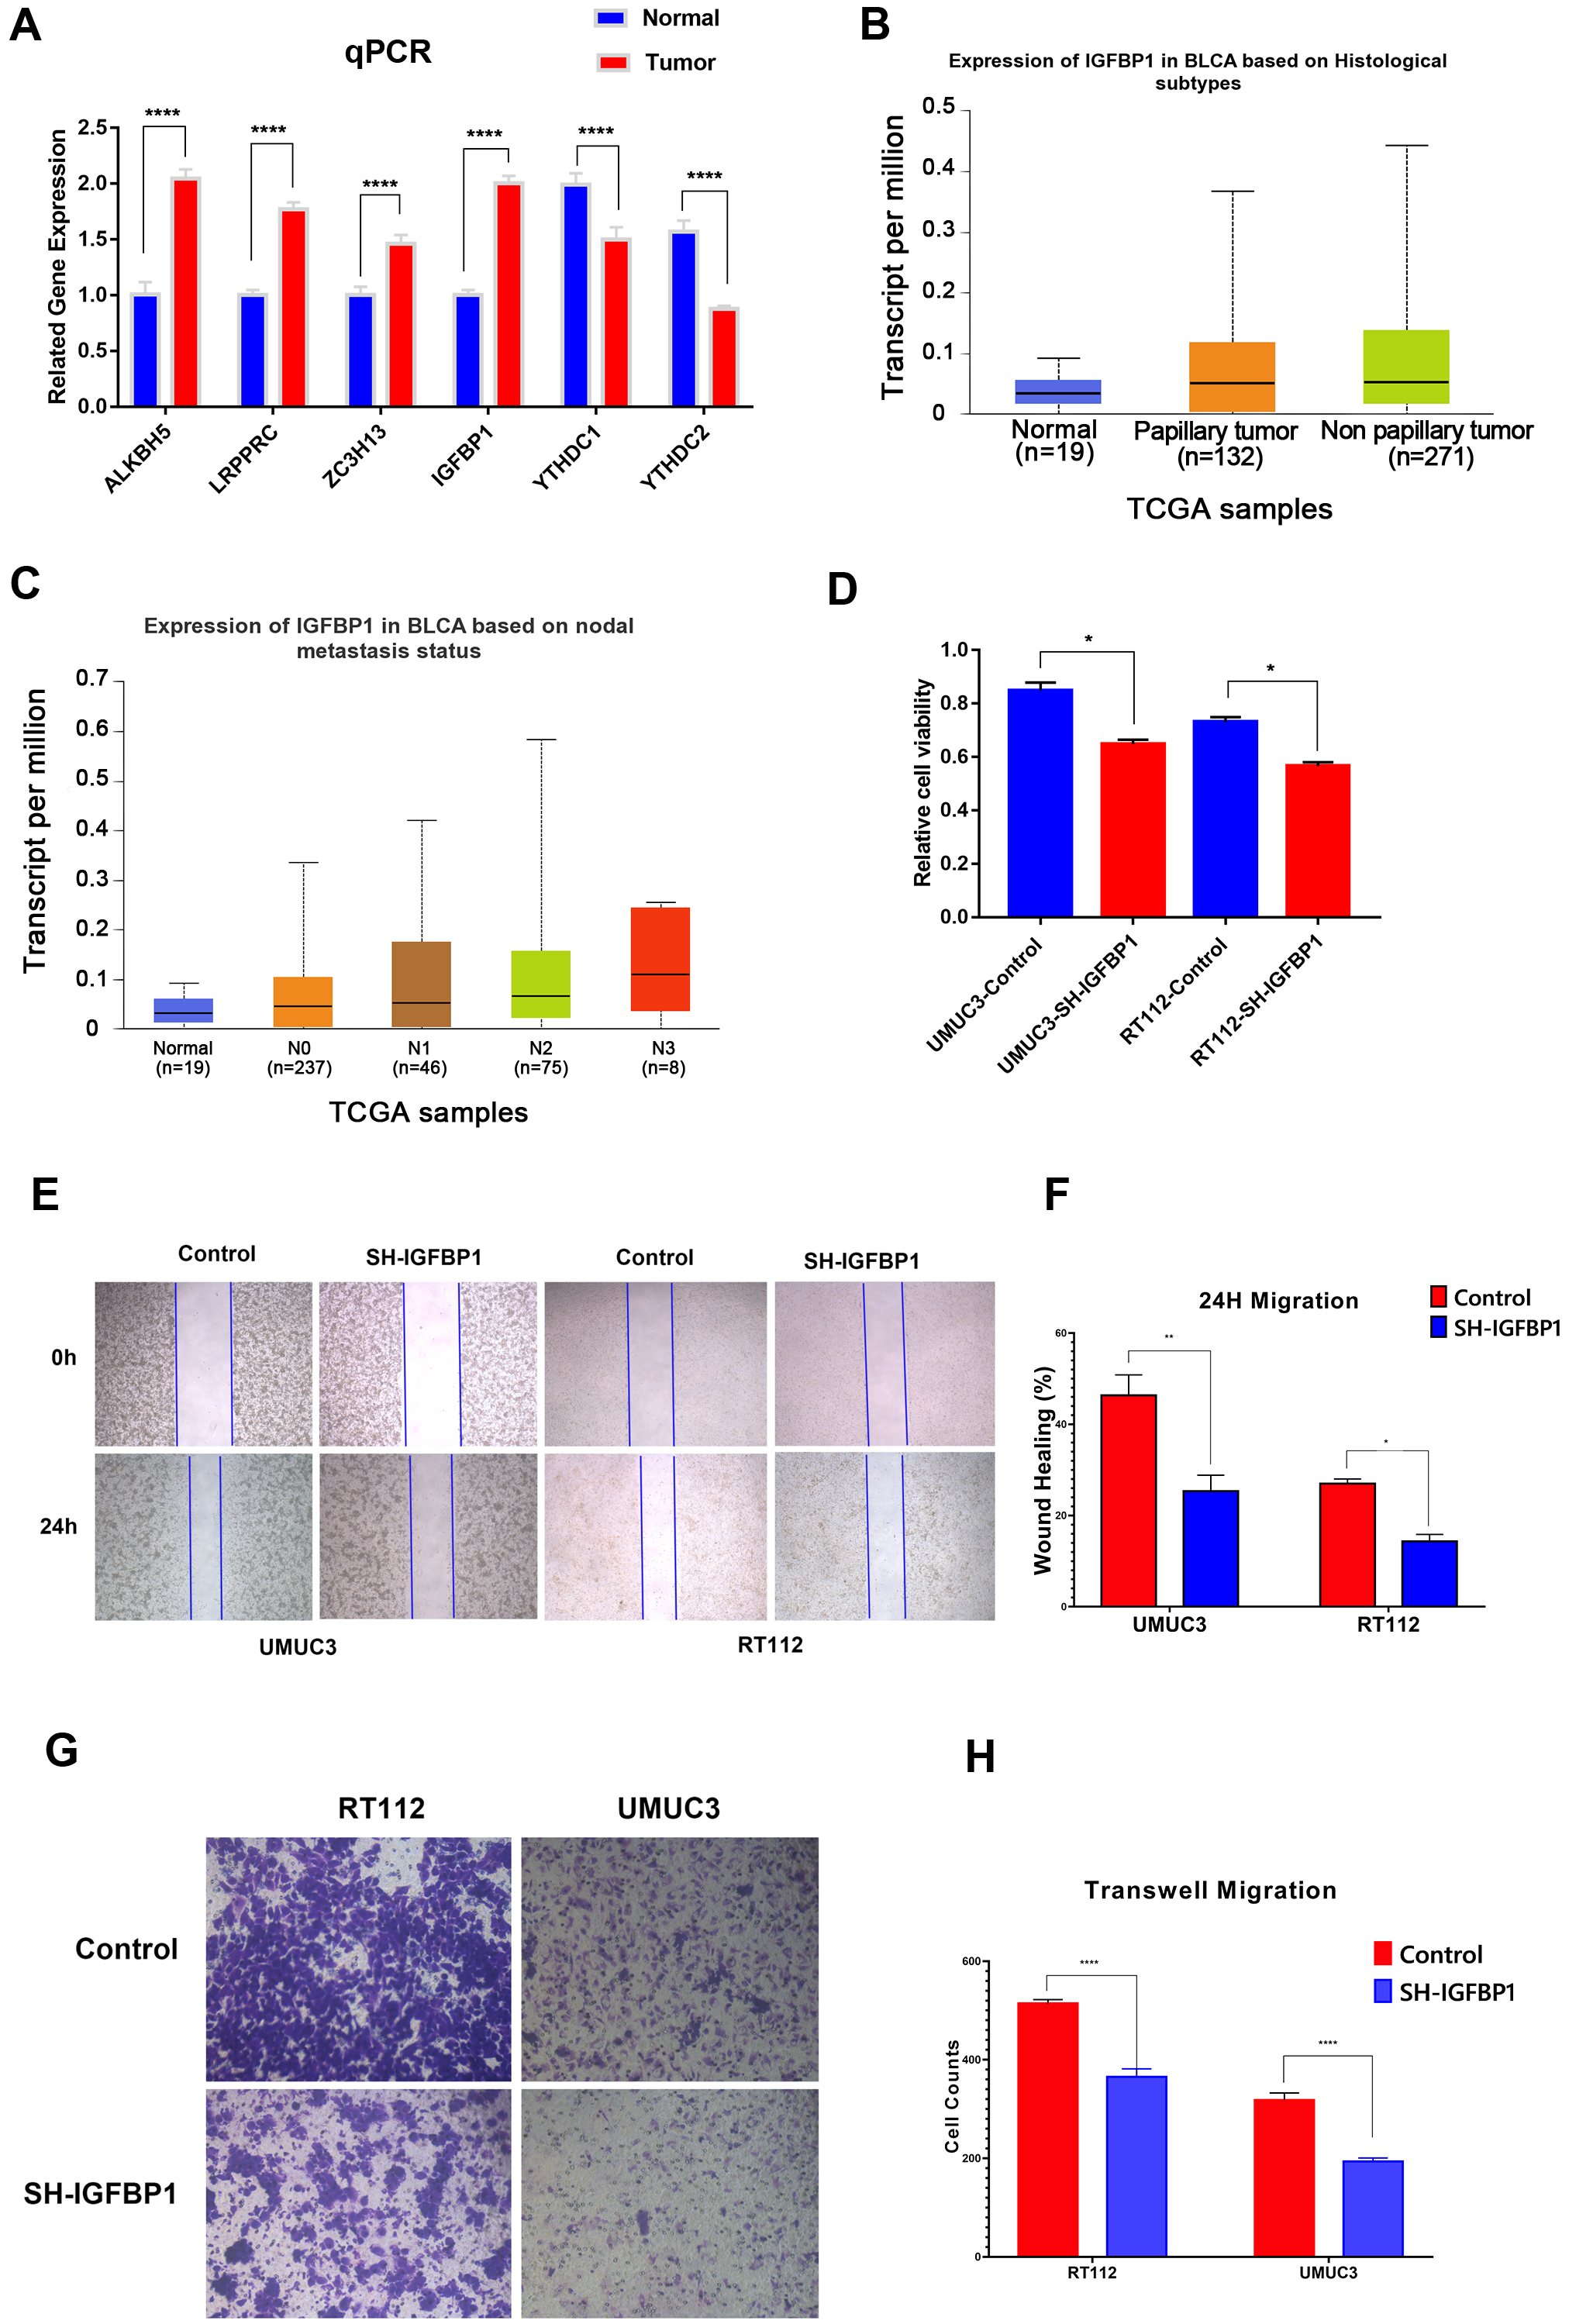
Experimental verification of m6A related gene and prognosis of bladder cancer. A: The gene expression of ALKBH5, ZC3H13, LRPPRC, IGFBP1, YTHDC1 and YTHDC2 in bladder cancer tissues and adjacent normal tissues was measured by qPCR. B: CCK8 was used to determine the growth activity in the IGFBP1 knockdown group and empty vector group of bladder cancer cells. C and D: Gene expression levels of IGFBP1 in different groups. E and F: A wound healing assay was used to measure the migration ability of UMUC3 and RT112 cells in the IGFBP1 knockdown group and empty vector group. G and H Transwell assays were used to measure the migration ability of UMUC3 and RT112 cells in the IGFBP1 knockdown group and empty vector group.
3.6Experimental verification of m6A related gene and prognosis of bladder cancer
In this work, we identified a total of six m6A related genes that were both associated with overall survival and disease-specific survival, of which ALKBH5, ZC3H13, LRPPRC, IGFBP1 were associated with poor survival and YTHDC1 and YTHDC2 were associated with better survival. Furthermore, qPCR showed that the gene expression of ALKBH5, ZC3H13, LRPPRC, IGFBP1 in bladder cancer tissues was significantly higher than that in normal tissues, and YTHDC1 and YTHDC2 in bladder cancer tissues was significantly lower than that in normal tissues (Fig. 6A).
Among the six m6A related genes, of which ALKBH5, LRPPRC and YTHDC1 have been clearly reported to be associated with bladder cancer in the literature, but the biological roles of ZC3H13, IGFBP1 and YTHDC2 in bladder cancer are poorly understood [18, 19, 20, 21, 22, 23, 24, 25, 26]. Furthermore, we analyzed ZC3H13, IGFBP1 and YTHDC2 in TCGA dataset, and found that IGFBP1 had a higher expression level in non primary bladder cancer and high lymph node metastasis patients (Fig. 6B and C), while ZC3H13 and YTHDC2 did not observe this trend. These findings suggest that IGFBP1 may be more related to the poor prognosis of bladder cancer. Therefore, we selected IGFBP1 for further experimental verification. The results showed that the growth activity of bladder cancer cells in the IGFBP1 knockdown group was significantly inhibited in UMUC3 and RT112 cells compared to that in the empty vector transfection group (Fig. 6E and F). In addition, in UMUC3 and RT112 cells, the metastatic ability of the IGFBP1 knockdown group was significantly inhibited compared with that of the empty vector transfection group (Fig. 6G and H). These results suggested the important role of m6A-related genes, especially IGFBP1, in the prognosis of bladder cancer.
4.Discussion
At present, increasing evidence suggests the important roles of m6A in the development of tumors. It has been reported that VIRMA is the most commonly upregulated m6A gene in BC and is essential to the m6A of mRNA in the 3’ untranslated regions (3’UTRs) and around the stop codon, as well as alternative polyadenylation [27]. Meanwhile, the expression of YTHDF2 was suggested to correlate with a good prognosis in BC [28]. These results implied the important roles of m6A genes in BC. Rencently, Liu et al. determined three different N6-methyladenosine modification patterns and explored the inherent relationships between these modification patterns and multiomic tumor characteristics [17], which revealed the important roles of m6A methylation modification patterns in bladder cancer. However, due to the complex functions of m6A related genes, more evidence needs to be further explored in bladder cancer. In this work, we has drawn many new and valuable findings that differ from Liu et al.’s study. First, we have proposed a new m6A clustering scheme and performed corresponding functional enrichment analysis, immune infiltration analysis for BC patients. In addition, we have determined a new genotyping results based on m6A related genes and performed corresponding survival prognosis analysis for BC patients. Moreover, based on the m6A score, we performed disease-specific survival analysis, tumor mutational burden analysis, gene mutation characteristics analysis, immune exclusion analysis, immune dysfunction analysis, microsatellite instability (MSI) analysis, CD8
According to our results, METTL3 was the most frequently mutated m6A gene in BC, and different mutation statuses of METTL3 could influence the expression levels of other m6A genes, which may partly contribute to the prognosis of BC. METTL3 has been reported to anticipate tumorigenesis by playing roles as a m6A “writer”, either as an oncogene or a suppressor gene, in many types of cancers [29]. In addition, it is suggested that the expression level of METTL3 was upregulated in BC and improved mRNA translation levels through YTHDF1/3 binding, which was regulated by METTL3 m6A modification targeted to CDCP1 and ITGA6 [30, 31]. In addition, METTL3 was found to function as an oncogene that could promote tumor proliferation in BC via the accumulation of pri-miR221/222 mutations in the m6A process [32]. Moreover, a study indicated that METTL3 might improve BC progression and angiogenesis via tyrosine kinase endothelial and vascular endothelial growth factor A, which could be a potential therapeutic target [33]. In summary, METTL3 is a vital m6A gene and plays important roles in tumorigenesis in BC. According to the m6A cluster, we comprehensively analyzed m6A gene functions and pathways in BC. We noticed that DNA replication function and IGF-related proteins and pathways were strongly associated with the m6A process. The IGF system is believed to play important roles in cell proliferation, differentiation and metabolism [34]. Commonly, the level of the IGF system is higher in malignant cells and tissues, which is associated with a poor prognosis [32]. IGFBPs are ligands of IGF proteins that help IGF combine with IGF receptors. A few studies revealed that low levels of IGFBPs were found in BC because of methylation in IGFBP genes, while the mechanisms of m6A suppression of the IGF system in BC remain rarely explored [35, 36]. Accordingly, we believe that it is worth further investigating the relationship between the m6A process and IGF systems in cancers.
Furthermore, according to our m6A clusters, a total of 11 OSRGs (CRTAC1, SMAD6, CDC25B, ZNF552, KLHL3, TPX2, WDR62, MTHFD2, PAQR4, KPNA2 and CLIC4) were identified in our patients. Among these 11 genes, CRTAC1, SMAD6, KLHL3 and ZNF552 were downregulated in gene cluster A, which had a poorer prognosis. A study reported that CRTAC1 inhibits the malignant behaviors of BC cells by mediating the downstream gene Yin Yang 1 (YY1) to inactivate TGF-
In our study, we found that patients with high TMB levels had a better prognosis, and the LS group not only had a poor prognosis but also had a high TMB level. The TMB level is considered a biomarker to predict the immunotherapy response in many types of cancers, including BC, and a high TMB level is believed to be associated with a better immunotherapeutic response [48]. A better immunotherapy effect in the high TMB group may be the reason for the better prognosis. We could not fully understand the mechanism by which the LS group had high TMB levels, but we know that organisms are so complex and that TMB levels could not influence the final outcome as a single factor in our patients.
Importantly, we discovered the potential value of the m6A score in immune escape and prediction of the effect of immunotherapy. First, we found that TP53 was the most frequently mutated gene in the LS group. The normal function of TP53 is mainly as a suppressor gene, which could initiate cell apoptosis when cell cycle arrest or DNA damage occurs [49]. Meanwhile, TP53 is reported as the most common mutant gene in human malignancy, with possibilities to predict prognosis and immunotherapeutic response in BC [16, 50]. Accordingly, we speculated that the high TP53 mutation rate in the LS group could be the key reason for the poor prognosis. Moreover, we further found that the m6A score was negatively correlated with regulatory T cells (Tregs) and positively correlated with CD8
5.Conclusions
In conclusion, we demonstrated the important roles of m6A MRGs in predicting prognosis, TMB status, TP53 mutation, immune functions and immunotherapeutic response in BC. These findings may also provide new potential targets for the precision treatment of BC.
Funding
This study was supported by the Horizontal Project of Heilongjiang Renxin Medical Assistance Foundation, Heilongjiang Charity Fund General Association and Natural Science Foundation of Heilongjiang Province (No. LH2019H030 to Minghua Ren).
Author contributions
Conception: Minghua Ren, Wanhai Xu; Interpretation or analysis of data: Yang Liu, Zhongqi Pang, Jianshe Wang; Preparation of the manuscript: Jinfeng Wang, Bo Ji; Revision for important intellectual content: Yidan Xu, Jiaxin He; Supervision: Lu Zhang, Yansong Han, Lingkun Shen.
Data availability statement
All data in this study are available in the TCGA data portal (https://tcga-data.nci.nih.gov/tcga/) and GEO data portal (http://www.ncbi.nlm.nih.gov/geo/).
Ethics approval
Not applicable.
Supplementary data
The supplementary files are available to download from http://dx.doi.org/10.3233/CBM-230286.
Acknowledgments
We are grateful to the TCGA and GEO databases for their data support and the support of the Horizontal Project of Heilongjiang Renxin Medical Assistance Foundation, Heilongjiang Charity Fund General Association and Natural Science Foundation of Heilongjiang Province.
Conflict of interest
The authors have no relevant financial or nonfinancial interests to disclose.
References
[1] | F. Bray, J. Ferlay, I. Soerjomataram, R.L. Siegel, L.A. Torre and A. Jemal, Global cancer statistics 2018: GLOBOCAN estimates of incidence and mortality worldwide for 36 cancers in 185 countries, CA Cancer J Clin 68: ((2018) ), 394–424. doi: 10.3322/caac.21492. |
[2] | A. Richters, K.K.H. Aben and L.A.L.M. Kiemeney, The global burden of urinary bladder cancer: An update, World J Urol 38: ((2020) ), 1895–1904. doi: 10.1007/s00345-019-02984-4. |
[3] | A.T. Lenis, P.M. Lec, K. Chamie and M.D. Mshs, Bladder cancer: A review, JAMA 324: ((2020) ), 1980–1991. doi: 10.1001/jama.2020.17598. |
[4] | S.J. Crabb and J. Douglas, The latest treatment options for bladder cancer, Br Med Bull 128: ((2018) ), 85–95. doi: 10.1093/bmb/ldy034. |
[5] | Y. Yue, J. Liu and C. He, RNA N6-methyladenosine methylation in post-transcriptional gene expression regulation, Genes Dev 29: ((2015) ), 1343–1355. doi: 10.1101/gad.262766.115. |
[6] | T. Sun, R. Wu and L. Ming, The role of m6A RNA methylation in cancer, Biomed Pharmacother 112: ((2019) ), 108613. doi: 10.1016/j.biopha.2019.108613. |
[7] | A. Du, S. Li, Y. Zhou, C. Disoma, Y. Liao, Y. Zhang, Z. Chen, Q. Yang, P. Liu, S. Liu, Z. Dong, A. Razzaq, S. Tao, X. Chen, Y. Liu, L. Xu, Q. Zhang, S. Li, J. Peng and Z. Xia, M6A-mediated upregulation of circMDK promotes tumorigenesis and acts as a nanotherapeutic target in hepatocellular carcinoma, Mol Cancer 21: ((2022) ), 109. doi: 10.1186/s12943-022-01575-z. |
[8] | H. Han, G. Fan, S. Song, Y. Jiang, C. Qian, W. Zhang, Q. Su, X. Xue, W. Zhuang and B. Li, piRNA-30473 contributes to tumorigenesis and poor prognosis by regulating m6A RNA methylation in DLBCL, Blood 137: ((2021) ), 1603–1614. doi: 10.1182/blood.2019003764. |
[9] | Q. Lan, P.Y. Liu, J.L. Bell, J.Y. Wang, S. Hüttelmaier, X.D. Zhang, L. Zhang and T. Liu, The Emerging Roles of RNA m6A Methylation and Demethylation as Critical Regulators of Tumorigenesis, Drug Sensitivity, and Resistance, Cancer Res 81: ((2021) ), 3431–3440. doi: 10.1158/0008-5472.CAN-20-4107. |
[10] | M. Cheng, L. Sheng, Q. Gao, Q. Xiong, H. Zhang, M. Wu, Y. Liang, F. Zhu, Y. Zhang, X. Zhang, Q. Yuan and Y. Li, The m6A methyltransferase METTL3 promotes bladder cancer progression via AFF4/NF-κB/MYC signaling network, Oncogene 38: ((2019) ), 3667–3680. doi: 10.1038/s41388-019-0683-z. |
[11] | J. Li, H. Xie, Y. Ying, H. Chen, H. Yan, L. He, M. Xu, X. Xu, Z. Liang, B. Liu, X. Wang, X. Zheng and L. Xie, YTHDF2 mediates the mRNA degradation of the tumor suppressors to induce AKT phosphorylation in N6-methyladenosine-dependent way in prostate cancer, Mol Cancer 19: ((2020) ), 152. doi: 10.1186/s12943-020-01267-6. |
[12] | L. Tao, X. Mu, H. Chen, D. Jin, R. Zhang, Y. Zhao, J. Fan, M. Cao and Z. Zhou, FTO modifies the m6A level of MALAT and promotes bladder cancer progression, Clin Transl Med 11: ((2021) ), e310. doi: 10.1002/ctm2.310. |
[13] | D. Song, T. Powles, L. Shi, L. Zhang, M.A. Ingersoll and Y.-J. Lu, Bladder cancer, a unique model to understand cancer immunity and develop immunotherapy approaches, J Pathol 249: ((2019) ), 151–165. doi: 10.1002/path.5306. |
[14] | A. Lopez-Beltran, A. Cimadamore, A. Blanca, F. Massari, N. Vau, M. Scarpelli, L. Cheng and R. Montironi, Immune checkpoint inhibitors for the treatment of bladder cancer, Cancers (Basel) 13: ((2021) ), 131. doi: 10.3390/cancers13010131. |
[15] | R.M. Samstein, C.-H. Lee, A.N. Shoushtari, M.D. Hellmann, R. Shen, Y.Y. Janjigian, D.A. Barron, A. Zehir, E.J. Jordan, A. Omuro, T.J. Kaley, S.M. Kendall, R.J. Motzer, A.A. Hakimi, M.H. Voss, P. Russo, J. Rosenberg, G. Iyer, B.H. Bochner, D.F. Bajorin, H.A. Al-Ahmadie, J.E. Chaft, C.M. Rudin, G.J. Riely, S. Baxi, A.L. Ho, R.J. Wong, D.G. Pfister, J.D. Wolchok, C.A. Barker, P.H. Gutin, C.W. Brennan, V. Tabar, I.K. Mellinghoff, L.M. DeAngelis, C.E. Ariyan, N. Lee, W.D. Tap, M.M. Gounder, S.P. D’Angelo, L. Saltz, Z.K. Stadler, H.I. Scher, J. Baselga, P. Razavi, C.A. Klebanoff, R. Yaeger, N.H. Segal, G.Y. Ku, R.P. DeMatteo, M. Ladanyi, N.A. Rizvi, M.F. Berger, N. Riaz, D.B. Solit, T.A. Chan and L.G.T. Morris, Tumor mutational load predicts survival after immunotherapy across multiple cancer types, Nat Genet 51: ((2019) ), 202–206. doi: 10.1038/s41588-018-0312-8. |
[16] | X. Wu, D. Lv, C. Cai, Z. Zhao, M. Wang, W. Chen and Y. Liu, A TP53-associated immune prognostic signature for the prediction of overall survival and therapeutic responses in muscle-invasive bladder cancer, Front Immunol 11: ((2020) ), 590618. doi: 10.3389/fimmu.2020.590618. |
[17] | J. Liu, J. Wang, M. Wu, W. Zhang, L. Meng, J. Wang, Z. Lv, H. Xia, Y. Zhang and J. Wang, Comprehensive analysis of N6-methyladenosine modification patterns associated with multiomic characteristics of bladder cancer, Front Med (Lausanne) 8: ((2021) ), 757432. doi: 10.3389/fmed.2021.757432. |
[18] | W.-S. Wei, N. Wang, M.-H. Deng, P. Dong, J.-Y. Liu, Z. Xiang, X.-D. Li, Z.-Y. Li, Z.-H. Liu, Y.-L. Peng, Z. Li, L.-J. Jiang, K. Yao, Y.-L. Ye, W.-H. Lu, Z.-L. Zhang, F.-J. Zhou, Z.-W. Liu, D. Xie and C.-P. Yu, LRPPRC regulates redox homeostasis via the circANKHD1/FOXM1 axis to enhance bladder urothelial carcinoma tumorigenesis, Redox Biol 48: ((2021) ), 102201. doi: 10.1016/j.redox.2021.102201. |
[19] | L. Huang, G. Chen, J. He and P. Wang, ZC3H13 reduced DUOX1-mediated ferroptosis in laryngeal squamous cell carcinoma cells through m6A-dependent modification, Tissue Cell 84: ((2023) ), 102187. doi: 10.1016/j.tice.2023.102187. |
[20] | Y.-W. Lin, X.-F. Weng, B.-L. Huang, H.-P. Guo, Y.-W. Xu and Y.-H. Peng, IGFBP-1 in cancer: Expression, molecular mechanisms, and potential clinical implications, Am J Transl Res 13: ((2021) ), 813–832. |
[21] | B. Yan, X. Li, M. Peng, Y. Zuo, Y. Wang, P. Liu, W. Ren and X. Jin, The YTHDC1/GLUT3/RNF183 axis forms a positive feedback loop that modulates glucose metabolism and bladder cancer progression, Exp Mol Med 55: ((2023) ), 1145–1158. doi: 10.1038/s12276-023-00997-z. |
[22] | Y. Su, B. Wang, J. Huang, M. Huang and T. Lin, YTHDC1 positively regulates PTEN expression and plays a critical role in cisplatin resistance of bladder cancer, Cell Prolif 56: ((2023) ), e13404. doi: 10.1111/cpr.13404. |
[23] | L. Ma, T. Chen, X. Zhang, Y. Miao, X. Tian, K. Yu, X. Xu, Y. Niu, S. Guo, C. Zhang, S. Qiu, Y. Qiao, W. Fang, L. Du, Y. Yu and J. Wang, The m6A reader YTHDC2 inhibits lung adenocarcinoma tumorigenesis by suppressing SLC7A11-dependent antioxidant function, Redox Biol 38: ((2021) ), 101801. doi: 10.1016/j.redox.2020.101801. |
[24] | J. Zhang, S. Guo, H.-Y. Piao, Y. Wang, Y. Wu, X.-Y. Meng, D. Yang, Z.-C. Zheng and Y. Zhao, ALKBH5 promotes invasion and metastasis of gastric cancer by decreasing methylation of the lncRNA NEAT1, J Physiol Biochem 75: ((2019) ), 379–389. doi: 10.1007/s13105-019-00690-8. |
[25] | H. Yu, X. Yang, J. Tang, S. Si, Z. Zhou, J. Lu, J. Han, B. Yuan, Q. Wu, Q. Lu and H. Yang, ALKBH5 Inhibited Cell Proliferation and Sensitized Bladder Cancer Cells to Cisplatin by m6A-CK2α-Mediated Glycolysis, Mol Ther Nucleic Acids 23: ((2021) ), 27–41. doi: 10.1016/j.omtn.2020.10.031. |
[26] | S. Jin, M. Li, H. Chang, R. Wang, Z. Zhang, J. Zhang, Y. He and H. Ma, The m6A demethylase ALKBH5 promotes tumor progression by inhibiting RIG-I expression and interferon alpha production through the IKKε/TBK1/IRF3 pathway in head and neck squamous cell carcinoma, Mol Cancer 21: ((2022) ), 97. doi: 10.1186/s12943-022-01572-2. |
[27] | Y. Yue, J. Liu, X. Cui, J. Cao, G. Luo, Z. Zhang, T. Cheng, M. Gao, X. Shu, H. Ma, F. Wang, X. Wang, B. Shen, Y. Wang, X. Feng, C. He and J. Liu, VIRMA mediates preferential m6A mRNA methylation in 3’UTR and near stop codon and associates with alternative polyadenylation, Cell Discov 4: ((2018) ), 10. doi: 10.1038/s41421-018-0019-0. |
[28] | B. Zheng, J. Wang, G. Zhao, X. Chen, Z. Yao, Z. Niu and W. He, A new m6A methylation-related gene signature for prognostic value in patient with urothelial carcinoma of the bladder, Biosci Rep 41: ((2021) ), BSR20204456. doi: 10.1042/BSR20204456. |
[29] | C. Zeng, W. Huang, Y. Li and H. Weng, Roles of METTL3 in cancer: Mechanisms and therapeutic targeting, J Hematol Oncol 13: ((2020) ), 117. doi: 10.1186/s13045-020-00951-w. |
[30] | H. Jin, X. Ying, B. Que, X. Wang, Y. Chao, H. Zhang, Z. Yuan, D. Qi, S. Lin, W. Min, M. Yang and W. Ji, N6-methyladenosine modification of ITGA6 mRNA promotes the development and progression of bladder cancer, EBioMedicine 47: ((2019) ), 195–207. doi: 10.1016/j.ebiom.2019.07.068. |
[31] | F. Yang, H. Jin, B. Que, Y. Chao, H. Zhang, X. Ying, Z. Zhou, Z. Yuan, J. Su, B. Wu, W. Zhang, D. Qi, D. Chen, W. Min, S. Lin and W. Ji, Dynamic m6A mRNA methylation reveals the role of METTL3-m6A-CDCP1 signaling axis in chemical carcinogenesis, Oncogene 38: ((2019) ), 4755–4772. doi: 10.1038/s41388-019-0755-0. |
[32] | J. Han, J.-Z. Wang, X. Yang, H. Yu, R. Zhou, H.-C. Lu, W.-B. Yuan, J.-C. Lu, Z.-J. Zhou, Q. Lu, J.-F. Wei and H. Yang, METTL3 promote tumor proliferation of bladder cancer by accelerating pri-miR221/222 maturation in m6A-dependent manner, Mol Cancer 18: ((2019) ), 110. doi: 10.1186/s12943-019-1036-9. |
[33] | G. Wang, Y. Dai, K. Li, M. Cheng, G. Xiong, X. Wang, S. Chen, Z. Chen, J. Chen, X. Xu, R.-S. Ling, L. Peng and D. Chen, Deficiency of Mettl3 in Bladder Cancer Stem Cells Inhibits Bladder Cancer Progression and Angiogenesis, Front Cell Dev Biol 9: ((2021) ), 627706. doi: 10.3389/fcell.2021.627706. |
[34] | F. Hakuno and S.-I. Takahashi, IGF1 receptor signaling pathways, J Mol Endocrinol 61: ((2018) ), T69–T86. doi: 10.1530/JME-17-0311. |
[35] | S.F. Shariat, J. Kim, C. Nguyen, T.M. Wheeler, S.P. Lerner and K.M. Slawin, Correlation of preoperative levels of IGF-I and IGFBP-3 with pathologic parameters and clinical outcome in patients with bladder cancer, Urology 61: ((2003) ), 359–364. doi: 10.1016/s0090-4295(02)02253-7. |
[36] | F. Christoph, S. Weikert, C. Kempkensteffen, H. Krause, M. Schostak, K. Miller and M. Schrader, Regularly methylated novel pro-apoptotic genes associated with recurrence in transitional cell carcinoma of the bladder, Int J Cancer 119: ((2006) ), 1396–1402. doi: 10.1002/ijc.21971. |
[37] | J. Yang, L. Fan, X. Liao, G. Cui and H. Hu, CRTAC1 (Cartilage acidic protein 1) inhibits cell proliferation, migration, invasion and epithelial-mesenchymal transition (EMT) process in bladder cancer by downregulating Yin Yang 1 (YY1) to inactivate the TGF-β pathway, Bioengineered 12: ((2021) ), 9377–9389. doi: 10.1080/21655979.2021.1974645. |
[38] | Z. Bayat, Z. Ghaemi, M. Behmanesh and B.M. Soltani, Hsa-miR-186-5p regulates TGFβ signaling pathway through expression suppression of SMAD6 and SMAD7 genes in colorectal cancer, Biol Chem 402: ((2021) ), 469–480. doi: 10.1515/hsz-2019-0407. |
[39] | M. Wakabayashi, T. Mori, K. Isobe, E. Sohara, K. Susa, Y. Araki, M. Chiga, E. Kikuchi, N. Nomura, Y. Mori, H. Matsuo, T. Murata, S. Nomura, T. Asano, H. Kawaguchi, S. Nonoyama, T. Rai, S. Sasaki and S. Uchida, Impaired KLHL3-mediated ubiquitination of WNK4 causes human hypertension, Cell Rep 3: ((2013) ), 858–868. doi: 10.1016/j.celrep.2013.02.024. |
[40] | Y. Deng, B. Liu, X. Fan, Y. Wang, M. Tang, X. Mo, Y. Li, Z. Ying, Y. Wan, N. Luo, J. Zhou, X. Wu and W. Yuan, ZNF552, a novel human KRAB/C2H2 zinc finger protein, inhibits AP-1- and SRE-mediated transcriptional activity, BMB Rep 43: ((2010) ), 193–198. doi: 10.5483/bmbrep.2010.43.3.193. |
[41] | X. Li, Z. Wei, H. Yu, Y. Xu, W. He, X. Zhou and X. Gou, Secretory autophagy-induced bladder tumour-derived extracellular vesicle secretion promotes angiogenesis by activating the TPX2-mediated phosphorylation of the AURKA-PI3K-AKT axis, Cancer Lett 523: ((2021) ), 10–28. doi: 10.1016/j.canlet.2021.09.036. |
[42] | S. Sugita, H. Yoshino, M. Yonemori, K. Miyamoto, R. Matsushita, T. Sakaguchi, T. Itesako, S. Tatarano, M. Nakagawa and H. Enokida, Tumor-suppressive microRNA-223 targets WDR62 directly in bladder cancer, Int J Oncol 54: ((2019) ), 2222–2236. doi: 10.3892/ijo.2019.4762. |
[43] | X. Liu, S. Liu, C. Piao, Z. Zhang, X. Zhang, Y. Jiang and C. Kong, Non-metabolic function of MTHFD2 activates CDK2 in bladder cancer, Cancer Sci 112: ((2021) ), 4909–4919. doi: 10.1111/cas.15159. |
[44] | P. Xu, L. Jiang, Y. Yang, M. Wu, B. Liu, Y. Shi, Q. Shen, X. Jiang, Y. He, D. Cheng, Q. Xiong, Z. Yang, L. Duan, J. Lin, S. Zhao, P. Shi, C. Yang and Y. Chen, PAQR4 promotes chemoresistance in non-small cell lung cancer through inhibiting Nrf2 protein degradation, Theranostics 10: ((2020) ), 3767–3778. doi: 10.7150/thno.43142. |
[45] | J.B. Jensen, P.P. Munksgaard, C.M. Sørensen, N. Fristrup, K. Birkenkamp-Demtroder, B.P. Ulhøi, K.M.-E. Jensen, T.F. Ørntoft and L. Dyrskjøt, High expression of karyopherin-α2 defines poor prognosis in non-muscle-invasive bladder cancer and in patients with invasive bladder cancer undergoing radical cystectomy, Eur Urol 59: ((2011) ), 841–848. doi: 10.1016/j.eururo.2011.01.048. |
[46] | B. Wang, J. Zheng, Q. Chen, C. Wu, Y. Li, X.-Y. Yu, B. Liu, C. Liang, S.-B. Liu, H. Ding, S. Wang, T. Xue, D. Song, Z. Lei, H.M. Amin, Y.-H. Song and J. Zhou, CLIC4 abrogation promotes epithelial-mesenchymal transition in gastric cancer, Carcinogenesis 41: ((2020) ), 841–849. doi: 10.1093/carcin/bgz156. |
[47] | T.-T. Ou, C.-H. Wu, J.-D. Hsu, C.-C. Chyau, H.-J. Lee and C.-J. Wang, Paeonia lactiflora Pall inhibits bladder cancer growth involving phosphorylation of Chk2 in vitro and in vivo, J Ethnopharmacol 135: ((2011) ), 162–172. doi: 10.1016/j.jep.2011.03.011. |
[48] | T.A. Chan, M. Yarchoan, E. Jaffee, C. Swanton, S.A. Quezada, A. Stenzinger and S. Peters, Development of tumor mutation burden as an immunotherapy biomarker: Utility for the oncology clinic, Ann Oncol 30: ((2019) ), 44–56. doi: 10.1093/annonc/mdy495. |
[49] | P.B.S. Lai, T.-Y. Chi and G.G. Chen, Different levels of p53 induced either apoptosis or cell cycle arrest in a doxycycline-regulated hepatocellular carcinoma cell line in vitro, Apoptosis 12: ((2007) ), 387–393. doi: 10.1007/s10495-006-0571-1. |
[50] | M.C. Ingaramo, J.A. Sánchez and A. Dekanty, Regulation and function of p53: A perspective from Drosophila studies, Mech Dev 154: ((2018) ), 82–90. doi: 10.1016/j.mod.2018.05.007. |
[51] | H.M. Knochelmann, C.J. Dwyer, S.R. Bailey, S.M. Amaya, D.M. Elston, J.M. Mazza-McCrann and C.M. Paulos, When worlds collide: Th17 and Treg cells in cancer and autoimmunity, Cell Mol Immunol 15: ((2018) ), 458–469. doi: 10.1038/s41423-018-0004-4. |
[52] | S. Maeda, K. Murakami, A. Inoue, T. Yonezawa and N. Matsuki, CCR4 Blockade Depletes Regulatory T Cells and Prolongs Survival in a Canine Model of Bladder Cancer, Cancer Immunol Res 7: ((2019) ), 1175–1187. doi: 10.1158/2326-6066.CIR-18-0751. |
[53] | W. Zhu, Z. Zhao, B. Feng, W. Yu, J. Li, H. Guo and R. Yang, CD8+CD39+ T Cells Mediate Anti-Tumor Cytotoxicity in Bladder Cancer, Onco Targets Ther 14: ((2021) ), 2149–2161. doi: 10.2147/OTT.S297272. |
[54] | T. Powles, P.H. O’Donnell, C. Massard, H.-T. Arkenau, T.W. Friedlander, C.J. Hoimes, J.L. Lee, M. Ong, S.S. Sridhar, N.J. Vogelzang, M.N. Fishman, J. Zhang, S. Srinivas, J. Parikh, J. Antal, X. Jin, A.K. Gupta, Y. Ben and N.M. Hahn, Efficacy and safety of durvalumab in locally advanced or metastatic urothelial carcinoma: Updated results from a phase 1/2 open-label study, JAMA Oncol 3: ((2017) ), e172411. doi: 10.1001/jamaoncol.2017.2411. |
[55] | M.F. Krummel and J.P. Allison, CD28 and CTLA-4 have opposing effects on the response of T cells to stimulation, J Exp Med 182: ((1995) ), 459–465. doi: 10.1084/jem.182.2.459. |


