
A risk model based on lncRNA-miRNA-mRNA gene signature for predicting prognosis of patients with bladder cancer
Abstract
OBJECTIVES:
We aimed to analyze lncRNAs, miRNAs, and mRNA expression profiles of bladder cancer (BC) patients, thereby establishing a gene signature-based risk model for predicting prognosis of patients with BC.
METHODS:
We downloaded the expression data of lncRNAs, miRNAs and mRNA from The Cancer Genome Atlas (TCGA) as training cohort including 19 healthy control samples and 401 BC samples. The differentially expressed RNAs (DERs) were screened using limma package, and the competing endogenous RNAs (ceRNA) regulatory network was constructed and visualized by the cytoscape. Candidate DERs were screened to construct the risk score model and nomogram for predicting the overall survival (OS) time and prognosis of BC patients. The prognostic value was verified using a validation cohort in GSE13507.
RESULTS:
Based on 13 selected. lncRNAs, miRNAs and mRNA screened using L1–penalized algorithm, BC patients were classified into two groups: high-risk group (including 201 patients ) and low risk group (including 200 patients). The high-risk group’s OS time ( hazard ratio [HR], 2.160; 95% CI, 1.586 to 2.942;
CONCLUSIONS:
The risk model based on 13 DERs patterns could well predict the prognosis for patients with BC.
1.Introduction
Bladder cancer (BC) is the most prevalent carcinoma of urinary system in China and even the whole world, and the ninth killer in all kinds of cancers in the world [1, 2]. Although current treatment of BC has improved the 5-year overall survival (OS), poor prognosis is also existing due to the absence of typical symptoms. And it is found that most cases of BC patients had advanced and distal metastasis [3, 4, 5]. Therefore, it is of great need to develop and improve the diagnosis and treatment methods of BC.
Recently, molecular biomarkers including lncRNA, miRNAs and mRNA can be used for detection, diagnosis, recurrence prediction and post-treatment monitoring of BC [6, 7, 8, 9]. Moreover, it has been found that the lncRNAs could interact with miRNAs as competing endogenous RNA (ceRNA) to regulate BC. For example, LncRNA GAS6-AS2 has been identified as a new prognostic marker of BC could promote BC proliferation through miR-298-CDK9 axis [10]; LncRNA LINC00641 was a potential factor to predict prognosis and nhibit BC developing through miR-197-3p-KLF10-PTEN-PI3K-AKT aixs [11]. lncRNA TINCR can reduce the OS rate of BC patients by inhibiting miR-7 and regulating mTOR [12]. Above all, based on the above researches, we found that the RNAs could be a potential biomarkers for BC and also were associated with BC through the ceRNA mechanism [13, 14, 15].
Thus, this study aimed to construct a RNA-based risk model to predict the prognosis of BC. We firstly conducted a ceRNA regulatory network analysis to screen the RNAs which could be used as the biomarkers for BC, and subsequently, we integrated genomic and clinical features to build a nomogram model based on prognostic RNAs to predict prognosis of patients with BC.
2.Methods
2.1RNAs expression data
The mRNA, lncRNA and miRNA profile was obtained from The Cancer Genome Atlas (TCGA) (https://gdc-portal.nci.nih.gov/), which included 401 BC samples and 19 healthy control samples with survival prognosis information. Additionally, GSE13507 dataset containing 256 samples were obtained from Gene Expression Omnibus (GEO) (http://www.ncbi. nlm.nih.gov/geo/), in which 165 samples contained the survival prognosis information.
2.2Differentially expressed RNAs screening
We used limma package in R language [16] (Version 3.34.7) to identify the differentially expressed RNAs (DERs) including mRNA (DEmRNA), lncRNAs (DElncRNAs), and microRNAs (DEmiRNAs) in TCGA dataset. The criterion was set to FDR
2.3Competing endogenous RNAs regulatrory network construction
The relationship between the DEmiRNAs and DElncRNAs was predicted using DIANA-LncBasev2 [18, 19], and the correlation of DEmiRNAs and mRNA using starBase (Version 2.0) [20]. Subsequently, we retained the negative regulation among DEmiRNAs, DElncRNAs and mRNA. The ceRNA regulatory network including the DEmiRNAs, DElncRNAs and mRNA was constructed and visualized by the cytoscape (Version 3.6.1) [21]. Moreover, Kyoto Encyclopedia of Genes and Genomes (KEGG) and Gene Ontology (GO) enrichment were performed to analyze the function of mRNA involved in the ceRNA regulatory network with the cutoff of p value
2.4Prognosis related RNAs screening
We used univariate and multivariate Cox regression analysis in the survival package (Version 2.41–1) [24] to identify DERs related to prognosis with the threshold of log-rank
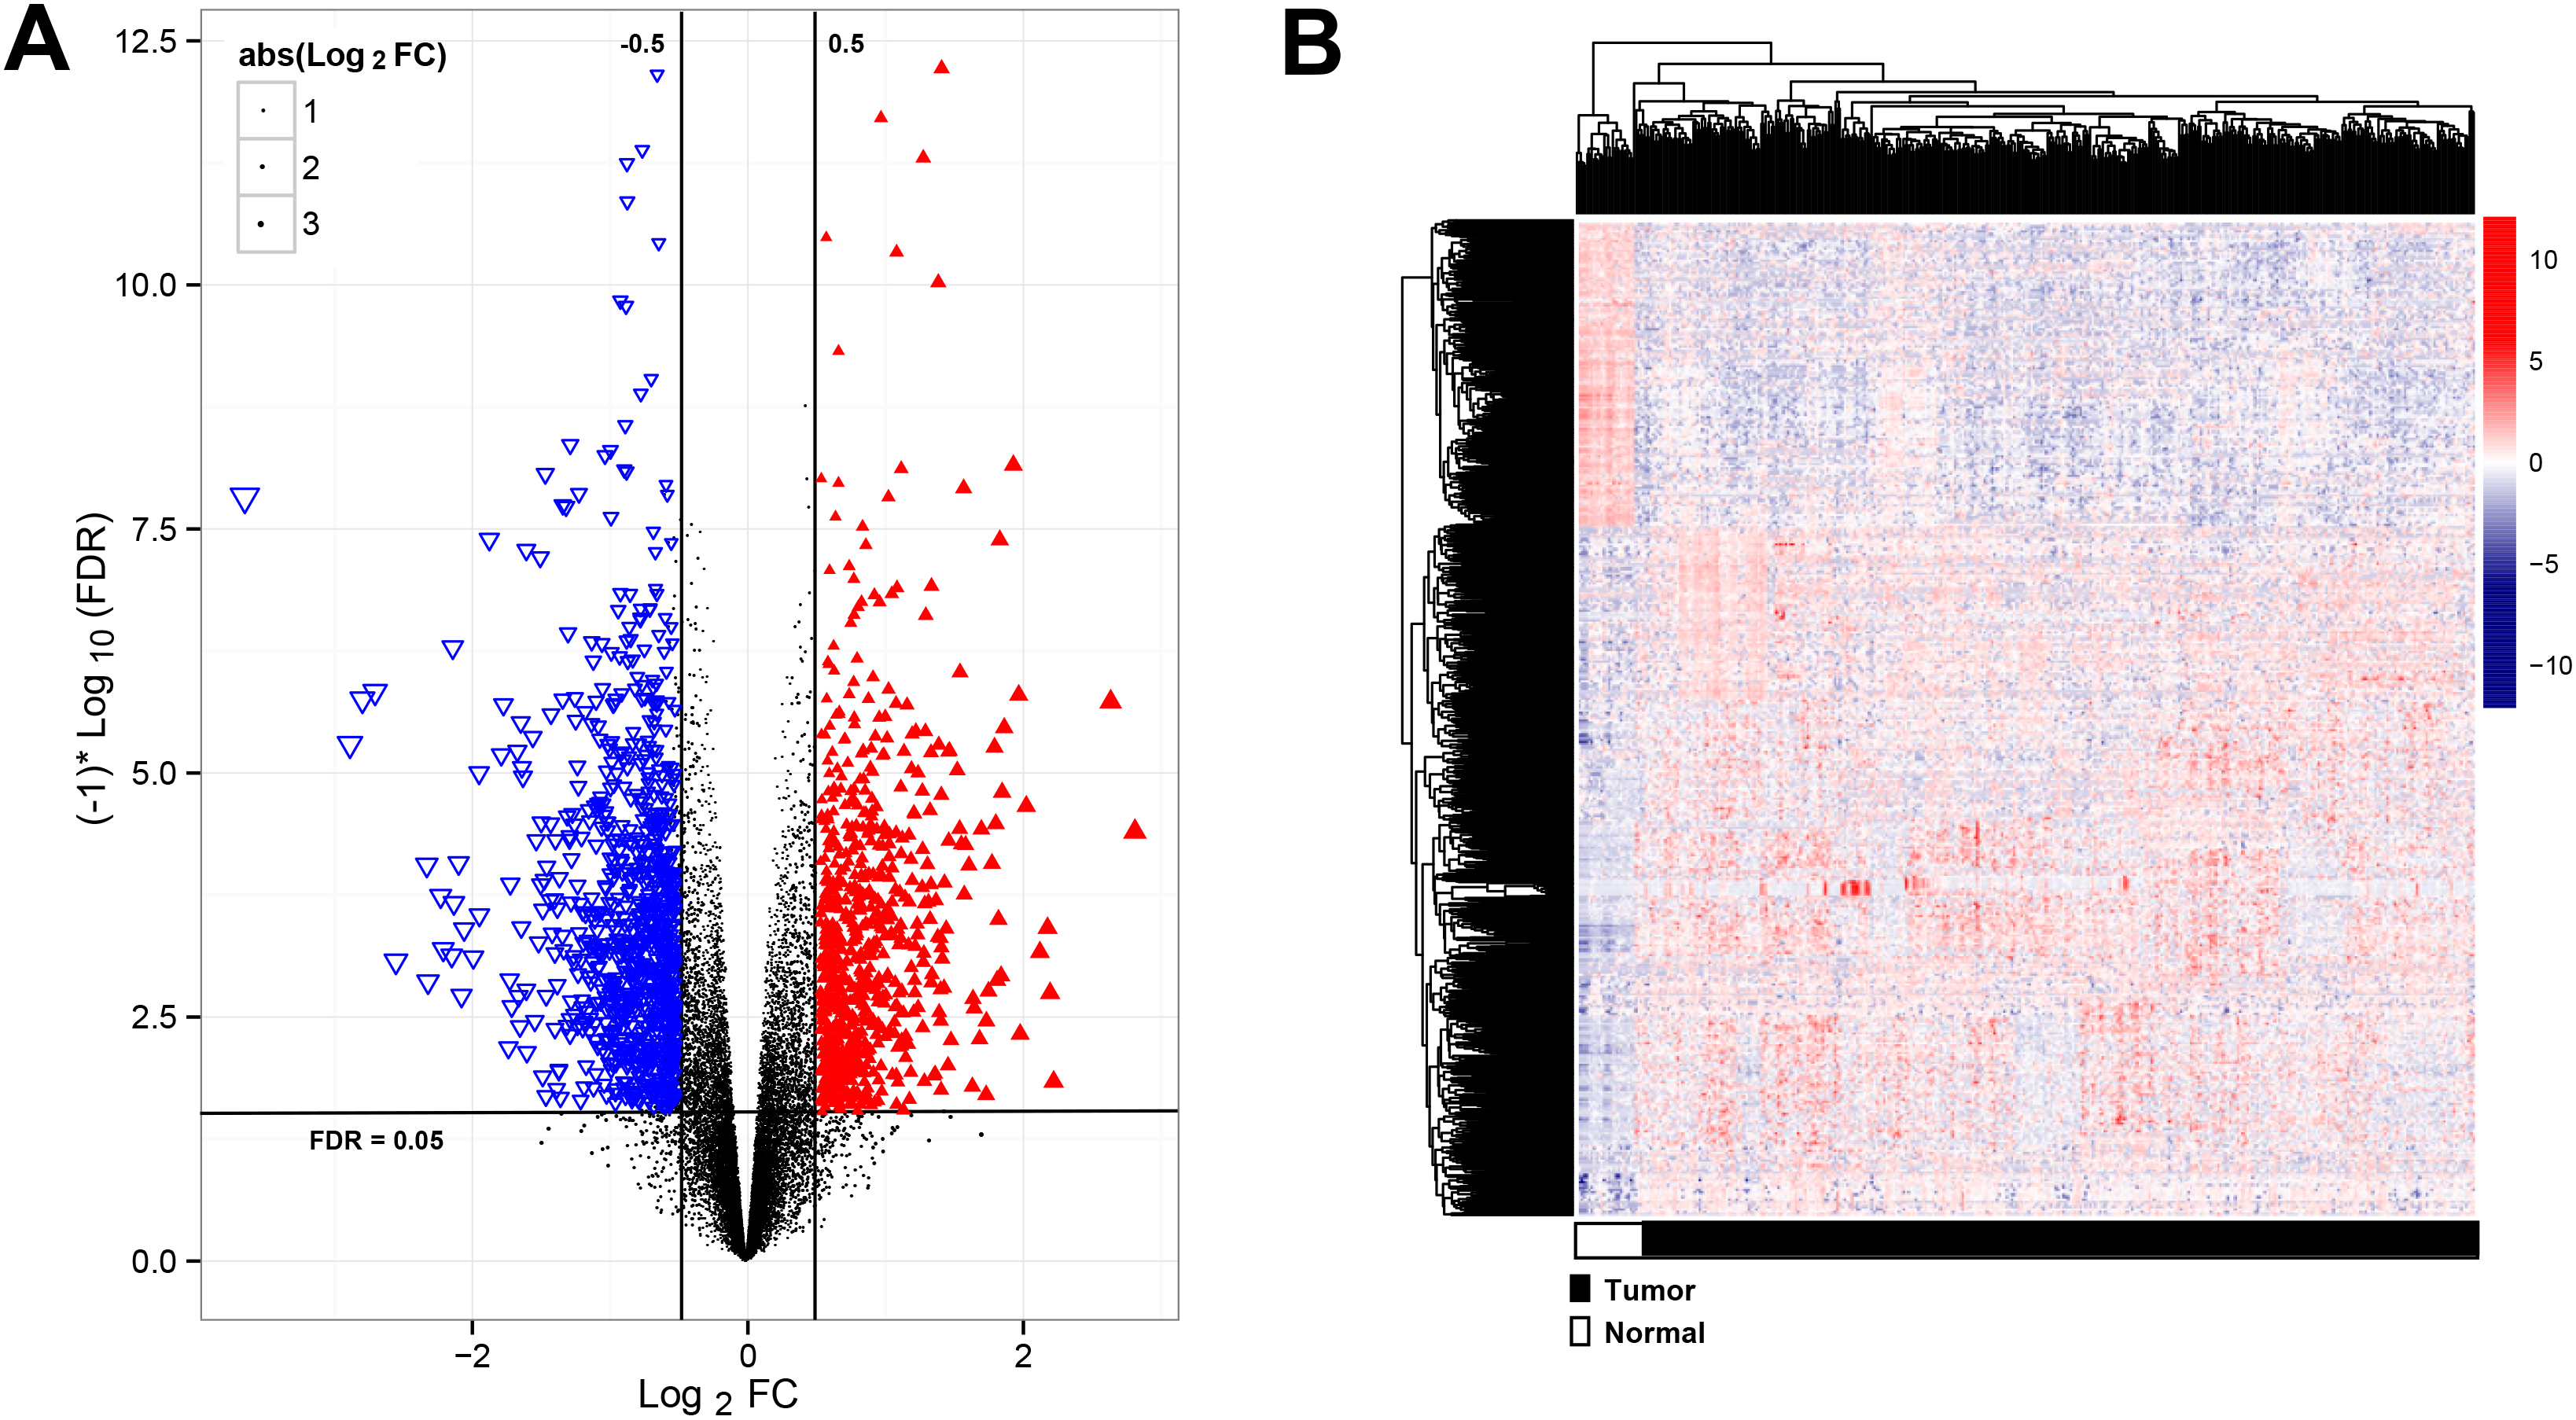
Figure 1.
Analysis of significantly differentially expressed RNAs (DERs). (A) the volcano plot showed the significantly DERs, red points were up-regulated RNAs, blue points were down-regulated RNAs; (B) The two-way clustering of DERs,
2.5Prognostic model establishment
In order to obtain the RNAs’ performance in predicting prognosis and OS time for BC patients, we established risk score using coefficients weighted by the penalty Cox model, and calculated the risk score according to the follow formula
The median value of risk score in training dataset was considered the cut-off point as classifying cohort to high- and low-risk group. Subsequently, we analyzed the OS with Kaplan-Meier plots and used the receiver operating characteristic (ROC) analysis to evaluate their performance using the value of area under curve (AUC) [27, 28]. The same analysis was performed in the validation cohorts of GSE13507. We performed univariate and multivariate Cox regression analysis to analyze the independent significance of different factors with the threshold of p value
Nomograms were constructed using the rms package (https://cran.r-project.org/web/packages/rms/index.html) in R3.6.1. The multivariable Cox regression model’s coefficients were used to generate nomograms. Calibration curve was graphically evaluated by plotting the observed rate versus the probability predicted by the nomogram, and the consistency index (C-index) [29, 30, 31] was calculated.
3.Results
3.1DERs analysis
A total of 15860 mRNA, 1116 lncRNAs and 458 miRNAs were obtained from TCGA dataset. Subsequently, 635 mRNA, 49 lncRNAs and 326 miRNAs were differentially expressed in the training cohorts, which were visualized using Volcano plots (Fig. 1A). The heatmap revealed that RNAs expression patterns between BC and healthy control were distinguishable (Fig. 1B).
Table 1
KEGG and GO enrichment for the genes in the ceRNA regulatory network
| Category | GO | Description | Enrichment | Gene count | |
|---|---|---|---|---|---|
| Biology Process | GO:0000904 | Cell morphogenesis involved in differentiation | 7.94E-06 | 6.6 | 9 |
| GO:0007409 | Axonogenesis | 2.51E-06 | 9.1 | 8 | |
| GO:0007423 | Sensory organ development | 1.00E-05 | 7.6 | 8 | |
| GO:0007507 | Heart development | 1.00E-06 | 8.4 | 9 | |
| GO:0007517 | Muscle organ development | 1.58E-10 | 15 | 11 | |
| GO:0007610 | Behavior | 1.26E-05 | 7.2 | 8 | |
| GO:0014706 | Striated muscle tissue development | 3.16E-08 | 13 | 9 | |
| GO:0032990 | Cell part morphogenesis | 5.01E-08 | 8.6 | 11 | |
| GO:0048667 | Cell morphogenesis involved in neuron differentiation | 1.26E-06 | 8.2 | 9 | |
| GO:0048812 | Neuron projection morphogenesis | 2.51E-08 | 9.1 | 11 | |
| GO:0048858 | Cell projection morphogenesis | 3.16E-08 | 8.8 | 11 | |
| GO:0048880 | Sensory system development | 5.01E-07 | 11 | 8 | |
| GO:0060537 | Muscle tissue development | 3.16E-09 | 13 | 10 | |
| GO:0061061 | Muscle structure development | 3.16E-08 | 8.8 | 11 | |
| GO:0061564 | Axon development | 5.01E-06 | 8.3 | 8 | |
| GO:0070848 | Response to growth factor | 6.31E-05 | 5.9 | 8 | |
| GO:0071363 | Cellular response to growth factor stimulus | 3.98E-05 | 6.1 | 8 | |
| GO:0120039 | Plasma membrane bounded cell projection morphogenesis | 3.16E-08 | 8.9 | 11 | |
| KEGG Pathway | Hsa04360 | Axon guidance | 5.01E-03 | 8.4 | 3 |
| Hsa04514 | Cell adhesion molecules | 2.51E-03 | 11 | 3 | |
| Hsa04550 | Signaling pathways regulating pluripotency of stem cells | 2.51E-03 | 11 | 3 |
Note: KEGG, Kyoto Encyclopedia of Genes and Genomes; GO, Gene Ontology.
3.2Construction of ceRNAs regulatory network
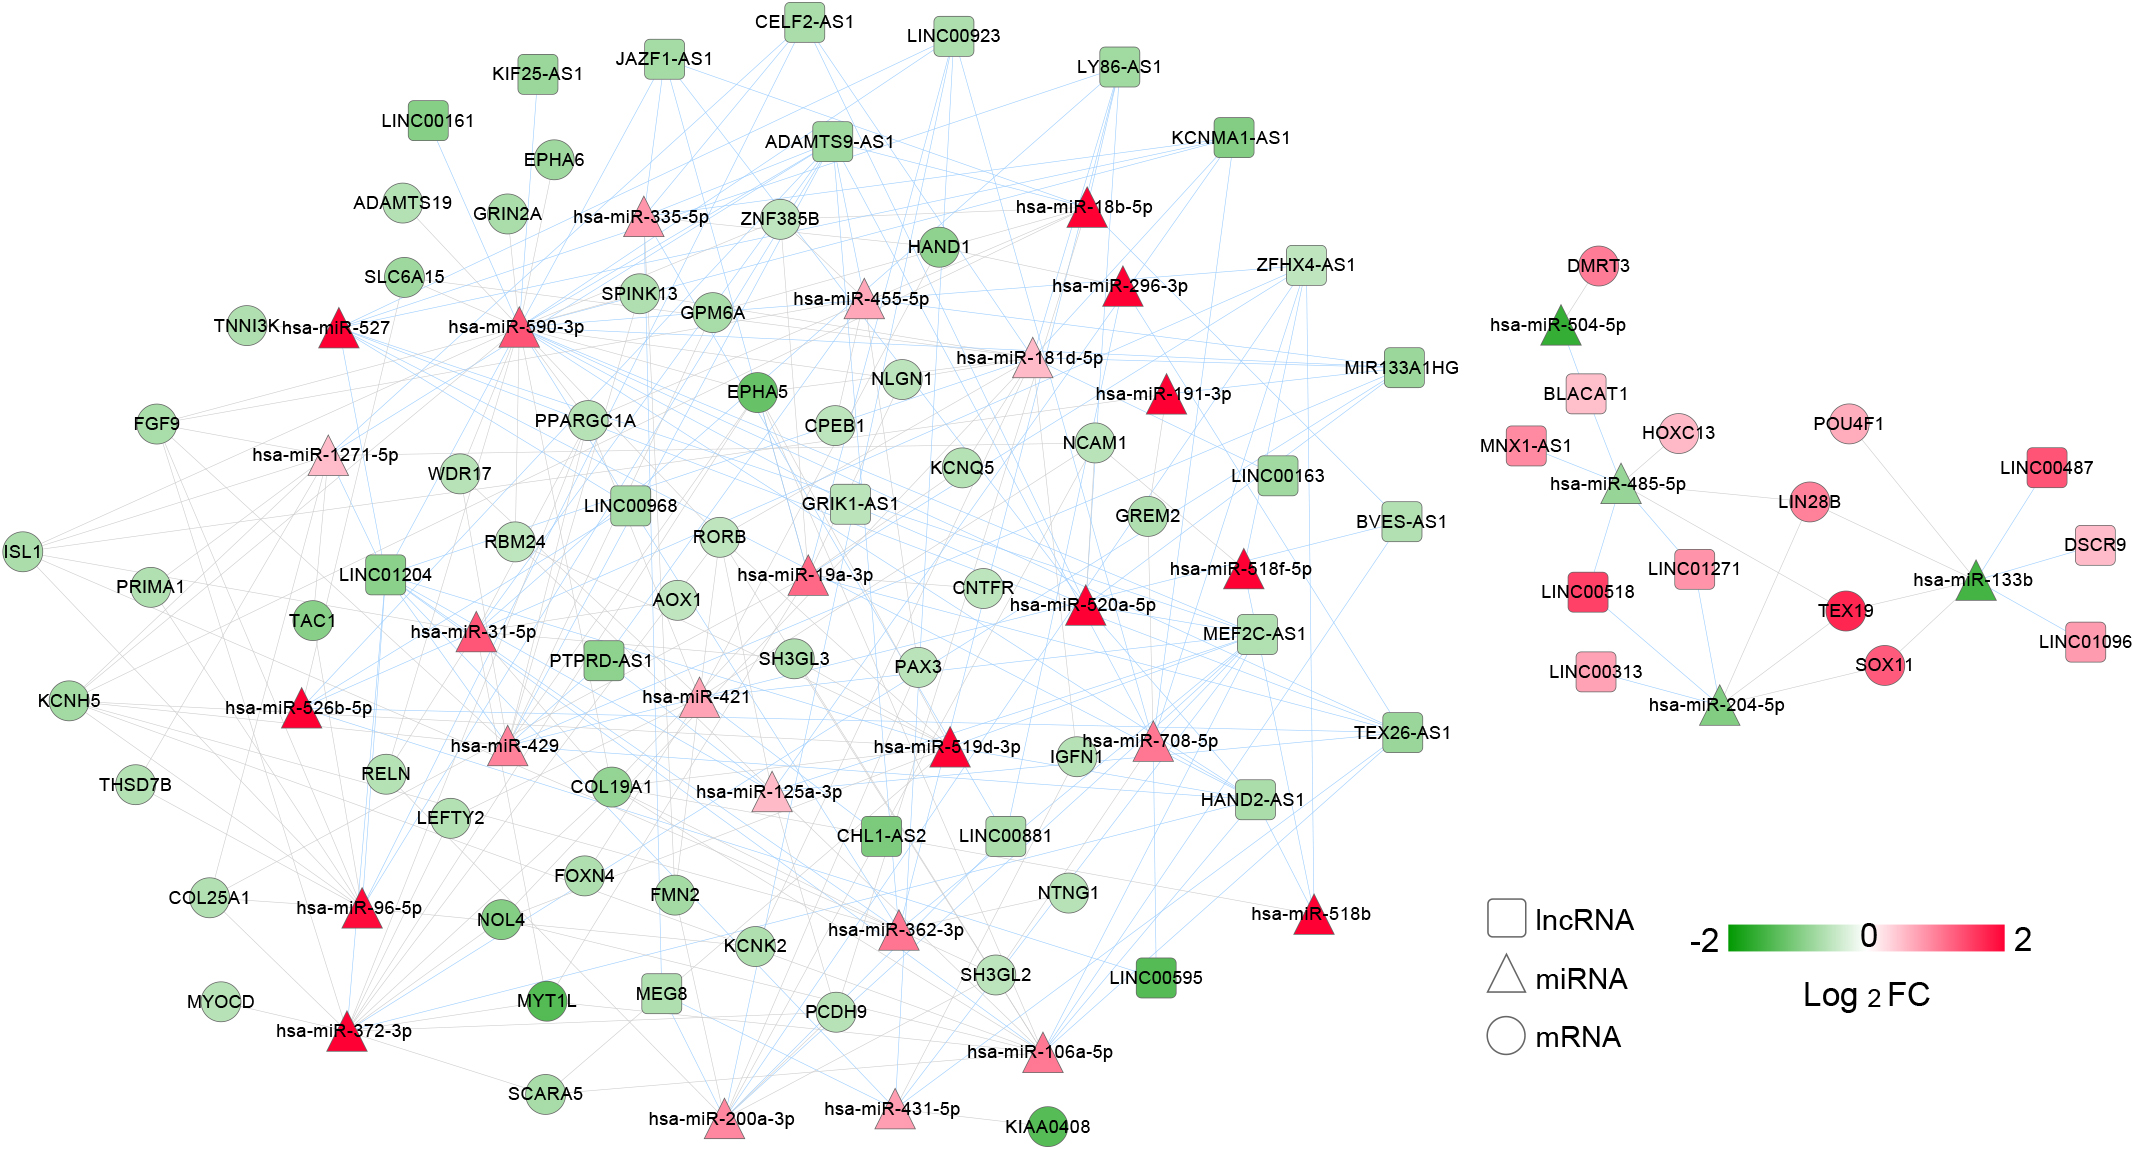
According to the DIANA-LncBasev2, 130 regulatory relationships between DEmiRNAs and DElncRNAs were identified. Subsequently, a total of 148 regulatory relationships between DEmiRNAs and mRNAs were obtained using the starBase Version 2.0, which included 31 DElncRNAs, 30 DEmiRNAs and 51 mRNA (Fig. 2). The mRNA in ceRNA network were enriched in 3 KEGG pathways including axon guidance, cell adhesion molecules, stem cell pluripotency regulating signaling pathways, and 18 GO terms, such as cell morphogenesis involved in differentiation, axonogenesis, and sensory organ development (Table 1). Taken together, we successfully constructed a ceRNA network, the DERs of which might involve in biological function in BC.
Figure 2.
ceRNA regulatory network. Differentially expressed lncRNAs (DElncRNAs) were showed by the represented squares; the triangles showed differentially expressed microRNAs (DEmiRNAs) while differentially expressed mRNA (mRNA) were shown by the circles; the color key represented the log2FC. The red connecting lines represented the DElncRNA-DEmiRNA, while the gray connecting lines represented the DEmiRNA-DEmRNA regulatory connection.
3.3Candidate DERs selection
A total of 31 DERs (20 mRNA, 5 DElncRNAs and 6 DEmiRNAs) were significantly related to the prognosis. Subsequently, 16 DERs were selected using the multivariate cox regression analysis. At last, 13 optimized DERs including 3 lncRNAs (LINC00161, ZFHX4-AS1 and DSCR9), 2 miRNAs (hsa-miR-431-5p and hsa-miR-590-3p) and 8 mRNAs (GPM6A, ISL1, SH3GL3, PRIMA1, KCNQ5, PCDH9, NTNG1 and POU4F1) were identified (Table 2). Collectively, the 13 optimized DERs were correlated with the prognosis of BC patients, which was selected for the construction of risk score model.
Table 2
The optimized RNAs information
| Symbol | Type | Multi-variate Cox regression analysis | Coef | ||
|---|---|---|---|---|---|
| HR | 95%CI | ||||
| LINC00161 | lncRNA | 0.964 | 0.935–0.993 | 1.540E-02 | |
| ZFHX4-AS1 | 1.039 | 1.001–1.079 | 4.990E-02 | 0.40446 | |
| DSCR9 | 0.923 | 0.867–0.983 | 1.300E-02 | ||
| hsa-miR-431-5p | miRNA | 1.133 | 1002–1.285 | 4.533E-02 | 0.11872 |
| hsa-miR-590-3p | 0.787 | 0.644–0.963 | 1.990E-02 | ||
| GPM6A | mRNA | 0.952 | 0.903–0.986 | 4.678E-02 | |
| ISL1 | 1.019 | 1.009–1.056 | 3.121E-02 | 0.15216 | |
| SH3GL3 | 1.011 | 1.006–1.045 | 4.537E-02 | 0.04723 | |
| PRIMA1 | 1.015 | 1.007–1.062 | 4.524E-02 | 0.12835 | |
| KCNQ5 | 1.013 | 1.007–1.066 | 4.656E-02 | 0.11512 | |
| PCDH9 | 1.011 | 1.005–1.090 | 4.797E-02 | 0.10289 | |
| NTNG1 | 1.049 | 1.003–1.114 | 1.226E-02 | 0.38562 | |
| POU4F1 | 0.965 | 0.936–0.996 | 2.520E-02 | ||
Note: HR, hazard ratio; CI, confidence interval; Coef, cox regression coefficient.
Table 3
Clinical factor statistics and cox regression analysis
| Clinical characteristics | TCGA ( | Uni-cox regression | Multi-cox regression | ||
|---|---|---|---|---|---|
| HR [95%CI] | Pvalue | HR [95%CI] | Pvalue | ||
| Age(years,mean | 68.01 | 1.033 [1.017–1.049] | 2.544E-05 | 1.265 [1.187–1.680] | 1.913E-02 |
| Gender(Male/Female) | 296/105 | 0.869 [0.627–1.203] | 3.963E-01 | – | – |
| Pathologic_M(M0/M1/-) | 194/11/196 | 3.366 [1.607–7.049] | 6.283E-04 | 1.381 [0.245–7.782] | 7.144E-01 |
| Pathologic_N(N0/N1/N2/N3/-) | 232/45/75/7/42 | 1.562 [1.326–1.840] | 4.327E-08 | 1.198 [0.544–2.636] | 6.539E-01 |
| Pathologic_T(T1/T2/T3/T4/-) | 4/117/190/58/32 | 1.742 [1.390–2.182] | 1.205E-06 | 1.237 [0.546–2.800] | 6.101E-01 |
| Pathologic_stage(I/II/III/IV/-) | 2/128/137/132/2 | 1.708 [1.410–2.068] | 1.787E-08 | 1.074 [0.245–2.256] | 6.015E-01 |
| Neoplasm histologic grade(High/Low/-) | 378/20/3 | 2.888 [0.715–11.68] | 1.367E-01 | – | – |
| Tumor metastasis(Yes/No/-) | 68/33/300 | 1.002 [0.588–1.709] | 9.934E-01 | – | – |
| Radiotherapy(Yes/No/-) | 20/355/26 | 1.065 [0.523–2.169] | 8.624E-01 | – | – |
| Lymphovascular invasion(Yes/No/-) | 145/129/127 | 2.225 [1.528–3.240] | 1.877E-05 | 1.949 [0.806–4.711] | 1.387E-01 |
| Recurrence (Yes/No) | 85/248/68 | 1.873 [1.295–2.709] | 7.075E-04 | 1.643 [1.252–3.591] | 2.130E-02 |
| PS status (High/Low) | 200/201 | 2.160 [1.586–2.942] | 5.678E-07 | 3.141 [1.449–6.810] | 3.750E-03 |
| Death (Yes/No) | 176/225 | – | – | – | – |
| Overall survival time(months,mean | 27.03 | – | – | – | – |
Note: TCGA, The Cancer Genome Atlas; HR, hazard ratio; CI, confidence interval.
3.4Construction of predictive signature
Following are the risk scores in the training cohort:
Risk score
Figure 3.
The performance of 13 differentially expressed RNAs expression signature in predicting overall survival. (A) In training cohort, low risk group including 200 samples, and high risk group including 201 patients; (B) In validation cohort, low risk group including 82 samples, and high risk group including 83 patients.
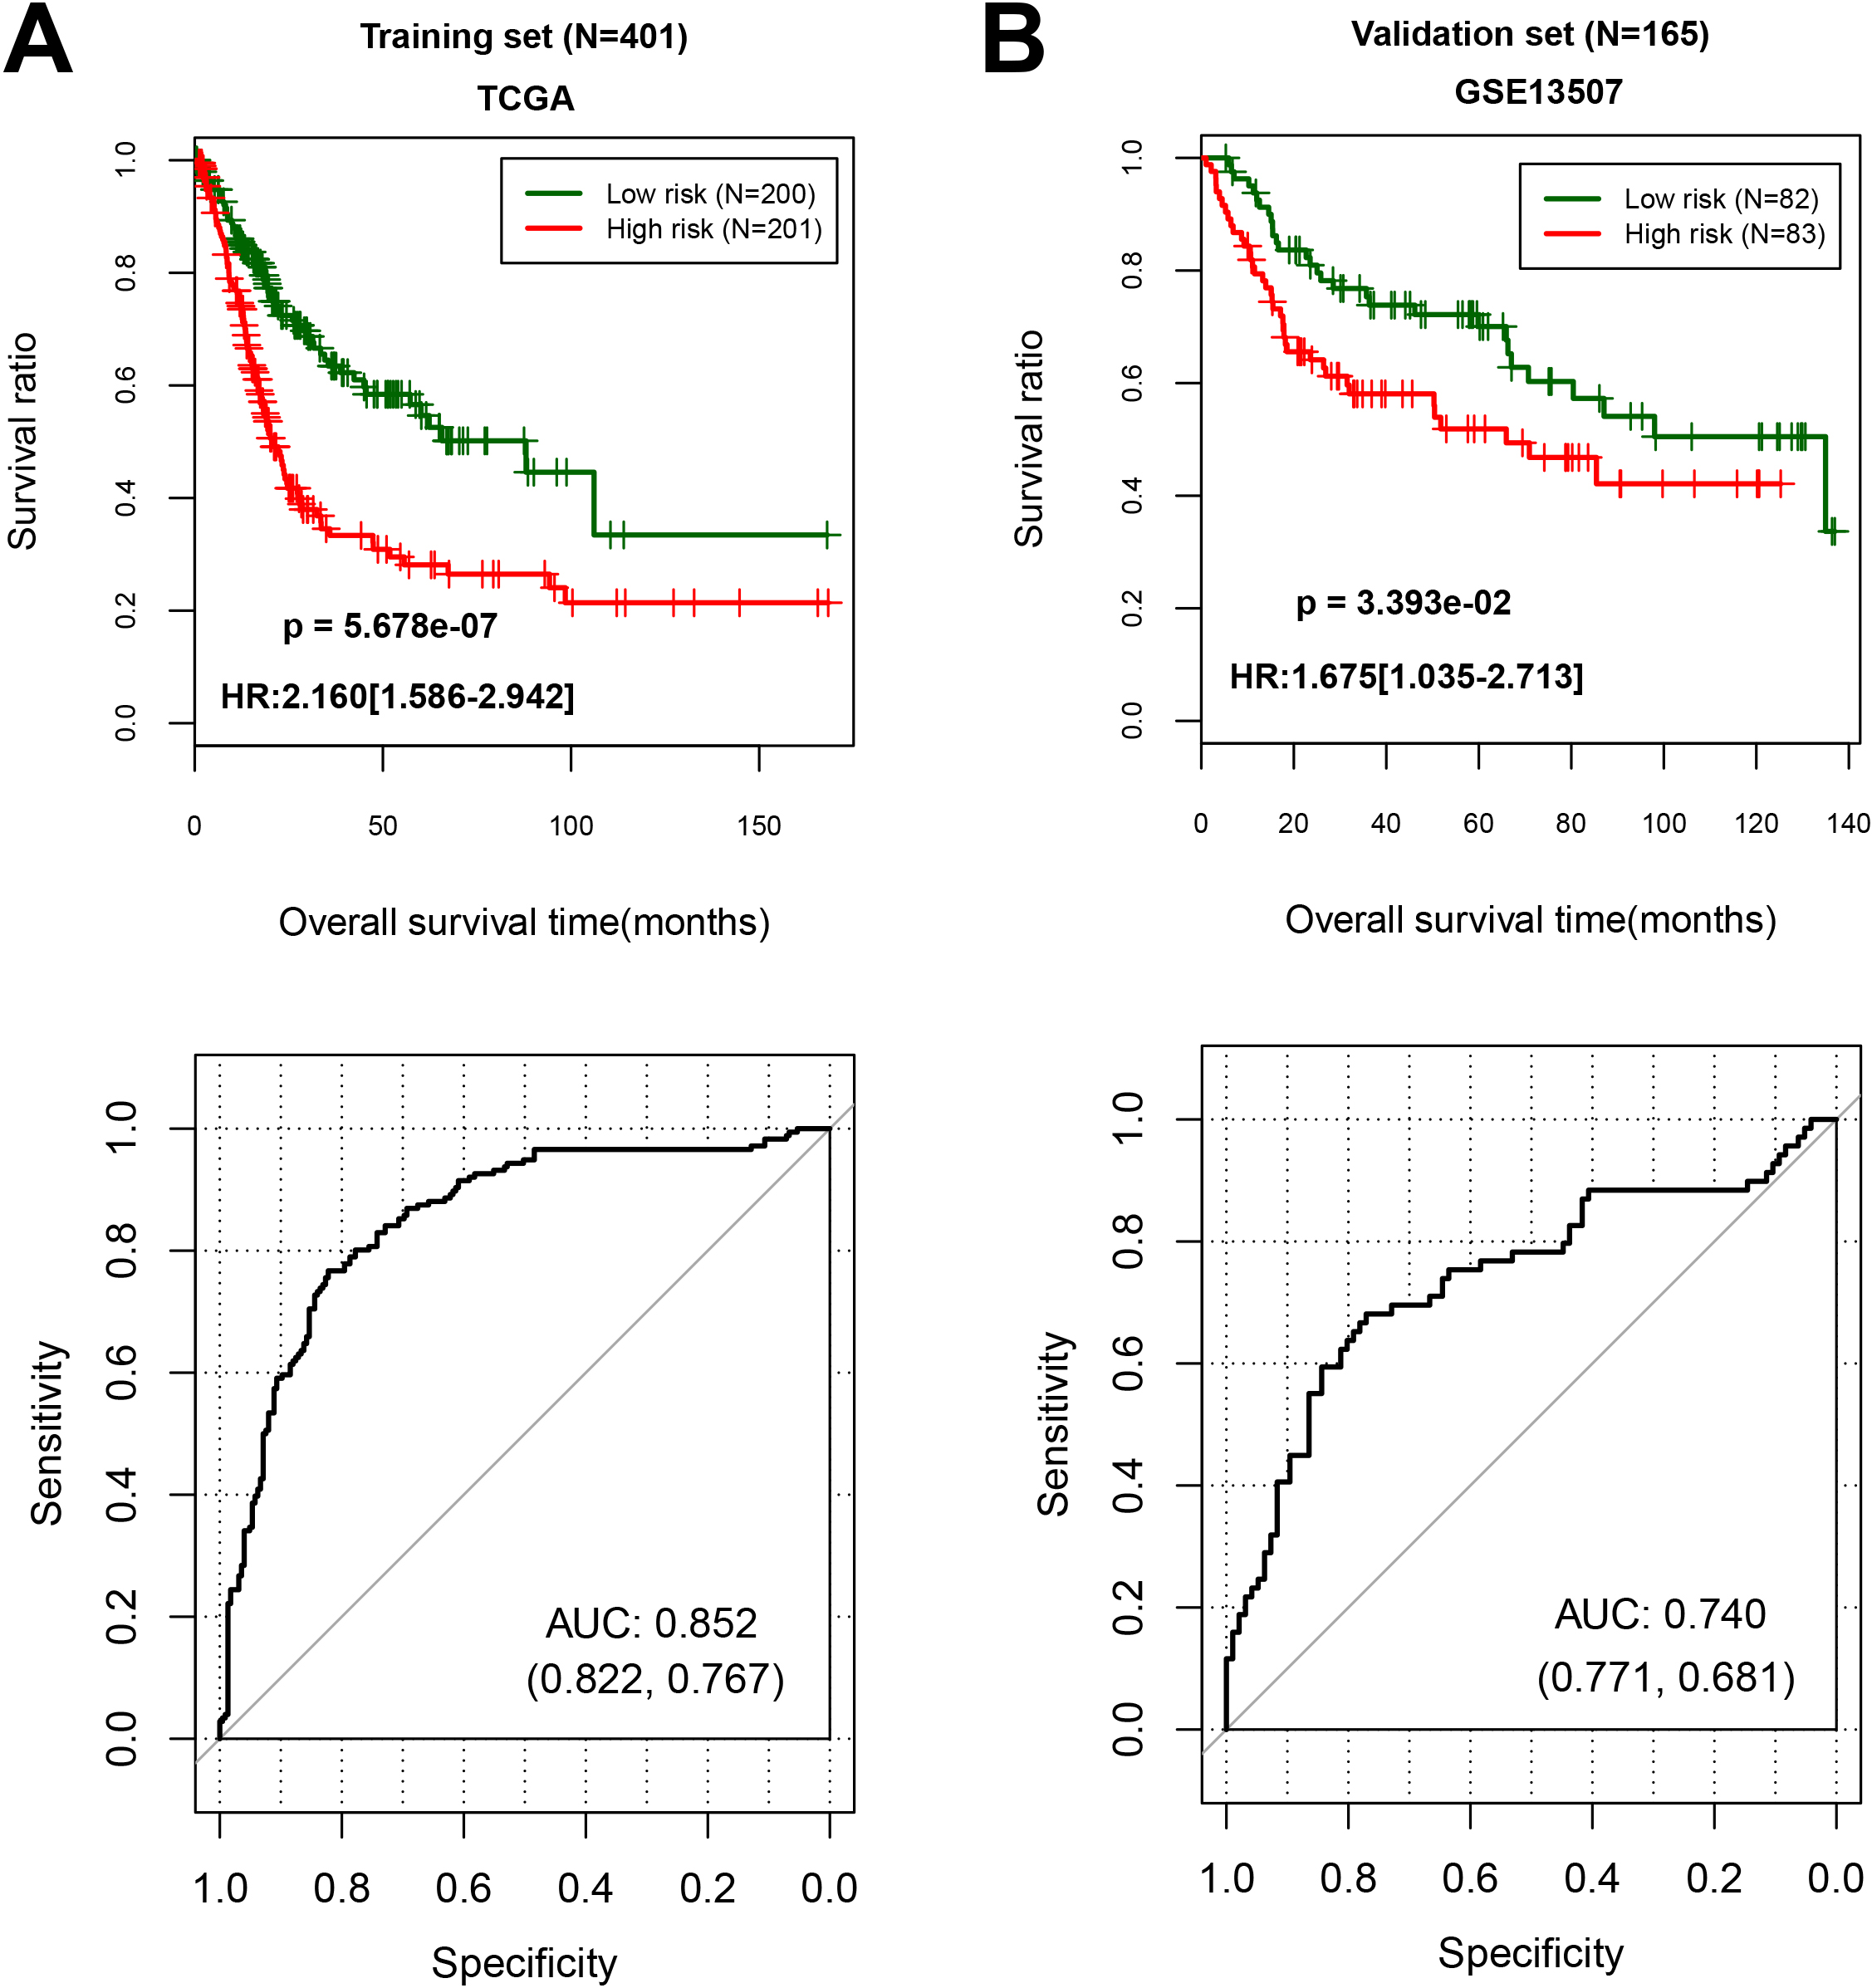
With the cut-off point of median risk score in the training cohort, we found that 201 patients in high-risk (50.1%) group had a lower OS (hazard ratio (HR), 2.160; 95% CI cores, 1.586 to 2.942;
3.5Construction of nomogram for predicting the OS of BC patients
To screen the clinical factors significantly related to prognosis, we analyzed the significance of clinical characteristics between BC and the controls using univariate and multivariate analyses. As shown in Table 3, we found that age, tumor recurrence and PS model status were the significant clinical factors related to prognosis. Further analyses of KM curves indicated that OS of patients aged younger than 60 years higher than the patients older than 60 years (HR 1.033, 95% CI 1.017 to 1.049;
Table 4
ROC curve parameter information table for each type of model
| Type | AUC | C-index | ||||
|---|---|---|---|---|---|---|
| TCGA | GSE13507 | TCGA | GSE13507 | TCGA | GSE13507 | |
| Age | 0.595 | 0.564 | 0.606 | 0.549 | 2.087E-06 | 9.309E-11 |
| Tumor recurrence | 0.609 | 0.543 | 0.543 | 0.548 | 4.923E-02 | 2.989E-01 |
| Clinical model | 0.635 | 0.606 | 0.639 | 0.561 | 6.598E-09 | 1.643E-14 |
| 3 lncRNAs | 0.678 | 0.661 | 0.611 | 0.552 | 2.242E-06 | 1.535E-01 |
| 2 miRNAs | 0.648 | 0.665 | 0.573 | 0.558 | 3.728E-03 | 4.276E-02 |
| 8 mRNAs | 0.785 | 0.738 | 0.608 | 0.605 | 3.073E-06 | 4.693E-03 |
| Multi-RNAs prognostic score model | 0.852 | 0.740 | 0.651 | 0.628 | 2.55E-11 | 6.74E-04 |
| Combine model | 0.901 | 0.758 | 0.694 | 0.651 | 6.26E-14 | |
Note: TCGA, The Cancer Genome Atlas.
Figure 4.
Overall survival was evaluated using Kaplan-Meier curves in line with age and recurrence-tiered low-risk and high-risk scores. (A) Age, age
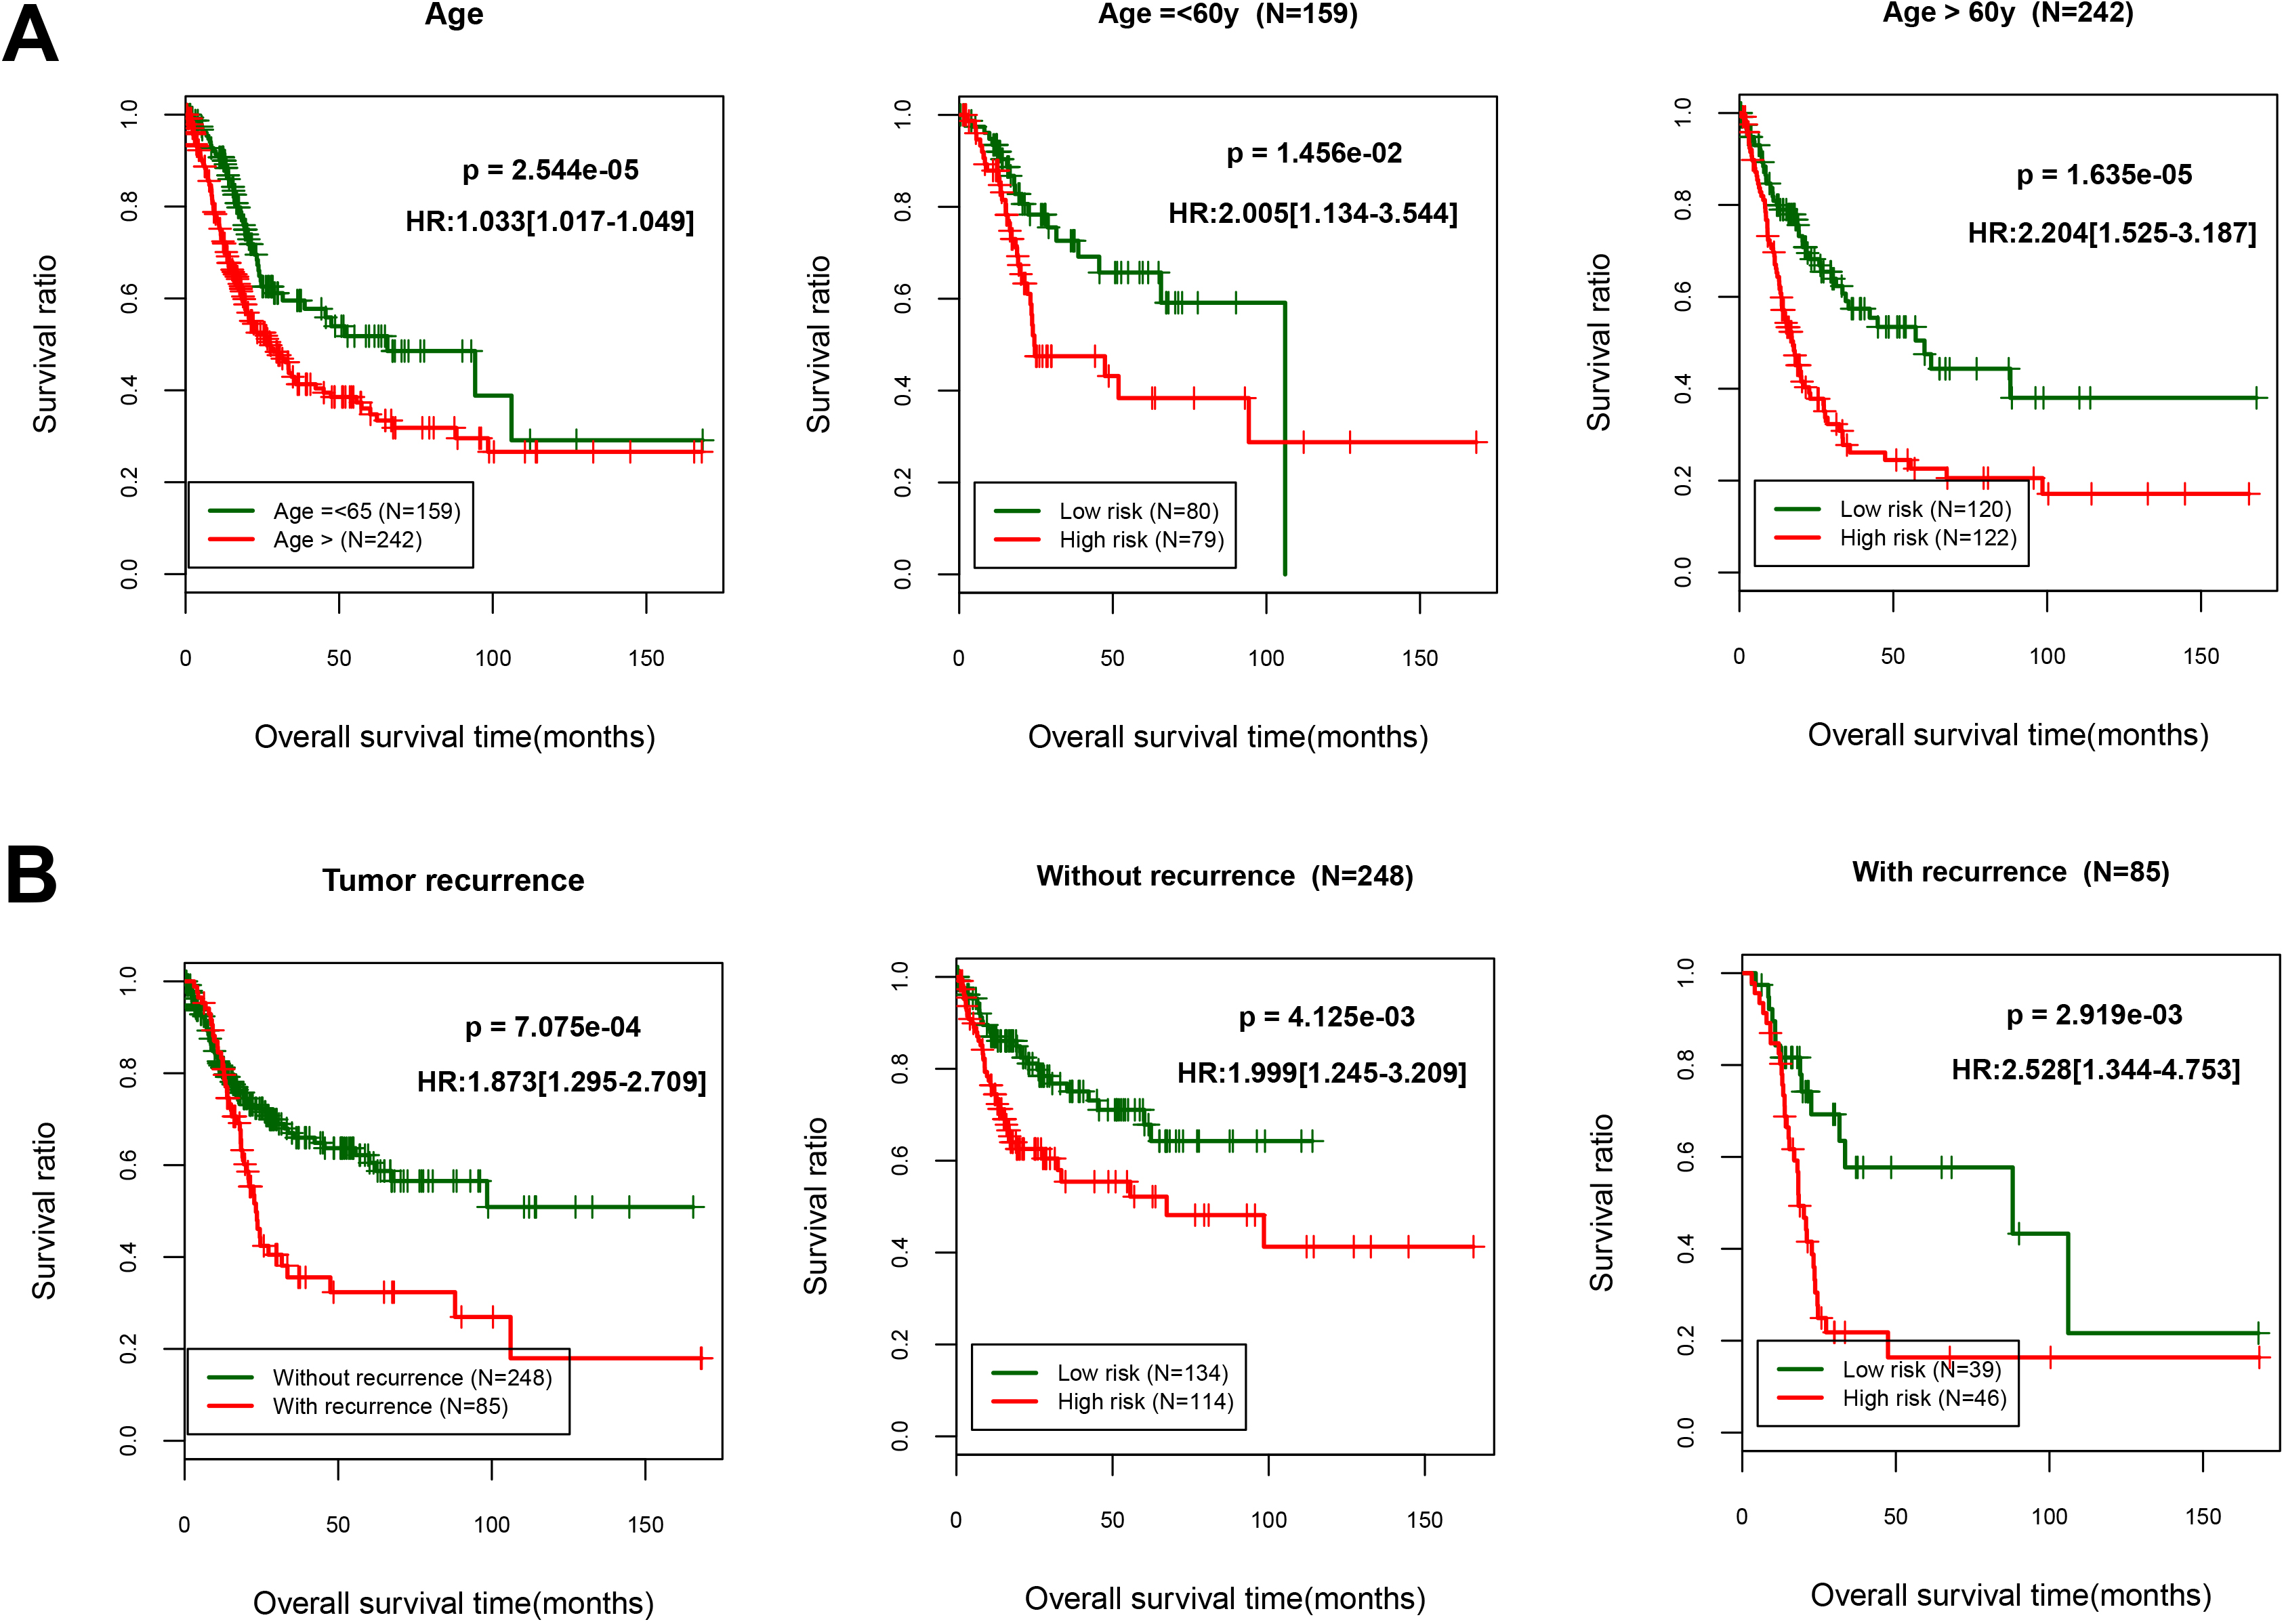
Figure 5.
Nomograms that predict the 3- and 5-year overall survival.
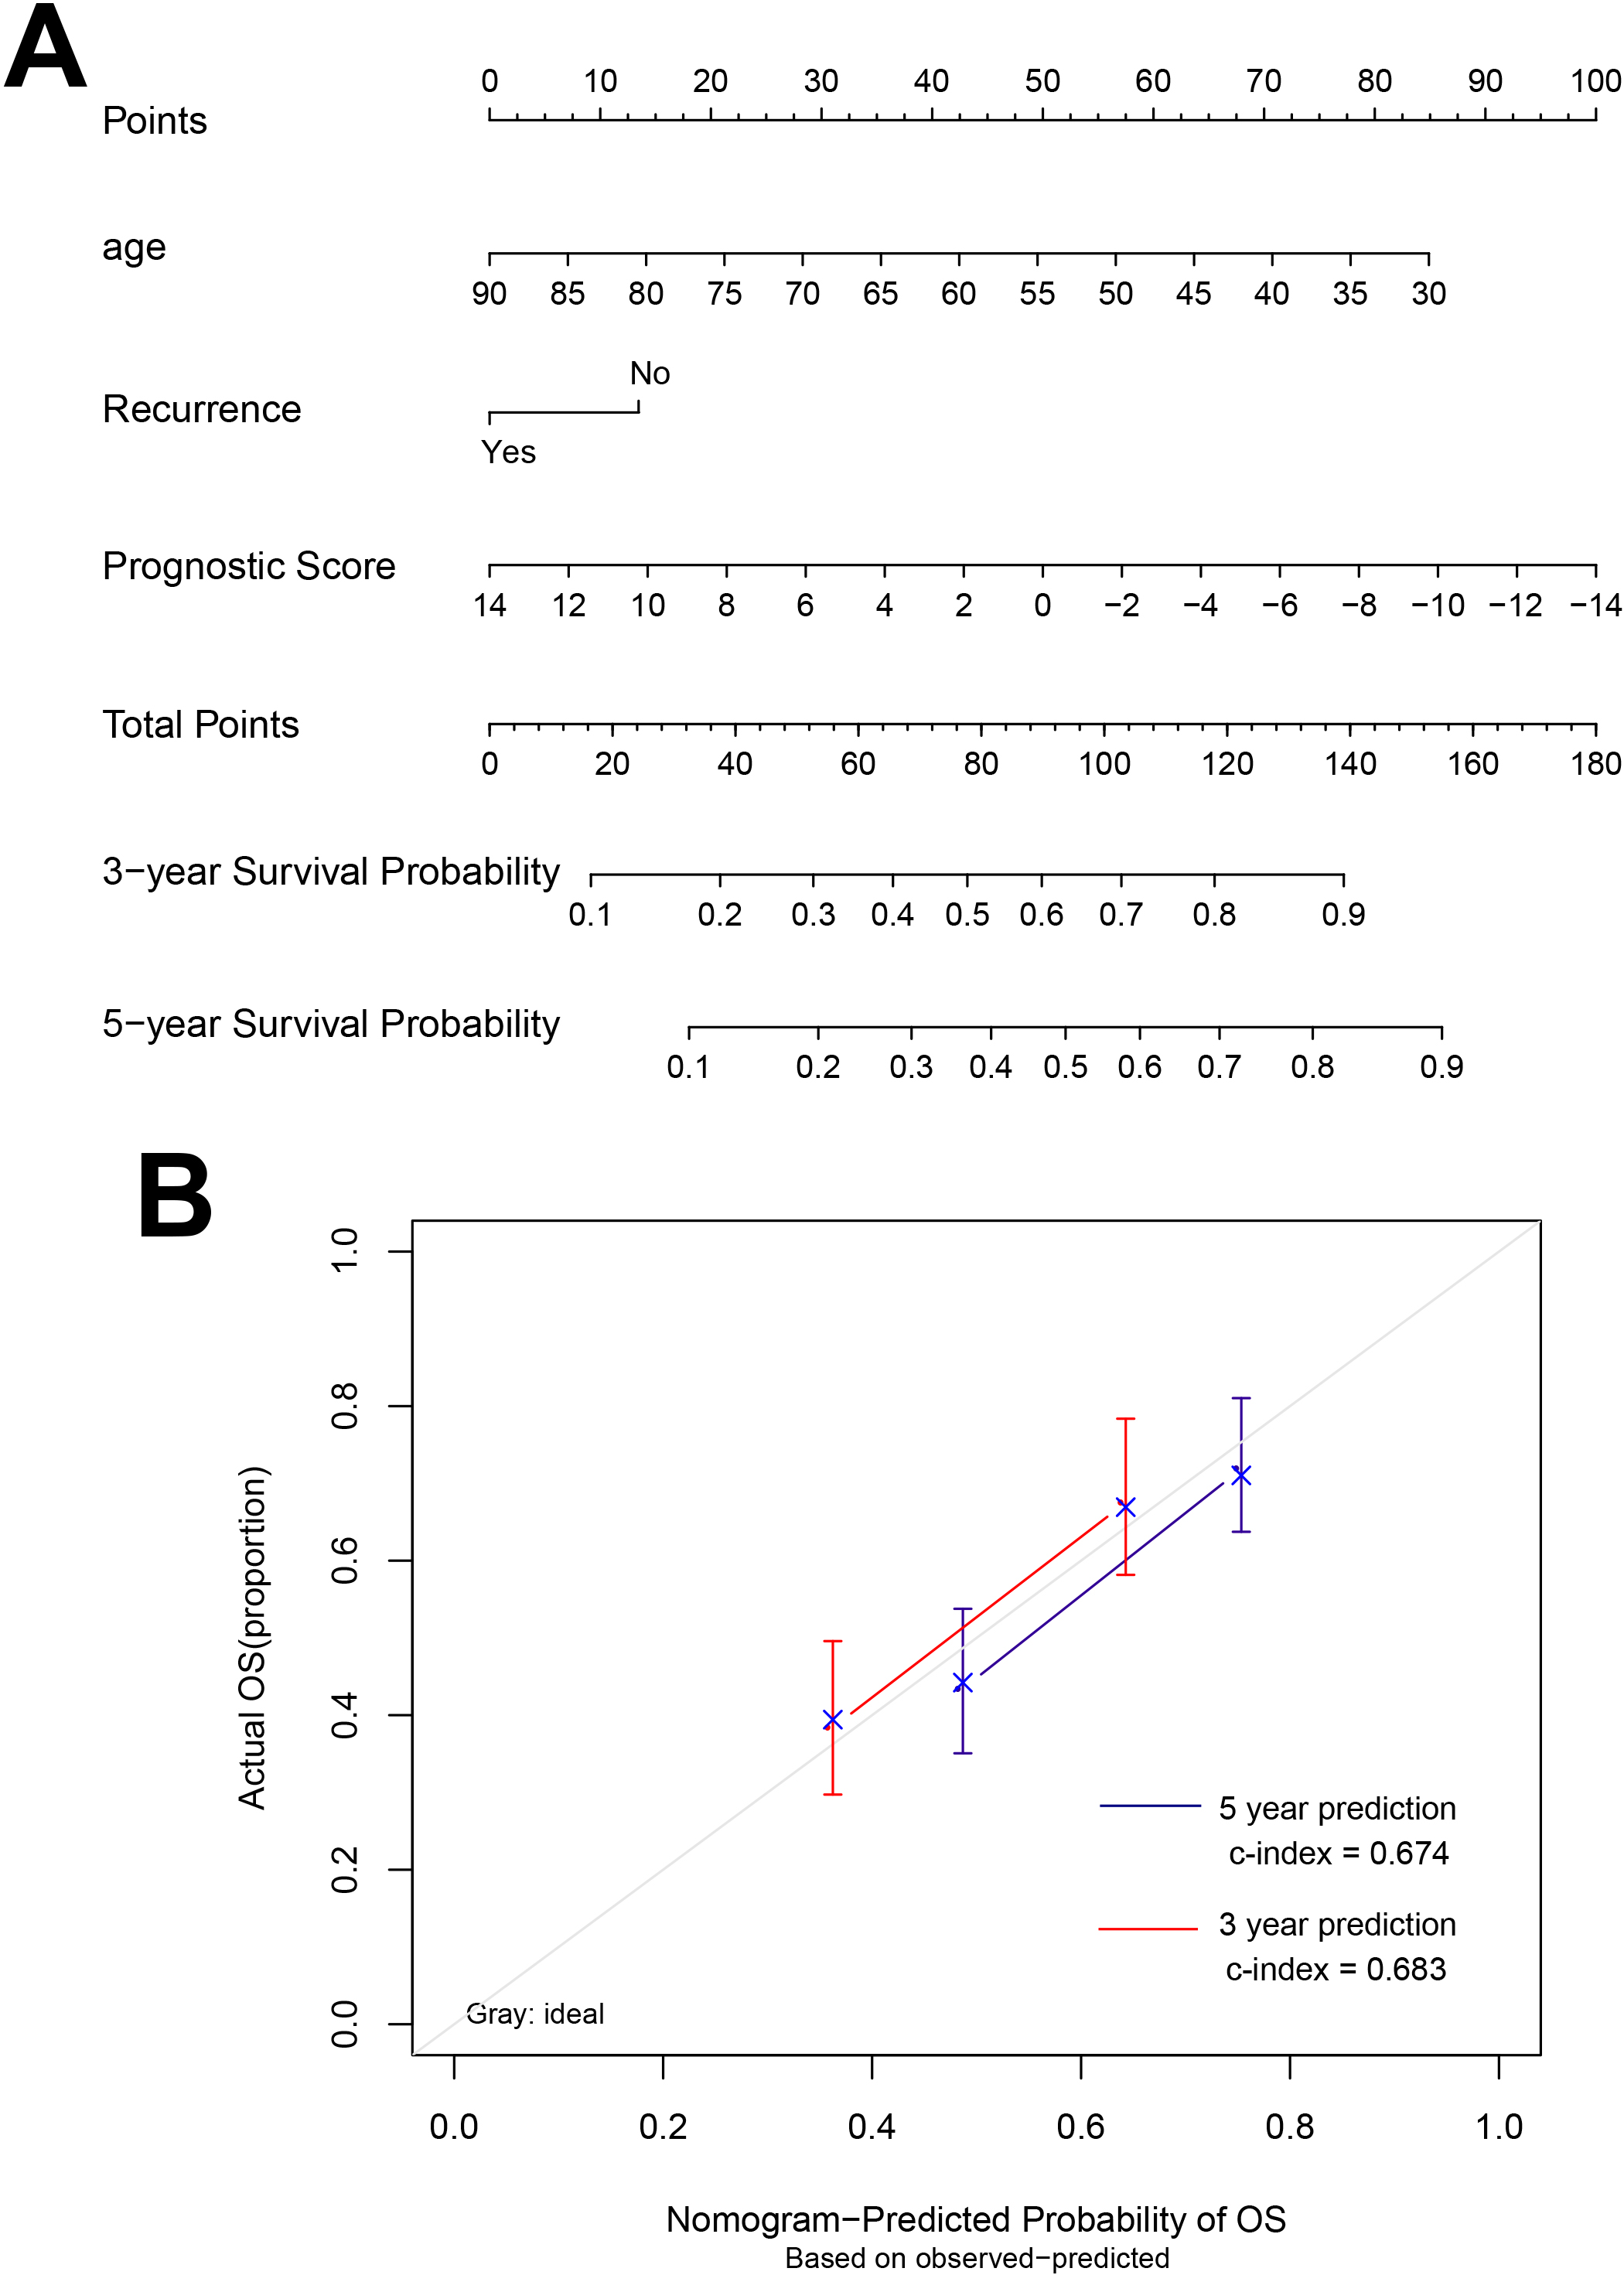
A nomogram was built based on clinicopathological factors in the TCGA cohort to predict the prognosis of samples (Fig. 5). The predictors included age, recurrence and prognostic score. The calibration plots have good predictive ability for 3- and 5-year OS with the c index was 0.683 and 0.674, respectively.
Figure 6.
The ROC curve of training set TCGA (A) and validation set GSE13507 (B) which based on the results of each type of model.
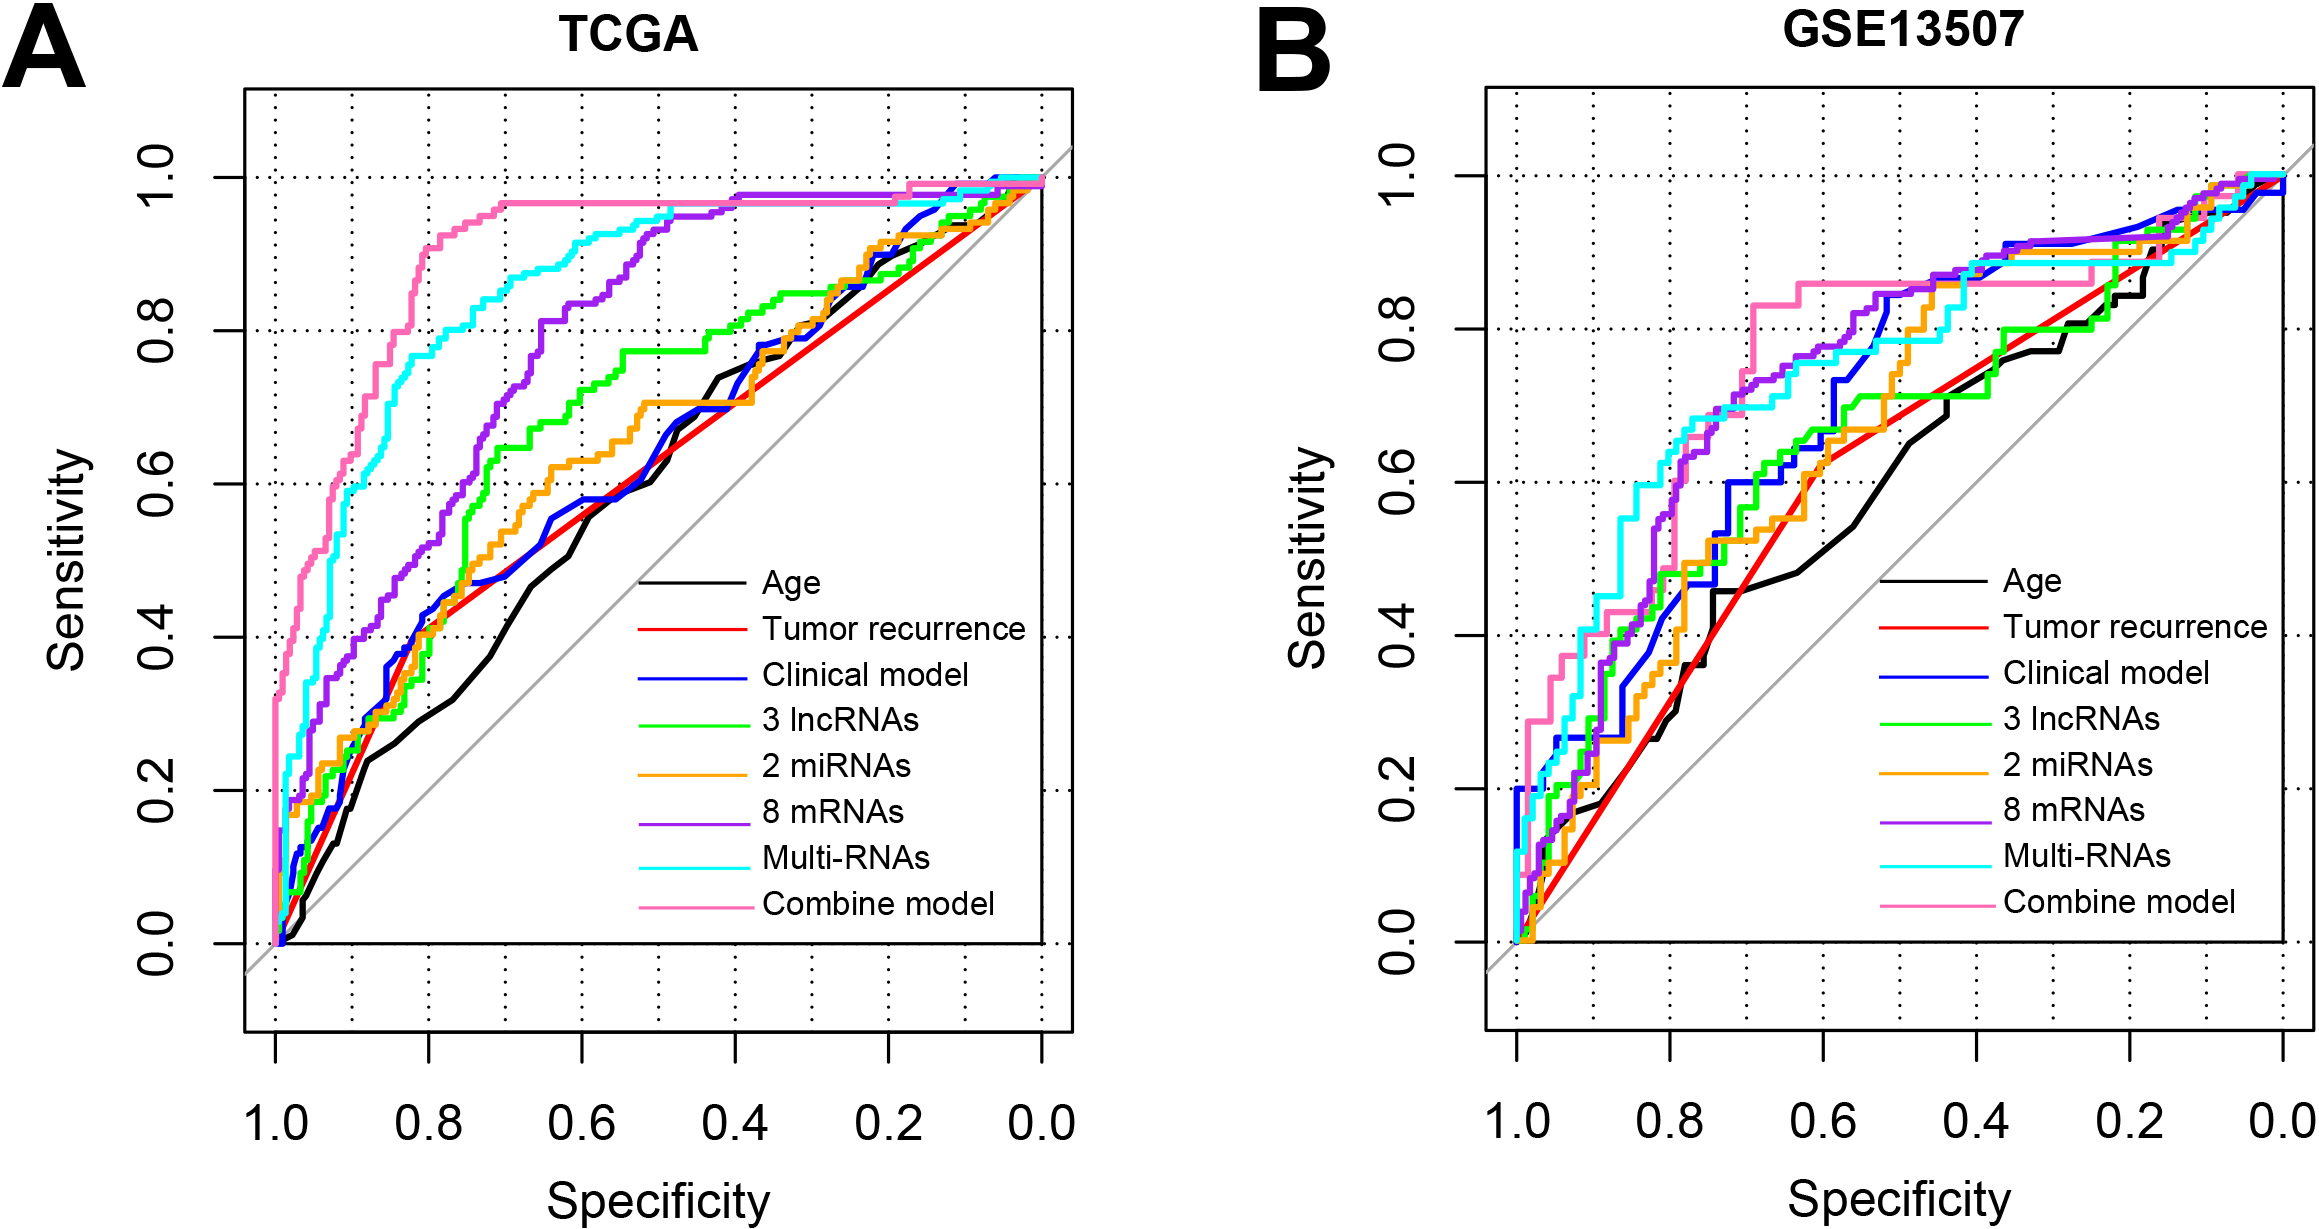
The combination of all the features including age, tumor recurrence, 3 lncRNAs, 2 miRNAs, 8 mRNA could best discriminate the BC to healthy controls with the AUC of 0.901 for TCGA and 0.758 for GSE13507 (Fig. 6, Table 4). All these results suggested that the combined model based on the 13-DERs signature and clinical factors could accurately predict the prognosis and OS for BC patients.
4.Discussion
The present study identified novel prognostic RNAs (including 3 lncRNAs, 2 miRNAs , and 8 mRNA ) in BC and constructed a risk model for predict the prognosis of patients with BC. We validated the tool and found that it could improve the ability to predict prognosis in BC patients compared with clinical risk factors. Additionally, a nomogram comprising prognostic score and clinicopathological data including age and tumor recurrence was obtained to predict the OS. Our results indicated that the 13 DERs signature could be an indicator that categorized patients into a high-risk and a low-risk group, and the OS of the training and validation dataset differed significantly.
We constructed a ceRNA-related 13-gene signature to explore the correlation between BC and lncRNA-associated ceRNA network based on the TCGA cohort using Lasso-penalized Cox regression algorithm. Previous studies have confirmed that the risk score model based on the novel signature could predict the prognosis and survival time of patients with BC [32, 33, 34, 35]. These studies explored the model based on one type such as lncRNA or mRNA, which is inconsistent with our study. In our study, we constructed a ceRNA-related 13-gene signature including lncRNAs, miRNAs and mRNA that have high accuracy of prediction for prognosis of BC patients. Compared to unique type RNA biomarker, the biomarkers screened in this study is a mix of different type of RNAs including lncRNAs, miRNAs and mRNA [36, 37, 38]. The combination of the three type RNAs has the best AUC of 0.852 compared with the unique type of RNA.
Moreover, increasing evidence has implied that some of them might be involved in crucial biological functions in the progression of cancer. From the results of KEGG pathways, we found that NTNG1 (one mRNA in the 13-RNA signature) was involved in cell adhesion molecules pathway. Cell adhesion molecules are complex protein and carbohydrate molecules of many different types found on the surfaces of all cells. They are important in many aspects of cell biology including development, differentiation, and motility. These processes are frequently disturbed in cancer and recent work has demonstrated that disturbances in cell adhesion molecule expression are also common in malignancy [39]. Furthermore, NTNG1 has been reported to be potential tumor diagnostic markers in multiple cancers including BC, Breast invasive carcinoma, and Colon adenocarcinoma [40]. In addition, ISL1 involved in Signaling pathways regulating pluripotency of stem cells. For classic bladder exstrophy, ISL1 has been reported as a significant susceptibility gene, and it regulates the development of urinary tract [41, 42, 43]. Its abnormal methylation could use to predict BC patients outcome [41, 44, 45, 46]. The two mRNA were the important biomarkers to predict prognosis, which might be regarded for targeted therapy for patients with BC. The other DERs need much experiments to explore their function in BC. This study provided a basic therapies for application of the DERs in targeted therapy.
Notably, the signature was validated in another dataset related to BC (GSE13507). Interestingly, patients with BC in the low-risk group have a favorable survival advantage through KM curves. Indeed, the each AUC values of ROC plots in 1, 3 and 5 years were nearly high in the training dataset and validation dataset. These results suggested that the model had excellent accuracy for predicting the prognosis of patient with BC. Furthermore, we also found that risk score in model was related to age and recurrence. Previous studies have indicated that age and recurrence were significantly correlated with the prognosis of BC patients [47, 48]. The two factors have potential prediction ability for patients with BC. Besides, we also found that a nomogram was built based on tumor recurrence and age to predict the OS which could provide simple, accurate prognosis predictions for BC.
The study also has limitations. First, in order to be used widely, an operation-friendly methods such as qPCR should be performed to further validate the model. Second, additional biological experiments should be performed to validate the mechanism of the biomarkers especially the non-coding RNAs. Third, the sample of the validation dataset used in this study is tissue which is not non-invasive. So the data from the blood or the urine should be included to validate the model in the future.
5.Conclusion
In summary, this study suggested that lncRNA-related ceRNA signature is highly correlated with BC. Moreover, we constructed the prognosis model based on 13-RNAs signature that is a potential prognostic tool for predicting the prognosis of BC patients. Additionally, the 13 lncRNA-related RNAs might be considered as the reliable therapeutic biomarkers for predicting the prognosis of BC patients.
Data availability statement
The datasets generated and/or analysed during the current study are available in the NCBI repository, https://www.ncbi.nlm.nih.gov/geo/. Accession number: GSE13507.
Funding
This research did not receive any specific grant from funding agencies in the public, commercial, or not-for-profit sectors.
Ethics of approval statement
Not Applicable.
Patient consent statement
Not Applicable.
Permission to reproduce material from other sources
Not Applicable.
Clinical trial registration
Not Applicable.
Author contributions
Conception: Yin Cao and Zhiyi Zhao.
Interpretation or analysis of data: Lingyun Liu and Hongliang Wang.
Preparation of the manuscript: Lingyun Liu.
Revision for important intellectual content: Zhiyi Zhao, Lingyun Liu, Hongliang Wang.
Supervision: Yin Cao and Zhiyi Zhao.
Conflict of interest
The authors have no conflicts of interest to declare.
References
[1] | W. Chen, R. Zheng, P.D. Baade, S. Zhang, H. Zeng, F. Bray et al., Cancer statistics in China, 2015. CA Cancer J Clin 66: (2) ((2016) ), 115–32. |
[2] | C.Y. Leung, H.L. Huang, M.M. Rahman, S. Nomura, S. Krull Abe, E. Saito et al., Cancer incidence attributable to tuberculosis in 2015: global, regional, and national estimates, BMC Cancer 20: (1) ((2020) ), 12. |
[3] | D.ï¼. Parkin, The global burden of urinary bladder cancer, Scand J Urol Nephrol Suppl (218) ((2008) ), 12–20. |
[4] | A. Richters, K.K.H. Aben and L. Kiemeney, The global burden of urinary bladder cancer: an update, World J Urol 38: (8) ((2020) ), 1895–904. |
[5] | A.G. Gheorghe, F.M. Niţu, I.A. Stanciu and C.T. Streba, Association between Risk Factors and the Existence of Lung Malignancies in a Population from the South-West Romania: A Single-Center Study, Current Health Sciences Journal 47: (4) ((2021) ), 485–93. |
[6] | X. Li, Y. Wang, C. Xu, X. Reheman, Y. Wang, R. Xu et al., Analysis of Competitive Endogenous Mechanism and Survival Prognosis of Serum Exosomes in Ovarian Cancer Patients Based on Sequencing Technology and Bioinformatics, Frontiers in Genetics 13: ((2022) ), 850089. |
[7] | H. Luo, C. Xu, B. Ge and T. Wang, CASC1 Expression in Bladder Cancer Is Regulated by Exosomal miRNA-150: A Comprehensive Pan-Cancer and Bioinformatics Study, Computational and Mathematical Methods in Medicine 2022: ((2022) ), 8100325. |
[8] | Y. Xiong, M. Pang, Y. Du, X. Yu, J. Yuan, W. Liu et al., The LINC01929/miR-6875-5p/ADAMTS12 Axis in the ceRNA Network Regulates the Development of Advanced Bladder Cancer, Frontiers in Oncology 12: ((2022) ), 856560. |
[9] | L. Miao, H.Y. Liu, C. Zhou and X. He, Correction to: LINC00612 enhances the proliferation and invasion ability of bladder cancer cells as ceRNA by sponging miR-590 to elevate expression of PHF14, Journal of Experimental & Clinical Cancer Research: CR 41: (1) ((2022) ), 103. |
[10] | X. Rui, L. Wang, H. Pan, T. Gu, S. Shao and J. Leng, LncRNA GAS6-AS2 promotes bladder cancer proliferation and metastasis via GAS6-AS2/miR-298/CDK9 axis, J Cell Mol Med 23: (2) ((2019) ), 865–76. |
[11] | Z. Li, S. Hong and Z. Liu, LncRNA LINC00641 predicts prognosis and inhibits bladder cancer progression through miR-197-3p/KLF10/PTEN/PI3K/AKT cascade, Biochem Biophys Res Commun 503: (3) ((2018) ), 1825–9. |
[12] | G. Xu, H. Yang, M. Liu, J. Niu, W. Chen, X. Tan et al., lncRNA TINCR facilities bladder cancer progression via regulating miR7 and mTOR, Mol Med Rep 22: (5) ((2020) ), 4243–53. |
[13] | B. Zhang, Y. He, G. Ma, L. Zhang, P. Qi, D. Han et al., Identification of stemness index-related long noncoding RNA SNHG12 in human bladder cancer based on WGCNA, Molecular and Cellular Probes 10: ((2022) ), 1867. |
[14] | Y. Tu, X. Ding and Z. Mao, Identification and verification of the pyroptosis-related prognostic signature and its associated regulatory axis in bladder cancer, Frontiers in Cell and Developmental Biology 10: ((2022) ), 912008. |
[15] | X. Mo, D. Hu, Y. Li, A. Nai, F. Ma, S. Bashir et al., A novel pyroptosis-related prognostic lncRNAs signature, tumor immune microenvironment and the associated regulation axes in bladder cancer, Frontiers in Genetics 13: ((2022) ), 936305. |
[16] | M.E. Ritchie, B. Phipson, D. Wu, Y. Hu, C.W. Law, W. Shi et al., limma powers differential expression analyses for RNA-sequencing and microarray studies, Nucleic Acids Res 43: (7) ((2015) ), e47. |
[17] | L. Wang, C. Cao, Q. Ma, Q. Zeng, H. Wang, Z. Cheng et al., RNA-seq analyses of multiple meristems of soybean: novel and alternative transcripts, evolutionary and functional implications, BMC Plant Biol 14: ((2014) ), 169. |
[18] | M.D. Paraskevopoulou, I.S. Vlachos, D. Karagkouni, G. Georgakilas, I. Kanellos, T. Vergoulis et al., DIANA-LncBase v2: indexing microRNA targets on non-coding transcripts, Nucleic Acids Res 44: (D1) ((2016) ), D231–8. |
[19] | H. Jin, W. Liu, W. Xu, L. Zhou, H. Luo, C. Xu et al., Identification of Prognostic Factors in Cholangiocarcinoma Based on Integrated ceRNA Network Analysis, Computational and Mathematical Methods in Medicine 2022: ((2022) ), 7102736. |
[20] | J.H. Li, S. Liu, H. Zhou, L.H. Qu and J.H. Yang, starBase v2.0: decoding miRNA-ceRNA, miRNA-ncRNA and protein-RNA interaction networks from large-scale CLIP-Seq data, Nucleic Acids Res 42: (Database issue) ((2014) ), D92–7. |
[21] | P. Shannon, A. Markiel, O. Ozier, N.S. Baliga, J.T. Wang, D. Ramage et al., Cytoscape: a software environment for integrated models of biomolecular interaction networks, Genome Res 13: (11) ((2003) ), 2498–504. |
[22] | Y. Zhou, B. Zhou, L. Pache, M. Chang, A.H. Khodabakhshi, O. Tanaseichuk et al., Metascape provides a biologist-oriented resource for the analysis of systems-level datasets, Nat Commun 10: (1) ((2019) ), 1523. |
[23] | J. Zhou, X. Hui, Y. Mao and L. Fan, Identification of novel genes associated with a poor prognosis in pancreatic ductal adenocarcinoma via a bioinformatics analysis, Biosci Rep 39: (8) ((2019) ). |
[24] | P. Wang, Y. Wang, B. Hang, X. Zou and J.H. Mao, A novel gene expression-based prognostic scoring system to predict survival in gastric cancer, Oncotarget 7: (34) ((2016) ), 55343–51. |
[25] | J.J. Goeman, L1 penalized estimation in the Cox proportional hazards model, Biom J 52: (1) ((2010) ), 70–84. |
[26] | R. Tibshirani, The lasso method for variable selection in the Cox model, Stat Med 16: (4) ((1997) ), 385–95. |
[27] | X. Robin, N. Turck, A. Hainard, N. Tiberti, F. Lisacek, J.C. Sanchez et al., pROC: an open-source package for R and S+ to analyze and compare ROC curves, BMC Bioinformatics 12: ((2011) ), 77. |
[28] | K. Ye, M. Xiao, Z. Li, K. He, J. Wang, L. Zhu et al., Preoperative systemic inflammation response index is an independent prognostic marker for BCG immunotherapy in patients with non-muscle-invasive bladder cancer, Cancer Medicine, (2022) . |
[29] | F.E. Harrell Jr., K.L. Lee and D.B. Mark, Multivariable prognostic models: issues in developing models, evaluating assumptions and adequacy, and measuring and reducing errors, Stat Med 15: (4) ((1996) ), 361–87. |
[30] | A. Mayr and M. Schmid, Boosting the concordance index for survival data – a unified framework to derive and evaluate biomarker combinations, PLoS One 9: (1) ((2014) ), e84483. |
[31] | S. Shan, W. Chen and J.D. Jia, Transcriptome Analysis Revealed a Highly Connected Gene Module Associated With Cirrhosis to Hepatocellular Carcinoma Development, Front Genet 10: ((2019) ), 305. |
[32] | Y. Zhang, Y. Lin, D. Lv, X. Wu, W. Li, X. Wang et al., Identificationandvalidationofanovelsignatureforpredictiontheprognosisandimmunotherapybenefitinbladdercancer, PeerJ 10: ((2022) ), e12843. |
[33] | L. Wang, Y. Wang, J. Wang, L. Li and J. Bi, Identification of a Prognosis-Related Risk Signature for Bladder Cancer to Predict Survival and Immune Landscapes, Journal of Immunology Research 2021: ((2021) ), 3236384. |
[34] | Z. Xu, H. Chen, J. Sun, W. Mao, S. Chen and M. Chen, Multi-Omics analysis identifies a lncRNA-related prognostic signature to predict bladder cancer recurrence, Bioengineered 12: (2) ((2021) ), 11108–25. |
[35] | K. Jin, S. Qiu, D. Jin, X. Zhou, X. Zheng, J. Li et al., Development of prognostic signature based on immune-related genes in muscle-invasive bladder cancer: bioinformatics analysis of TCGA database, Aging 13: (2) ((2021) ), 1859–71. |
[36] | M. Peng, X. Cheng, W. Xiong, L. Yi and Y. Wang, Integrated Analysis of a Competing Endogenous RNA Network Reveals a Prognostic lncRNA Signature in Bladder Cancer, Frontiers in Oncology 11: ((2021) ), 684242. |
[37] | S.P. Shao, R.J. Zhao, S. Lu, L.P. Wen, J.J. Ni, K.M. Zhu et al., Identification of circRNA-mediated competing endogenous RNA network in the development of bladder urothelial carcinoma, Journal of Biological Regulators and Homeostatic Agents 35: (4) ((2021) ). |
[38] | J. Zhu, Y. Huang, Y. Zhang, R. Huang and C. Huang, KCNMB2-AS1 Promotes Bladder Cancer Progression Through Sponging miR-374a-3p to Upregulate S100A10, Frontiers in Genetics 12: ((2021) ), 655569. |
[39] | J. Fawcett and A.L. Harris, Cell adhesion molecules and cancer, Current Opinion in Oncology 4: (1) ((1992) ), 142–8. |
[40] | W. Hao, M. Yu, J. Lin, B. Liu, H. Xing, J. Yang et al., The pan-cancer landscape of netrin family reveals potential oncogenic biomarkers, Scientific Reports 10: (1) ((2020) ), 5224. |
[41] | M. Akhir, C.S. Choy, M.A. Abdullah and F.A. Ghani, A. Veerakumarasivam, H. Hussin, The Role of ISL1 and LHX5 LIM Homeobox Genes in Bladder Tumourigenesis, The Malaysian Journal of Medical Sciences: MJMS 27: (1) ((2020) ), 37–45. |
[42] | B. Dong, J. Liang, D. Li, W. Song, J. Song, M. Zhu et al., Identification of a Prognostic Signature Associated With the Homeobox Gene Family for Bladder Cancer, Frontiers in Molecular Biosciences 8: ((2021) ), 688298. |
[43] | P.M.S. Gurung, A.R. Barnett, J.S. Wilson, J. Hudson, D.G. Ward, E.M. Messing et al., Prognostic DNA Methylation Biomarkers in High-risk Non-muscle-invasive Bladder Cancer: A Systematic Review to Identify Loci for Prospective Validation, European Urology Focus 6: (4) ((2020) ), 683–97. |
[44] | M.O. Kitchen, R.T. Bryan, K.E. Haworth, R.D. Emes, C. Luscombe, L. Gommersall et al., Methylation of HOXA9 and ISL1 Predicts Patient Outcome in High-Grade Non-Invasive Bladder Cancer, PLoS One 10: (9) ((2015) ), e0137003. |
[45] | S. Wang, D. Xu, B. Gao, S. Yan, Y. Sun, X. Tang et al., Heterogeneity Analysis of Bladder Cancer Based on DNA Methylation Molecular Profiling, Frontiers in Oncology 12: ((2022) ), 915542. |
[46] | R. Yan, W. Dai, R. Wu, H. Huang and M. Shu, Therapeutic targeting m6A-guided miR-146a-5p signaling contributes to the melittin-induced selective suppression of bladder cancer, Cancer Letters 534: ((2022) ), 215615. |
[47] | R. Madeb and E.M. Messing, Gender, racial and age differences in bladder cancer incidence and mortality, Urologic Oncology 22: (2) ((2004) ), 86–92. |
[48] | H. Zhao, Z. Chen, Y. Fang, M. Su, Y. Xu, Z. Wang et al., Prediction of Prognosis and Recurrence of Bladder Cancer by ECM-Related Genes, Journal of Immunology Research 2022: ((2022) ), 1793005. |


