
Construct dysregulated miRNA-mRNA interaction networks to conjecture possible pathogenesis for Stomach adenocarcinomas
Abstract
BACKGROUND:
Post-transcriptional regulation of mRNA induced by microRNA is known crucial in tumor occurrence, progression, and metastasis. This study aims at identifying significant miRNA-mRNA axes for stomach adenocarcinomas (STAD).
METHOD:
RNA expression profiles were collected from The Cancer Genome Atlas (TCGA) and GEO database for screening differently expressed RNAs and miRNAs (DE-miRNAs/DE-mRNAs). Functional enrichment analysis was conducted with Hiplot and DAVID-mirPath. Connectivity MAP was applied in compounds prediction. MiRNA-mRNA axes were forecasted by TarBase and MiRTarBase. Real-time reverse transcription polymerase chain reaction (RT-qPCR) of stomach specimen verified these miRNA-mRNA pairs. Diagnosis efficacy of miRNA-mRNA interactions was measured by Receiver operation characteristic curve and Decision Curve Analysis. Clinical and survival analysis were also carried out. CIBERSORT and ESTIMATE was employed for immune microenvironment measurement.
RESULT:
Totally 228 DE-mRNAs (105 upregulated and 123 downregulated) and 38 DE-miRNAs (22 upregulated and 16 downregulated) were considered significant. TarBase and MiRTarBase identified 18 miRNA-mRNA pairs, 12 of which were verified in RT-qPCR. The network of miR-301a-3p/ELL2 and miR-1-3p/ANXA2 were established and verified in external validation. The model containing all 4 signatures showed better diagnosis ability. Via interacting with M0 macrophage and resting mast cell, these miRNA-mRNA axes may influence tumor microenvironment.
CONCLUSION:
This study established a miRNA-mRNA network via bioinformatic analysis and experiment validation for STAD.
1.Introduction
Gastric cancer (GC) is the fourth common malignancy and is becoming one of the leading causes of tumor-related death, bringing about approximately 1.1 million new cases and 768 thousand deaths in 2020 globally [1]. More than half of the newly diagnosed cases were observed in developing countries [2]. Helicobacter pylori infection, excessive salt intake, tobacco smoking, alcohol exposure, familial predisposition and lack of fruits and vegetables in daily diets are the main risk factors for gastric cancer [3]. Despite the progression in early diagnosis and therapies of gastric cancer, the overall 5-year survival rate remained low, ranging from 18–58% in different races [4]. Stomach adenocarcinomas (STAD) accounted for almost 95% of gastric cancer [5]. So, it is of great value to dig in candidate therapeutic targets and novel biomarkers with prognostic efficacy for STAD.
MicroRNAs (MiRNAs) are a family of
Nowadays, databases based on high-throughput sequencing and microarrays provide opportunities for obtaining more global views of miRNAs and mRNAs in tumor. Some studies have employed some Gene Expression Omnibus (GEO) datasets to identify differently expressed miRNAs (DE-miRNAs) and differently expressed mRNAs (DE-mRNAs) [13, 14]. Researches of Zhijie Dong et al. and Yong-jun Guan revealed several key miRNA-mRNA pairs in gastric cancer by analysis of databases and PubMed publications [15, 16]. However, most of these previous researches only absorbed few GEO datasets. In present study, totally 23 mRNA and 8 miRNA GEO datasets concentrating on STAD tissue and normal stomach tissue were incorporated. TarBase and MiRTarBase, databases collecting experiment verified miRNA-mRNA networks, were applied in screening miRNA-mRNA axes. Next, we conducted reverse transcription quantitative polymerase chain reaction (RT-qPCR) in 30 paired STAD tissue and adjacent normal tissue to measure the expression level of these miRNA-mRNA pairs. The receiver operation characteristic (ROC) curve and Decision Curve Analysis (DCA) based on binary logistic regression helped to evaluate the diagnosis efficiency. Clinical subgroup analysis and survival analysis were promoted for prognosis estimation. Correlation analyzes between miRNA-mRNA axes expression and tumor immune microenvironment, immune cell infiltration, tumor mutation burden was carried out to measure their effects on phenotypic features. This study combining bioinformatic analysis and RT-qPCR may throw new a light on the pathogenesis and potential drug target for STAD.
Table 1
Information pertaining to the GEO datasets based on STAD tissues
| GEO accession | Number of tumors | Number of non-tumors | Total number | Country | Platform | PMID | |
|---|---|---|---|---|---|---|---|
| miRNA array | GSE26595 | 60 | 8 | 68 | South Korea | GPL8179 | 24222951 |
| GSE23739 | 40 | 40 | 80 | Switzerland | GPL7731 | 21415212 | |
| GSE28700 | 22 | 22 | 44 | China | GPL9081 | 21703006 | |
| GSE63121 | 15 | 15 | 30 | China | GPL8786 | 25646628 | |
| GSE77380 | 7 | 3 | 10 | Japan | GPL16770 | 28208131 | |
| GSE2564 | 1 | 6 | 7 | USA | GPL1986 | 15944708 | |
| GSE93415 | 20 | 20 | 40 | Poland | GPL19071 | 28641313 | |
| GSE54397 | 16 | 17 | 33 | South Korea | GPL15159 | 25167801 | |
| mRNA array | GSE103236 | 10 | 9 | 19 | Romania | GPL4133 | 32587446 |
| GSE118897 | 10 | 10 | 20 | China | GPL16686 | 30404039 | |
| GSE130823 | 47 | 47 | 94 | China | GPL17077 | 32207854 | |
| GSE13861 | 65 | 19 | 84 | USA | GPL6884 | 21447720 | |
| GSE13911 | 38 | 31 | 69 | Italy | GPL570 | 19081245 | |
| GSE19826 | 15 | 12 | 27 | China | GPL570 | 21132402 | |
| GSE2685 | 22 | 8 | 30 | Japan | GPL80 | 11782383 | |
| GSE26899 | 96 | 12 | 108 | USA | GPL6947 | 29725014 | |
| GSE27342 | 80 | 80 | 160 | USA | GPL5175 | 20965966 | |
| GSE29272 | 134 | 134 | 268 | USA | GPL96 | 24867265 | |
| GSE29998 | 50 | 50 | 100 | Singapore | GPL6947 | 21781349 | |
| GSE33335 | 25 | 25 | 50 | China | GPL5175 | 23722107 | |
| GSE33651 | 40 | 12 | 52 | South Korea | GPL2895 | 22133303 | |
| GSE49051 | 3 | 3 | 6 | China | GPL10332 | 24987055 | |
| GSE51575 | 27 | 27 | 54 | South Korea | GPL13607 | 25254613 | |
| GSE55696 | 58 | 19 | 77 | China | GPL6480 | 25548486 | |
| GSE56807 | 5 | 5 | 10 | China | GPL5175 | 24927122 | |
| GSE63089 | 45 | 45 | 90 | China | GPL5175 | 25646628 | |
| GSE65801 | 32 | 32 | 64 | China | GPL14550 | 25928635 | |
| GSE66229 | 300 | 100 | 400 | USA | GPL570 | 29725014 | |
| GSE78523 | 14 | 15 | 29 | Spain | GPL18990 | 28441455 | |
| GSE79973 | 10 | 10 | 20 | China | GPL570 | 29113266 | |
| GSE96668 | 49 | 11 | 60 | the UK | GPL10558 | 31050820 |
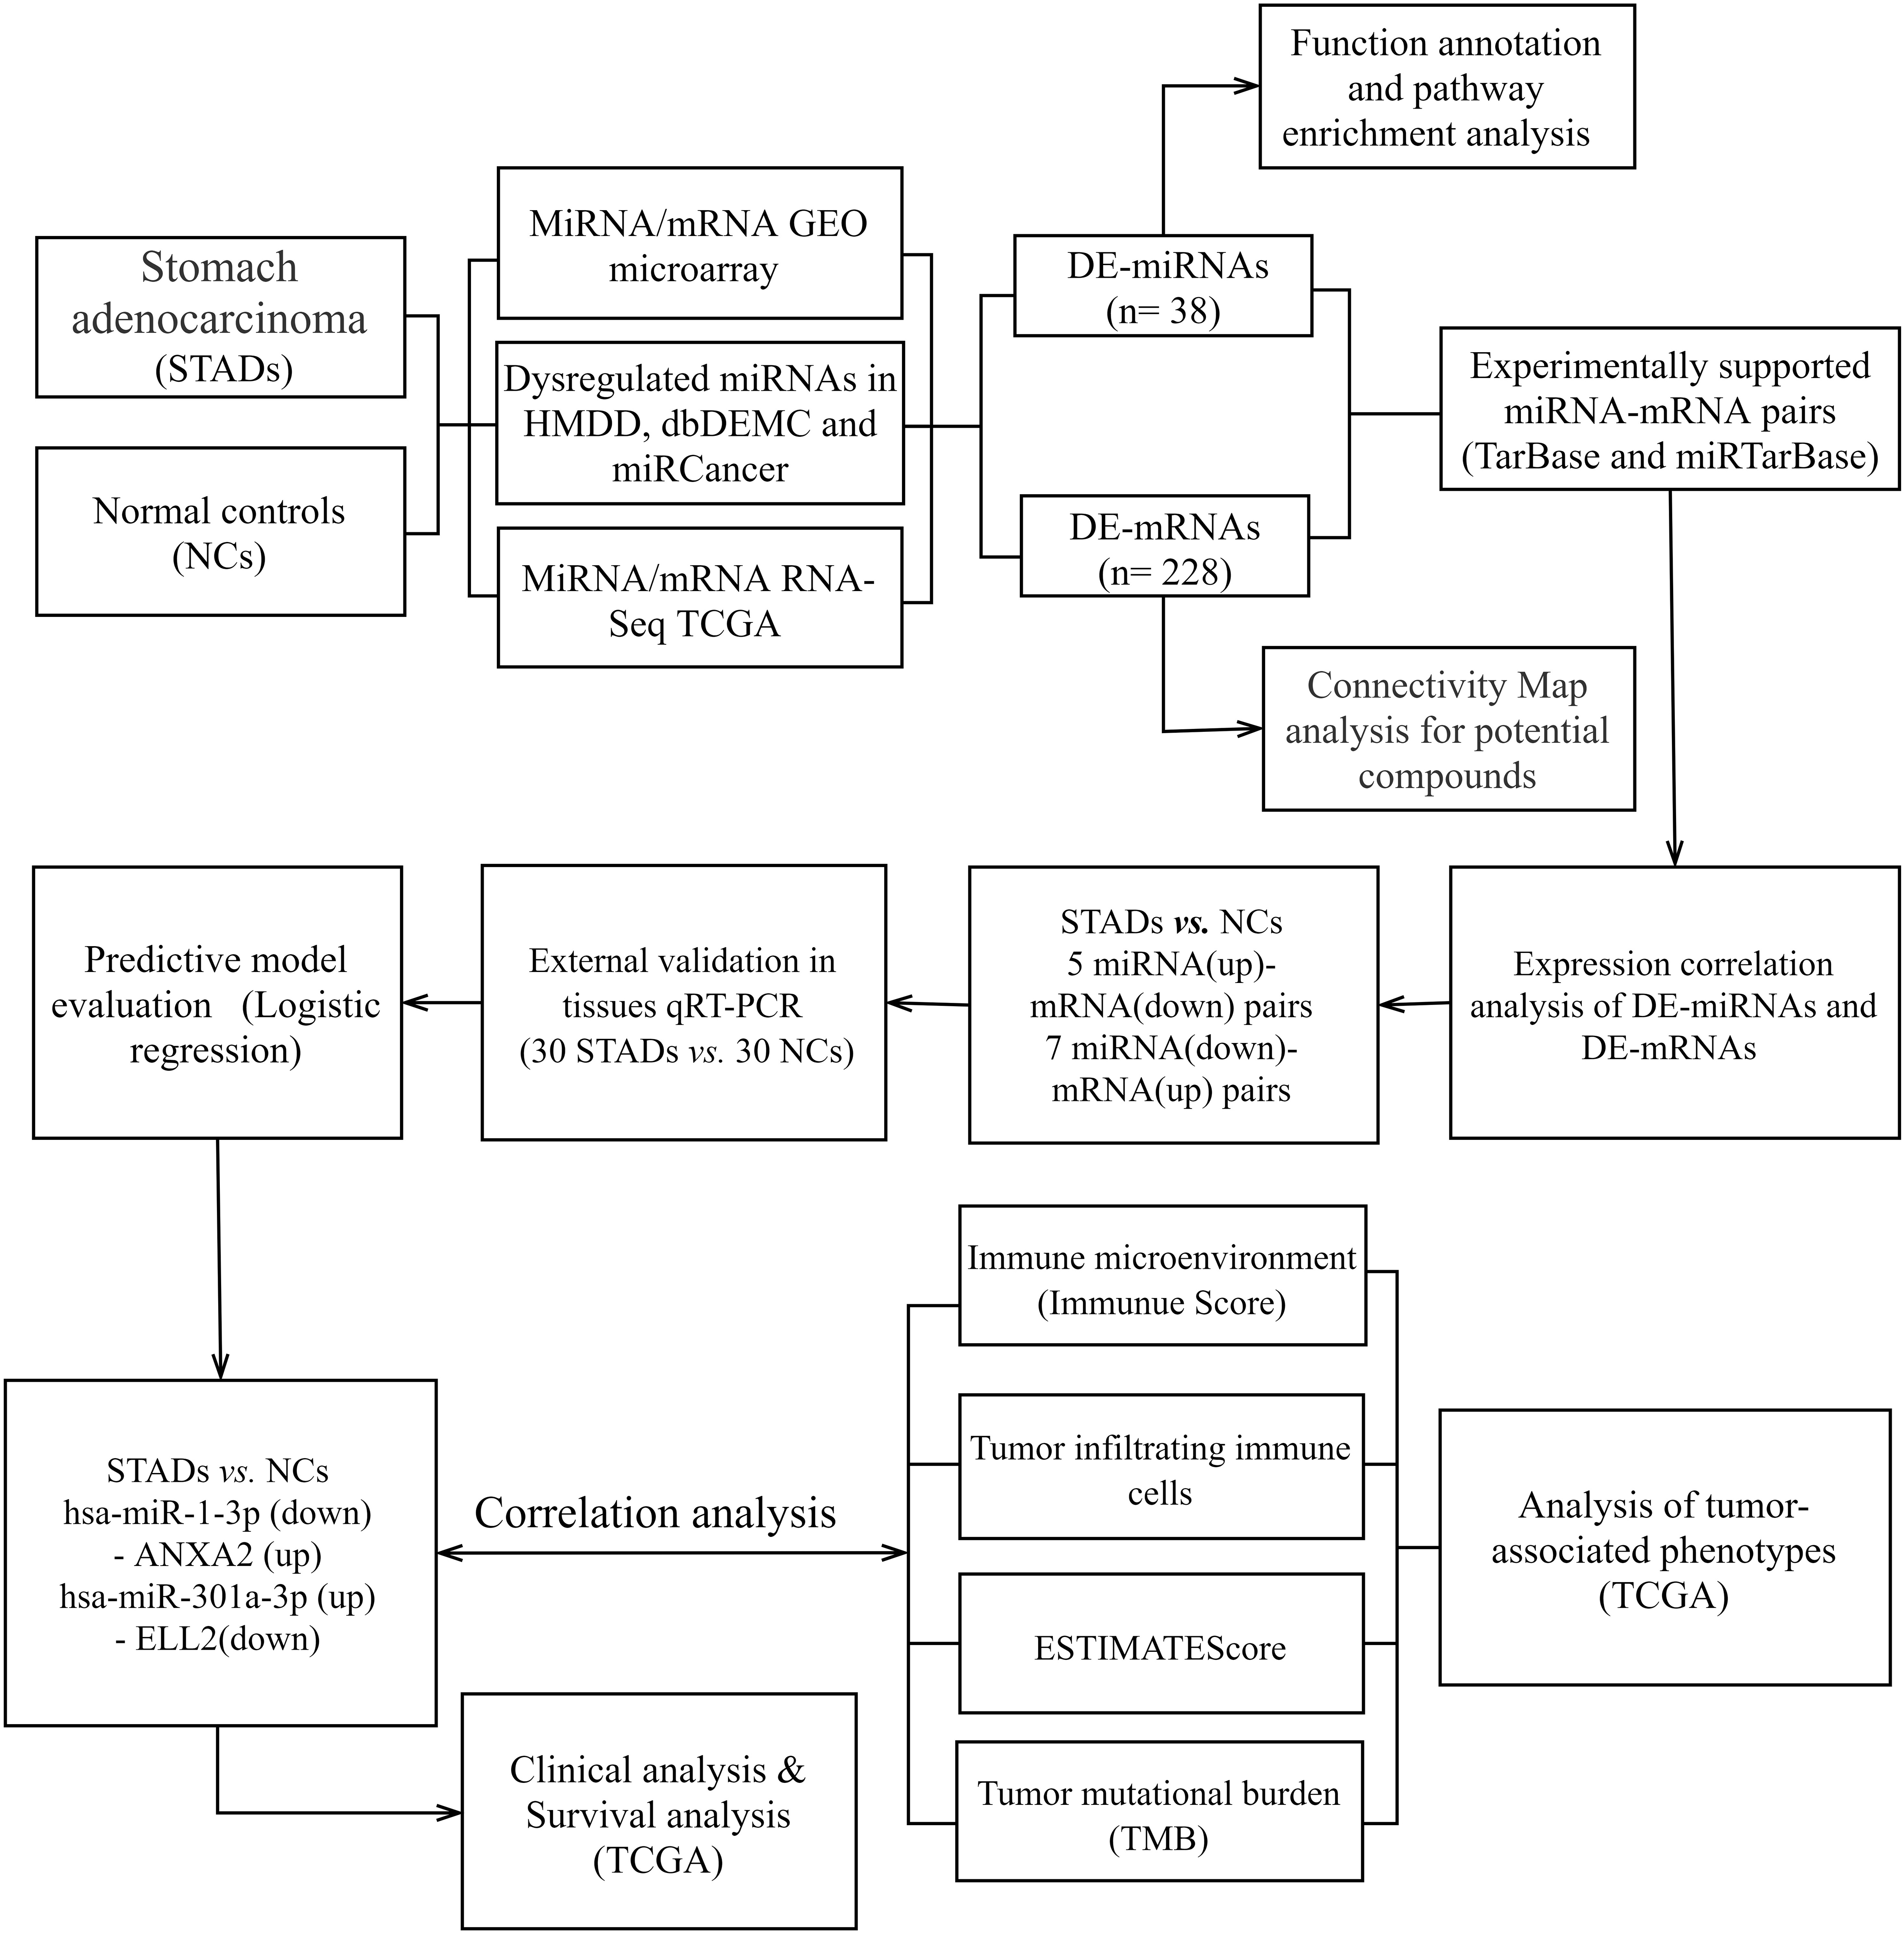
Figure 1.
The Flow chart displayed the procedures of identifying miRNA-mRNA axes and extensive analysis for gastric cancer in this study.
2.Methods
2.1Data collection from GEO and TCGA databases
To acquire candidate miRNA and mRNA datasets, we searched in the Gene Expression Omnibus (GEO) database with ‘(gastric OR stomach) AND (tumor OR cancer OR adenocarcinoma OR carcinoma) NOT (cell line)’ as the key word. Only microarray datasets measuring miRNA or mRNA expression levels in homo sapiens between normal tissue and tumor tissue were included. Under these constrains, totally 23 mRNA datasets and 8 miRNA datasets (GSE26595; GSE23739; GSE28700; GSE63121; GSE77380; GSE2564; GSE93415; GSE54397; GSE103236; GSE118897; GSE130823; GSE13861; GSE13911; GSE19826; GSE2685; GSE26899; GSE27342; GSE29272; GSE29998; GSE33335; GSE33651; GSE49051; GSE51575; GSE55696; GSE56807; GSE63089; GSE65801; GSE66229; GSE78523;GSE79973; GSE96668) listed in Table 1 were introduced for further analysis. RNA-sequencing profile and clinical information of gastric cancer collected in TCGA database were downloaded from the GDC data portal in the National Cancer Institute (https://portal. gdc.cancer.gov/). Besides, the overlapped differently expressed miRNAs involved in public databases including Human MicroRNA Disease Database (HMDD), Database of Differentially Expressed MiRNAs in human Cancers (dbDEMC) and miRCancer were also absorbed. The flowchart of the whole research is exhibited in Fig. 1.
2.2Data processing of RNA expression profile
GEO2R, an R-based online application using the GEOquery and limma R packages, was employed in differential analysis of GEO datasets. We performed Wilcoxon rank-sun test on sequencing data obtained from TCGA database with an R-based package called psych. Fold change (FC) and
2.3Functional enrichment analysis and speculation of agents
Gene oncology (GO) and Kyoto Encyclopedia of Genes and Genomes (KEGG) pathway enrichment analyses of DE-miRNAs were performed by DAVID-mirPath GO/KEGG analysis of DE-mRNAs were conducted on Hiplot (https://hiplot.com.cn) and presented in bubble plot
2.4Predicting target mRNAs of DE-miRNAs
TarBase and MiRTarBase, databases collecting experimentally verified miRNA-mRNA interactions, were applied in assessing target mRNAs. Only miRNA-mRNA axes recorded in both databases were taken into consideration. To make sure that these negatively regulatory relationship between miRNA and mRNA can be observed in gastric tissue, we searched each miRNA-mRNA pair in PubMed. MiRNA-mRNA networks were plotted with Cytoscape v3.8.2.
2.5Sample collection, RNA isolation and reverse transcription quantitative PCR
We collected 30 paired Formalin-Fixed and Paraffin-Embedded (FFPE) samples of STAD tissue and adjacent normal stomach tissue. All patients had their stomach surgery in the First Affiliated Hospital of Nanjing Medical University None of the patients underwent preoperative treatment. Patients with stage IV gastric cancer do not have indications for surgery, so the samples collected in this study did not include stage IV patients. All patients signed written consent after fully understanding this research. This study was approved by the Institutional Review Boards of the First Affiliated Hospital of Nanjing Medical University (ID: 2016-SRFA-148). The clinical features of patients were disclosed in Table 2.
Table 2
Clinicopathological and molecular features of stomach cancer patients
| Stomach cancer ( | Rate (%) | |
|---|---|---|
| Age (year) | ||
| Mean (SD) | 66.37 (10.14) | |
| Median [min, max] | 68 [48, 86] | |
| Gender | ||
| Female | 24 | 80 |
| Male | 6 | 20 |
| Tumor location | ||
| Cardia | 11 | 36.67 |
| Fundus of stomach | 3 | 10 |
| Corpus of stomach | 8 | 26.67 |
| Antrum of stomach | 6 | 20 |
| Pylorus | 2 | 6.67 |
| Grade | ||
| G1 | 1 | 3.33 |
| G2 | 13 | 43.33 |
| G3 | 16 | 53.33 |
| TNM stage | ||
| I | 11 | 36.67 |
| II | 4 | 13.33 |
| III | 15 | 50 |
All stomach FFPE specimen were stored at 20∘C. We isolated total RNA from FFPR stomach samples with RNAprep Pure FFPE Kit (TIANGEN Biotech, Beijing, China, DP439) according to the manual. Poly (A) Polymerase Kit (Takara) was applied in adding a poly (A) tail to each RNA. Reverse transcription was performed with PrimeScript RT reagent Kit (Takara, Tokyo, Japan, RR037A) at 37∘C for 15 minutes, then 85∘C for 5 seconds. Complementary DNA (cDNA) were stored at 4∘C before conducting polymerase chain reaction (PCR). Quantitative PCR was carried out with SYBR Premix Ex Taq II (Takara, Tokyo, Japan, RR820A). We performed qPCR in a volume of 10
Table 3
The sequences of primers for candidate miRNAs and targeted mRNAs
| Name | Forword primer sequences (5’ | Reverse primer sequences (5’ | |
|---|---|---|---|
| mRNA | KIT | CGTTCTGCTCCTACTGCTTCG | CCCACGCGGACTATTAAGTCT |
| LIFR | TGGAACGACAGGGGTTCAGT | GAGTTGTGTTGTGGGTCACTAA | |
| ELL2 | ACGACTCGTATCAGATGACACG | CTTGAGGTGCTTTCCGAATTTG | |
| LDHA | TTGACCTACGTGGCTTGGAAG | GGTAACGGAATCGGGCTGAAT | |
| CKS2 | TTCGACGAACACTACGAGTACC | GGACACCAAGTCTCCTCCAC | |
| COL1A1 | GAGGGCCAAGACGAAGACATC | CAGATCACGTCATCGCACAAC | |
| SERPINH1 | TCAGTGAGCTTCGCTGATGAC | CATGGCGTTGACTAGCAGGG | |
| ANXA2 | TGCCTTCGCCTACCAGAGAA | GCCCAAAATCACCGTCTCC | |
| TGFBI | CTTCGCCCCTAGCAACGAG | TGAGGGTCATGCCGTGTTTC | |
| miRNA | miR-378a-3p | ACTGGACTTGGAGTCAGAA | Universal reverse primer |
| miR-26a-5p | TTCAAGTAATCCAGGATA | Universal reverse primer | |
| miR-143-3p | TGAGATGAAGCACTGTAGCT | Universal reverse primer | |
| miR-29c-3p | TAGCACCATTTGAAATCGGT | Universal reverse primer | |
| miR-1-3p | TGGAATGTAAAGAAGTATGT | Universal reverse primer | |
| miR-30a-5p | TGTAAACATCCTCGACTGGAA | Universal reverse primer | |
| miR-19a-3p | TGTGCAAATCTATGCAAAACT | Universal reverse primer | |
| miR-21-5p | TAGCTTATCAGACTGATGTT | Universal reverse primer | |
| miR-20a-5p | TAAAGTGCTTATAGTGCAGGT | Universal reverse primer | |
| miR-221-3p | AGCTACATTGTCTGCTGGGTTT | Universal reverse primer | |
| miR-301a-3p | CAGTGCAATAGTATTGTCAAA | Universal reverse primer | |
| Reference mRNA | GAPDH | GGAGCGAGATCCCTCCAAAAT | GGCTGTTGTCATACTTCTCATGG |
| 18sRNA | CGCAGCTAGGAATAATGGAATAGG | GCCTCAGTTCCGAAAACCAA | |
| U6 | CGATAAAATTGGAACGATACAGA | ATTTGGACCATTTCTCGATTTGT |
Figure 2.
TarBase and MiRTarBase screened totally 18 negatively regulated miRNA-mRNA axes between 38 DE-miRNAs and 228 DE-mRNAs, which were plotted via Cytoscape. Orange nodes represent the upregulated miRNAs/mRNAs in STADs versus NCs, while blue nodes represent the downregulated miRNAs/mRNAs in STADs versus NCs.
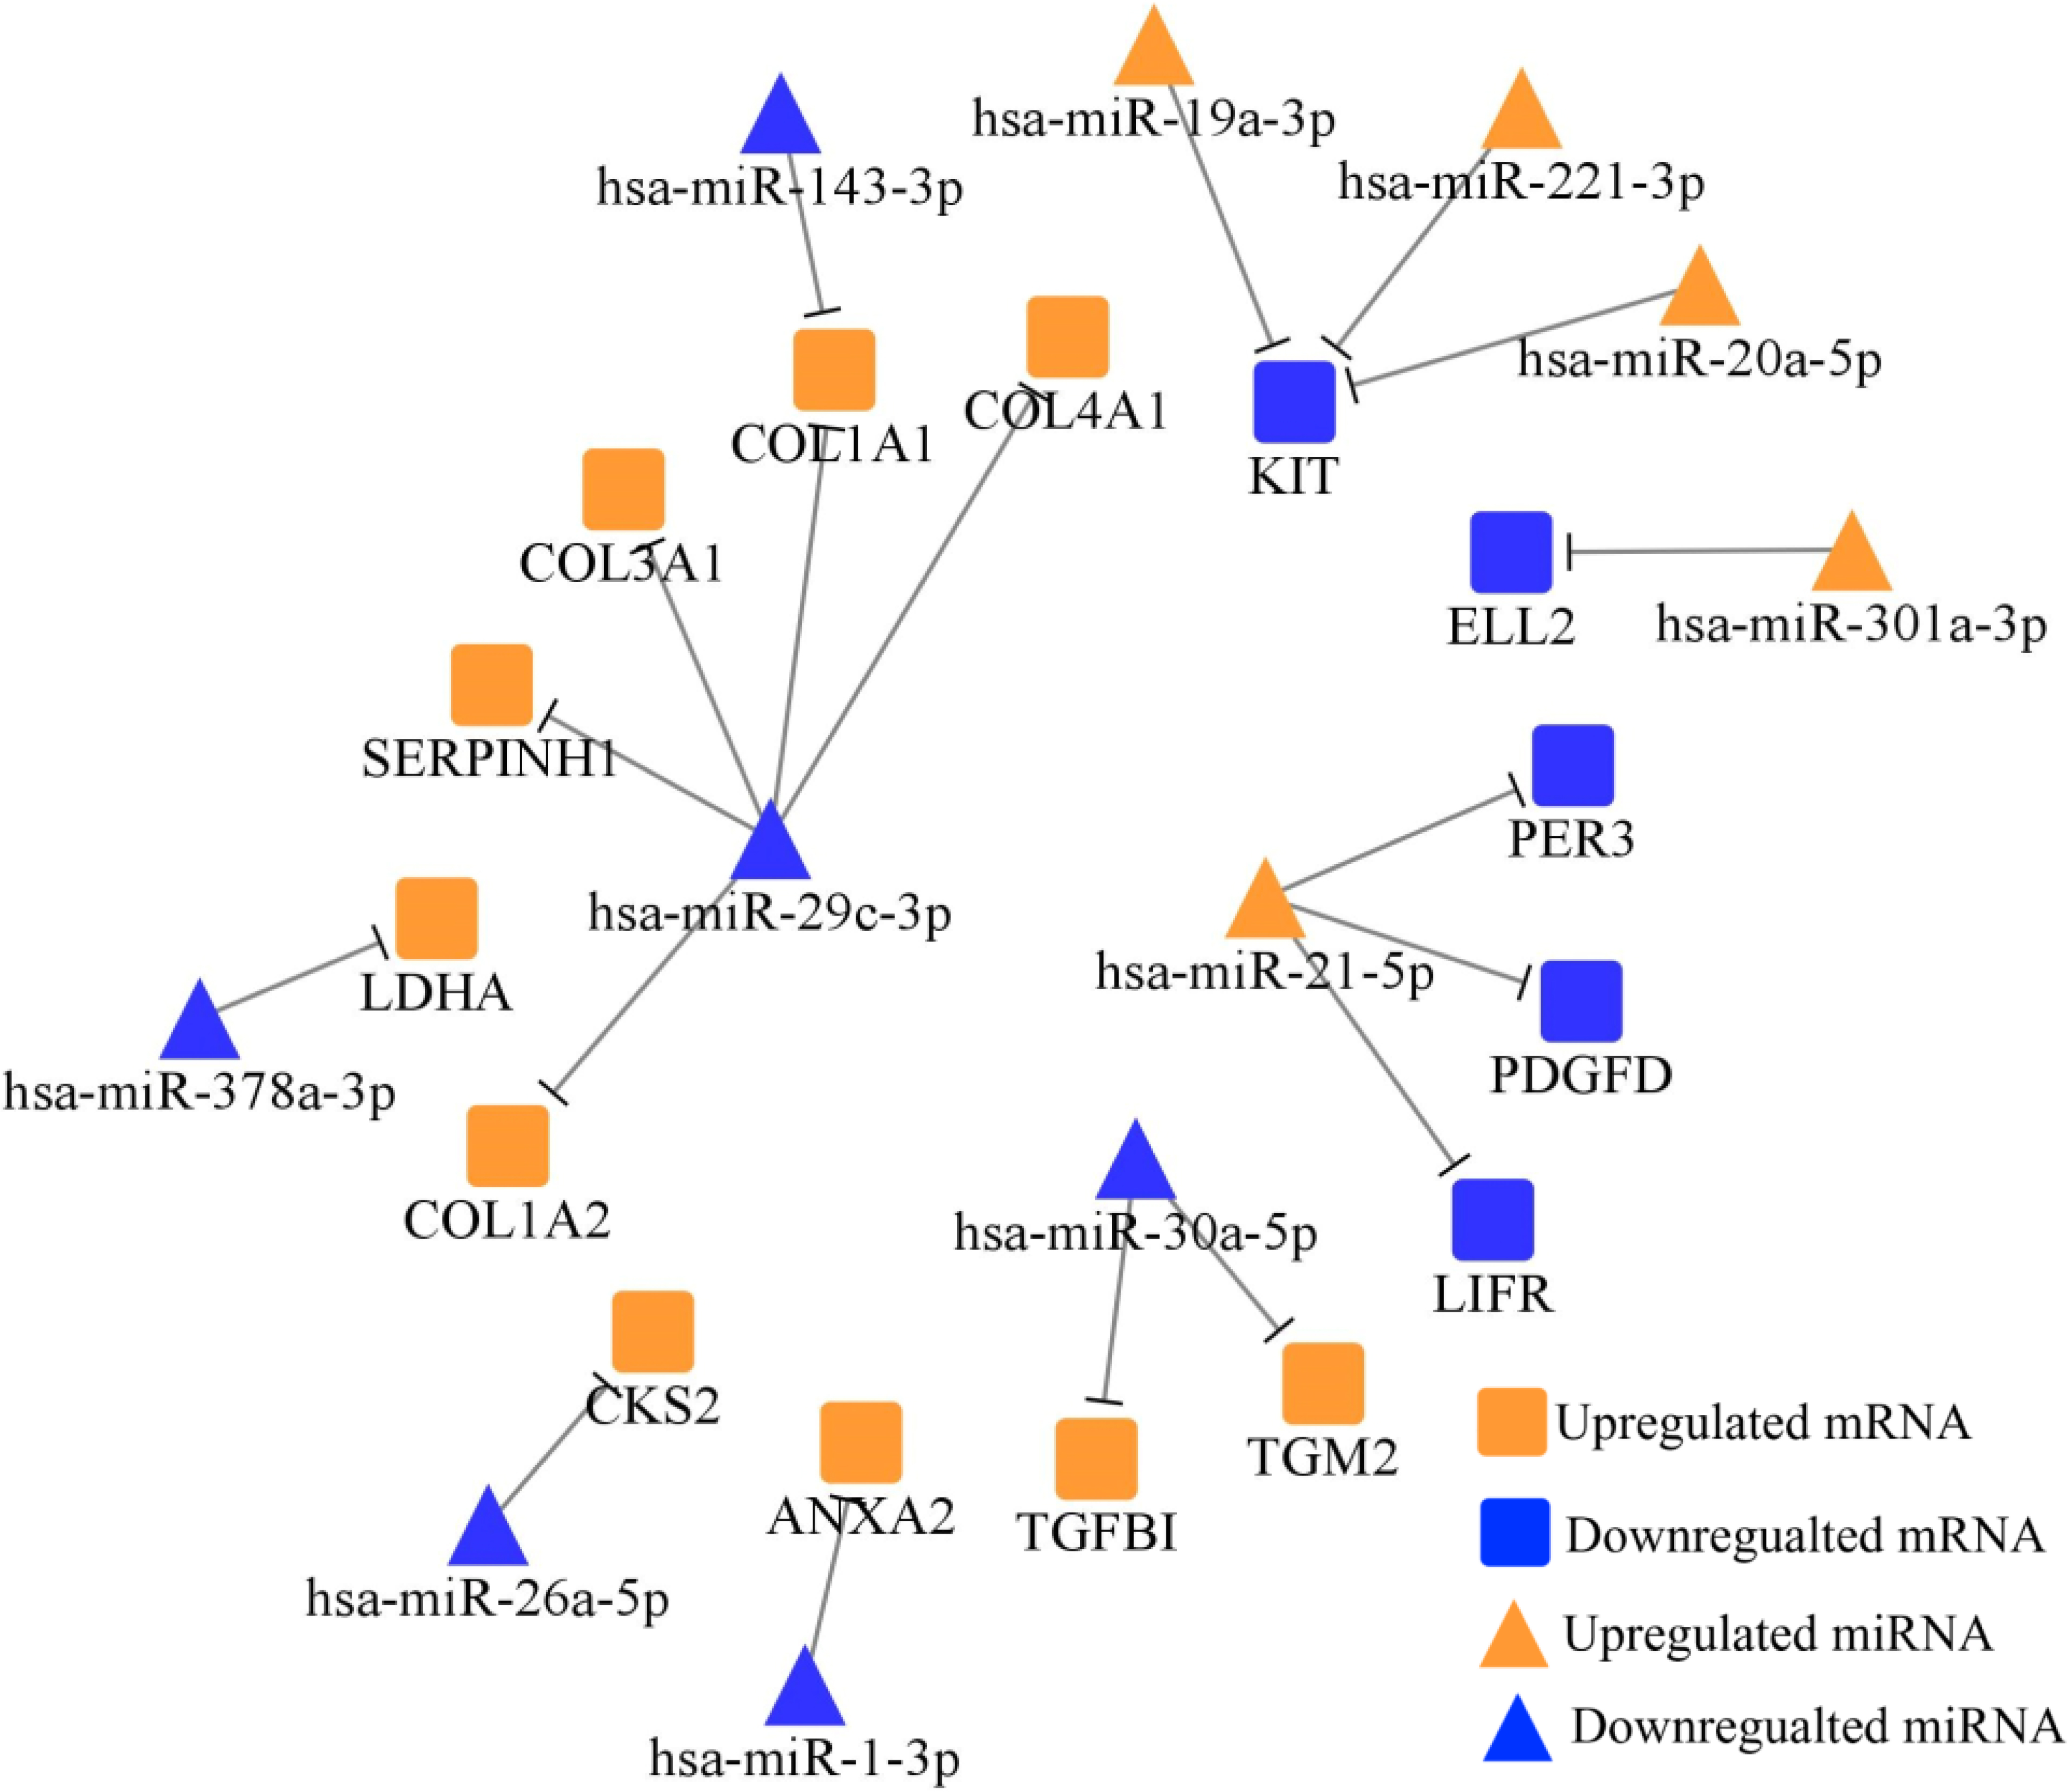
Table 4
Pearson’s correlation analysis of miRNA-mRNA pairs in paired FFPE STAD samples
| miRNA (up) | FC (2-ΔΔCT) | mRNA (down) | FC (2-ΔΔCT) | Spearman’s correlation | |||
| hsa-miR-21-5p | 5.2087 | LIFR | 0.0007 | 0.615 | 0.1060 | 0.2107 | |
| hsa-miR-19a-3p | 0.0691 | 3.4478 | KIT | 0.6152 | 0.4354 | ||
| hsa-miR-20a-5p | 0.0175 | 3.5172 | KIT | 0.6152 | 0.2331 | ||
| hsa-miR-221-3p | 0.0467 | 2.751 | KIT | 0.6152 | 0.2619 | ||
| hsa-miR-301a-3p | 0.0324 | 3.603 | ELL2 | 0.0004 | 0.7291 | 0.0120 | |
| miRNA (down) | mRNA (up) | ||||||
| hsa-miR-378a-3p | 0.5838 | 1.4801 | LDHA | 0.2037 | 1.804 | 0.5924 | 0.0705 |
| hsa-miR-26a-5p | 0.0005 | 0.5768 | CKS2 | 0.3061 | 1.7258 | 0.6633 | |
| hsa-miR-143-3p | 0.0629 | 1.6175 | COL1A1 | 0.5208 | 1.5572 | 0.5153 | 0.0856 |
| hsa-miR-29c-3p | 0.029 | 0.7771 | COL1A1 | 0.5208 | 1.5572 | 0.5526 | 0.0782 |
| hsa-miR-29c-3p | 0.029 | 0.7771 | SERPINH1 | 0.1386 | 4.1756 | 0.0055 | 0.3962 |
| hsa-miR-1-3p | 0.0137 | 0.7874 | ANXA2 | 0.0002 | 1.6947 | ||
| hsa-miR-30a-5p | 0.9311 | 1.1117 | TGFBI | 0.7611 | 1.4706 | 0.6036 | |
Figure 3.
(A) The expression levels of KIT, LIFR, and ELL2 declined in STAD tissues. ANXA2 was overexpressed in tumor samples. (B) The miRNA expression level of miR-21-5p, miR-20a-5p, miR-221-3p, and miR-301a-3p were increased in STAD specimen. MiR-26a-5p, miR-29c-3p, and miR-1-3p were down regulated in STAD tissues. Data were presented as mean
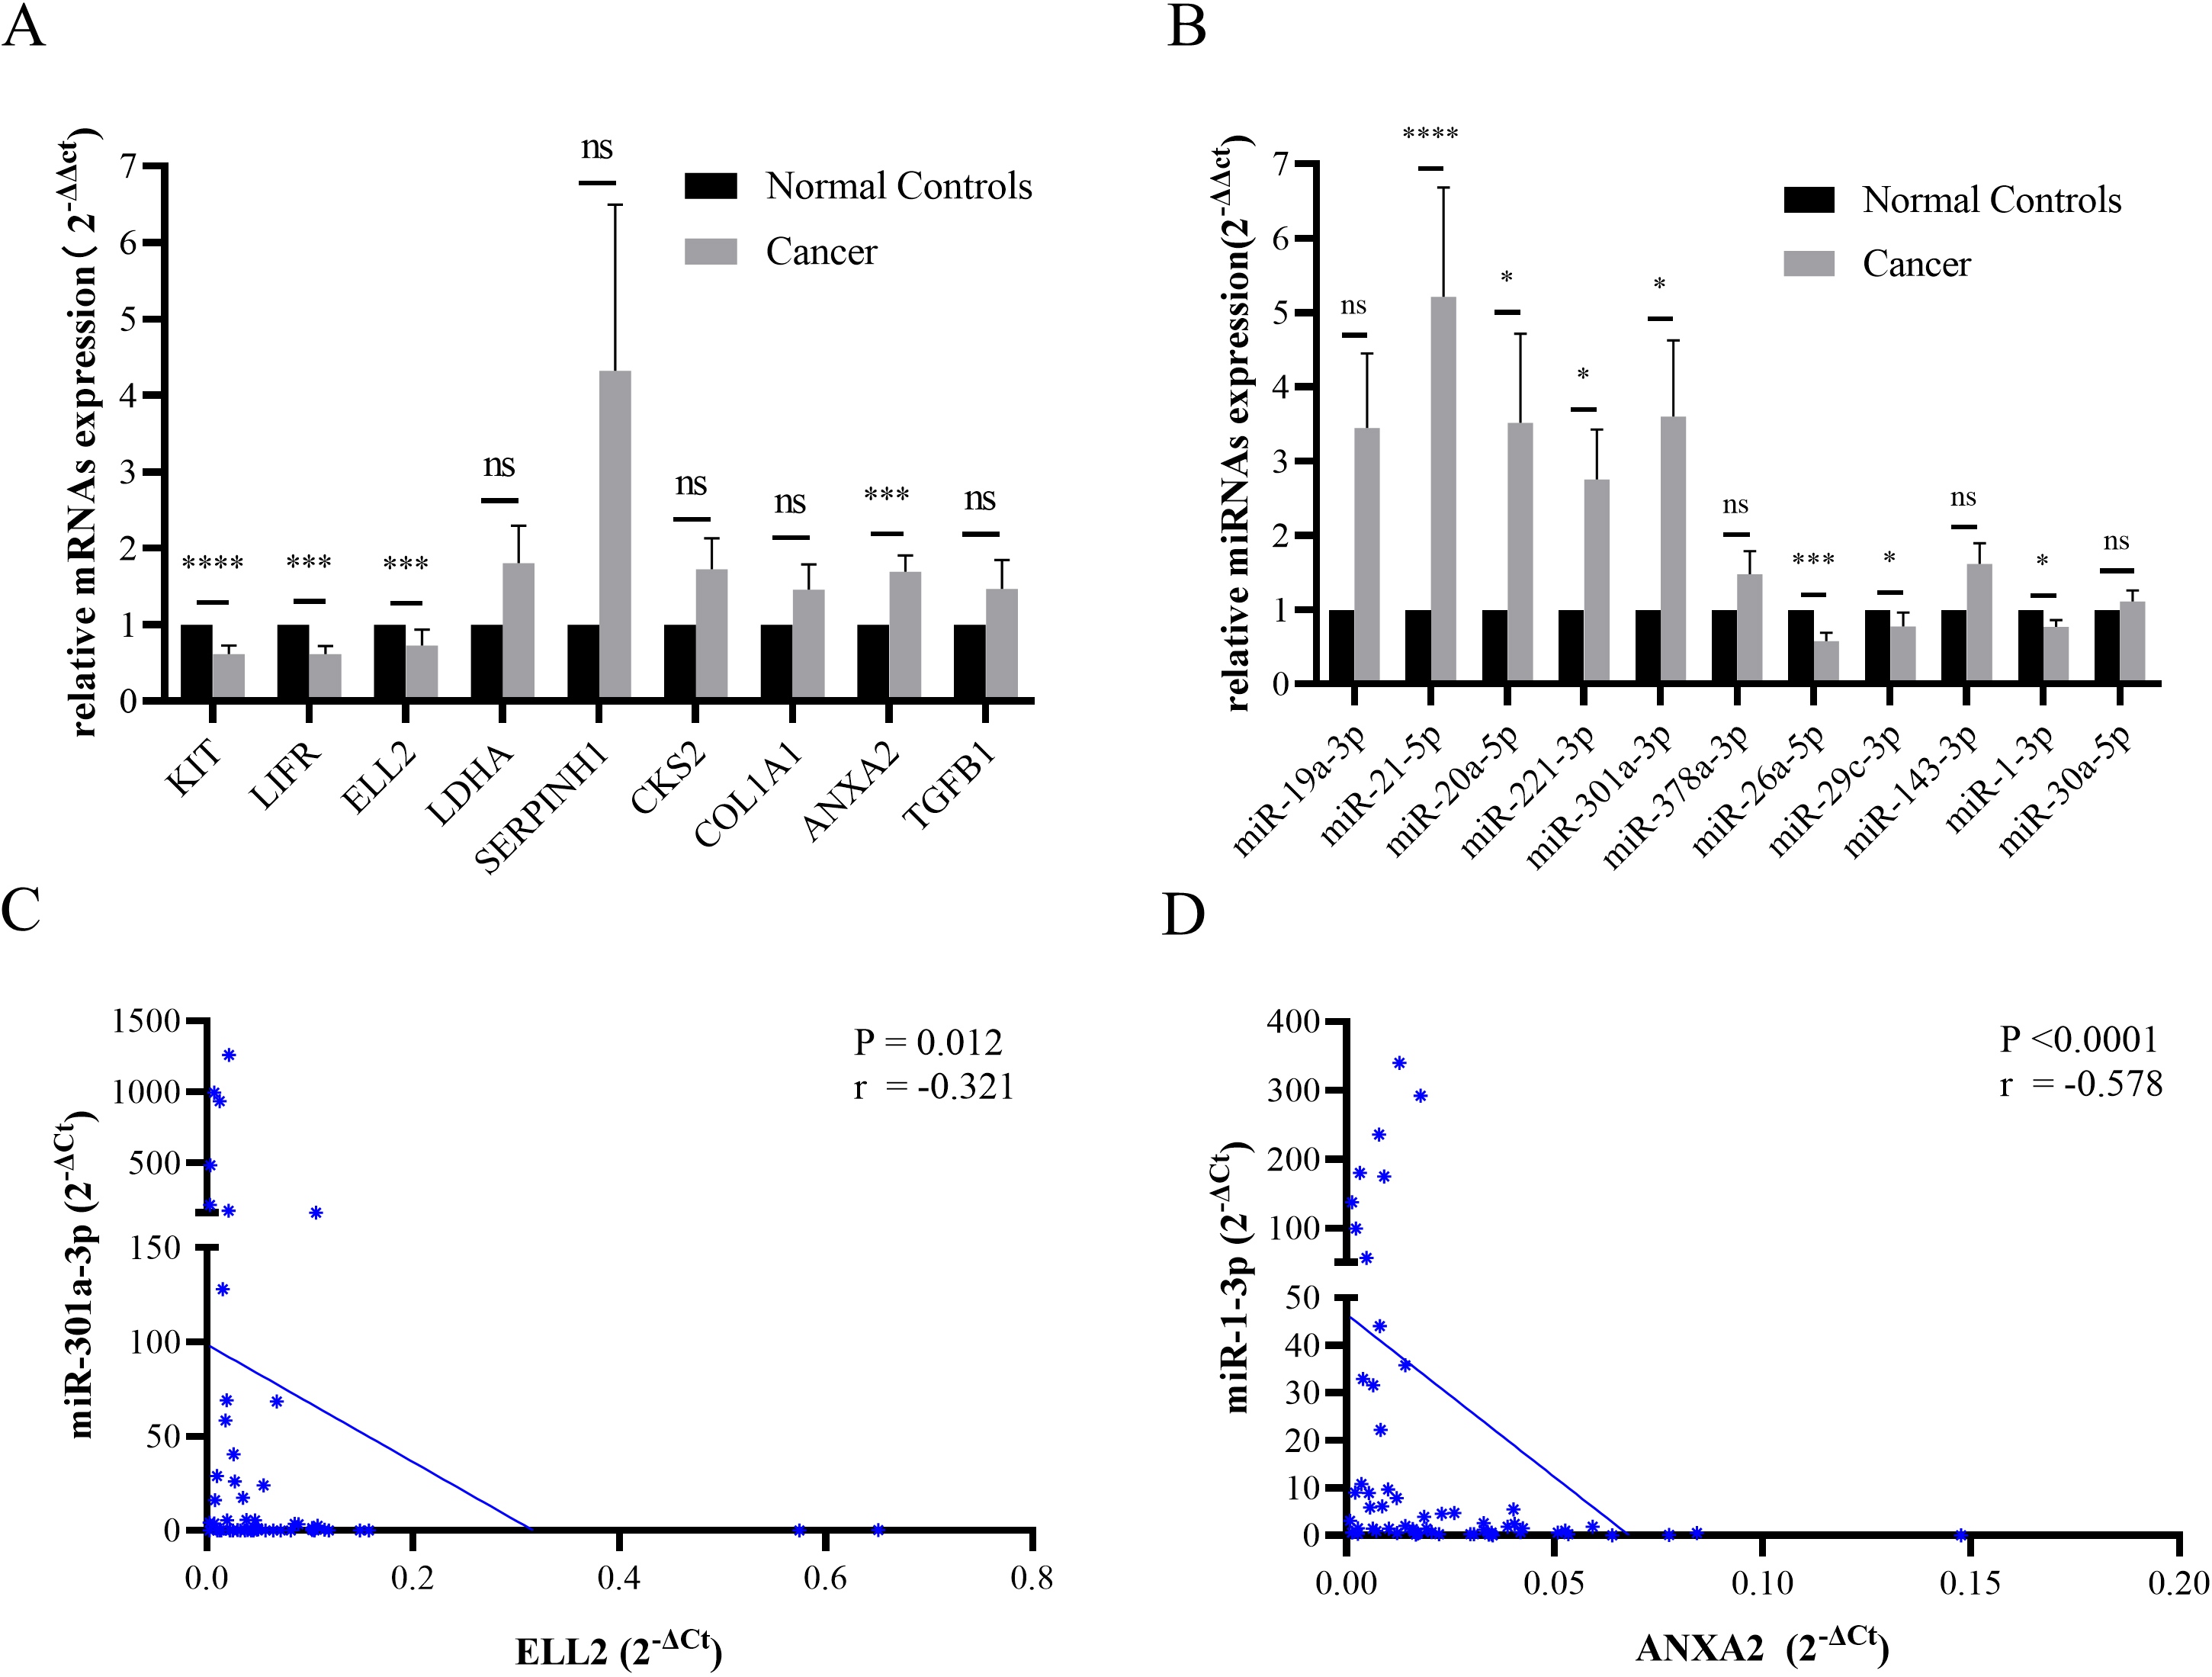
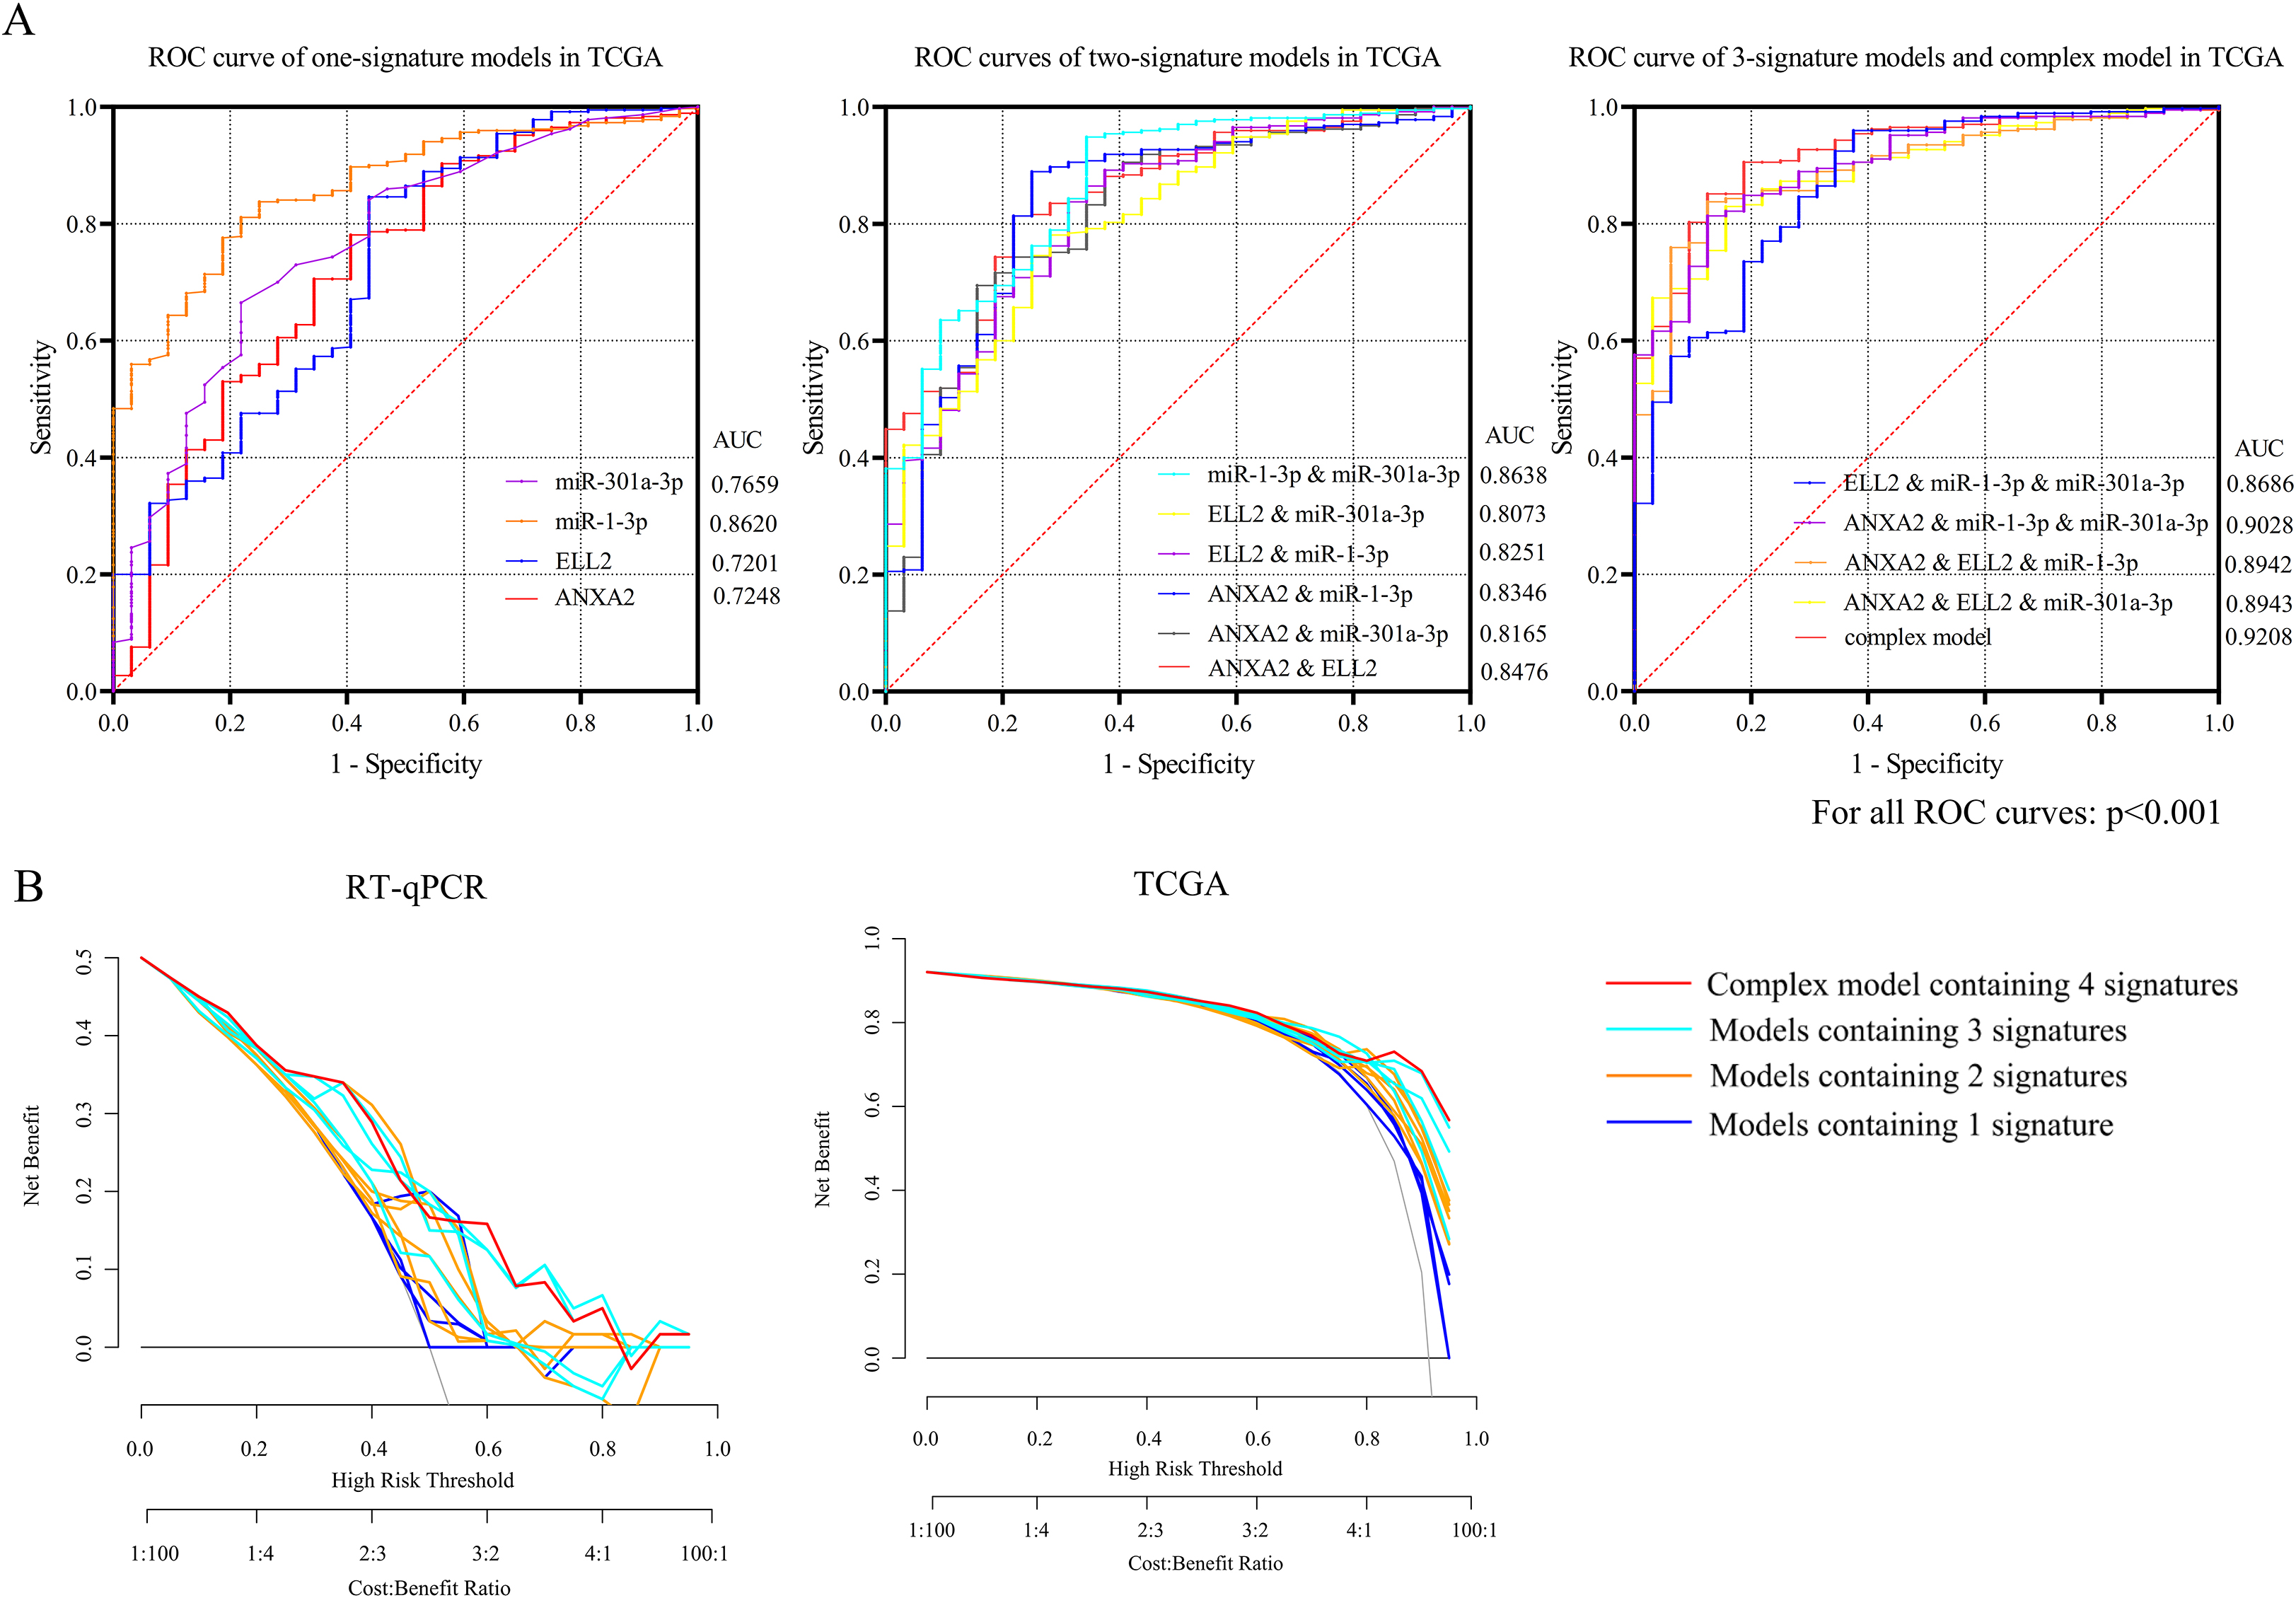
Figure 4.
Receiver operating characteristic (ROC) curves of TCGA database and internal validation were separately presented in Fig. 4A and B. (A) The AUC of the complex model containing both miR-1-3p/ANXA2 and miR-301a-3p/ELL2 axes were 0.9208, the maximum among all 15 diagnosis models. (B) DCA presented great diagnostic performance of miRNA-mRNA axes in TCGA database and internal validation.
2.6Diagnostic efficiency assessment of MiRNA-mRNA axes and Survival analysis for STAD
We conducted binary logistic regression on miRNA and mRNA expression data with SPSS Statistics 26.0 (IBM, New York, USA). The receiver operation characteristic (ROC) curve and Decision Curve Analysis (DCA) were performed for comparing diagnostic efficiency between multiple models. ROC curves were plotted with data downloaded from TCGA database. According to survival data downloaded from TCGA database, we drew Kaplan-Meier survival curve with Hiplot. The average follow-up time was 577 days (1.58 years) with the maximal follow-up time equal to 3720 days (10.19 years). The medium divided all patients into low expression group and high expression group.
2.7Clinical subgroup analysis for STAD
Clinical information of stomach adenocarcinoma patients was downloaded from GDC data portal. According to their age (at first diagnosis), gender, tumor grade and tumor stage, cases were divided into several subgroups. Expression levels of miRNA-mRNA axes were compared between these subgroups by Wilcoxon rank-sum test.
2.8Correlation analysis between miRNA-mRNA axes and tumor phenotypes
Wilcoxon Rank-sum test was applied in comparing the percentage of 22 immune cells between tumor samples and normal samples according to CIBERSORT (https://cibersort.stanford.edu/index.php/). Correlation analysis between proportion of discrepant immune cells and miRNA/mRNA expression level was exhibited in correlation heatmap plotted by Hiplot with Spearman’s correlation. ESTIMATE provided the Stromal Score, immune Score, estimate Score and tumor purity with mRNA expression signatures recorded in TCGA database. Tumor mutational burden (TMB) was measured by Masked Somatic Mutation data obtained with the ‘maftools’, an R-based package. We carried out Spearman’s correlation analysis between miRNA-mRNA axes and the tumor features mentioned above.
2.9Statistically analysis
MiRNA and mRNA expression data obtained from RT-qPCR was managed with 2 - ΔΔCT method (
3.Results
3.1Screening DE-miRNAs and DE-mRNAs in TCGA and GEO for STAD
Differential analysis of TCGA database provided basic DE-mRNAs and DE-miRNAs for STAD. As is presented in Table 1, a total of 23 mRNA GEO datasets and 8 miRNA GEO datasets met our inclusion criterion. Table 1 displayed the GEO accession, number of samples, researchers’ nationality, platform, and PMID of these datasets. 105 upregulated mRNAs and 123 downregulated mRNAs showed statistical significance in after calculating with GEO2R. Compared with miRNA expression profile of normal tissue, 22 upregulated and 16 downregulated miRNAs were considered significant. Combining with dbDEMC, HMDD and miRCancer, 22 upregulated and 16 downregulated miRNAs were selected ultimately.
3.2GO/KEGG analysis and potential compounds prediction
Outcome of function annotation and pathway enrichment analysis based on DE-mRNAs were presented in Fig. S1A and S1B. Mitotic cell cycle phase transition, extracellular matrix structural constituent and collagen-containing extracellular matrix were the GO terms of upregulated mRNAs with the most counts. Muscle system process and oxidoreductase activity acting on CH-OH group of donors were the most notable GO term of downregulated mRNAs. KEGG enrichment analysis suggested human papillomavirus infection crucial for upregulated mRNAs and gastric acid secretion remarkable for down regulated mRNAs. Outcomes of GO/KEGG analysis based on downregulated and upregulated miRNAs were separately revealed in Fig. S1C and S1D. Cellular amino acid metabolic process and transcription coactivator activity had smallest
Following the DE-mRNAs signature query, small molecule agents including ixazomib, gemcitabine and tipifarnib were determined as potential therapeutic. The 15 compounds with the smallest connectivity scores were displayed in Fig. S2A. Agents’ mechanism of actions and their relative gene counts were exhibited in Fig. S2B.
Figure 5.
Patients were divided into different groups according to their clinical features, such as gender, age, tumor grade, and tumor stage. Subgroup analysis based on TCGA database suggested that ANXA2 expression was differed between patients older than 65 year and patients younger than 65. ELL2 was overexpressed in tissue with higher grade and stage.
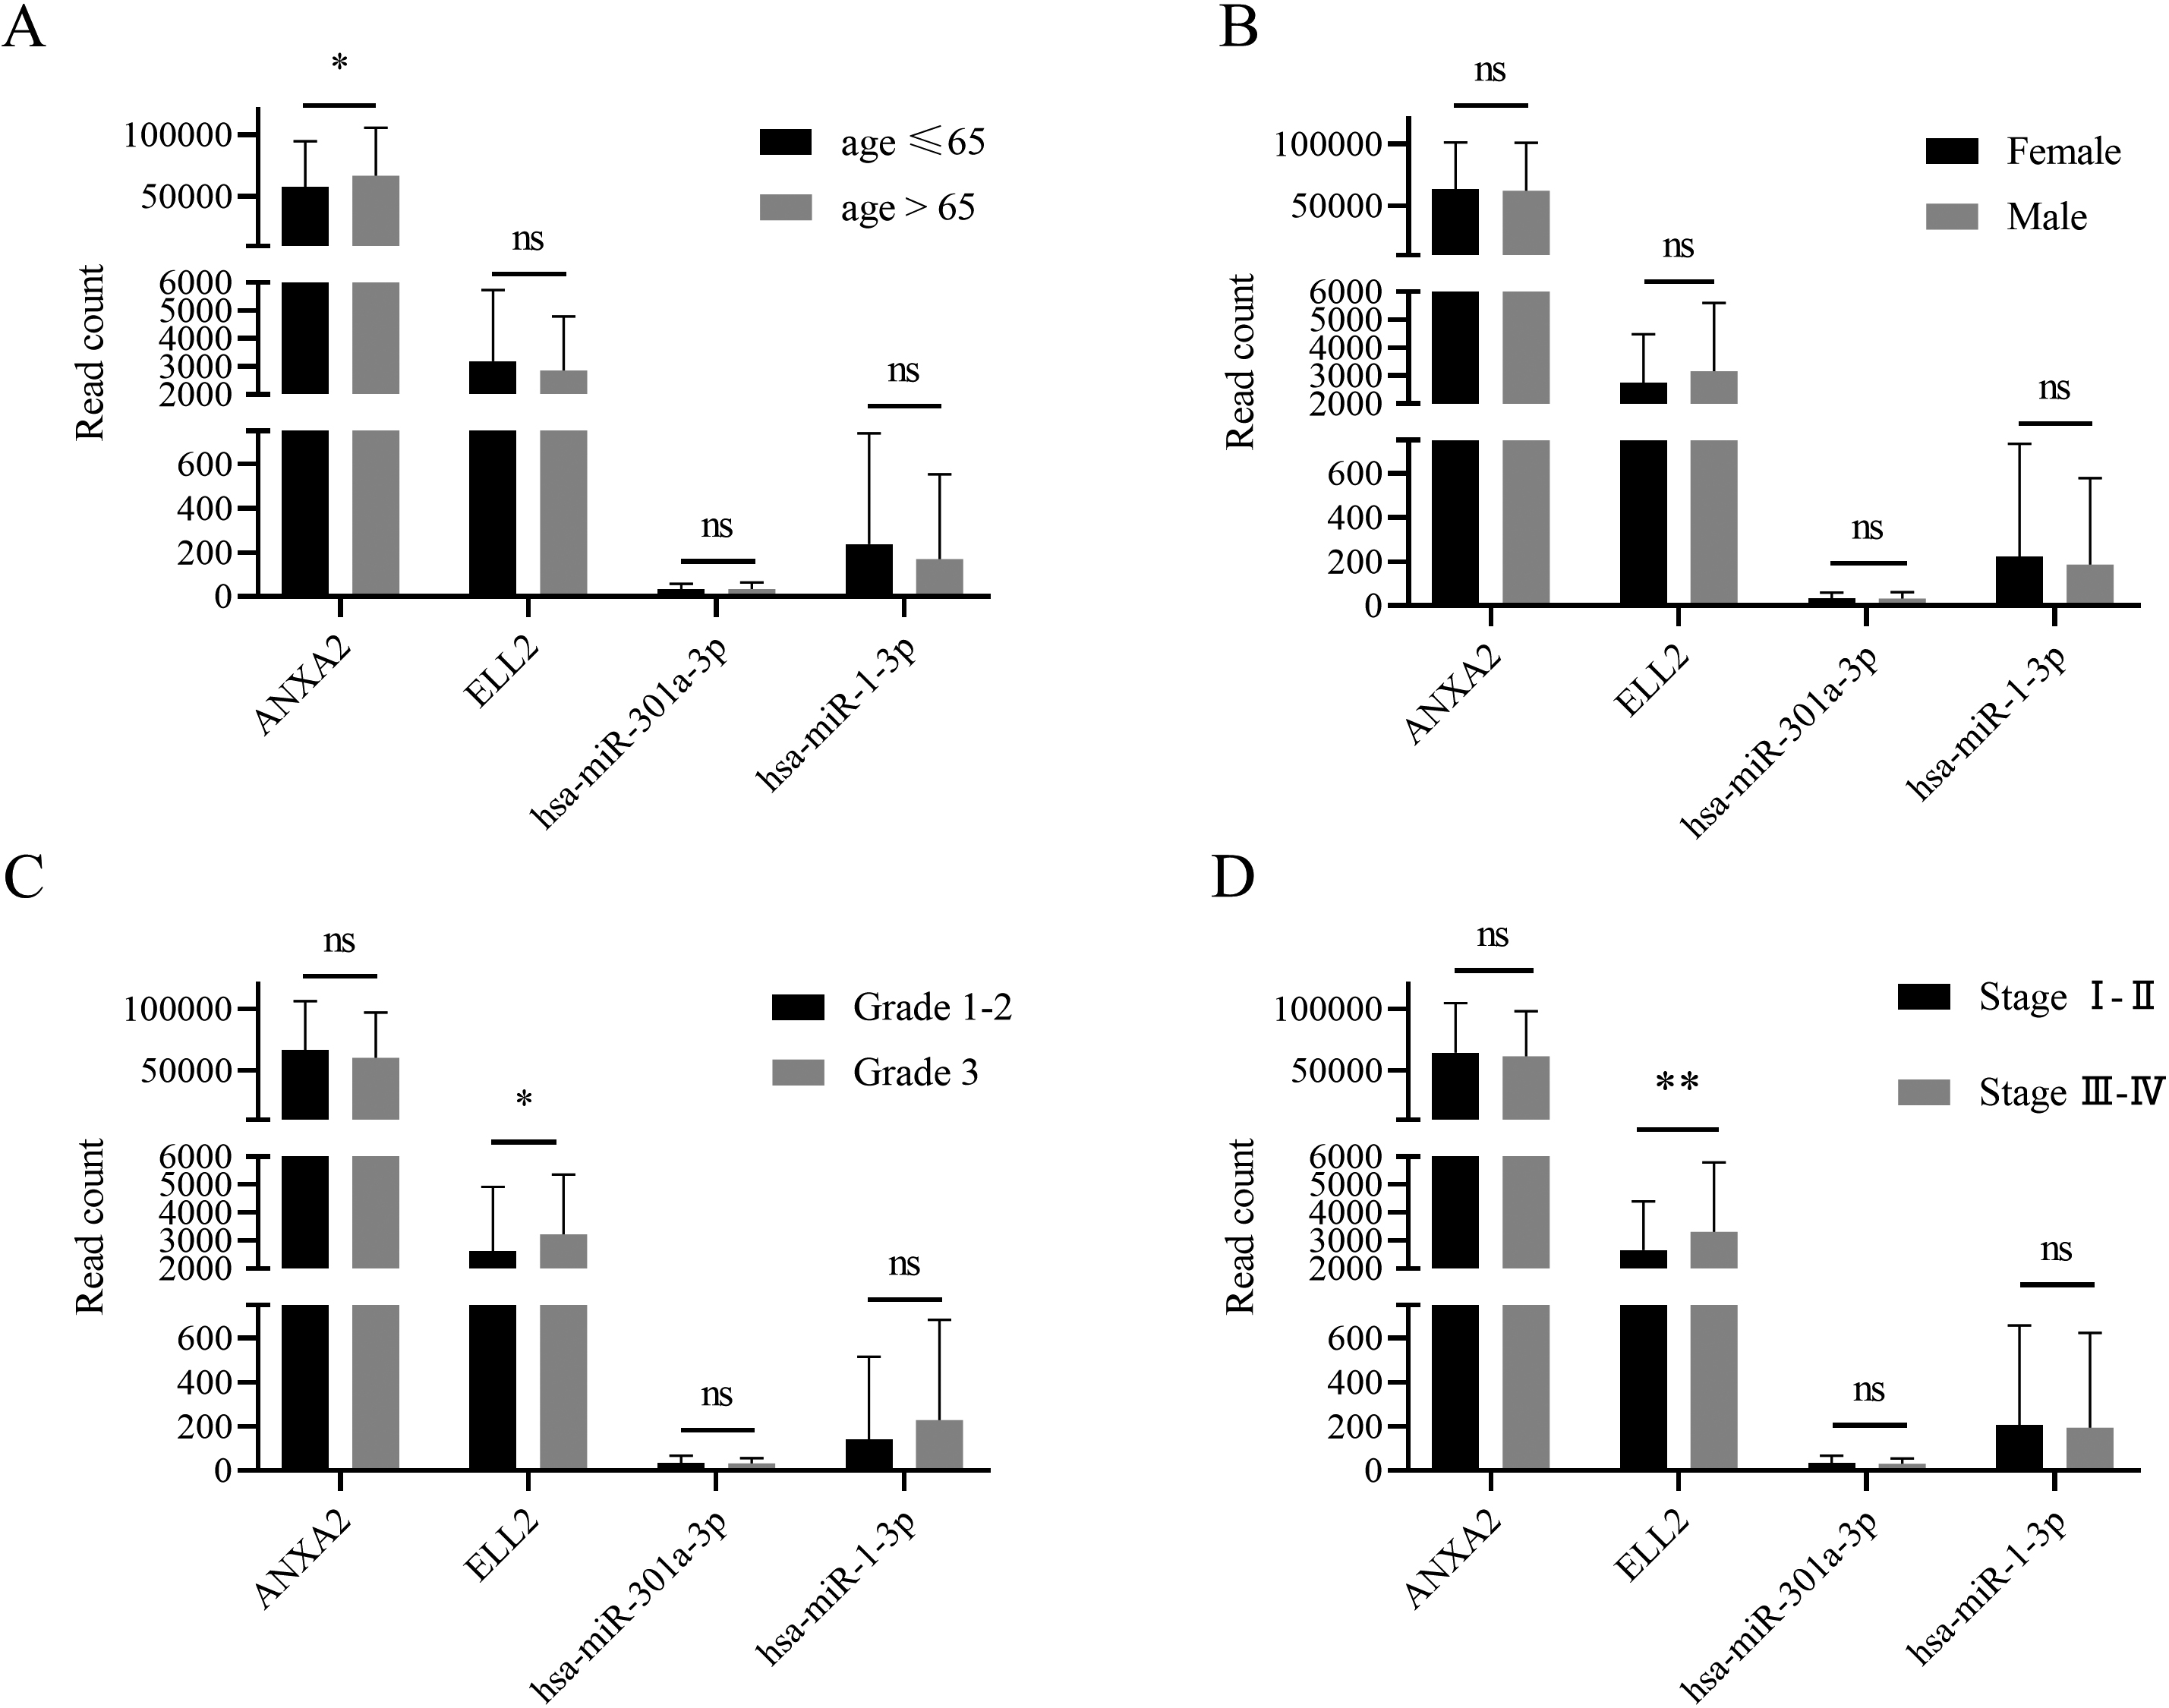
Table 5
Infiltration of 22 types of immune cells in STAD versus controls
| ID of immune cells | Proportion in STAD | Proportion in normal | FC | |
|---|---|---|---|---|
| B cells naive | 0.0544 | 0.0471 | 0.5404 | 1.1548 |
| B cells memory | 0.0127 | 0.0143 | 0.7623 | 0.8881 |
| Plasma cells | 0.0504 | 0.1751 | 0.0000 | 0.2879 |
| T cells CD8 | 0.1069 | 0.1086 | 0.4816 | 0.9838 |
| T cells CD4 naive | 0.0003 | 0.0001 | 0.7772 | 2.5264 |
| T cells CD4 memory resting | 0.1917 | 0.2232 | 0.0962 | 0.8589 |
| T cells CD4 memory activated | 0.0404 | 0.0086 | 0.0001 | 4.7134 |
| T cells follicular helper | 0.0243 | 0.0115 | 0.0009 | 2.1160 |
| T cells regulatory (Tregs) | 0.0626 | 0.0365 | 0.0001 | 1.7167 |
| T cells gamma delta | 0.0027 | 0.0022 | 0.6904 | 1.2177 |
| NK cells resting | 0.0143 | 0.0067 | 0.1761 | 2.1243 |
| NK cells activated | 0.0213 | 0.0259 | 0.1271 | 0.8252 |
| Monocytes | 0.0063 | 0.0222 | 0.2819 | |
| Macrophages M0 | 0.1273 | 0.0078 | 16.3585 | |
| Macrophages M1 | 0.0675 | 0.0223 | 3.0288 | |
| Macrophages M2 | 0.1121 | 0.1233 | 0.5083 | 0.9097 |
| Dendritic cells resting | 0.0194 | 0.0338 | 0.2537 | 0.5741 |
| Dendritic cells activated | 0.0127 | 0.0079 | 0.8009 | 1.5948 |
| Mast cells resting | 0.0303 | 0.0978 | 0.3099 | |
| Mast cells activated | 0.0252 | 0.0076 | 0.2094 | 3.3190 |
| Eosinophils | 0.0038 | 0.0033 | 0.2587 | 1.1643 |
| Neutrophils | 0.0156 | 0.0165 | 0.0737 | 0.9488 |
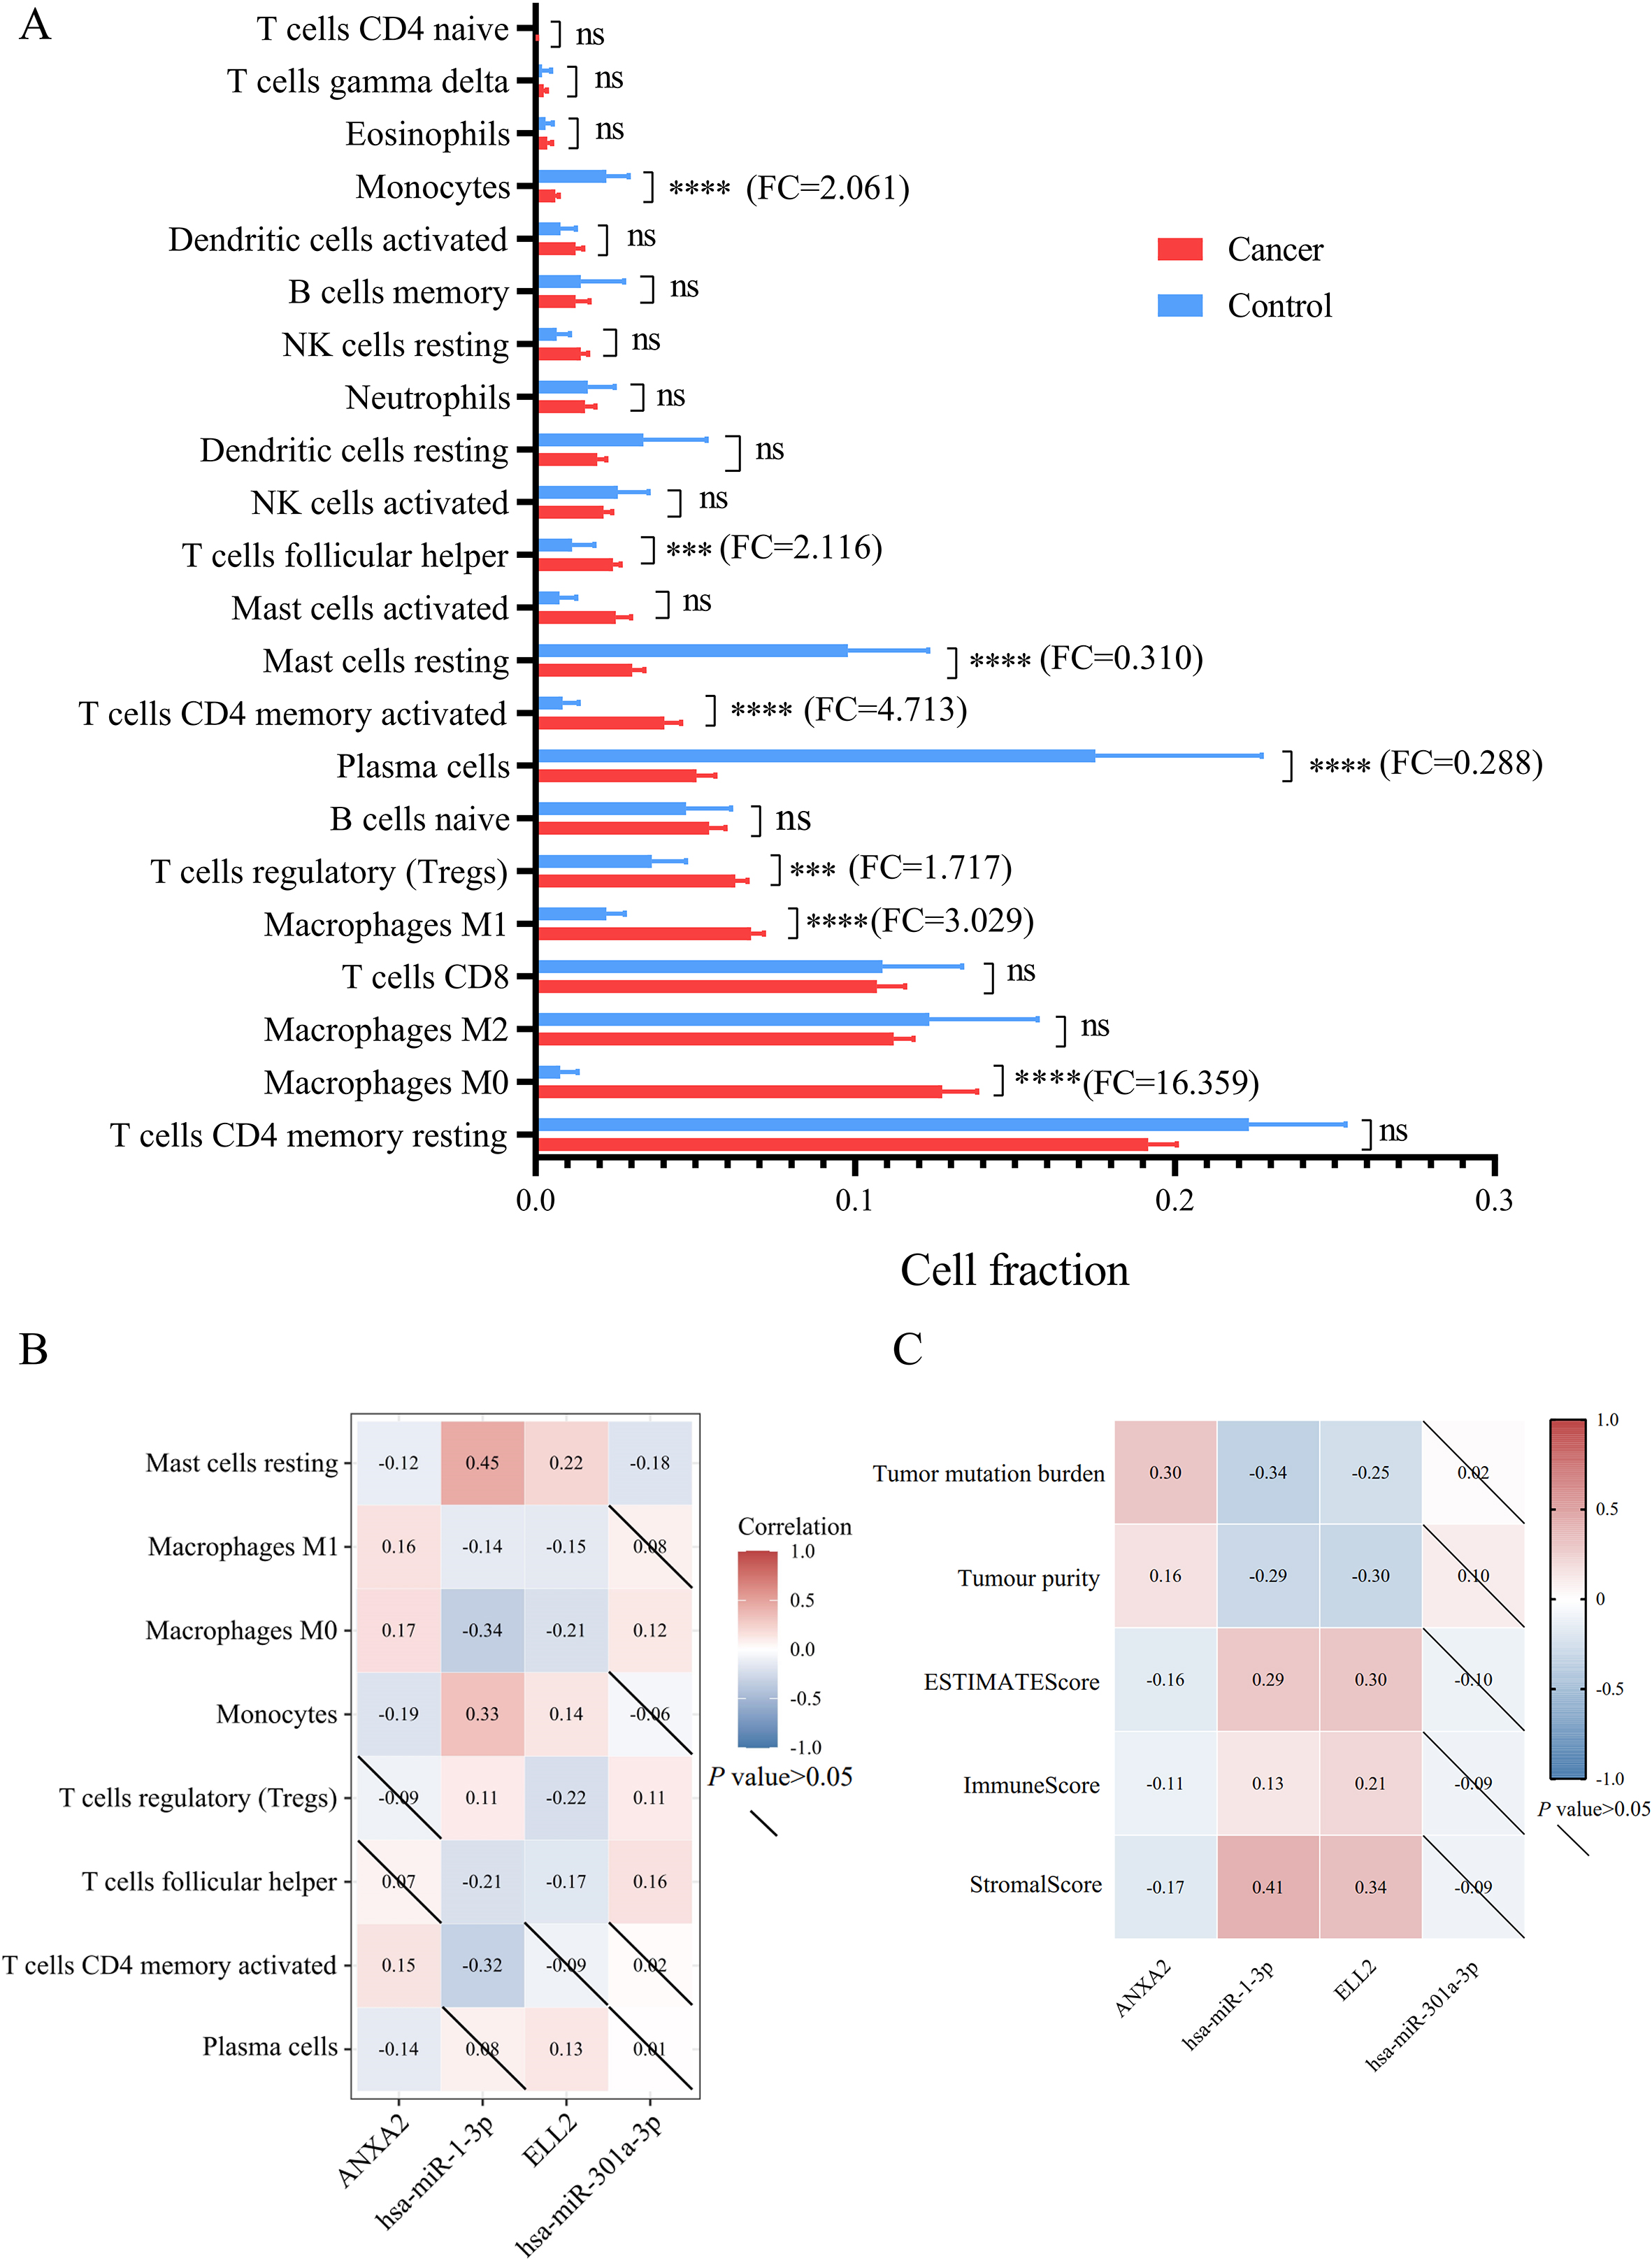
Figure 6.
(A) This bar plot exhibited cell fraction of 22 immune cells in STAD versus normal tissue. (B) The relationship between differently infiltrated 8 immune cells and miRNA/mRNA axes was analyzed by Spearman’s correlation. (C) The association between expression levels of miRNA/mRNA axes and tumor microenvironment features including tumor mutation burden, tumor purity, ESTIMATE score, immune score and stromal score.
3.3Identification of miRNA-mRNA networks for STAD
To predict the role of DE-miRNAs in STAD, we collected their potential target mRNAs from TarBase and MiRTarBase. Figure 2 showed the miRNA-mRNA network. After searching in PubMed, totally 12 miRNA-mRNA axes were tested in gastric FFPE tissue via RT-qPCR.
3.4Corroboration of the DE-mRNAs and DE-miRNAs with RT-qPCR
Specific fold change and
3.5Evaluating the diagnosis value of miRNA-mRNA axes in STAD
None of the GEO datasets contained both miRNA and mRNA expression profile of the same specimen. As a result, only expression patterns gained from TCGA data and RT-qPCR were applied in measuring predictive value. MiR-1-3p, ANXA2, MiR-301a-3p and ELL2 were combined as a panel with binary logistic regression ROC curves of 14 models and the AUC of each curve calculated with TCGA data were presented in Fig. 4A. The panel containing 4 signatures showed the best diagnosis value (AUC
3.6Clinical subgroup analysis and survival analysis based on TCGA clinical information
GDC data portal provided clinical features and follow-up time of all clinical cases recorded in TCGA-STAD database. Patients were divided by age at first diagnosis, gender, tumor grade, and tumor stage. ANXA2 expression level was higher in patients with older first diagnosis age (
3.7Correlation analysis between miRNA-mRNA axes expression and tumor-related phenotypes
Among 22 types of immune cells, proportion of 8 immune cells showed significant difference between normal tissue and gastric tumor (Fig. 6A and Table 5). Results of Spearman’s correlation between immune cell proportion and miRNA/mRNA expression were presented in Fig. 6B. Percentages of M1 macrophages, monocytes, and activated memory CD4 T cells were correlated with miR-1-3p/ANXA2 axes. Regulatory T cells (Tregs) and follicular T helper cells were correlated with miR-301a-3p/ELL2 axes. Resting mast cells and M0 macrophages were significantly correlated with these 2 miRNA-mRNA axes mentioned above. ESTIMATE was applied to estimate the samples’ stroma and immunity levels. As is exhibited in Fig. 6C, the network of miR-1-3p and ANXA2 interacted with tumor mutational burden and tumor immune microenvironment. The
4.Discussion
Dysregulation of miRNA in cancers have raised wide concern in the past few decades [19]. In current study, we identified 228 DE-mRNAs (105 up and 123 down) and 67 DE-miRNAs (22 up and 16 down) via bioinformatic method based on GEO datasets and TCGA database. Via binding to 3’UTR of mRNA, miRNA posttranscriptionally suppress target mRNA expression [20]. TarBase and MiRTarBase helped to define negatively regulated miRNA-mRNA axes. Previous studies on miRNA-mRNA interactions have emphasized their essential role in occurrence, invasion, immune escape, and metastasis of gastric cancer [21]. However, these researches based on bioinformatic methods did not verify the inverse regulatory relationship of DE-miRNAs and DE-mRNAs in human specimen. In present study, we measured the expression level of key miRNAs and mRNA by conducting RT-qPCR in STAD tissue and adjacent normal tissue. Finally, we considered miR-1-3p/ANXA2 and miR-301a-3p/ELL2 as specific miRNA/mRNA signatures for STAD.
Pathway enrichment analysis based on dysregulated mRNAs indicated that gastric acid secretion, mitotic cell cycle phase transition, Human papillomavirus infection, and alcohol dehydrogenase (NAD (P)
Ultimately, the networks of miR-1-3p (down)/ANXA2 (up) and miR-301a-3p (up)/ELL2 (down) were recognized as essential miRNA-mRNA signatures. Downregulations of MiR-1-3p in gastric cancer tissue and cell lines were observed in previous studies [28, 29]. MiR-1-3p was reported to function as a suppressor in cell proliferation, apoptosis, and migration of STAD [30, 31]. ANXA2, short for annexin A2, is a member of the calcium-dependent phospholipid-binding protein family annexins [32]. By interacting with several tumor-related signal pathways, including mTOR, p38MAPK and AKT pathways, ANXA2 plays a promoting role in drug resistance and tumor growth of STAD [33, 34]. It is reported that circulating ANXA2 level may serve as a candidate biomarker for diagnosis and chemotherapy sensitivity assessment in gastric cancer [35]. Overexpression of miR-301a-3p was verified in esophageal carcinoma [36], lung cancer [37] and gastric cancer [38]. In HER2-positive gastric cancer, miR-301a-3p mediate the trastuzumab resistance [39]. Elongation Factor for RNA Polymerase II 2 (ELL2) was reported to interact with the retinoblastoma pathway and thus influence cell proliferation, invasion, and migration of prostate cancer [40]. To sum up, miR-1-3p, miR-301a-3p, ANXA2 and ELL2 are of significance in pathogenesis and progress of STAD. ROC based on these two miRNA-mRNA networks indicated that the complex model containing all 4 signatures showed best diagnostic value comparing to other 14 modes, the AUC of which equals to 0.9208 (95% CI: 0.8804 to 0.9612). DCA conducted with TCGA-STAD database also affirmed the diagnostic efficacy of these 2 miRNA-mRNA axes.
Survival analysis based on overall survival (OS) suggested that low ELL2 expression tend to indicate better prognosis in gastric cancer (
Correlation between miRNA/mRNA axes and immune cells proportion emphasized the crucial role of resting mast cells and M0 macrophages in gastric adenocarcinomas. Proportion of resting mast cell declined in STAD tissue, while percentage of M0 macrophage increased in tumor tissue. Mast cells activated by interleukin (IL)-33 accelerate macrophage infiltration and thus promote gastric tumor growth [45]. Enriched mast cells capable of interacting with TNF-
Current study gave an overview of miRNA-mRNA regulatory network for STAD. However, there are still some shortcomings such as insufficient sample size and lack of follow-up data in this study. Besides, patients with lymph node metastasis, distant metastasis, or vascular invasion have no surgical opportunity, so the samples collected in this study did not include patients with advanced tumors. Therefore, studies based on more clinical samples and long-term follow-up data are needed.
5.Conclusion
In summary, we carried out comprehensive bioinformatic analysis and experimental verification for miRNA-mRNA network related in STAD. ThesemiRNA-mRNA axes may function as biomarkers for early diagnosis, long-term prognosis, and drug resistance assessment of gastric cancer. Our findings may provide new ideas for STAD treatment.
Authors’ contributions
Conception: Feng Gao, Hang Yang and Wei Zhu.
Interpretation or analysis of data: Shuang Peng and Guoxin Song.
Preparation of the manuscript: Shuang Peng, Jingfeng Zhu and Hao Zhang.
Revision for important intellectual content: Shuang Peng, Shiyu Zhang and Cheng Liu.
Supervision: Wei Zhu.
Supplementary data
The supplementary files are available to download from http://dx.doi.org/10.3233/CBM-230125.
Acknowledgments
We thank openbiox community and Hiplot team (https://hiplot.com.cn) for providing technical assistance and valuable tools for data analysis and visualization. This study was supported by the Science and Education Health Promotion Project of Wujiang District, Suzhou [Grant number: WWK201908].
References
[1] | H. Sung et al., Global cancer statistics 2020: GLOBOCAN estimates of incidence and mortality worldwide for 36 cancers in 185 countries, CA Cancer J Clin 71: (3) ((2021) ), 209–249. |
[2] | R. Sitarz et al., Gastric cancer: Epidemiology, prevention, classification, and treatment, Cancer Manag Res 10: ((2018) ), 239–248. |
[3] | E.C. Smyth et al., Gastric cancer, The Lancet 396: (10251) ((2020) ), 635–648. |
[4] | C. Allemani et al., Global surveillance of cancer survival 1995–2009: Analysis of individual data for 25 676 887 patients from 279 population-based registries in 67 countries (CONCORD-2), The Lancet 385: (9972) ((2015) ), 977–1010. |
[5] | P. Rawla and A. Barsouk, Epidemiology of gastric cancer: Global trends, risk factors and prevention, Prz Gastroenterol 14: (1) ((2019) ), 26–38. |
[6] | R. Rupaimoole and F.J. Slack, MicroRNA therapeutics: towards a new era for the management of cancer and other diseases, Nature Reviews Drug Discovery 16: (3) ((2017) ), 203–222. |
[7] | J. Lu et al., MicroRNA expression profiles classify human cancers, Nature 435: (7043) ((2005) ), 834–838. |
[8] | Z. Ali Syeda et al., Regulatory Mechanism of MicroRNA Expression in Cancer, Int J Mol Sci 21: (5) ((2020) ), |
[9] | X. Li et al., miRNA-223 promotes gastric cancer invasion and metastasis by targeting tumor suppressor EPB41L3, Mol Cancer Res 9: (7) ((2011) ), 824–833. |
[10] | Y. Dong et al., miR-221-3p and miR-15b-5p promote cell proliferation and invasion by targeting Axin2 in liver cancer, Oncol Lett 18: (6) ((2019) ), 6491–6500. |
[11] | R.A. de Mello et al., Current and potential biomarkers in gastric cancer: A critical review of the literature, Future Oncol 17: (25) ((2021) ), 3383–3396. |
[12] | K. Pang et al., miR-15a-5p targets PHLPP2 in gastric cancer cells to modulate platinum resistance and is a suitable serum biomarker for oxaliplatin resistance, Neoplasma 67: (5) ((2020) ), 1114–1121. |
[13] | G. Yang et al., Identification of Potentially Functional CircRNA-miRNA-mRNA Regulatory Network in Gastric Carcinoma using Bioinformatics Analysis, Med Sci Monit 25: ((2019) ), 8777–8796. |
[14] | Z. Fu et al., Construction of miRNA-mRNA-TF Regulatory Network for Diagnosis of Gastric Cancer, Biomed Res Int 2021: ((2021) ), 9121478. |
[15] | Z. Dong et al., Identification of circRNA-miRNA-mRNA networks contributes to explore underlying pathogenesis and therapy strategy of gastric cancer, J Transl Med 19: (1) ((2021) ), 226. |
[16] | Y.J. Guan et al., Identification of circRNA-miRNA-mRNA regulatory network in gastric cancer by analysis of microarray data, Cancer Cell Int 19: ((2019) ), 183. |
[17] | P. Murthi et al., GAPDH, 18S rRNA and YWHAZ are suitable endogenous reference genes for relative gene expression studies in placental tissues from human idiopathic fetal growth restriction, Placenta 29: (9) ((2008) ), 798–801. |
[18] | D. Cassol et al., Identification of reference genes for quantitative RT-PCR analysis of microRNAs and mRNAs in castor bean (Ricinus communis L.) under drought stress, Plant Physiology and Biochemistry 106: ((2016) ), 101–107. |
[19] | B. He et al., miRNA-based biomarkers, therapies, and resistance in Cancer, Int J Biol Sci 16: (14) ((2020) ), 2628–2647. |
[20] | M.R. Fabian et al., Regulation of mRNA Translation and Stability by microRNAs, Annual Review of Biochemistry 79: (1) ((2010) ), 351–379. |
[21] | X. Zeng et al., Research progress on the circRNA/lncRNA-miRNA-mRNA axis in gastric cancer, Pathol Res Pract 238: ((2022) ), 154030. |
[22] | Z.N. Lei et al., Signaling pathways and therapeutic interventions in gastric cancer, Signal Transduct Target Ther 7: (1) ((2022) ), 358. |
[23] | F. Meric-Bernstam et al., Advances in HER2-Targeted Therapy: Novel agents and opportunities beyond breast and gastric cancer, Clin Cancer Res 25: (7) ((2019) ), 2033–2041. |
[24] | K. Kawaguchi et al., Combination of gemcitabine and docetaxel regresses both gastric leiomyosarcoma proliferation and invasion in an imageable patient-derived orthotopic xenograft (iPDOX) model, Cell Cycle 16: (11) ((2017) ), 1063–1069. |
[25] | K. Zhou et al., Bone morphogenetic protein 4 is overexpressed in and promotes migration and invasion of drug-resistant cancer cells, Int J Biol Macromol 101: ((2017) ), 427–437. |
[26] | K. Magierowska et al., Oxidative gastric mucosal damage induced by ischemia/reperfusion and the mechanisms of its prevention by carbon monoxide-releasing tricarbonyldichlororuthenium (II) dimer, Free Radic Biol Med 145: ((2019) ), 198–208. |
[27] | N. Egawa et al., Antitumor effects of low-dose tipifarnib on the mTOR signaling pathway and reactive oxygen species production in HIF-1α-expressing gastric cancer cells, FEBS Open Bio 11: (5) ((2021) ), 1465–1475. |
[28] | N. Wang et al., HDAC6/HNF4alpha loop mediated by miR-1 promotes bile acids-induced gastric intestinal metaplasia, Gastric Cancer 24: (1) ((2021) ), 103–116. |
[29] | J. Ke et al., MiR-1-3p suppresses cell proliferation and invasion and targets STC2 in gastric cancer, Eur Rev Med Pharmacol Sci 23: (20) ((2019) ), 8870–8877. |
[30] | P. Deng et al., LINC00242/miR-1-3p/G6PD axis regulates Warburg effect and affects gastric cancer proliferation and apoptosis, Mol Med 27: (1) ((2021) ), 9. |
[31] | X.Q. Lin et al., mir-1 inhibits migration of gastric cancer cells, Front Biosci (Landmark Ed) 25: (3) ((2020) ), 452–462. |
[32] | L. Mao et al., EphA2-YES1-ANXA2 pathway promotes gastric cancer progression and metastasis, Oncogene 40: (20) ((2021) ), 3610–3623. |
[33] | Y. Li et al., S100A10 Accelerates Aerobic Glycolysis and Malignant Growth by Activating mTOR-Signaling Pathway in Gastric Cancer, Front Cell Dev Biol 8: ((2020) ), 559486. |
[34] | Z.D. Zhang et al., Annexin A2 is implicated in multi-drug-resistance in gastric cancer through p38MAPK and AKT pathway, Neoplasma 61: (6) ((2014) ), 627–637. |
[35] | F. Tas et al., Circulating annexin A2 as a biomarker in gastric cancer patients: Correlation with clinical variables, Biomed Pharmacother 69: ((2015) ), 237–241. |
[36] | N. Zhang and J.F. Liu, MicroRNA (MiR)-301a-3p regulates the proliferation of esophageal squamous cells via targeting PTEN, Bioengineered 11: (1) ((2020) ), 972–983. |
[37] | L. Li et al., beta-elemene suppresses Warburg effect in NCI-H1650 non-small-cell lung cancer cells by regulating the miR-301a-3p/AMPKalpha axis, Biosci Rep 40: (6) ((2020) ). |
[38] | X. Xia et al., Hypoxic gastric cancer-derived exosomes promote progression and metastasis via MiR-301a-3p/PHD3/HIF-1alpha positive feedback loop, Oncogene 39: (39) ((2020) ), 6231–6244. |
[39] | J. Guo et al., miR-301a-3p induced by endoplasmic reticulum stress mediates the occurrence and transmission of trastuzumab resistance in HER2-positive gastric cancer, Cell Death Dis 12: (7) ((2021) ), 696. |
[40] | X. Qiu et al., Physical and functional interactions between ELL2 and RB in the suppression of prostate cancer cell proliferation, migration, and invasion, Neoplasia 19: (3) ((2017) ), 207–215. |
[41] | Q. Huang et al., Up-regulated microRNA-299 corrected with poor prognosis of glioblastoma multiforme patients by targeting ELL2, Jpn J Clin Oncol 47: (7) ((2017) ), 590–596. |
[42] | X. Xu et al., Upregulation of miRNA301a3p promotes tumor progression in gastric cancer by suppressing NKRF and activating NFkappaB signaling, Int J Oncol 57: (2) ((2020) ), 522–532. |
[43] | C. Liang et al., Identification and validation of a pyroptosis-related prognostic model for gastric cancer, Front Genet 12: ((2021) ), 699503. |
[44] | J. Ma et al., Prognostic microRNAs associated with phosphoserine aminotransferase 1 in gastric cancer as markers of bone metastasis, Front Genet 13: ((2022) ), 959684. |
[45] | M.F. Eissmann et al., IL-33-mediated mast cell activation promotes gastric cancer through macrophage mobilization, Nat Commun 10: (1) ((2019) ), 2735. |
[46] | Y. Lv et al., Increased intratumoral mast cells foster immune suppression and gastric cancer progression through TNF-alpha-PD-L1 pathway, J Immunother Cancer 7: (1) ((2019) ), 54. |
[47] | Y. Chen et al., Tumor-recruited M2 macrophages promote gastric and breast cancer metastasis via M2 macrophage-secreted CHI3L1 protein, J Hematol Oncol 10: (1) ((2017) ), 36. |
[48] | R. Kim et al., Early tumor-immune microenvironmental remodeling and response to first-line fluoropyrimidine and platinum chemotherapy in advanced gastric cancer, Cancer Discov 12: (4) ((2022) ), 984–1001. |
[49] | V. Gambardella et al., The role of tumor-associated macrophages in gastric cancer development and their potential as a therapeutic target, Cancer Treat Rev 86: ((2020) ), 102015. |
[50] | H. Chen et al., Identification and validation of CYBB, CD86, and C3AR1 as the key genes related to macrophage infiltration of gastric cancer, Front Mol Biosci 8: ((2021) ), 756085. |


