
Bioinformatics analysis of markers based on m6A related to prognosis combined with immune invasion of rectal adenocarcinoma
Abstract
BACKGROUND:
Colorectal cancer (CRC) is a common form of cancer, with rectal cancer accounting for approximately one-third of all cases. Among rectal cancers, 95% are classified as rectal adenocarcinoma (READ). Emerging evidence suggests that long noncoding RNAs (lncRNAs) play a significant role in the development and progression of various cancers. In our study, we aimed to identify differentially expressed lncRNAs potentially associated with m6A and establish a risk assessment model to predict clinical outcomes for READ patients.
METHODS:
The READ dataset from the TCGA database was utilized in this study to synergistically and logically integrate m6A and lncRNA, while employing bioinformatics technology for the identification of suitable biomarkers. A risk prediction model comprising m6A-associated lncRNAs was constructed to investigate the prognostic, diagnostic, and biological functional relevance of these m6A-related lncRNAs.
RESULTS:
Our research builds a composed of three related to m6A lncRNA rectal gland cancer prognosis model, and the model has been proved in the multi-dimensional can serve as the potential of the prognosis of rectal gland cancer biomarkers. Our study constructed a prognostic model of rectal adenocarcinoma consisting of three related m6A lncRNAs: linc00702, ac106900.1 and al583785.1.
CONCLUSION:
The model has been validated as a potential prognostic biomarker for rectal cancer in multiple dimensions, aiming to provide clinicians with an indicator to assess the duration of straight adenocarcinoma. This enables early detection of rectal cancer and offers a promising target for immunotherapy.
1.Introduction
Colorectal cancer (CRC) has the third highest incidence in the world (10.2% of total cases) and is the second leading cause of cancer-related death globally (9.2% of all cases). CRC can be divided into colonic adenocarcinoma (COAD) and rectal adenocarcinoma (READ) [1], of which rectal adenocarcinoma accounts for about 30%–35% of all CRC patients [2]. Clinically, the standard treatment for rectal cancer is radiotherapy and chemotherapy plus resection [3]. However, the rectum is located in the deep pelvic cavity, leading to frequent postoperative recurrence, and the anatomical relationship makes the operation difficult. For patients with low and moderate rectal cancer, the harsh truth is that the lesion is located near the anal sphincter. It is difficult for clinicians to preserve the anus and its function during surgery [4]. In addition to the impact on survival, colorectal cancer patients’ quality of life is also significantly reduced, which is supported by sufficient data [5]. The high aggressiveness of rectal cancer and the high local multiple recurrence and metastasis rate have led to the double incidence of rectal cancer in patients under 40 years old since 1940 [6]. For the same reason, about half of rectal cancer patients are diagnosed with locally advanced rectal cancer [1]. For the many problems faced by patients with rectal cancer, we need different treatment methods at this stage.
N6-methyladenosine (m6A) has been identified as one of the most common and abundant RNA modifications, regulating gene expression by altering RNA-protein interactions and other pathways [7], and has been shown to play a key role in various normal biological processes such as tissue development, stem cell self-renewal and differentiation [8]. In association with cancer, overall survival was significantly associated with different subtypes of m6A modification in 24/27 cancer types [9]. At present, many studies have revealed the close relationship between m6A modification and digestive system cancer. For example, m6A regulator HNRNPA2B1 promotes esophageal cancer by upregulating ACLY and ACC1 [10], and reducing m6A modification can predict malignant phenotypes in gastric cancer [11]. RNA m6A methyltransferase METTL3 plays a promoting role in the pathogenesis of pancreatic cancer [12]. For rectal adenocarcinoma, current studies have identified potential m6A-modified genes that may be involved in the process of READ disease, and m6A-related proteins are often maladjusted at mRNA and protein levels [13, 14]. However, the specific expression pattern and clinical value of new stage m6A-related genes in rectal adenocarcinoma remain unclear.
Long RNA transcripts that do not encode proteins, usually greater than 200 nucleotides (
LncRNA can be used as biomarkers for disease progression and survival risk as well as therapeutic targets, and scientists are actively exploring bioinformatics methods to develop new lncRNA annotation tools [22]. With the improvement of gene sequencing technology and the development of various tumor databases, we can use TCGA-READ (TCGA-READ) data to search for prognostic biomarkers. In this study, we constructed a prognostic model composed of 3 m6A-related lncRNAs and tested the predictive power of the model. Tumor immune invasion was evaluated. We expect to combine m6A and lncRNA organically and reasonably, use bioinformatics technology to find suitable biomarkers for rectal adenocarcinoma, and explore the key factors affecting the effect of tumor immunotherapy through the model composed of m6A and lncRNA.
2.Methods and materials
2.1READ Access to patient information
READ samples of lncRNA - seq map and the corresponding clinical characteristics, including survival time, status, age, gender, grade and TNM staging, are downloaded from the cancer genome atlas (TCGA) (https://www.cancer.gov/ccg/).
2.2Identify the m6 A gene
The m6A methyltransferase of RNA is composed of “Writer” proteins, including METTL3, METTL14, METTL16, WTAP, VIRMA, ZC3H13, RBM15, RBM 15B). M6A methylation can be re-moved by m6A demethylase (“Eraser”), including FTO and ALKNH5. M6A mainly affects the fate of mRNA through its recruited “Reader, including YTHDC1, YTHDC2, YTHDF1, YTHDF2, YTHDF3, HNRNPC, FMR1, LRPPRC, HNRNPA2B1, IGFBP1, IGFBP2, IGFBP3.
2.3Pearson correlation analysis
We screened m6A-related lncRNAs by Pearson’s correlation analysis, and 262 m6A-related lncRNAs were identified. The process used the criteria of
2.4Lasso Cox regression
In order to minimize the risk of over fitting, the Cox regression analysis of lasso penalty was used to construct a prognostic model, and then the minimum absolute contraction and selection operator (lasso) Cox regression model was used to construct polygenic features in TCGA cohort. Lasso Cox regression was performed using R software package “glmnet” (using 10-fold cross-validation of the estimated penalty parameters) and a risk model of lncRNA associated with m6A was established.
2.5Kaplan-Meier survival analysis
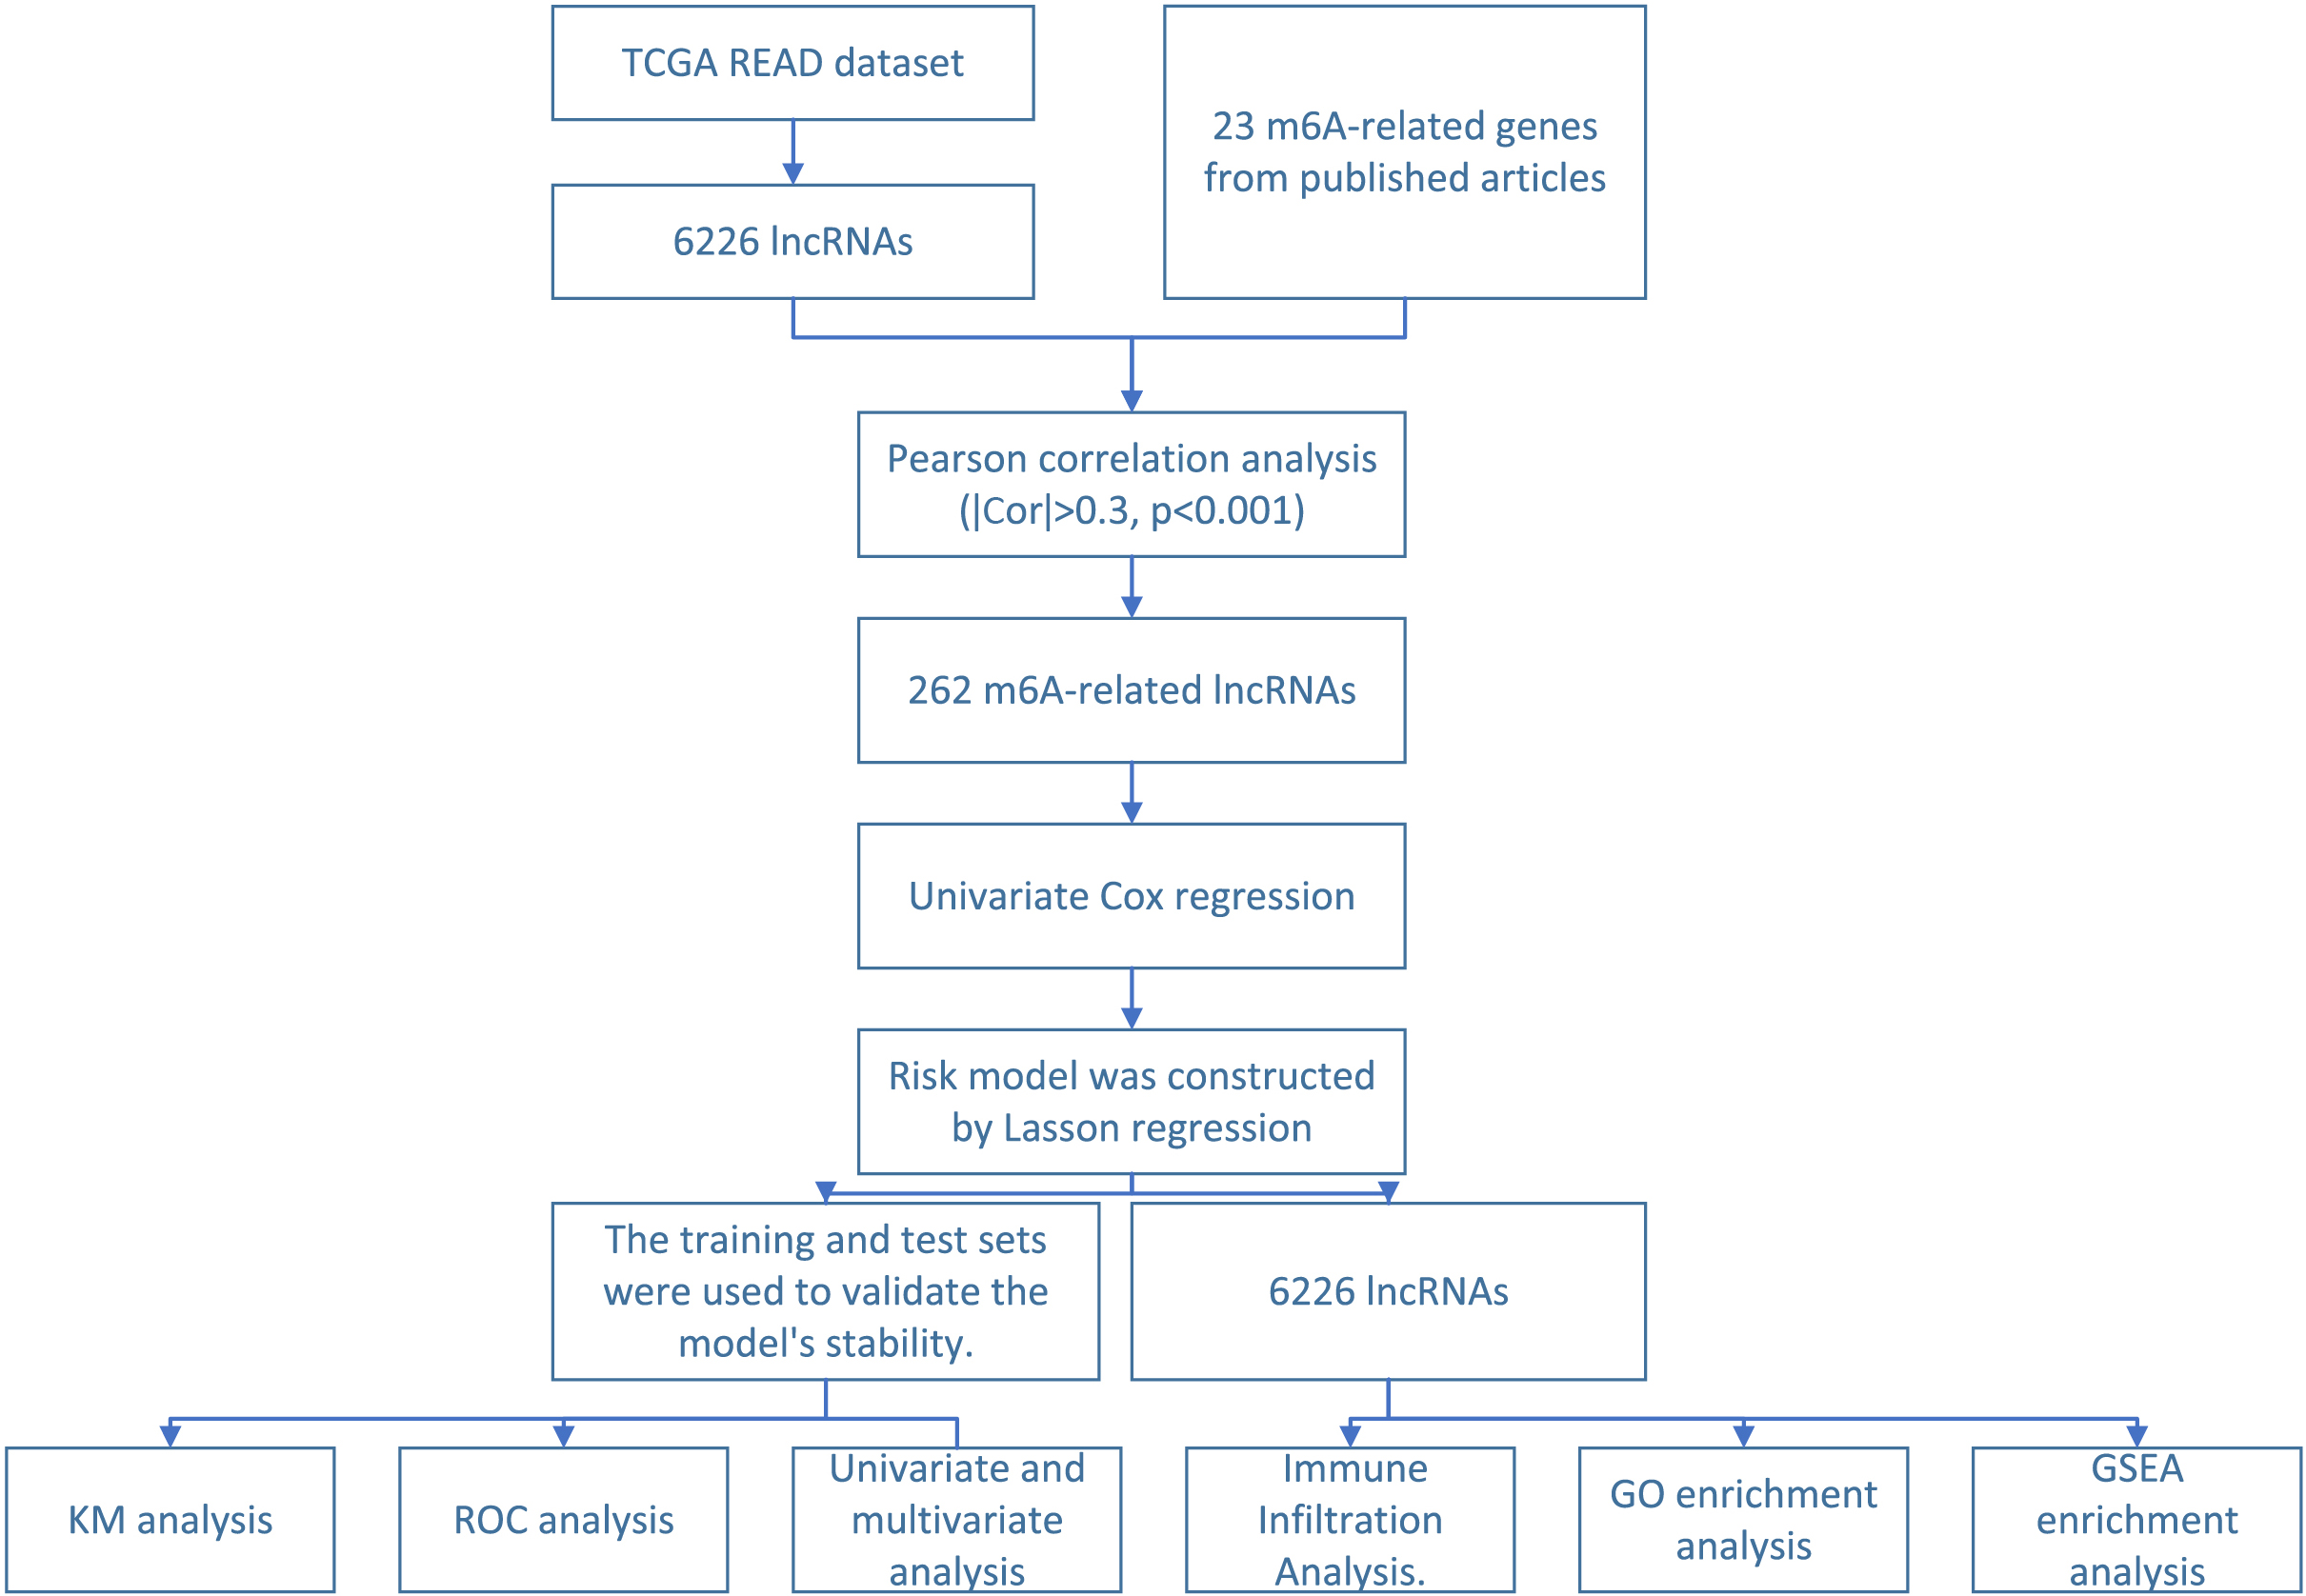
Figure 1.
Schematic diagram of m6A-related lncRNA screening and functional verification.
Patients were divided into two groups according to the median value of risk score. Patients were defined as high risk group, if their risk score were greater than the median value. Otherwise, patients were defined as low risk group. Patient survival between the two groups was assessed via Cox regression analysis. The significance of survival differences was estimated in terms of p-value. The regulatory pairs will be considered to have an impact on the prognosis of patients if both p-values were lower than 0.05. Kaplan-Meier survival curves were plotted using two R packages (“Survminer” and “Survive”).
2.6Time dependent receiver operating Characteristic (ROC) curves
We constructed time-dependent receiver operating characteristic (ROC) curves and estimated its utility as a prognostic model for predicting the survival status. The area under the curve (AUC) was measured using the “survivalROC” software package in R to assess the prognostic accuracy of genetic characteristics.
2.7Immune infiltration analysis
Immune infiltration analysis of READ was performed to explore the relationship between immune checkpoints and immune cell infiltration and the expression of immune biomarkers, chemokines, and chemokine receptors. The “vioplot” package in R were used to analyse whether there were differences in immune cells between the high-risk and low-risk subgroups (
2.8Analysis of enrichment
GO analysis allows differential expression of genes to be identified and the clusterprofiler packages were used for functional analysis. The significance of the analysis is determined by the
3.Results
3.1Screening and determination of target lncRNAs
Figure 1 displays the workflow of the current study. In this study, a total of 92 cases of standardized RNA sequencing transcriptome data were obtained from the TCGA database. Among these, complete clinical information was available for 90 cases; however, survival information was missing for 2 cases. Therefore, a total of 88 samples were included in this study (Table 1). The training set and test set (
Table 1
Characteristic of READ patients
| Covariates | Type | Number |
|---|---|---|
| Age | 51 (57.95%) | |
| 32 (36.36%) | ||
| Gender | FEMALE | 39 (44.32%) |
| MALE | 49 (55.68%) | |
| Stage | I | 18 (20.45%) |
| II | 30 (34.09%) | |
| III | 24 (27.27%) | |
| IV | 14 (15.91%) | |
| Unknow | 2 (2.27%) | |
| T stage | T1 | 4 (4.55%) |
| T2 | 18 (20.45%) | |
| T3 | 62 (70.45%) | |
| T4 | 4 (4.55%) | |
| M stage | M0 | 70 (79.55%) |
| M1 | 13 (14.77%) | |
| MX | 5 (5.68%) | |
| N stage | N0 | 50 (56.82%) |
| N1 | 26 (29.55%) | |
| N2 | 12 (13.64%) |
Figure 2.
Screening and determination of target lncRNAs. (A) Sankey relational diagram for 23 m6A genes and m6A-related lncRNAs (B) Co-expression network diagram of 23 m6 A genes and m6A-related lncRNAs (C) Five lncRNAs were obtained by univariate Cox regression analysis.
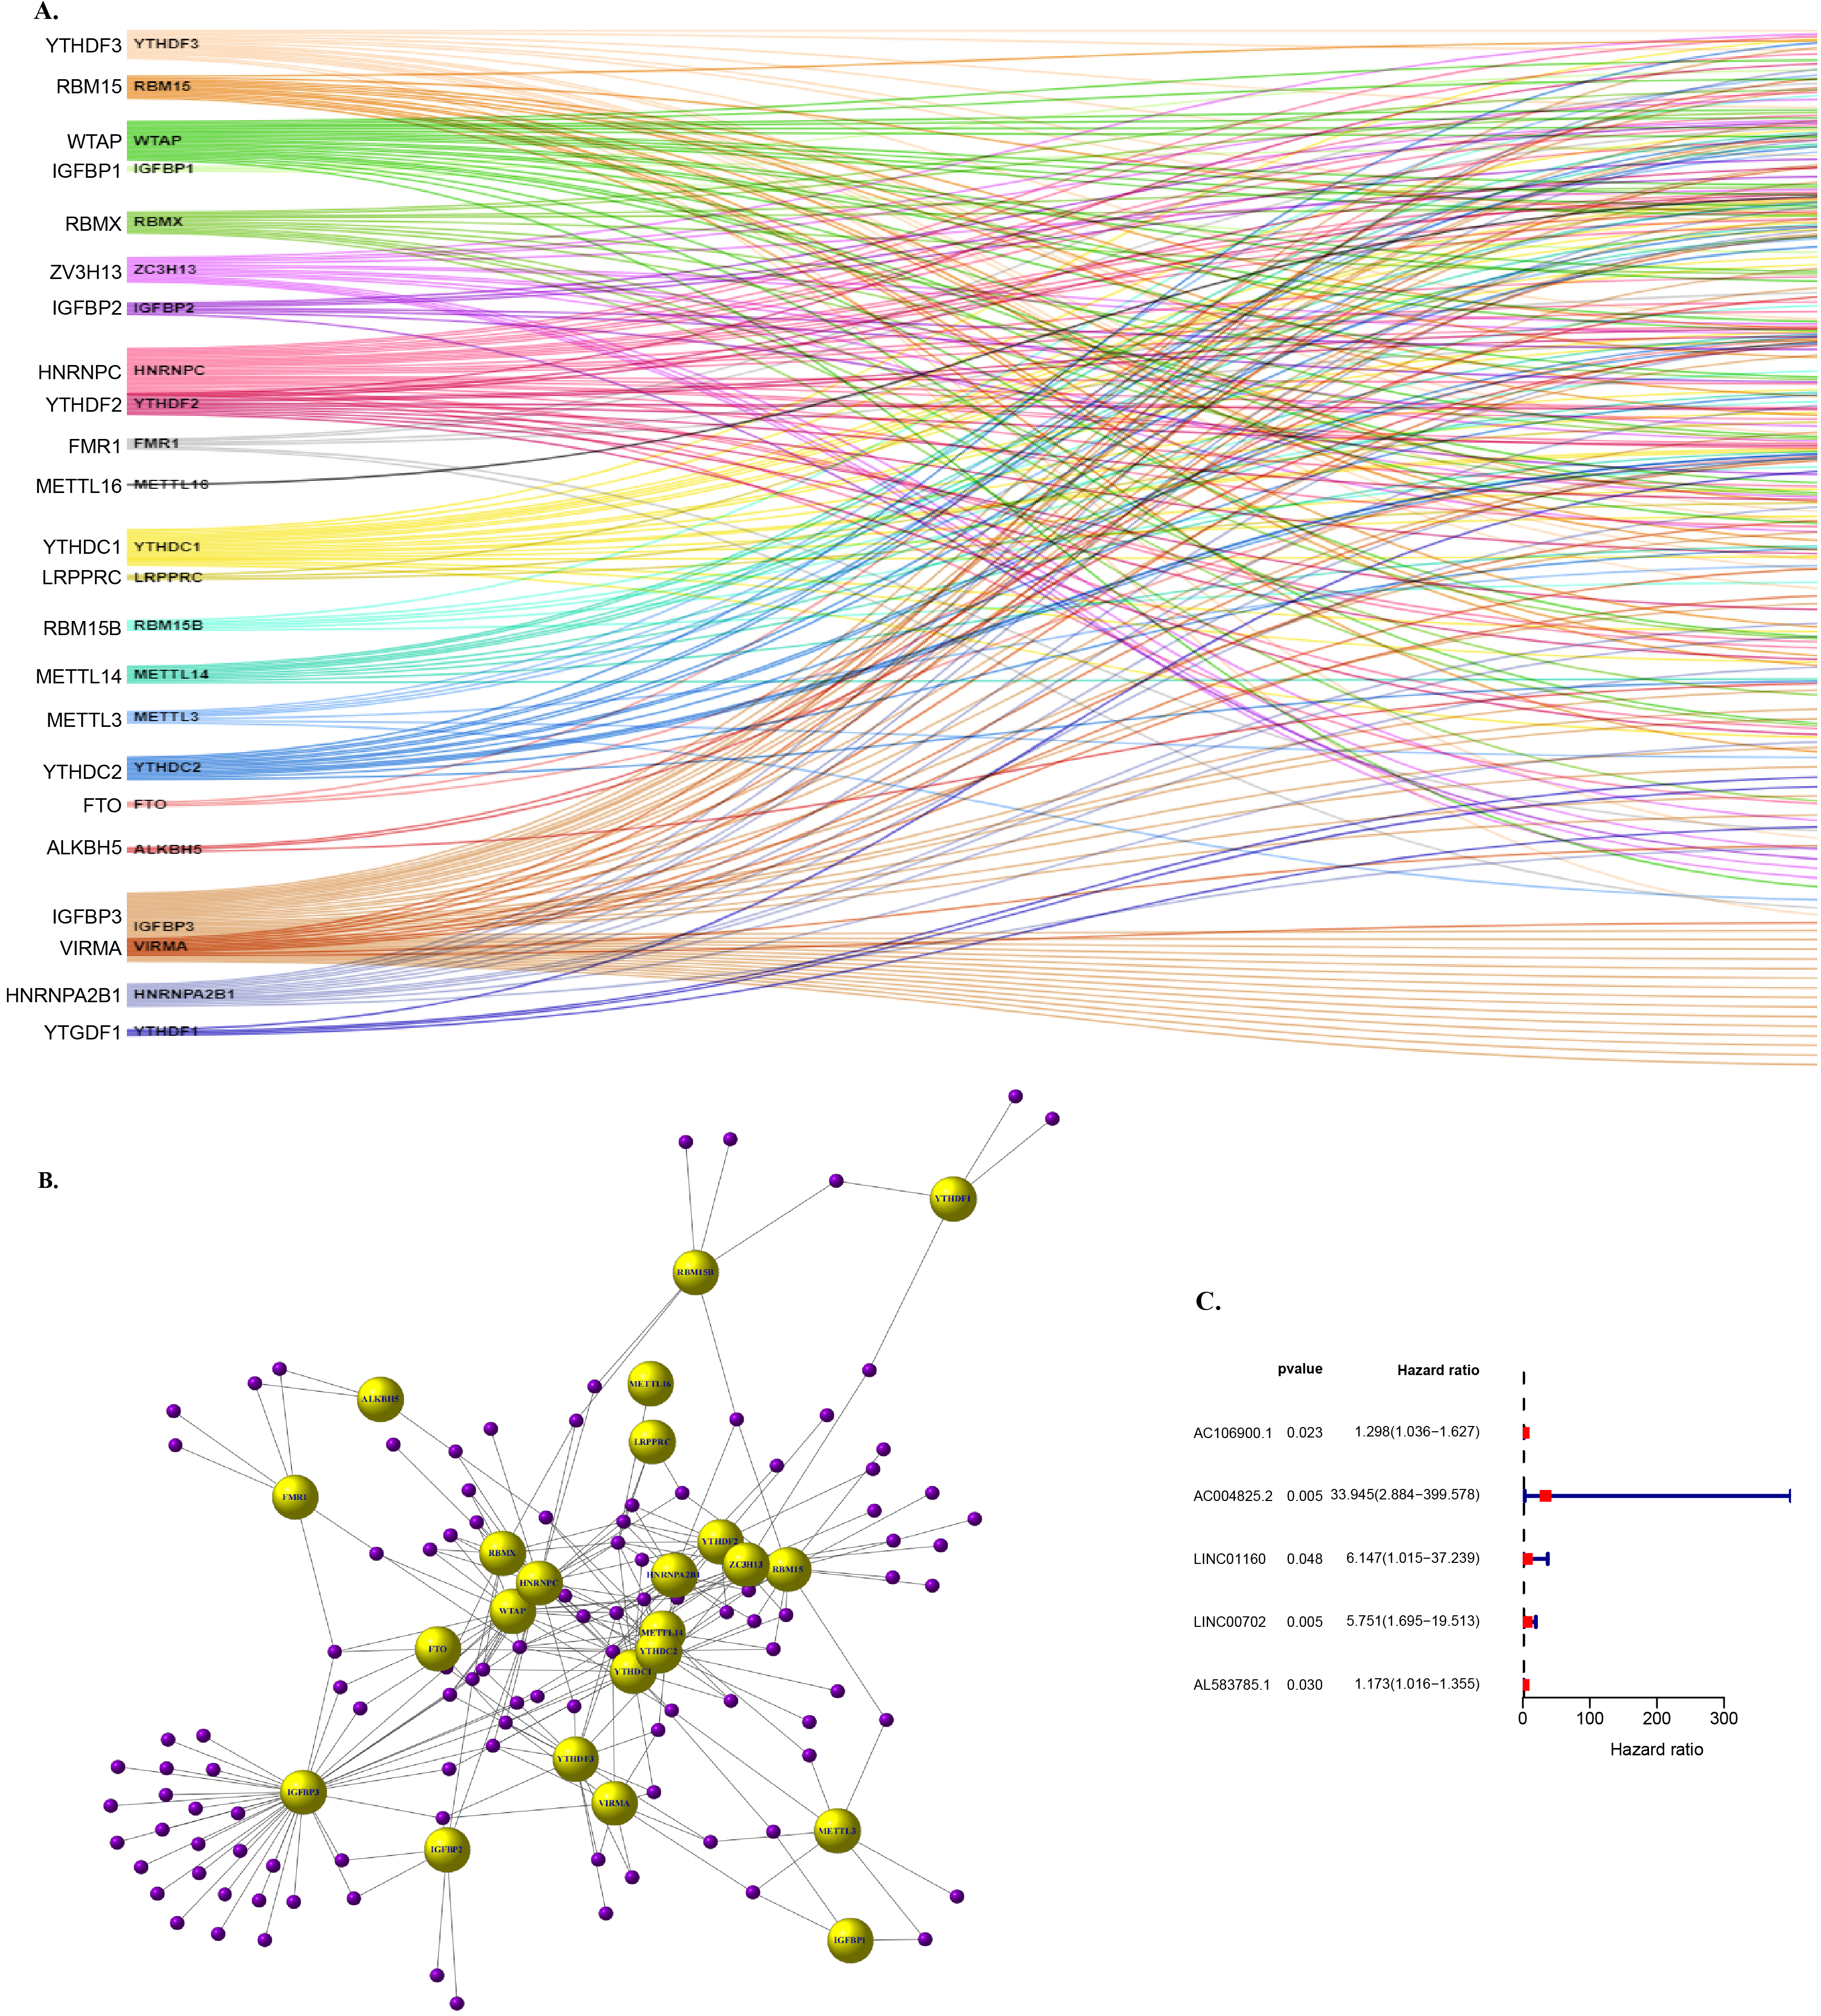
Under the condition of known m6A genes, we can get related to m6a lncRNA, in this process, we implement standard is included in the standard of not less than a m6A lncRNA genes related to the use of the person related line analysis arithmetic (
3.2The prognostic value of training concentration risk models
Figure 3.
The prognostic value of training concentration risk models. (A) The tuning parameters (log l) of OS-related proteins were selected to cross-verify the error curve. (B) According to the minimal criterion and 1-se criterion, perpendicular imaginary lines were drawn at the optimal value. (C) Distribution of m6 A-related lncRNA model-based risk score for the training set. (D) Patterns of the survival time and survival status between the high- and low-risk groups for the training set. (E) Kaplan-Meier survival curves of the OS of patients in the high- and low-risk groups for the training set. (F) Clustering analysis heatmap shows the display levels of the 8 prognostic lncRNAs for each patient in the training set.
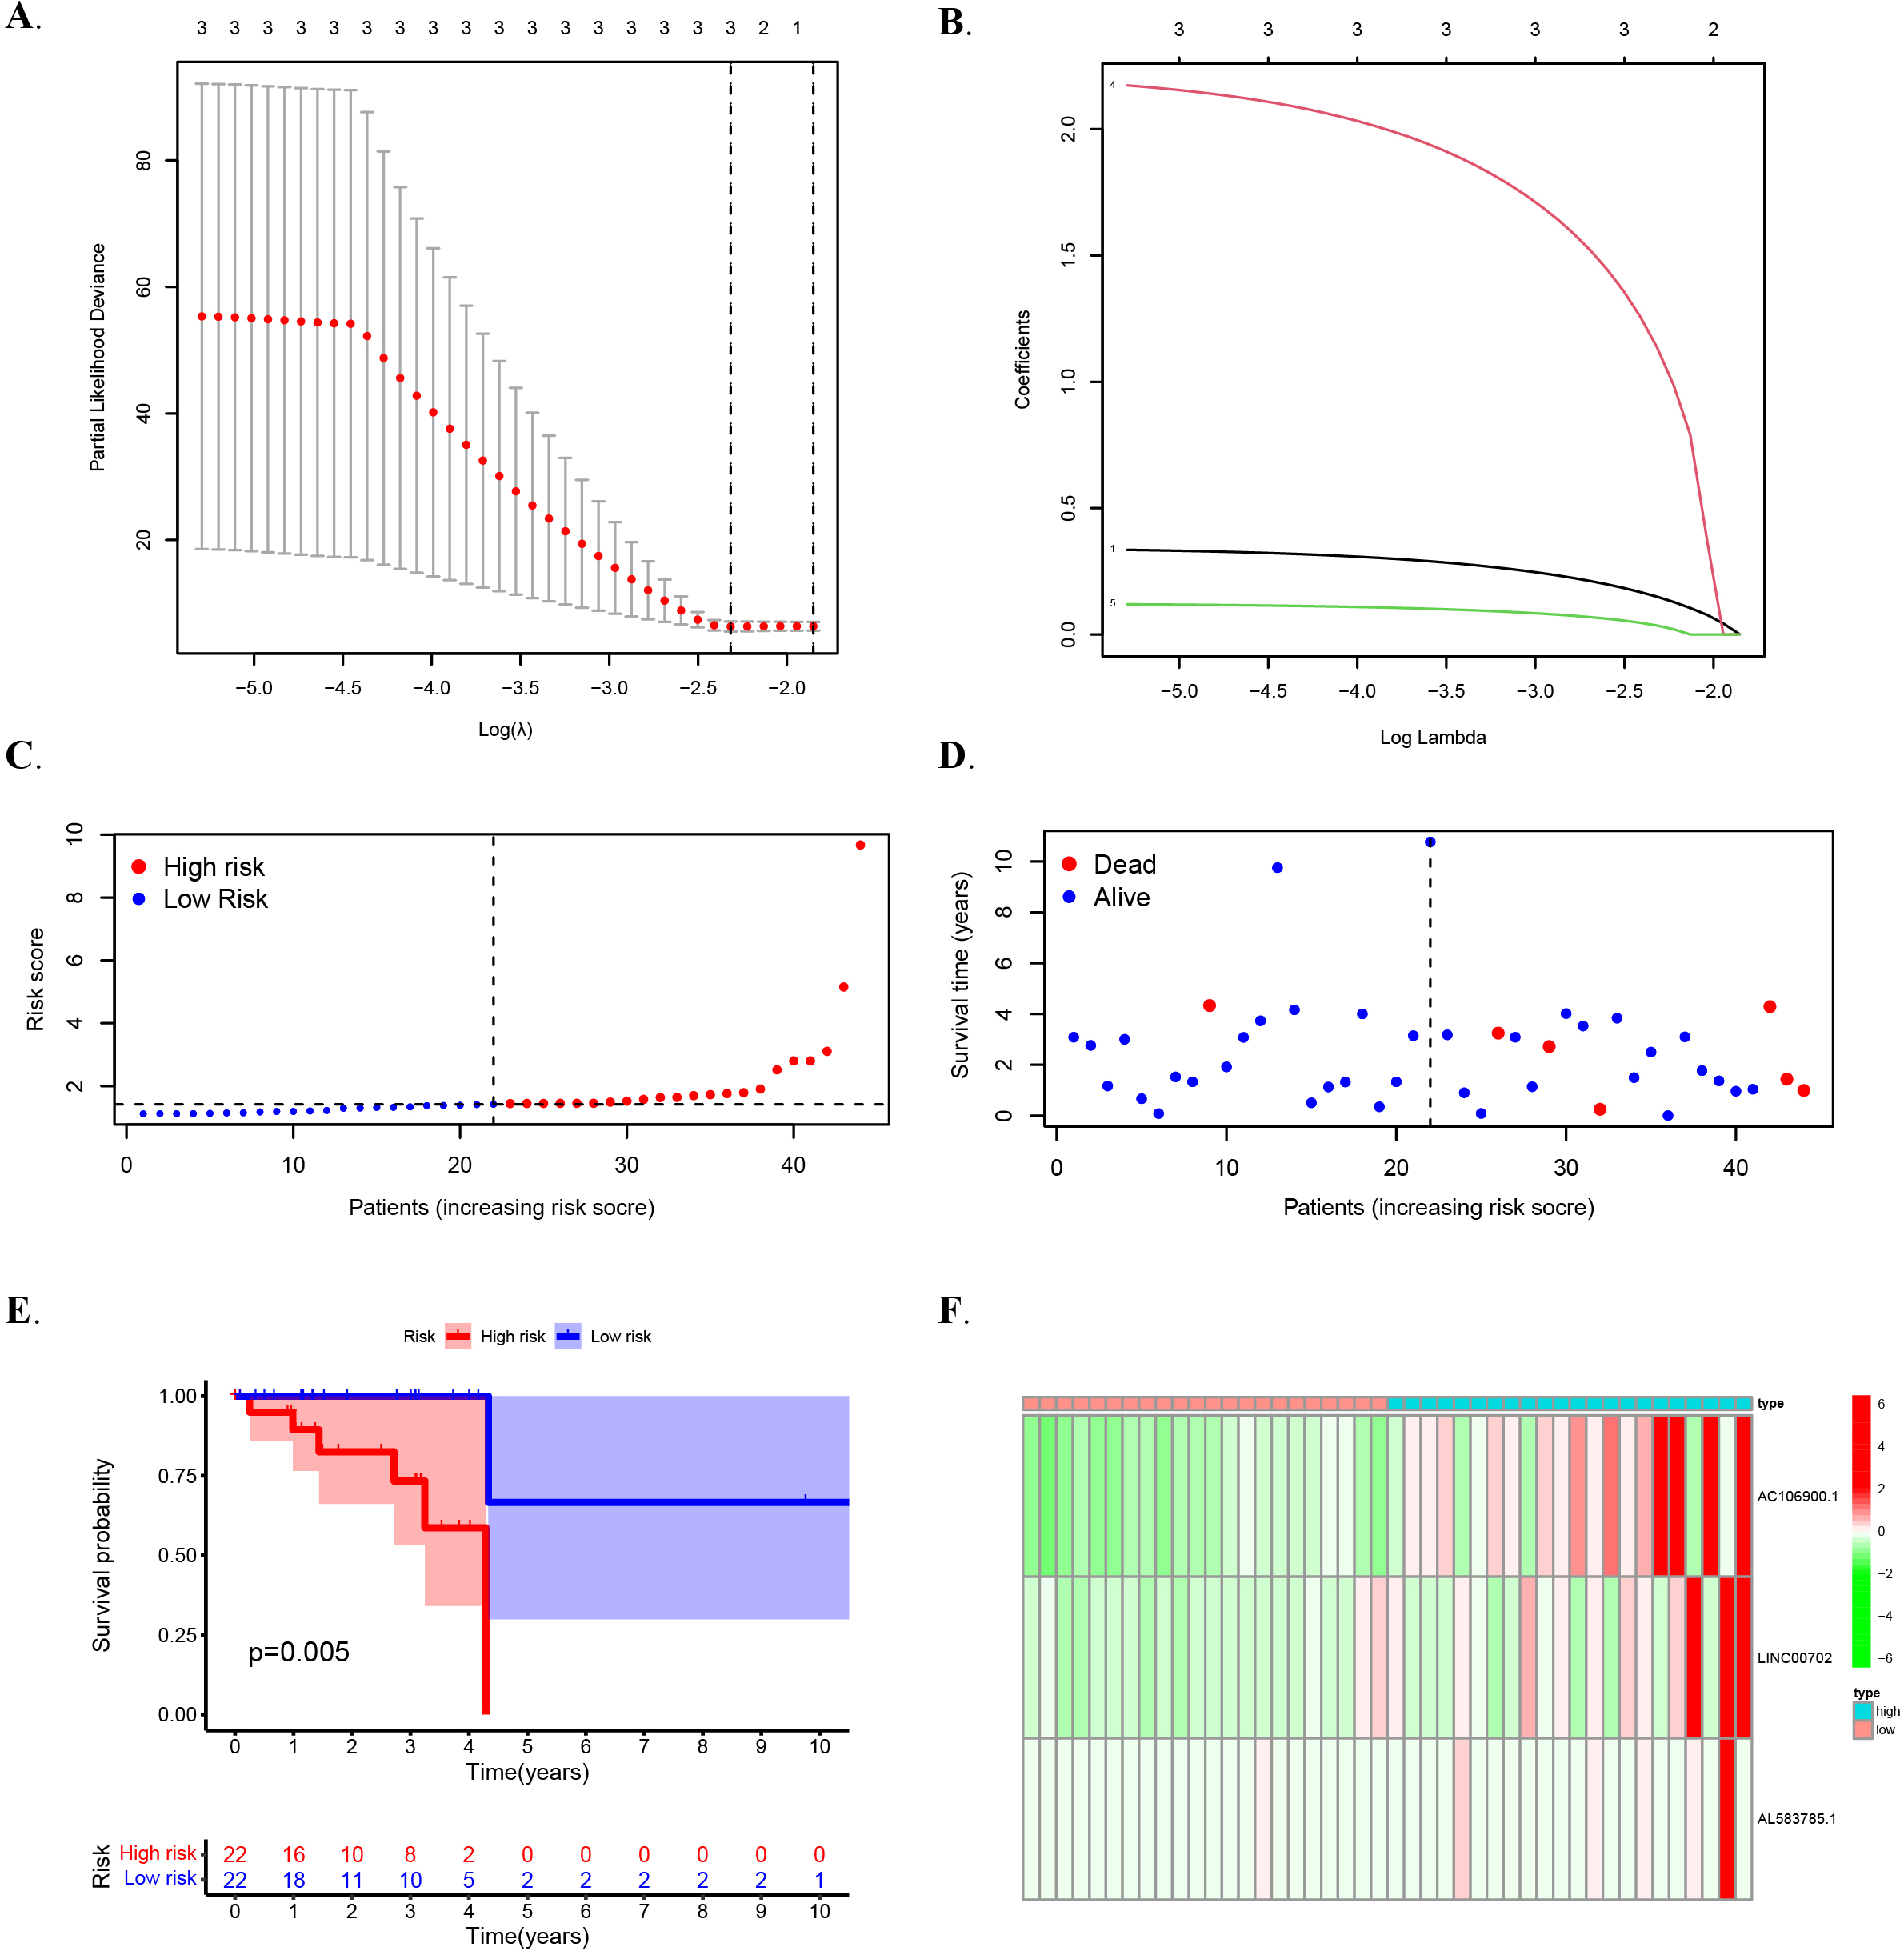
In multiple regression analysis, lasso penalty-Cox analysis is one of the most common methods. The advantage of screening lasso penalty-Cox analysis is that it can not only improve the prediction accuracy of the model, but also better explain the model. More importantly, it implements regularization of variable selection. Therefore, the method is widely used in high-throughput data with poor correlation and large predicted value, and the over-fitting problem is optimized, so the method can effectively identify the most available data. Vertical dashed lines represent logL equivalents with minimal piecewise likelihood deviation as shown (Fig. 3A–B). In the end, In the TCGA training set, three lncRNASs were determined to use training data and build OS risk assessment models as follows: Riskscore
Figure 4.
The prognostic value of risk patterns in testing set and entire set. (A) Distribution of m6A-related lncRNA model-based risk score for the testing set. (B) Patterns of the survival time and survival status between the high- and low-risk groups for the testing set. (C) Kaplan-Meier survival curves of the OS of patients in the high- and low-risk groups for the testing set. (D) Clustering analysis heatmap shows the display levels of the 3 prognostic lncRNAs for each patient in the testing set. (E) Distribution of the m6A-related lncRNA model-based risk score for the entire set. (F) Patterns of the survival time and survival status between the high- and low-risk groups for the entire set. (G) Kaplan-Meier survival curves of OS of patients in the low- and high-risk groups for the entire set. (H) Clustering analysis heatmap shows the expression levels of the 3 prognostic lncRNAs for each patient for the entire set. In this study, the median risk score was used to classify the high and low risk groups and was marked by a dashed line in the distribution map.
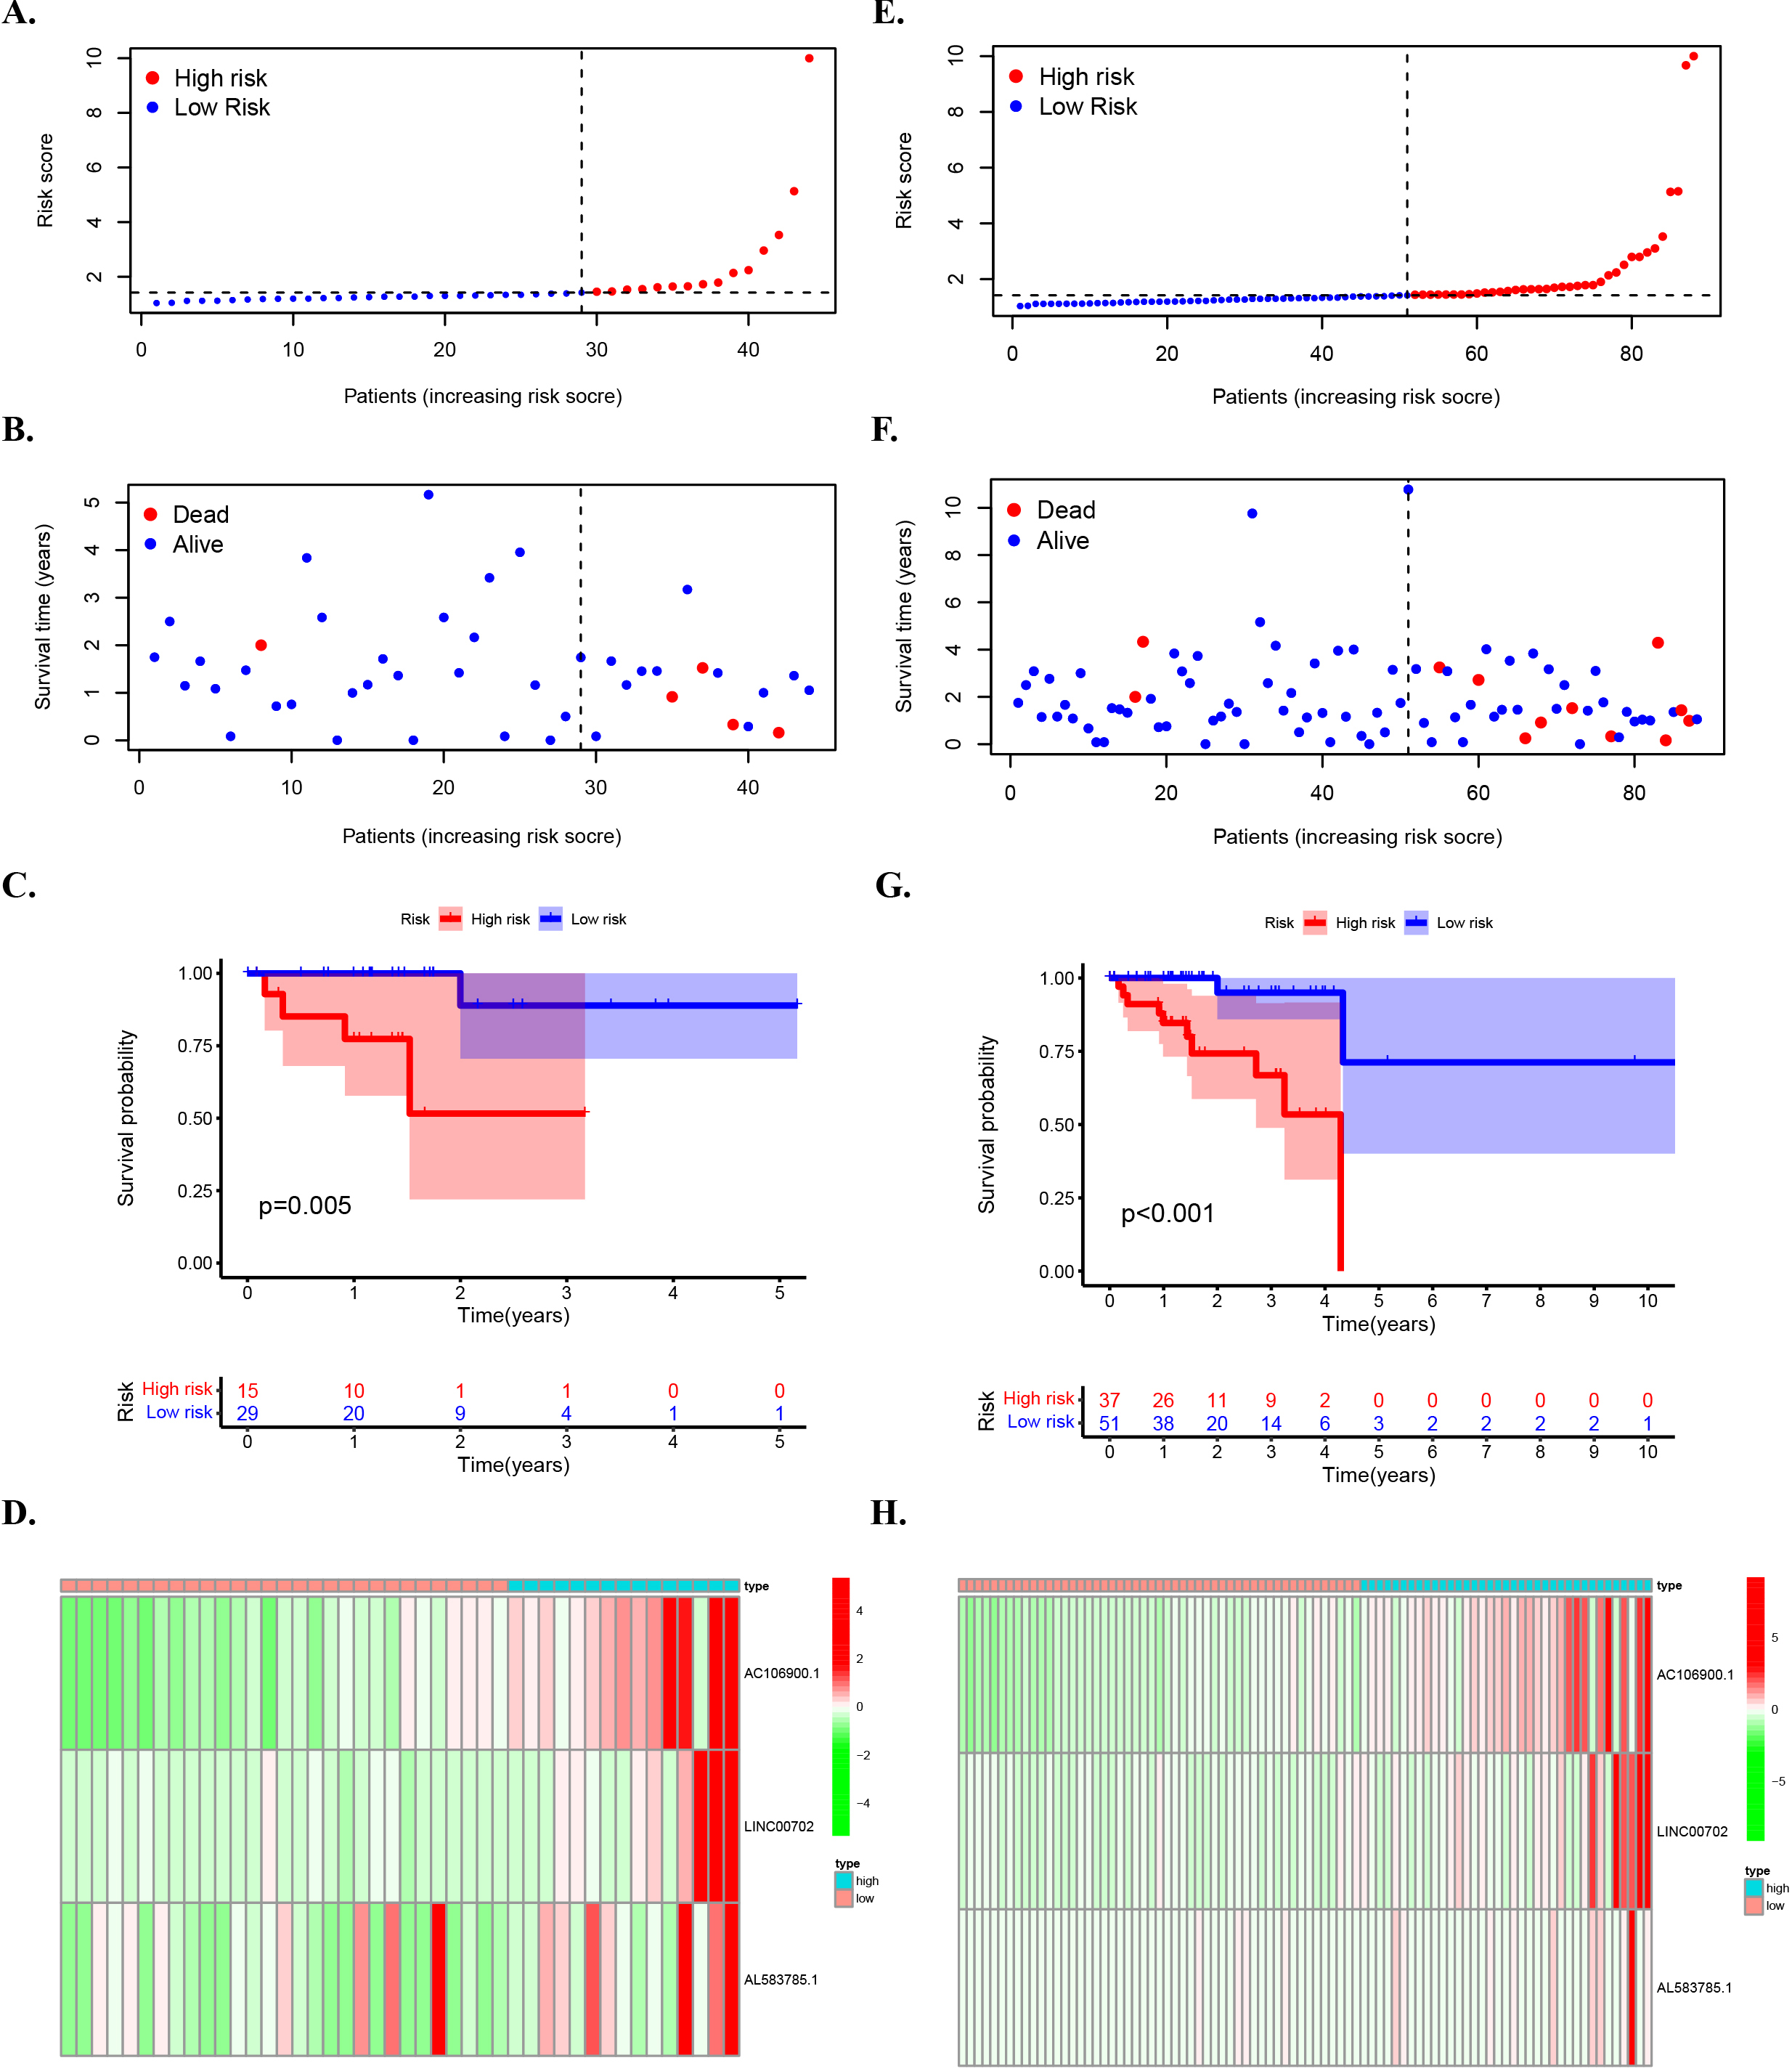
3.3The prognostic value of risk patterns in testing set and entire set
The high risk group (
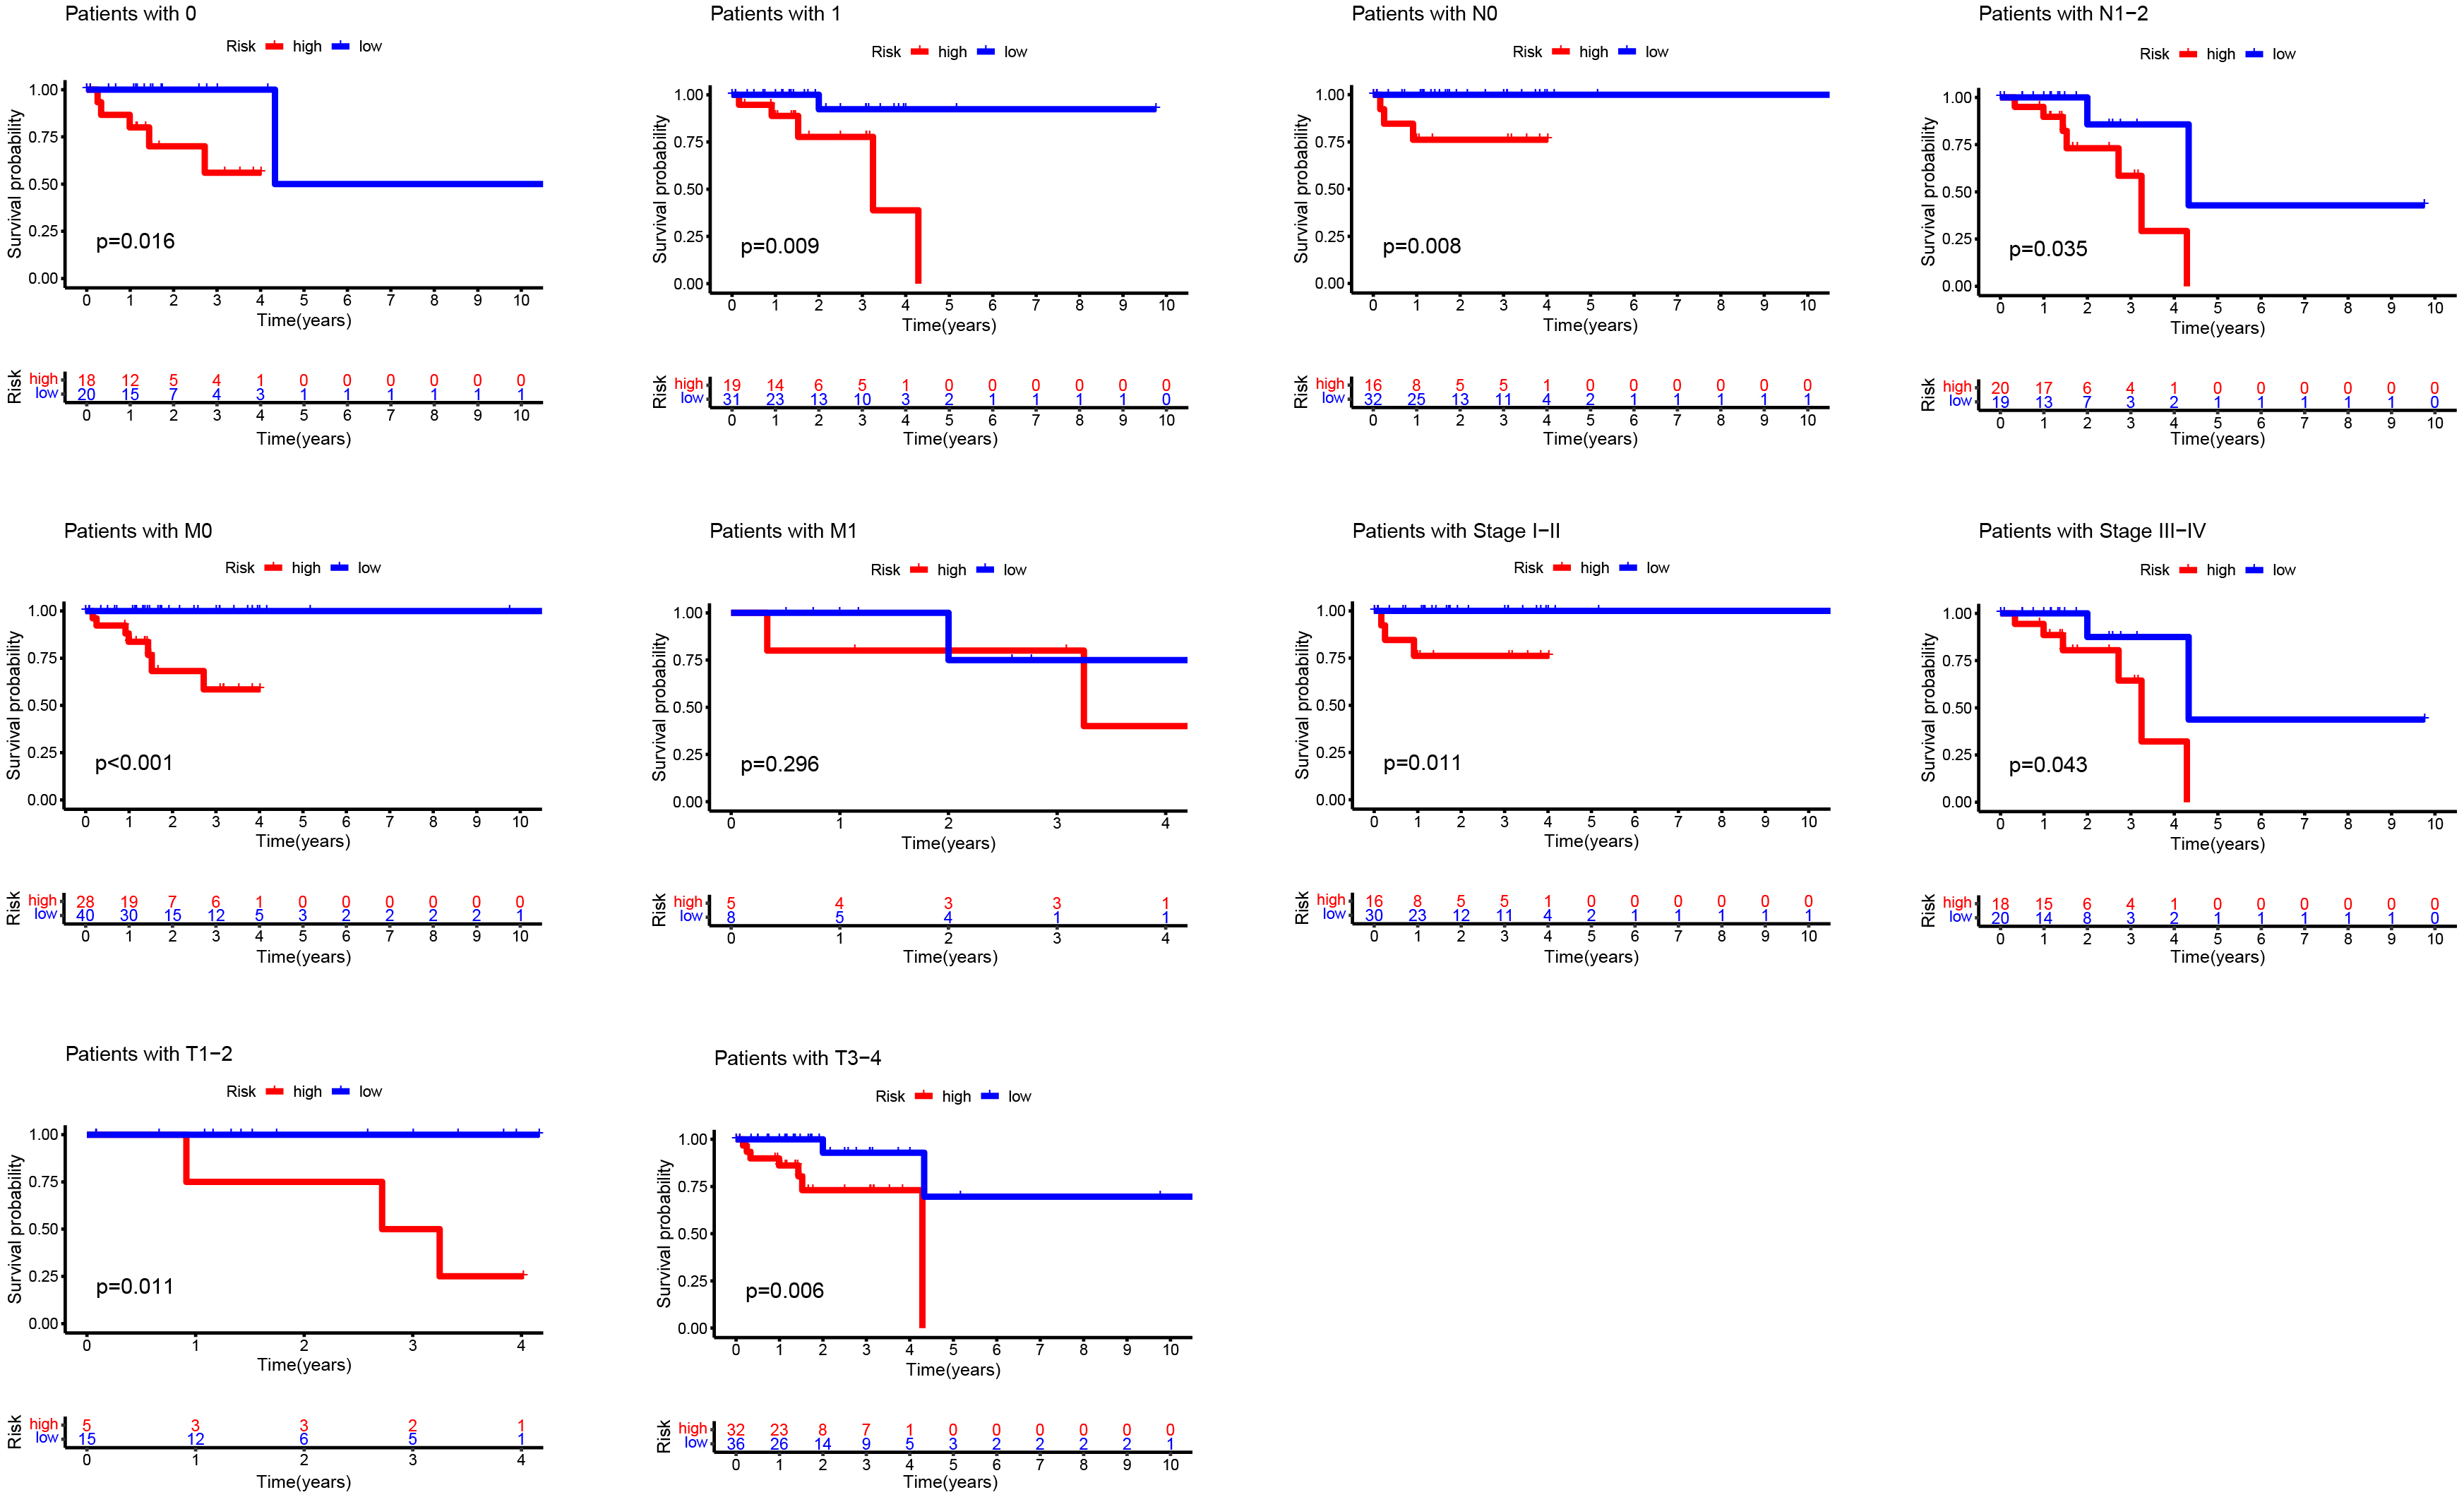
3.4Kaplan-Meier curves of OS differences stratifified by gender, tumor grade, or TNM stage between the high- and low-risk groups in the TCGA entire set
Then, OS differences were analyzed for different clinicopathological features. According to gender and other characteristics, OS of the low-risk group was always higher than that of the high-risk group, which also confirmed the superiority of an accurate prediction model from another perspective (Fig. 5).
Figure 5.
Kaplan-Meier curves of OS differences stratifified by gender, tumor grade, or TNM stage between the high- and low-risk groups in the TCGA entire set.
3.5Prognostic risk models for M6A-associated lncRNAs and clinical features of READ were evaluated in the TCGA entire set
Figure 6.
Prognostic risk models for M6A-associated lncRNAs and clinical features of READ were evaluated in the TCGA entire set. (A) Multivariate Cox regression analysis of forest map for the whole group. (B) ROC curve of the train set,test set and the whole set.
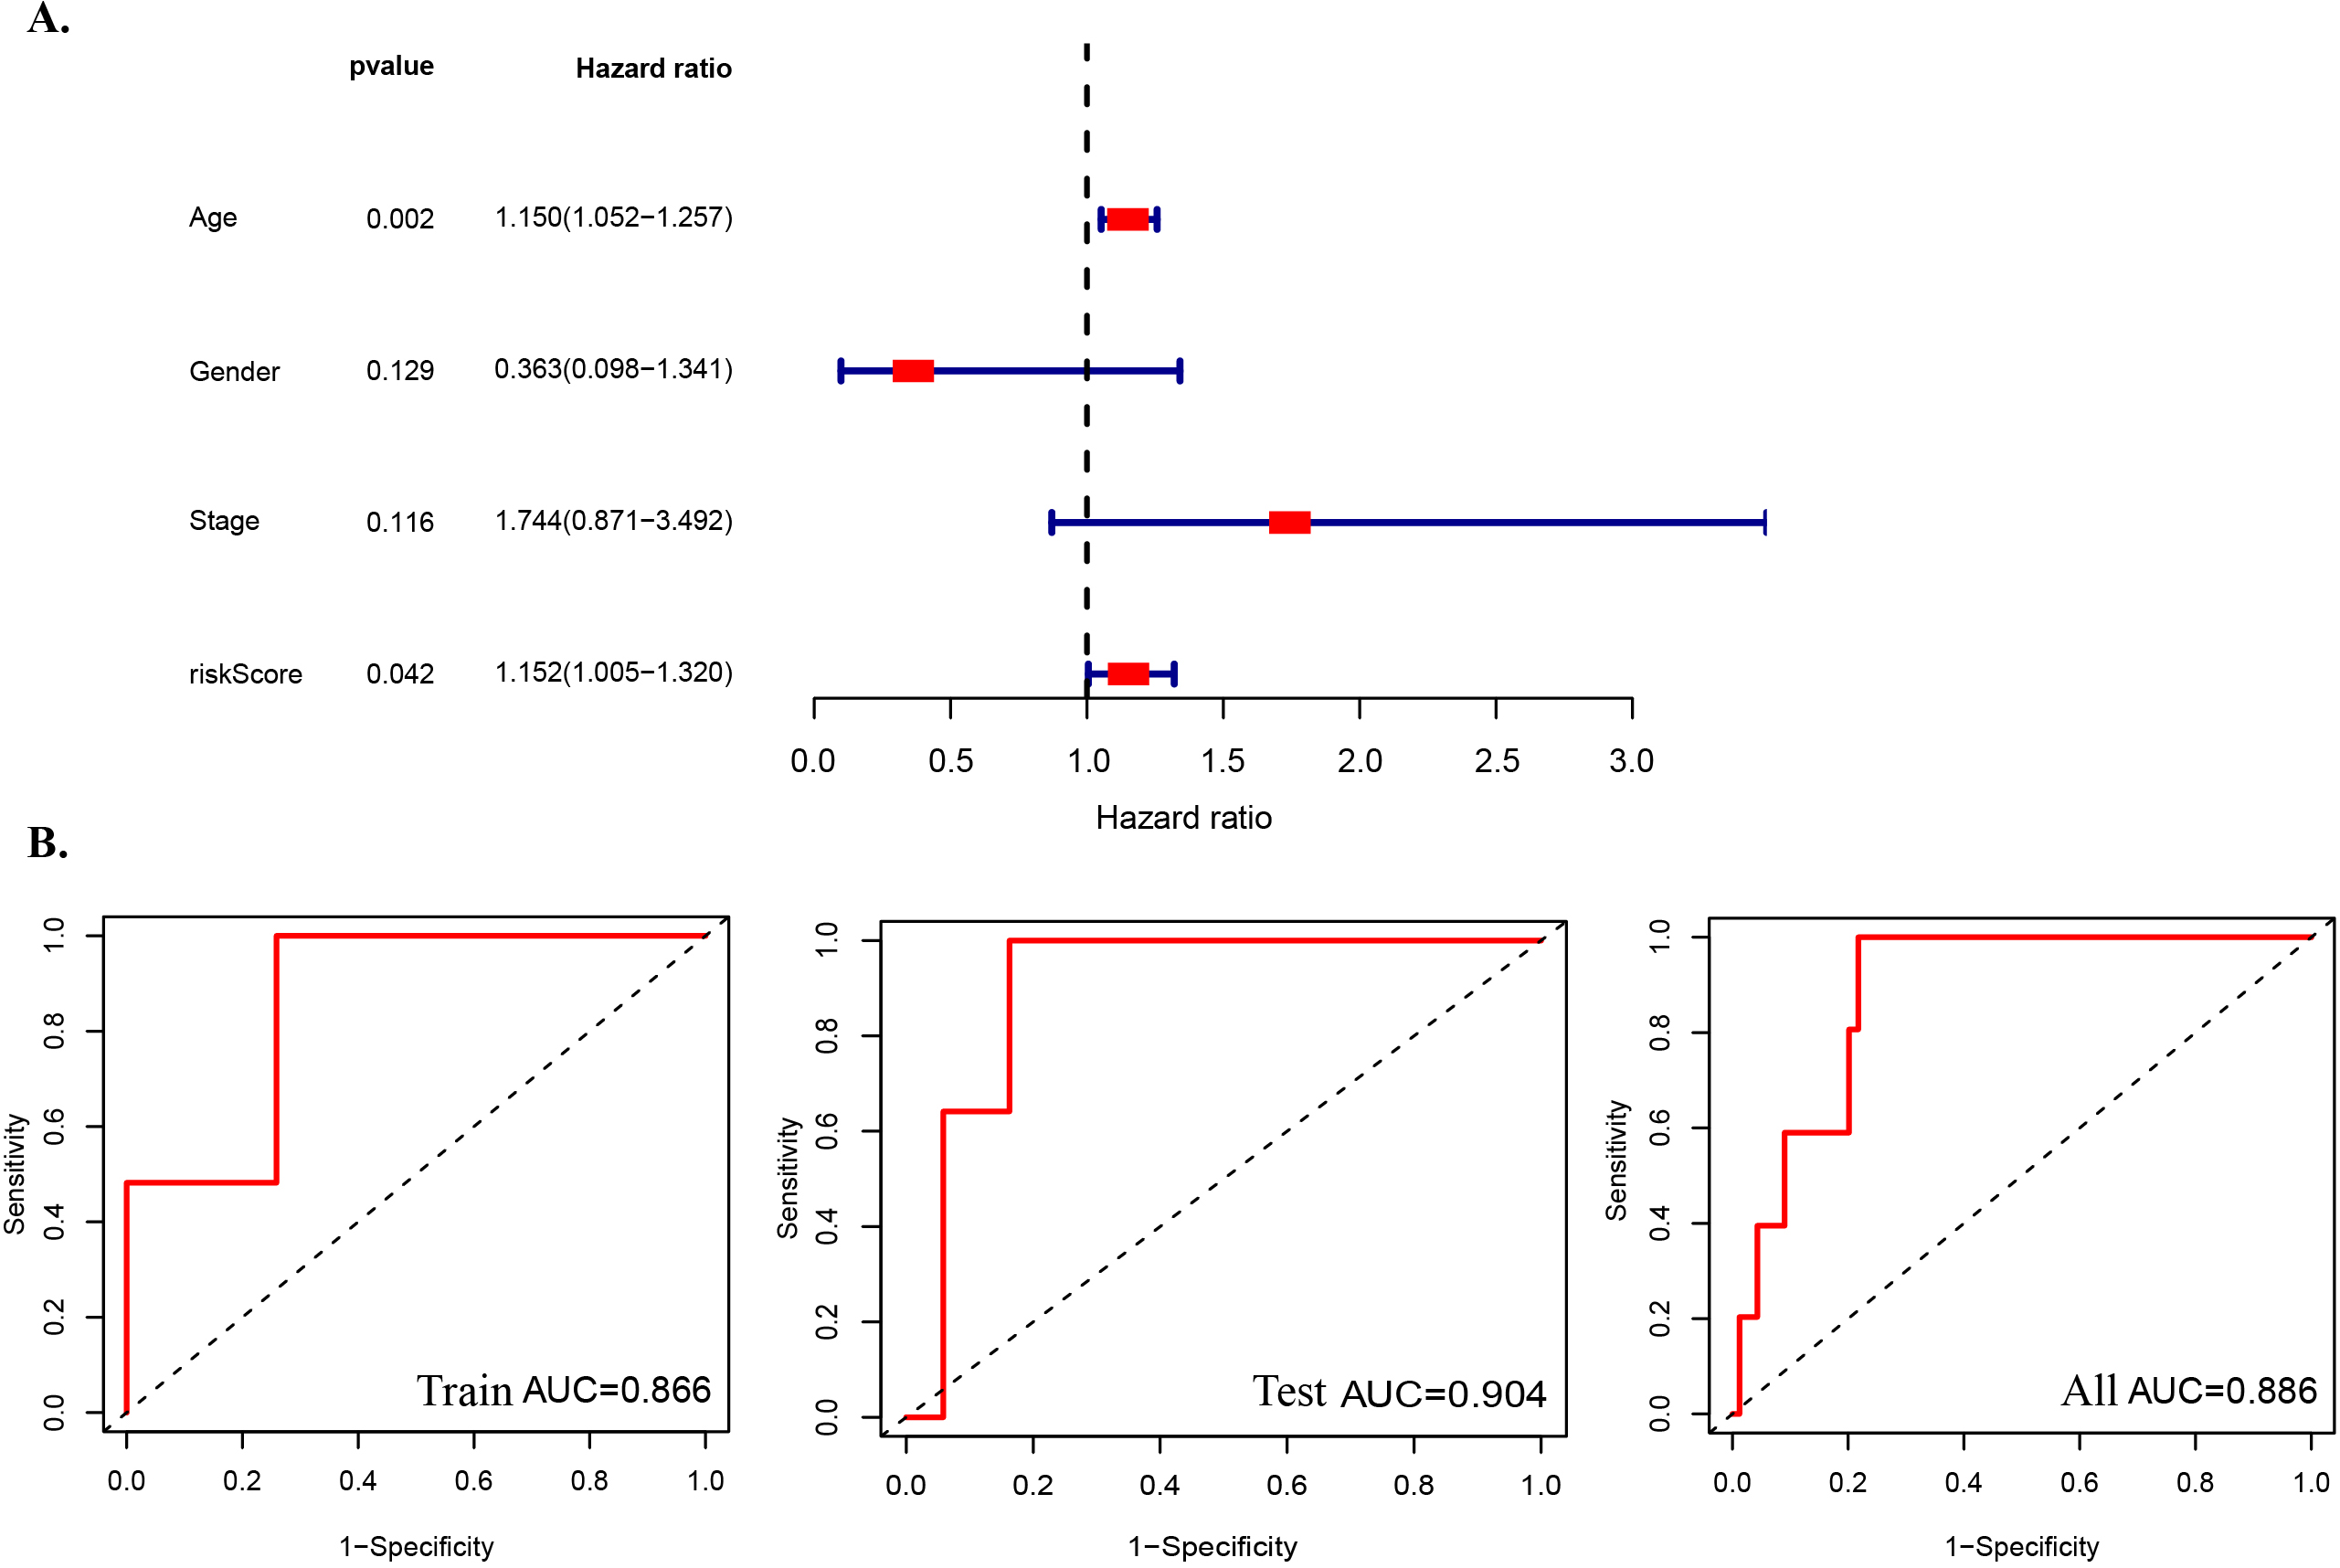
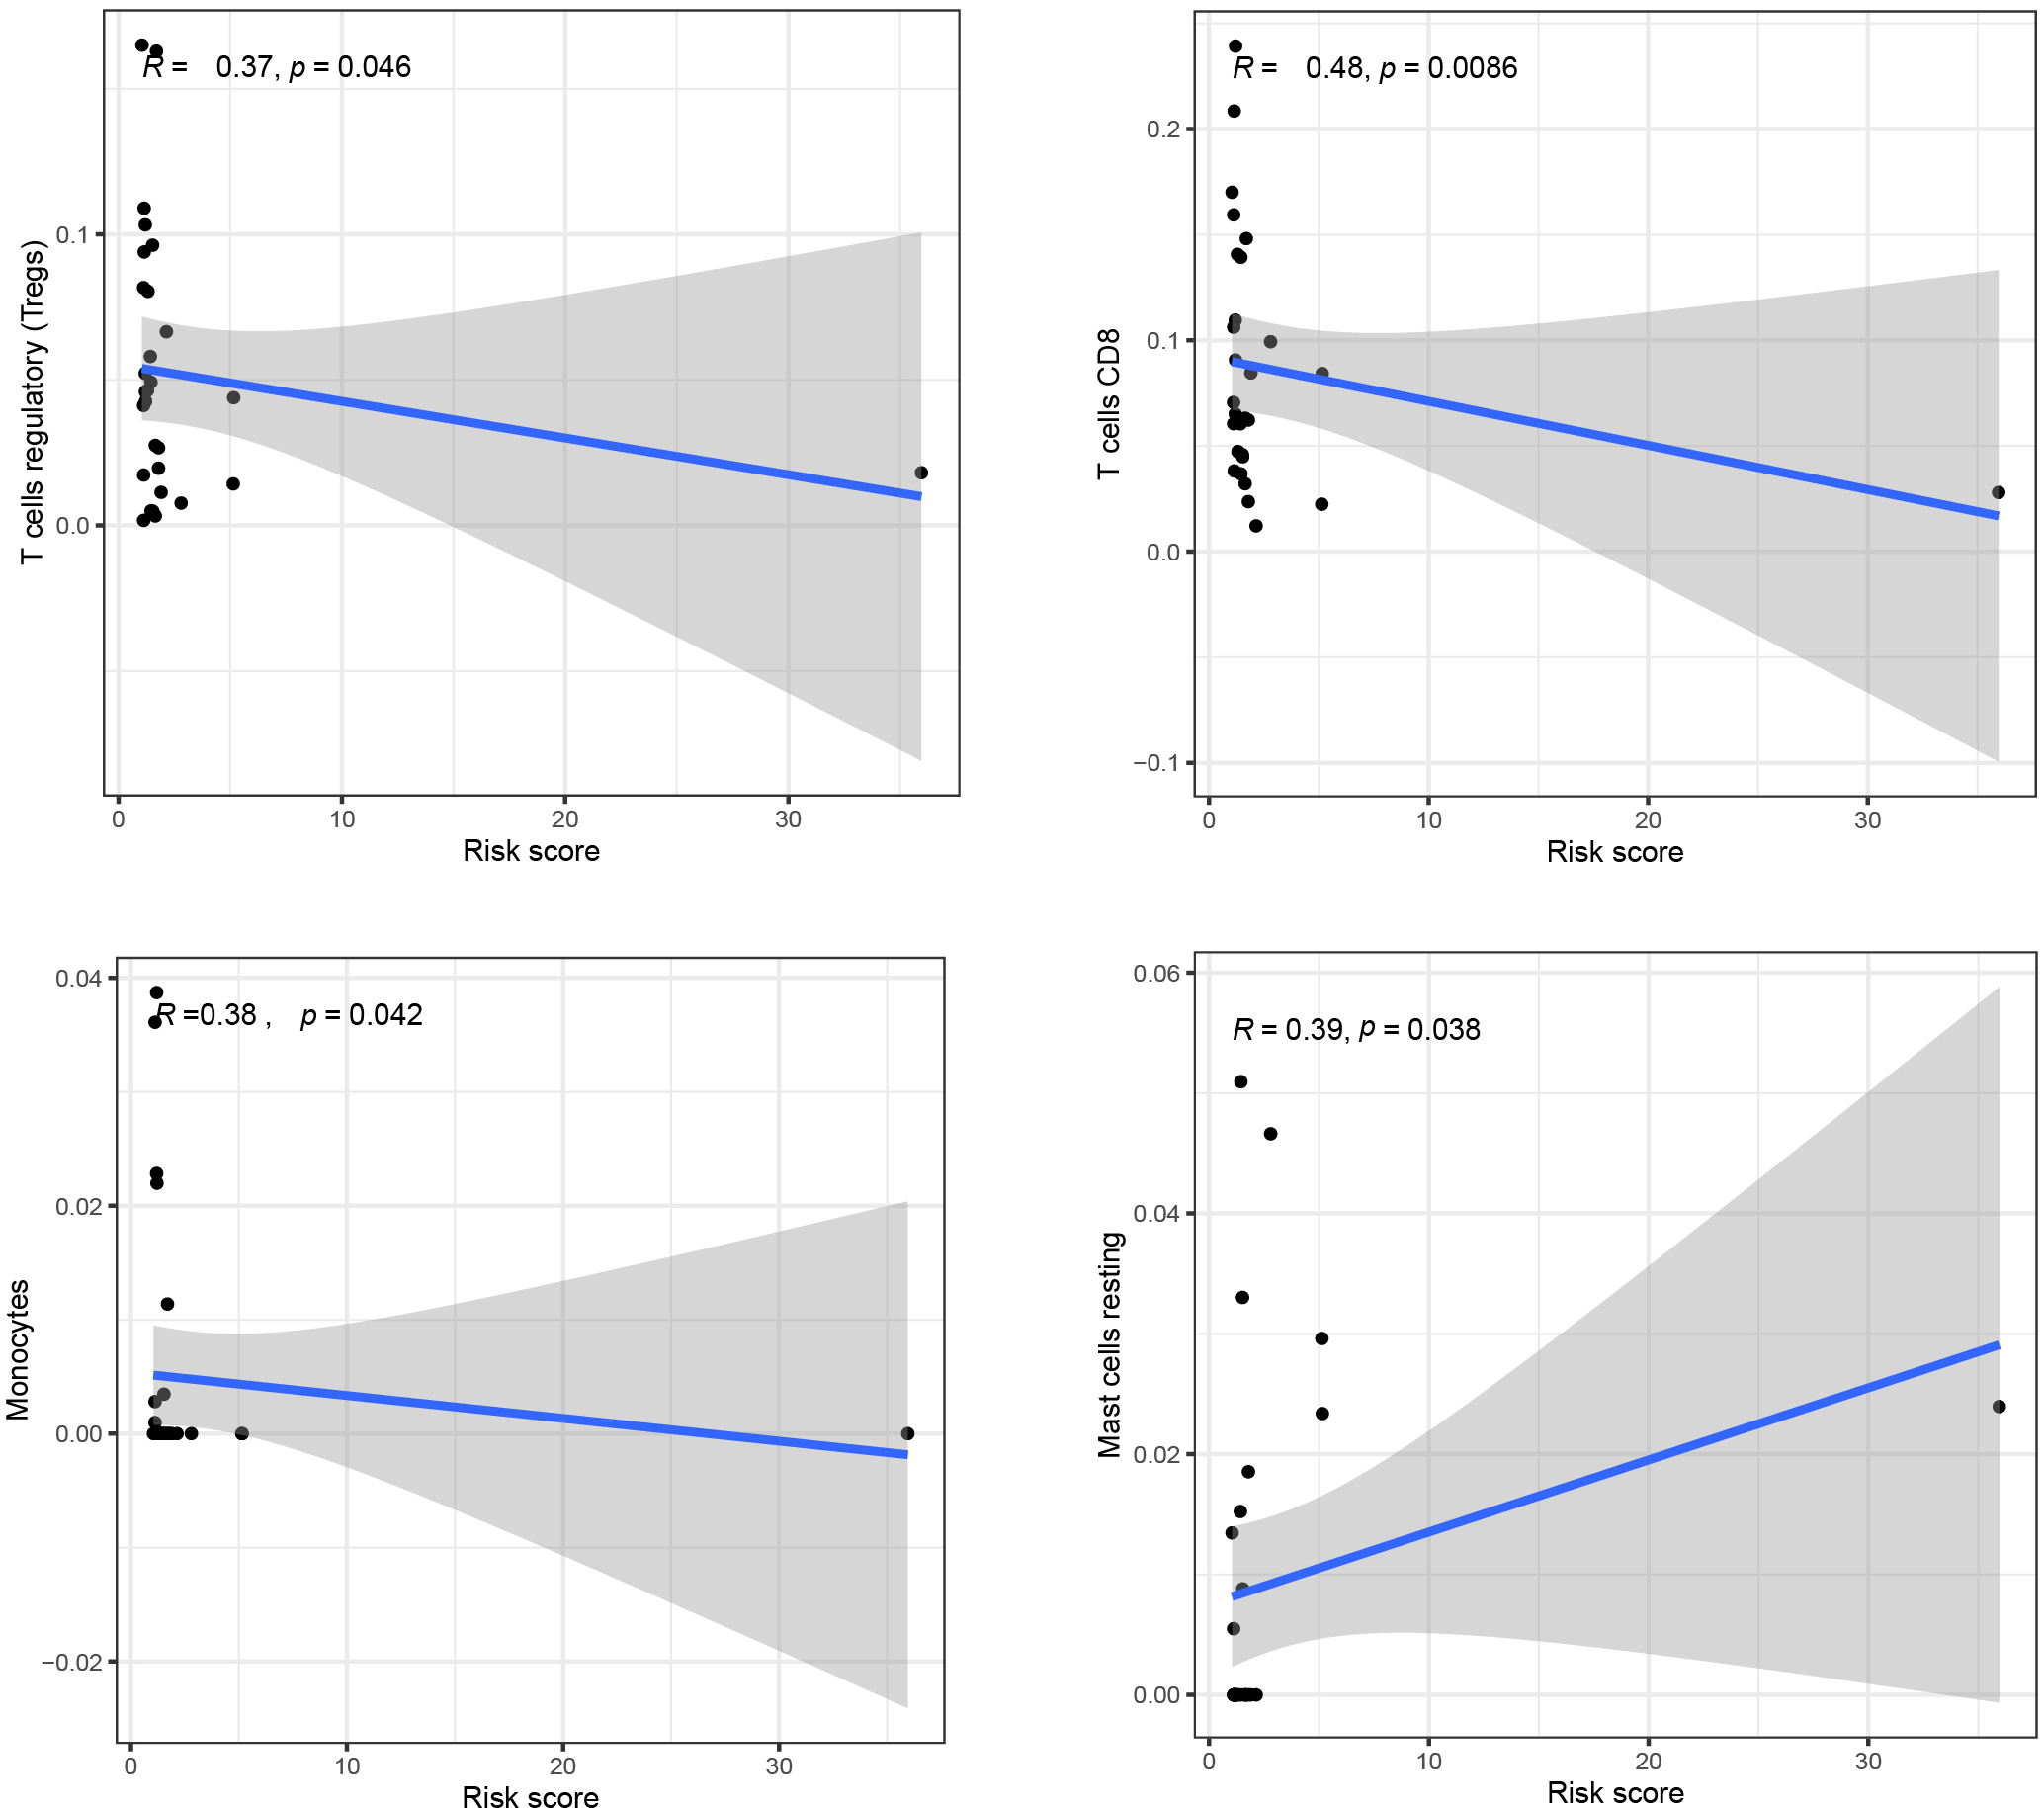
Figure 7.
Scatter plot of patient’s immune cells and risk score in READ patients.
Multivariate Cox regression analysis across the entire set revealed that the risk model consisting of three m6A-associated lncRNAs had independent prognostic characteristics of READ (Fig. 6A). As we know, AUC (area under the ROC curve) is used to better assess the susceptibility of risk scores in predicting outcomes in patients with READ. Our results showed that the AUC of risk score was 0.904 in the training set, 0.866 in the test set and 0.886 in the overall data set (Fig. 6B). It can be seen that the difference between them is very small, that is to say, the AUC of the three risk scores is relatively stable, and as the value of the three m6A-related lncRNAs is greater than 0.85, it indicates that the three m6A-related lncRNAs have good prognostic risk prediction value for READ.
3.6Scatter plot of patient’s immune cells and risk score in READ patients
We analyzed the immune correlation between immune cells and risk score and plotted scatter plots of patient risk score and immune cell content, We found that the contents of T cell regulatory (
Figure 8.
Go and GSEA enrichment analysis of DEG between high-risk and low-risk groups. Volcano plot shows the differentially expressed mRNAs (DE-mRNAs) between high-risk and low-risk groups. Gene ontology enrichment analysis of differentially expressed genes in high-risk and low-risk groups. (C) The GSEA gene accumulation results showed that the high subpopulations were enriched in the Proximal_tubule_bicarbonate_reclamation pathway. This study shows that the
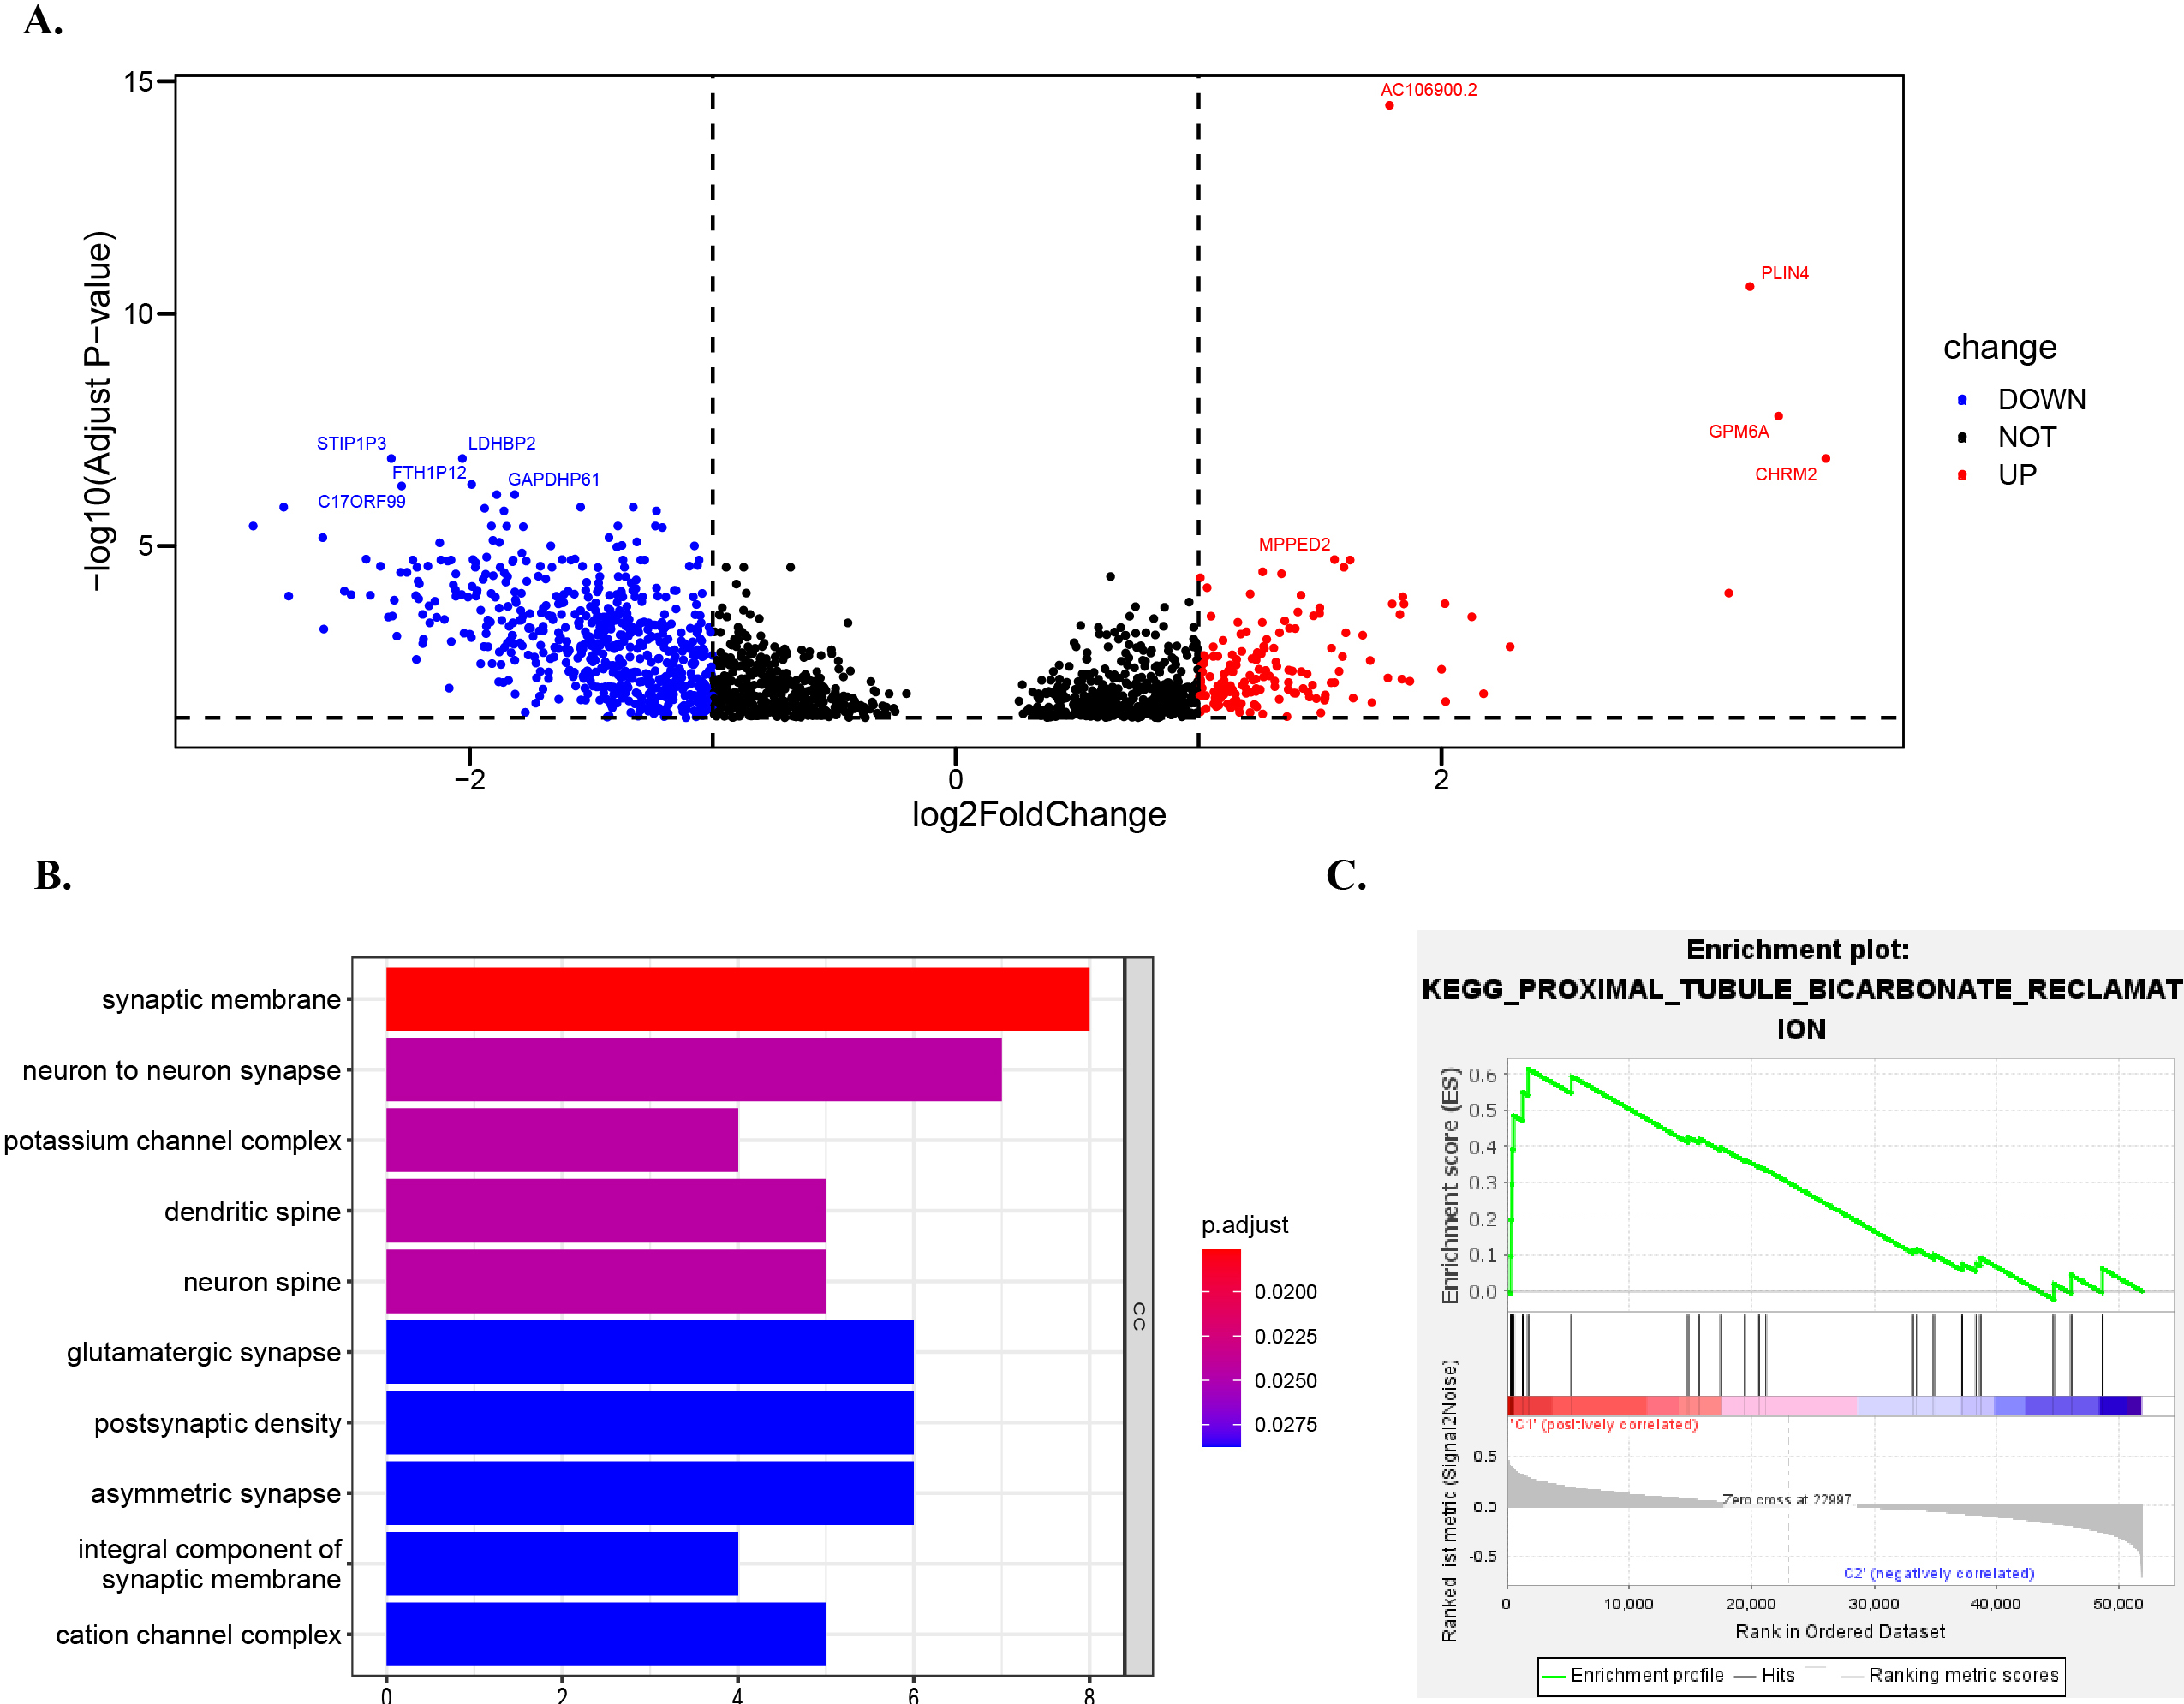
3.7Go and GSEA enrichment analysis of DEG between high-risk and low-risk groups
We analyzed the gene differences of mRNA expression levels in the samples of the whole concentrated low-risk group and high-risk group, and the results were represented by the volcano map. CHRM2 (log2FoldChange
4.Discussion
Colorectal cancer is one of the most common cancers in the world. Disease-specific mortality in developed countries is close to 33% [23]. Colorectal cancer accounts for about 30% of CRCs, and its incidence is significantly higher than colon cancer [24]. For patients with advanced rectal adenocarcinoma, they are faced with more problems, such as older age, larger tumor diameter, higher metastasis rate, poor differentiation and high recurrence rate [25]. In terms of treatment methods, the current treatment of CRC includes surgery, radiotherapy and chemotherapy, molecular targeted therapy [26] and immune checkpoint therapy [27]. However, the survival time of colorectal cancer patients can be improved by surgical techniques and adjuvant radiotherapy and chemotherapy is very limited, including chemical resistance and other reasons, the 5-year survival rate of colorectal cancer patients is still very low [28]. Compared with colorectal cancer surgery, rectal cancer surgery is more complex, including low anterior resection, abdominal perineectomy, and total internal rectotomy [29]. The treatment of rectal cancer patients is associated with more problems: For example, postoperative local recurrence of rectal cancer is more common than colorectal cancer, mainly due to the inability of rectal adenocarcinoma to obtain wide margins and lack of blood barrier, which leads to the limitation of the availability of radiotherapy due to the tumor itself [29]. In addition, the risk of prostate cancer and rectal cancer increases after radiotherapy [30]. It would be beneficial to identify reliable and practical molecular biomarkers that contribute to the diagnosis and treatment process of CRC, and it has become possible to develop biomarkers that help identify patients’ responses to cancer diagnosis, management and monitoring [20]. Overall, we were able to identify and validate a reliable prognostic model on various dimensions as a biomarker for rectal adenocarcinoma, thus helping clinicians to develop better treatment options.
In our model, Gene Coef value of LINC00702 is the largest, and we believe that the expression level of this Gene shows a positive correlation with risk score. It is noteworthy that this Gene has been proved to inhibit cell growth and metastasis by regulating PTEN in colorectal cancer, so it shows a down-regulation trend in CRC [31]. Because the blood supply, function and environmental carcinogens of the colon and rectum are different. Therefore, the clinical features, pathological stages and prognosis of colorectal cancer in different primary sites are often different [32]. In addition, this gene is highly expressed in malignant meningioma tissues and ovarian cancer tissues [33, 34], which may play a carcinogenic function in malignant tumor and cancer progression. In a prognostic evaluation model of renal cell carcinoma with 10 lncRNAs, the risk coefficient of LINC00702 is 0.5327 [35], which is consistent with our results. Therefore, in the next research, we should focus on the signaling pathway and regulatory factors of LINC00702 gene. Thus, there is an opportunity to identify new therapeutic targets for rectal adenocarcinoma.
Currently, the selection of specific treatment strategies for rectal cancer depends on pathological type, degree of differentiation, depth of tumor invasion, presence of regional lymph node (LN) metastasis and other factors that can predict tumor invasiveness and prognosis [36]. Our study also explores the predictive power of models in these directions and improves the possibility of finding effective biomarkers. At present, TNM staging transmits the anatomical progress of the disease and is used in daily clinical practice, and TNM staging provides relatively accurate prognostic stratification for patients with early, advanced, and advanced colorectal cancer [37]. For colorectal cancer, most current guidelines rely on TNM classification of treatment groups [38]. These studies proved that TMN stages are common and accurate in clinical classification of rectal adenocarcinoma. In our study, the three m6A-related prognostic lncRNAs constructed by us showed that the OS of the low-risk group was consistently superior to that of the high-risk group in stages M0 and M1, N0 and N1-2, and T1-2 and T3-4. Therefore, the existence of this model is more important for predicting the survival outcome.
As one of the characteristics of tumor, immune cell infiltration is a key factor affecting the effect of tumor immunotherapy [39]. In a study of 48 patients with colorectal cancer, after receiving adjuvant therapy, the biggest difference in immune infiltration of the patients was the increase of CD8+ content in the metastatic foci [40]. CD8 density was higher in colorectal cancer metastases than in patients with primary tumors, and there was no widespread loss of immunity in metastatic tumors. This may also reflect the development of the immunosuppressive microenvironment in the primary tumor over time [41]. In other words, the immune status of the metastatic tumor is better than that of the primary tumor. In this case, the content of T cells, including CD8+, is relatively high. In this study, the immune infiltration results of READ patients were analyzed. We found that the degree of T cell regulatory and T cell CD8 cell infiltration was negatively correlated with the risk score, which was consistent with the trend of previous studies. In addition, studies have found that primary colorectal cancer extracellular vesicles derived mononuclear cells and non-activated macrophages of the immune phenotype and secretion, make it have M1 reaction [42], in our study of monocytes in risk score in a negative correlation, that is to say, monocyte content is higher, the risk score is low, This trend is consistent with the relationship between monocytes and M1-type responses in previous studies. Currently, it has been found that patients with low angiogenesis and low mast cell density in CRC have a longer survival rate than those with high vascularization and high mast cell density [43], and several different approaches to target and control mast cell and mast cell activation have been developed as potential therapies [44]. In our study, the immune correlation analysis between immune cells and risk score Mast cells R was positive and the size was 0.39. The absolute value of coefficient was the largest among valuable immune cells. Mast cells, monocytes, T cells should be followed in the next study. T cells CD8 cell infiltration to better understand what role they are involved in the immune response in rectal adenocarcinoma and to find more feasible therapies. Although the mutation process is the same among colorectal cancer tumor types, the researchers revealed significant differences in the immune microenvironment [45], which also indicates the importance of exploring the microenvironment of rectal adenocarcinoma and the higher weight of its verification function. The results of our study were consistent with those of previous studies, which also confirmed that the prediction results of our risk model composed of 3 m6A-related prognostic lncRNAs were more convincing.
Analysis of microbiological differences of lesions at different primary sites is a necessary condition for the selection of individualized treatment for cancer including rectal adenocarcinoma [46]. Through GO enrichment analysis results, we found that in terms of cell composition, synaptic membrane cells were significantly enriched. It has been confirmed by literatures that in the pathogenesis of pancreatic cancer, nerve invasion through the synaptic membrane of nerve endings destroys the normal structure of nerve fibers and even disappears. As we all know, pancreatic cancer and rectal adenocarcinoma are both digestive system cancers, and there are abundant trophic nerves in the pancreas or outside, as well as in the dorsal and lateral rectum [47, 48]. Therefore, in the next stage, we should focus on the pathological changes of synaptic membrane in rectal adenocarcinoma as the entry point to explore the origin and pathogenesis of tumor through different tumor landscapes. Besides synaptic membrane synthesis enzymes between neurons cells was significantly enriched in high-risk subgroups, also it is important to note that the researchers from a patient of primary pancreatic neuroendocrine tumor tissue characterization of a cell line, through the function of the cell mutations to rich process including the synthesis enzyme related effect between neurons, And it can serve as a model of a new treatment [49], GO through analysis of part accumulation as a result, we believe that the study of pancreatic lesions tumor and straight lint adenocarcinoma cells may have important significance, the microscopic lens diseases to observe difference of cells with change, help to clear understanding of these highly heterogeneity of cancer.
GSEA results showed significant correlation between fructose and mannose metabolism in the high-risk subgroup of rectal adenocarcinoma. At present, the role of fructose metabolism in the pancreas has been comprehensively studied [50]. Fructose is easily obtained through diet in daily life. At present, it has become a recognized fact that nutritional species play a role in tumor microenvironment and affect the progress of cancer, and the current focus should be on different cancer studies on fructose consumption and metabolism pathways [51]. Currently, the association between fructose and mannose metabolism and rectal adenocarcinoma has not been accurately described. Therefore, in the next section of research, we should focus on exploring metabolic pathways and which parts are central to cell growth and survival.
With the advancement of research, various tumor markers, including CA199, have been implemented for early clinical screening. We anticipate that through further research and improved genetic detection methods, in conjunction with relevant clinical data and epidemiological characterization, the proposed lncRNA model in this study holds significant potential for disease early detection, diagnosis, and treatment. Furthermore, we envision a progressively expanding application of gene therapy in clinical diagnostics and therapeutics. Our study also has certain limitations. Firstly, the predictive model we developed is based on a publicly available database with limited information. Moreover, while our findings provide valuable data for the selection of early screening markers for rectal adenocarcinoma (READ), it is crucial to note that clinical validation using large sample sizes remains lacking and should be prioritized in future research endeavors. Additionally, further exploration of the specific pathways and mechanisms underlying m6A-related lncRNAs in the prognostic signaling of rectal adenocarcinoma is necessary to enhance the accuracy of immunotherapy. Nevertheless, our study provides valuable insights for biomarker screening in patients with READs. The key advantage of this index is its ability to offer a preliminary assessment for tumor detection without invasive colonoscopy, enhancing the likelihood of early tumor identification and treatment initiation while potentially alleviating patient discomfort associated with colonoscopy. This study offers robust data support for early diagnosis.
5.Conclusion
Our research has developed a three-component m6A lncRNA rectal gland cancer prognosis model, which has been validated in multiple dimensions. This model shows potential as biomarkers for the prognosis of rectal gland cancer, aiming to provide clinicians with an accurate index for assessing adenocarcinoma duration and enabling early detection of rectal gland carcinoma. Additionally, it identifies promising targets for immunotherapy and opens up new strategies combining early detection, surveillance, and treatment while serving as a foundation for future animal and clinical trials.
Author contributions
Contributing to the conception and design: Wei Zhan, Shunkang Yan.
Analyzing and interpreting data: Jiandong Zhang, Lianghe Li, Gang Chen, Wen Chen.
Drafting the article: Wei Zhan, Shunkang Yan.
Revising it critically for important intellectual content: Zhongsheng Chen.
Approving the final version to be published: All authors.
Data availability statement
The data that support the findings of this study are openly available on www.cancer.gov. The GDC Data Portal is a robust data-driven platform that allows cancer researchers and bioinformaticians to search and download cancer data for analysis.
Funding
Guizhou Provincial Science and Technology Support Project (Qian Kehe Support [2021] General 033). National Natural Science Foundation of China (No: 82060523). 2023 Excellent Reserve Talents of Affiliated Hospital of Guizhou Medical University (gyfyxkrc-2023-08). Cultivate Project 2021 for National Natural Science Foundation of China from Affiliated Hospital of Guizhou Medical University (gyfynsfc-2021-9).
Conflict of interest
The authors confirm that there are no conflicts of interest.
References
[1] | F. Bray, J. Ferlay, I. Soerjomataram, R.L. Siegel, L.A. Torre and A. Jemal, Global cancer statistics 2018: GLOBOCAN estimates of incidence and mortality worldwide for 36 cancers in 185 countries, CA Cancer J Clin. 68: ((2018) ), 394–424. |
[2] | T. Machackova, V. Prochazka, Z. Kala and O. Slaby, Translational Potential of MicroRNAs for Preoperative Staging and Prediction of Chemoradiotherapy Response in Rectal Cancer, Cancers (Basel). 11: ((2019) ). |
[3] | M.S. Roh, L.H. Colangelo, M.J. O’Connell, G. Yothers, M. Deutsch, C.J. Allegra, M.S. Kahlenberg, L. Baez-Diaz, C.S. Ursiny, N.J. Petrelli and N. Wolmark, Preoperative multimodality therapy improves disease-free survival in patients with carcinoma of the rectum: NSABP R-03, J Clin Oncol. 27: ((2009) ), 5124–30. |
[4] | S. Hasegawa, R. Takahashi, K. Hida, K. Kawada and Y. Sakai, Revisiting the treatment strategy for rectal cancer through the pattern of local recurrence, Eur J Surg Oncol. 42: ((2016) ), 1674–1679. |
[5] | A. Akhavan, F. Binesh and A. Soltani, Survival of rectal cancer in Yazd, Iran, Asian Pac J Cancer Prev. 15: ((2014) ), 4857–60. |
[6] | P.S. Tawadros, I.M. Paquette, A.M. Hanly, A.F. Mellgren, D.A. Rothenberger and R.D. Madoff, Adenocarcinoma of the rectum in patients under age 40 is increasing: impact of signet-ring cell histology, Dis Colon Rectum. 58: ((2015) ), 474–8. |
[7] | I.A. Roundtree, M.E. Evans, T. Pan and C. He, Dynamic RNA Modifications in Gene Expression Regulation, Cell. 169: ((2017) ), 1187–1200. |
[8] | X. Deng, R. Su, H. Weng, H. Huang, Z. Li and J. Chen, RNA N(6)-methyladenosine modification in cancers: current status and perspectives, Cell Res. 28: ((2018) ), 507–517. |
[9] | S. Shen, R. Zhang, Y. Jiang, Y. Li, L. Lin, Z. Liu, Y. Zhao, H. Shen, Z. Hu, Y. Wei and F. Chen, Comprehensive analyses of m6A regulators and interactive coding and non-coding RNAs across 32 cancer types, Mol Cancer. 20: ((2021) ), 67. |
[10] | H. Guo, B. Wang, K. Xu, L. Nie, Y. Fu, Z. Wang, Q. Wang, S. Wang and X. Zou, m(6)A Reader HNRNPA2B1 Promotes Esophageal Cancer Progression via Up-Regulation of ACLY and ACC1, Front Oncol. 10: ((2020) ), 553045. |
[11] | C. Zhang, M. Zhang, S. Ge, W. Huang, X. Lin, J. Gao, J. Gong and L. Shen, Reduced m6A modification predicts malignant phenotypes and augmented Wnt/PI3K-Akt signaling in gastric cancer, Cancer Med. 8: ((2019) ), 4766–4781. |
[12] | T. Xia, X. Wu, M. Cao, P. Zhang, G. Shi, J. Zhang, Z. Lu, P. Wu, B. Cai, Y. Miao and K. Jiang, The RNA m6A methyltransferase METTL3 promotes pancreatic cancer cell proliferation and invasion, Pathol Res Pract. 215: ((2019) ), 152666. |
[13] | W. Huang, G. Li, Z. Wang, L. Zhou, X. Yin, T. Yang, P. Wang, X. Teng, Y. Feng and H. Yu, A Ten-N(6)-Methyladenosine (m(6)A)-Modified Gene Signature Based on a Risk Score System Predicts Patient Prognosis in Rectum Adenocarcinoma, Front Oncol. 10: ((2020) ), 567931. |
[14] | X. Liu, L. Liu, Z. Dong, J. Li, Y. Yu, X. Chen, F. Ren, G. Cui and R. Sun, Expression patterns and prognostic value of m(6)A-related genes in colorectal cancer, Am J Transl Res. 11: ((2019) ), 3972–3991. |
[15] | A. Necsulea, M. Soumillon, M. Warnefors, A. Liechti, T. Daish, U. Zeller, J.C. Baker, F. Grutzner and H. Kaessmann, The evolution of lncRNA repertoires and expression patterns in tetrapods, Nature. 505: ((2014) ), 635–40. |
[16] | M. Kazimierczyk, M.K. Kasprowicz, M.E. Kasprzyk and J. Wrzesinski, Human Long Noncoding RNA Interactome: Detection, Characterization and Function, Int J Mol Sci. 21: ((2020) ). |
[17] | P. Wu, Y. Mo, M. Peng, T. Tang, Y. Zhong, X. Deng, F. Xiong, C. Guo, X. Wu, Y. Li, X. Li, G. Li, Z. Zeng and W. Xiong, Emerging role of tumor-related functional peptides encoded by lncRNA and circRNA, Mol Cancer. 19: ((2020) ), 22. |
[18] | J.A. West, C.P. Davis, H. Sunwoo, M.D. Simon, R.I. Sadreyev, P.I. Wang, M.Y. Tolstorukov and R.E. Kingston, The long noncoding RNAs NEAT1 and MALAT1 bind active chromatin sites, Mol Cell. 55: ((2014) ), 791–802. |
[19] | A. Garzia, C. Meyer, P. Morozov, M. Sajek and T. Tuschl, Optimization of PAR-CLIP for transcriptome-wide identification of binding sites of RNA-binding proteins, Methods. 118-119: ((2017) ), 24–40. |
[20] | H.H. Oh and Y.E. Joo, Novel biomarkers for the diagnosis and prognosis of colorectal cancer, Intest Res. 18: ((2020) ), 168–183. |
[21] | A. Demir, O. Alan and E. Oruc, Tumor budding for predicting prognosis of resected rectum cancer after neoadjuvant treatment, World J Surg Oncol. 17: ((2019) ), 50. |
[22] | W. Makalowski and V. Shabardina, Bioinformatics of nanopore sequencing, J Hum Genet. 65: ((2020) ), 61–67. |
[23] | X. Ge, Y. Chen, X. Liao, D. Liu, F. Li, H. Ruan and W. Jia, Overexpression of long noncoding RNA PCAT-1 is a novel biomarker of poor prognosis in patients with colorectal cancer, Med Oncol. 30: ((2013) ), 588. |
[24] | C.E. Bailey, C.Y. Hu, Y.N. You, B.K. Bednarski, M.A. Rodriguez-Bigas, J.M. Skibber, S.B. Cantor and G.J. Chang, Increasing disparities in the age-related incidences of colon and rectal cancers in the United States, 1975–2010, JAMA Surg. 150: ((2015) ), 17–22. |
[25] | M. Mik, M. Berut, L. Dziki, R. Trzcinski and A. Dziki, Right- and left-sided colon cancer – clinical and pathological differences of the disease entity in one organ, Arch Med Sci. 13: ((2017) ), 157–162. |
[26] | L.H. Biller and D. Schrag, Diagnosis and Treatment of Metastatic Colorectal Cancer: A Review, JAMA. 325: ((2021) ), 669–685. |
[27] | Q. Jiao, Y. Ren, A.N. Ariston Gabrie, Q. Wang, Y. Wang, L. Du, X. Liu, C. Wang and Y.S. Wang, Advances of immune checkpoints in colorectal cancer treatment, Biomed Pharmacother. 123: ((2020) ), 109745. |
[28] | P. Rawla, T. Sunkara and A. Barsouk, Epidemiology of colorectal cancer: incidence, mortality, survival, and risk factors, Prz Gastroenterol. 14: ((2019) ), 89–103. |
[29] | L. Rabeneck, S. Horton, A.G. Zauber and C. Earle, Colorectal Cancer, in: Cancer: Disease Control Priorities, Third Edition (Volume 3), H. Gelband, P. Jha, R. Sankaranarayanan and S. Horton, eds., Washington (DC), (2015) . |
[30] | D. Desautels, P. Czaykowski, Z. Nugent, A.A. Demers, S.M. Mahmud and H. Singh, Risk of colorectal cancer after the diagnosis of prostate cancer: A population-based study, Cancer. 122: ((2016) ), 1254–60. |
[31] | D. Yu, X.Y. Wang and Z.L. Jin, Linc00702 inhibits cell growth and metastasis through regulating PTEN in colorectal cancer, Eur Rev Med Pharmacol Sci. 24: ((2020) ), 3624–3632. |
[32] | N. Murphy, H.A. Ward, M. Jenab, J.A. Rothwell, M.C. Boutron-Ruault, F. Carbonnel, M. Kvaskoff, R. Kaaks, T. Kuhn, H. Boeing, K. Aleksandrova, E. Weiderpass, G. Skeie, K.B. Borch, A. Tjonneland, C. Kyro, K. Overvad, C.C. Dahm, P. Jakszyn, M.J. Sanchez, L. Gil, J.M. Huerta, A. Barricarte, J.R. Quiros, K.T. Khaw, N. Wareham, K.E. Bradbury, A. Trichopoulou, C. La Vecchia, A. Karakatsani, D. Palli, S. Grioni, R. Tumino, F. Fasanelli, S. Panico, B. Bueno-de-Mesquita, P.H. Peeters, B. Gylling, R. Myte, K. Jirstrom, J. Berntsson, X. Xue, E. Riboli, A.J. Cross and M.J. Gunter, Heterogeneity of Colorectal Cancer Risk Factors by Anatomical Subsite in 10 European Countries: A Multinational Cohort Study, Clin Gastroenterol Hepatol. 17: ((2019) ), 1323–1331 e6. |
[33] | T. Li, J. Ren, J. Ma, J. Wu, R. Zhang, H. Yuan and X. Han, LINC00702/miR-4652-3p/ZEB1 axis promotes the progression of malignant meningioma through activating Wnt/beta-catenin pathway, Biomed Pharmacother. 113: ((2019) ), 108718. |
[34] | L. Wang, T.Y. Ye, H. Wu, S.Y. Chen, J.R. Weng and X.W. Xi, LINC00702 accelerates the progression of ovarian cancer through interacting with EZH2 to inhibit the transcription of KLF2, Eur Rev Med Pharmacol Sci. 23: ((2019) ), 201–208. |
[35] | B. Chen, D. Dong, Q. Yao, Y. Zou and W. Hu, A novel prognostic cancer-related lncRNA signature in papillary renal cell carcinoma, Cancer Cell Int. 21: ((2021) ), 545. |
[36] | J. Liu, Y. Yue, D. Han, X. Wang, Y. Fu, L. Zhang, G. Jia, M. Yu, Z. Lu, X. Deng, Q. Dai, W. Chen and C. He, A METTL3-METTL14 complex mediates mammalian nuclear RNA N6-adenosine methylation, Nat Chem Biol. 10: ((2014) ), 93–5. |
[37] | C.C. Compton, Optimal pathologic staging: defining stage II disease, Clin Cancer Res. 13: ((2007) ), 6862s–70s. |
[38] | M. Stojkovic Lalosevic, T. Milovanovic, M. Micev, M. Stojkovic, S. Dragasevic, M. Stulic, I. Rankovic, V. Dugalic, Z. Krivokapic and A. Pavlovic Markovic, Perineural invasion as a prognostic factor in patients with stage I-III rectal cancer – 5-year follow up, World J Gastrointest Oncol. 12: ((2020) ), 592–600. |
[39] | Y. Nurzat, W. Su, P. Min, K. Li, H. Xu and Y. Zhang, Identification of Therapeutic Targets and Prognostic Biomarkers Among Integrin Subunits in the Skin Cutaneous Melanoma Microenvironment, Front Oncol. 11: ((2021) ), 751875. |
[40] | M. Van den Eynde, B. Mlecnik, G. Bindea, T. Fredriksen, S.E. Church, L. Lafontaine, N. Haicheur, F. Marliot, M. Angelova, A. Vasaturo, D. Bruni, A. Jouret-Mourin, P. Baldin, N. Huyghe, K. Haustermans, A. Debucquoy, E. Van Cutsem, J.F. Gigot, C. Hubert, A. Kartheuser, C. Remue, D. Leonard, V. Valge-Archer, F. Pages, J.P. Machiels and J. Galon, The Link between the Multiverse of Immune Microenvironments in Metastases and the Survival of Colorectal Cancer Patients, Cancer Cell. 34: ((2018) ), 1012–1026 e3. |
[41] | D. Malka, A. Lievre, T. Andre, J. Taieb, M. Ducreux and F. Bibeau, Immune scores in colorectal cancer: Where are we? Eur J Cancer. 140: ((2020) ), 105–118. |
[42] | I. Popena, A. Abols, L. Saulite, K. Pleiko, E. Zandberga, K. Jekabsons, E. Endzelins, A. Llorente, A. Line and U. Riekstina, Effect of colorectal cancer-derived extracellular vesicles on the immunophenotype and cytokine secretion profile of monocytes and macrophages, Cell Commun Signal. 16: ((2018) ), 17. |
[43] | S. Yodavudh, S. Tangjitgamol and S. Puangsa-art, Prognostic significance of microvessel density and mast cell density for the survival of Thai patients with primary colorectal cancer, J Med Assoc Thai. 91: ((2008) ), 723–32. |
[44] | C.N. Noto, S.G. Hoft and R.J. DiPaolo, Mast Cells as Important Regulators in Autoimmunity and Cancer Development, Front Cell Dev Biol. 9: ((2021) ), 752350. |
[45] | B. Chen, C.R. Scurrah, E.T. McKinley, A.J. Simmons, M.A. Ramirez-Solano, X. Zhu, N.O. Markham, C.N. Heiser, P.N. Vega, A. Rolong, H. Kim, Q. Sheng, J.L. Drewes, Y. Zhou, A.N. Southard-Smith, Y. Xu, J. Ro, A.L. Jones, F. Revetta, L.D. Berry, H. Niitsu, M. Islam, K. Pelka, M. Hofree, J.H. Chen, S. Sarkizova, K. Ng, M. Giannakis, G.M. Boland, A.J. Aguirre, A.C. Anderson, O. Rozenblatt-Rosen, A. Regev, N. Hacohen, K. Kawasaki, T. Sato, J.A. Goettel, W.M. Grady, W. Zheng, M.K. Washington, Q. Cai, C.L. Sears, J.R. Goldenring, J.L. Franklin, T. Su, W.J. Huh, S. Vandekar, J.T. Roland, Q. Liu, R.J. Coffey, M.J. Shrubsole and K.S. Lau, Differential pre-malignant programs and microenvironment chart distinct paths to malignancy in human colorectal polyps, Cell. 184: ((2021) ), 6262–6280 e26. |
[46] | Y. Cui, B. Han, H. Zhang, H. Liu, F. Zhang and R. Niu, Identification of Metabolic-Associated Genes for the Prediction of Colon and Rectal Adenocarcinoma, Onco Targets Ther. 14: ((2021) ), 2259–2277. |
[47] | C. Dang, Z. Qin, Z. Ji, Y. Li, J. Zhao, E. Takashi, Z. Naito, M. Yokoyama and G. Asano, Morphological characteristics and clinical significance of nerve distribution in pancreatic cancers, Nihon Ika Daigaku Zasshi. 64: ((1997) ), 526–31. |
[48] | S. Kersting, K.P. Jung and E. Berg, [Alloplastic material in prolapse surgery: Indications and postoperative outcome of ventral rectopexy], Chirurg. 88: ((2017) ), 141–146. |
[49] | X. Lou, Z. Ye, X. Xu, M. Jiang, R. Lu, D. Jing, W. Zhang, H. Gao, F. Wang, Y. Zhang, X. Chen, Y. Qin, Q. Zhuo, X. Yu and S. Ji, Establishment and characterization of the third non-functional human pancreatic neuroendocrine tumor cell line, Hum Cell. 35: ((2022) ), 1248–1261. |
[50] | N. Krause and A. Wegner, Fructose Metabolism in Cancer, Cells. 9: ((2020) ). |
[51] | E.L. Lieu, N. Kelekar, P. Bhalla and J. Kim, Fructose and Mannose in Inborn Errors of Metabolism and Cancer, Metabolites. 11: ((2021) ). |


