
A clinical spectrum of resectable lung adenocarcinoma with micropapillary component (MPC) concurrently presenting as mixed ground-glass opacity nodules
Abstract
BACKGROUND:
In clinical practice, preoperative identification of mixed ground-glass opacity (mGGO) nodules with micropapillary component (MPC) to facilitate the implementation of individualized therapeutic strategies and avoid unnecessary surgery is increasingly important
OBJECTIVE:
This study aimed to build a predictive model based on clinical and radiological variables for the early identification of MPC in lung adenocarcinoma presenting as mGGO nodules.
METHODS:
The enrolled 741 lung adenocarcinoma patients were randomly divided into a training cohort and a validation cohort (3:1 ratio). The pathological specimens and preoperative images of malignant mGGO nodules from the study subjects were retrospectively reviewed. Furthermore, in the training cohort, selected clinical and radiological variables were utilized to construct a predictive model for MPC prediction.
RESULTS:
The MPC was found in 228 (43.3%) patients in the training cohort and 72 (41.1%) patients in the validation cohort. Based on the predictive nomogram, the air bronchogram was defined as the most dominant independent risk factor for MPC of mGGO nodules, followed by the maximum computed tomography (CT) value (
CONCLUSIONS:
This study proposed a predictive model for preoperative identification of MPC in known lung adenocarcinomas presenting as mGGO nodules to facilitate individualized therapy. This nomogram model needs to be further externally validated by subsequent multicenter studies.
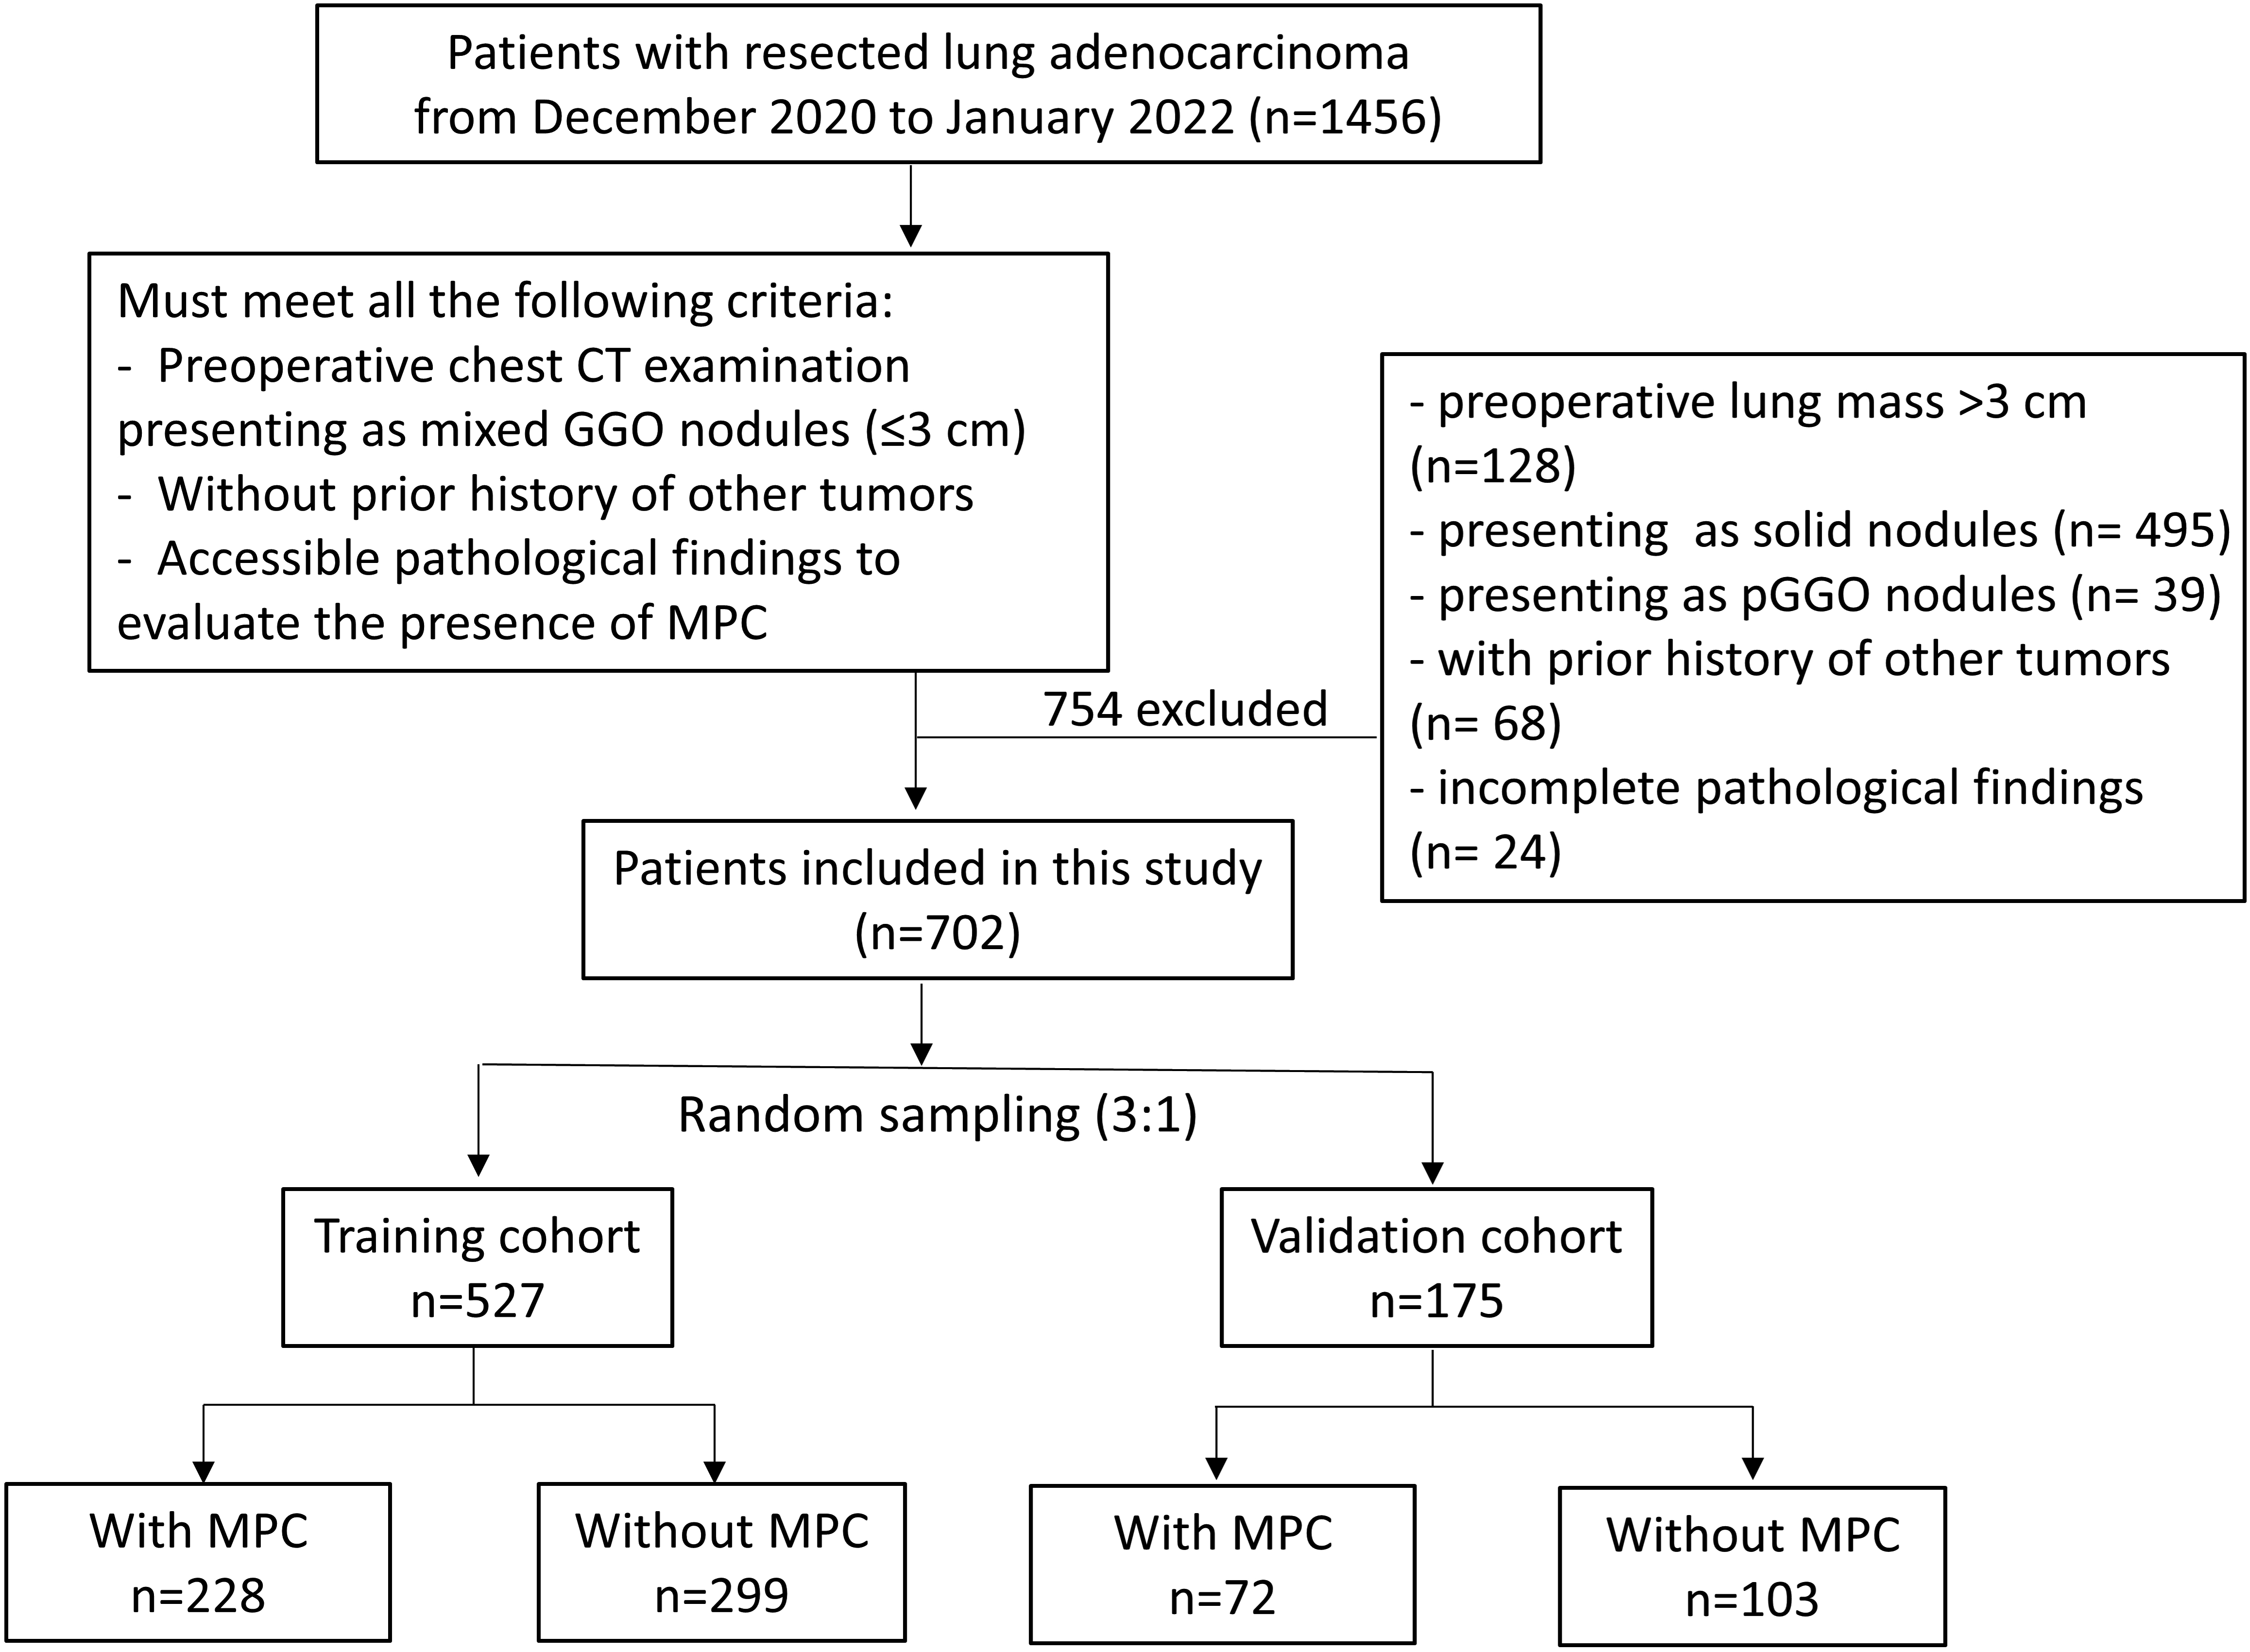
Figure 1.
Inclusion criteria and screening process of the study. The flow chart showed the process of patient enrollment, including the inclusion criteria and the grouping of study subjects.
1.Introduction
The mixed ground-glass opacity (mGGO) nodule is a common imaging manifestation of early-stage lung adenocarcinoma [1]. In clinical practice, assessing the degree of malignancy mGGO nodules during imaging follow-up and finding the appropriate time for operative intervention remain a clinical challenge [2, 3, 4]. Some studies observed that lung adenocarcinoma with the micropapillary component (MPC) also showed distinct genomic profiles and immunosuppression [5, 6]. Additionally, numerous studies find that such patients also have a higher risk of early metastasis and exhibit a poorer prognosis even when the MPC component is not predominant [7, 8, 9]. Therefore, the early identification of mGGO nodule with MPC may help better judge the tumor characteristics in lung adenocarcinoma patients, which in turn can facilitate the implementation of individualized therapeutic strategies [10, 11, 12].
Given the diagnosis of MPC in adenocarcinoma requires pathological findings following surgical excision, effective preoperative predictive methods for the presence of MPC in GGO nodules are increasingly needed. Computed tomography (CT) is a non-invasive screening tool for lung cancer manifesting as GGO nodules and is widely used in clinical practice [13]. It was noticed that the internal radiological characteristics of solid-prominent nodules are often obscured and difficult to accurately evaluate [14] and the accuracy of pathological results between solid-predominant and mGGO nodules is also heterogeneous [15]. Therefore, the imaging prediction model established without distinguishing the purely solid nodules and mGGO nodules may reduce the predictive accuracy to a certain extent. Many studies have used imaging features of lung nodules, which include the solid-predominant nodules, to predict pathological subtypes of lung adenocarcinoma [16, 17], but little to no research has focused on the mGGO nodules solely.
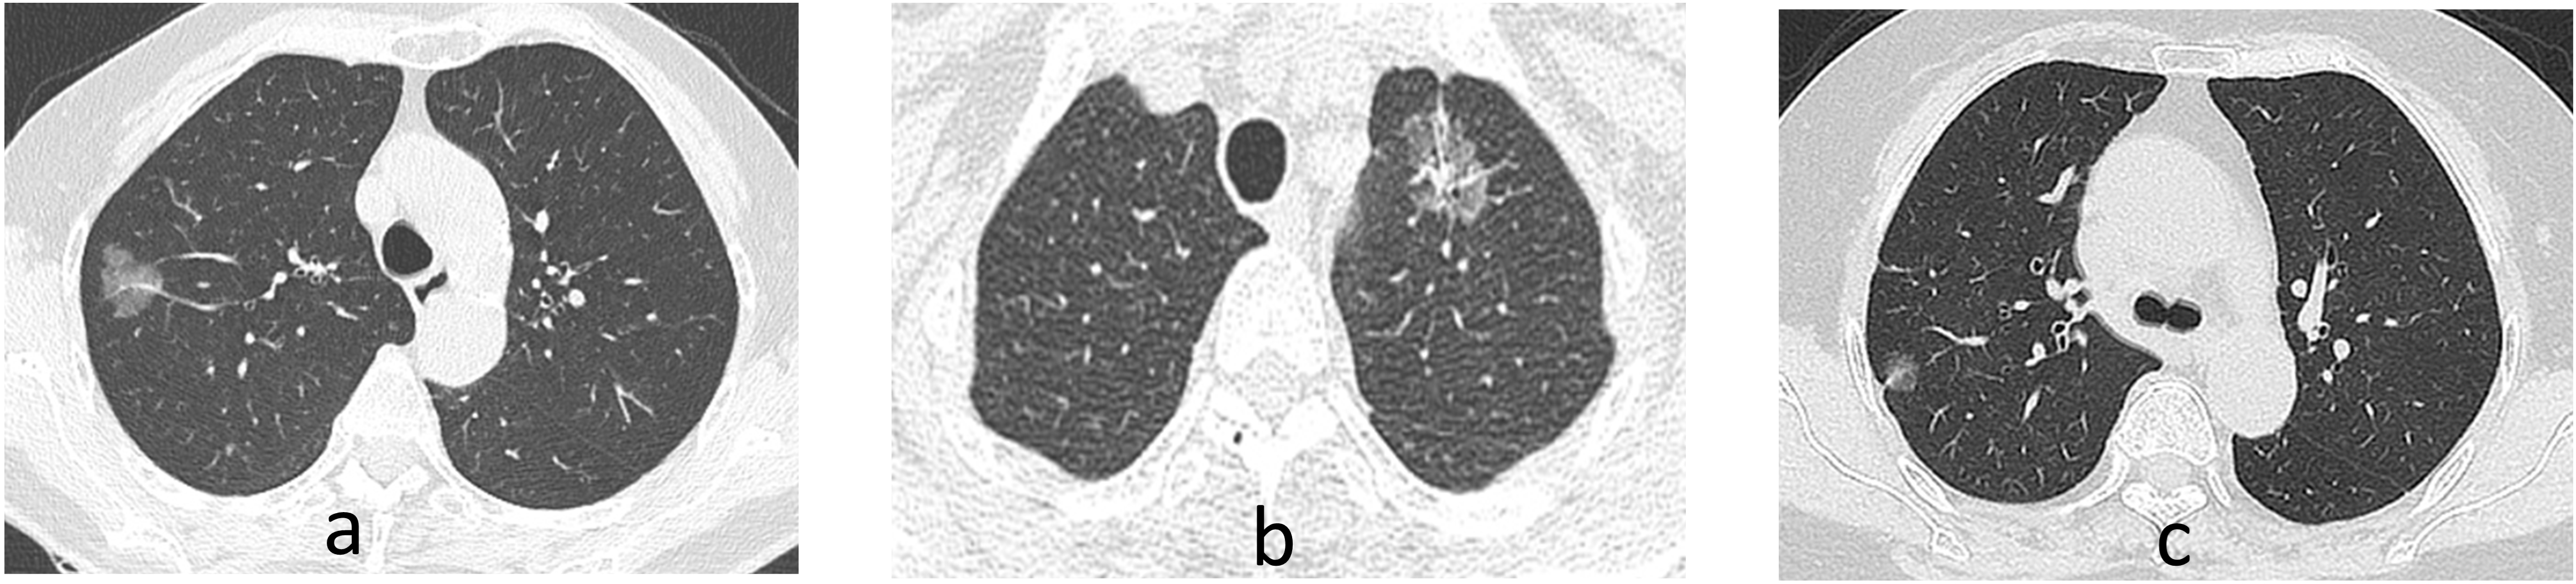
Figure 2.
Representative CT images of the study subjects. (a) A mixed ground ground-glass opacity (mGGO) nodule with homogeneous density in the right upper lobe Few blood vessels are penetrating within the mGGO and the margins appear lobulated; (b) A mGGO nodule in the upper left lobe that depicts vacuolar sign, vessel convergence, and pleural retraction; (c) A mGGO nodule adjacent to the pleura in the right upper lobe with pleural retraction.
In this study, we aimed to retrospectively investigate the clinical and pathological features of mGGO nodules with MPC in lung adenocarcinoma patients. Furthermore, this study also constructed a nomogram to effectively predict the probability of MPC in mGGO by a non-invasive method.
2.Materials and methods
2.1Patients and study design
This retrospective study was approved by the Institutional Review Boards of The First Affiliated Hospital of Soochow University (No.476 in 2022). Patients who underwent resection for lung adenocarcinoma from January 2021 to January 2022 were enrolled in this study. The flow chart of the study subjects is depicted in Fig. 1. The patients must meet all the following inclusion criteria: i, preoperative chest CT examination presenting as mGGO nodules (
Based on the presence or absence of the MPC in pathological findings, the training cohort and the validation cohort were divided into two groups respectively, the MPC group and the non-MPC group. The clinical and pathological data between the two groups in both cohorts were compared respectively. Accordingly, based on the univariate analysis, significant variables were selectly included in the multivariate analysis. Furthermore, a nomogram was constructed by selecting significant variables from the multivariate logistic analysis. And the discriminative and consistent ability of the predictive model was also validated.
2.2Imaging assessment and pathological evaluation
We have reviewed the preoperative CT imaging of all enrolled subjects and some of the representative imaging findings are shown in Fig. 2. In particular, the imaging findings of mGGO nodules are standardly described, including the location of the lung lobes where the tumor is present and their relative position with pleura; the size of the tumor (maximum diameter); tumor margins (Lobulation, spiculation); internal features of the tumor (vacuolar sign, air bronchogram sigh, vessel convergence); adjacent to the pleura; and maximum CT values of the solid component.
The immunohistochemistry testing of programmed cell death-Ligand 1 (PD-L1) was conducted by 22C3 assays (Agilent Technologies) using the DakoAutostainer Link 48 platform following its manufacturer’s instructions [18]. According to the tumor proportion score (TPS), cases were categorized into negative (TPS
2.3Definition
Mixed ground-glass opacity (mGGO) is defined as an opacity with increased density and the 0
Table 1
Clinical and preoperative imaging characteristics between the enrolled subjects
| Variates | MPC ( | Non-MPC ( | |||
|---|---|---|---|---|---|
| Age (y) | 63.0 | (61.9–64.0) | 59.9 | (58.8–60.9) | 0.001 |
| Gender (male) | 151 | (50.3%) | 131 | (32.6%) |
|
| Smoking history | 67 | (22.3%) | 63 | (15.7%) | 0.102 |
| Location of lung lobe | 0.374 | ||||
| Left upper lobe | 69 | (23.0%) | 93 | (23.1%) | |
| Left lower lobe | 53 | (17.7%) | 49 | (12.2%) | |
| Right upper lobe | 75 | (25.0%) | 119 | (29.6%) | |
| Right middle lobe | 23 | (7.7%) | 35 | (8.7%) | |
| Right lower lobe | 37 | (12.3%) | 53 | (13.2%) | |
| Multiple lung lobes | 43 | (14.3%) | 53 | (13.2%) | |
| Adjacent to pleura | 211 | (70.3%) | 212 | (52.7%) |
|
| Radiological features | |||||
| Lobulation | 250 | (83.3%) | 306 | (76.1%) | 0.020 |
| Spiculation | 259 | (86.3%) | 307 | (76.4%) | 0.001 |
| Vacuolar sign | 206 | (68.7%) | 197 | (49.0%) |
|
| Air bronchogram sigh | 210 | (70.0%) | 143 | (35.6%) |
|
| Vessel convergence | 103 | (34.3%) | 132 | (32.8%) | 0.677 |
| Maximum diameter (cm) |
| ||||
| | 158 | (52.7%) | 291 | (72.4%) | |
| | 142 | (47.3%) | 111 | (27.6%) | |
| Maximum CT value |
| ||||
| | 61 | (20.3%) | 194 | (48.3%) | |
| | 239 | (79.7%) | 208 | (51.7%) | |
2.4Statistical analysis
The random grouping method was conducted using R language and the enrolled 702 study subjects were randomly divided into two groups in a 3:1 ratio: the training cohort (
2.5Nomogram construction and evaluation
As for the selection of relevant variables, the demographic information such as age, gender, and smoking history were selected as variables based on previous literature. Variables regarding the internal and external characteristics of mGGOs were selected based on not only the literature but also the clinical practice. Based on the independent risk factors from multivariate logistic regression in the training cohort, a nomogram was plotted and validated by using the R programming language and environment (http://www.r-project.org/). In the training and validation cohort, the area under the curve (AUC) was used to evaluate the discriminative ability and the calibration curve was used to assess the agreement between the predicted risks and the actual results. The internal validation was implemented using the bootstrapping method by setting the number of iterations to 1000.
3.Results
3.1Demographic features
A total of 702 patients were enrolled in the study and the MPC was found in 300 (42.7%) patients. Among them, 204 patients had growth of ground glass nodules during follow-up time, and 144 patients underwent preoperative biopsy. The comparisons of demographic features between the MPC group and the non-MPC group are shown in Table 1. The median age of the MPC group was 63. 0 years, which was higher than that of the non-MPC group (59.9,
Table 2
Multivariate analysis of risk factors for differentiating mGGO nodules with and without MPC in the training cohort
| Variates | Univariate analysis | Multivariate analysis | ||||
|---|---|---|---|---|---|---|
| OR | 95%CI | Adjusted OR | 95%CI | |||
| Age | 0.002 | 1.03 | 1.01–1.05 | |||
| Gender (male) | 2.12 | 1.48–3.02 | 0.006 | 1.78 | 1.18–2.68 | |
| Adjacent to pleura | 2.09 | 1.45–3.02 | 2.37 | 1.56–3.61 | ||
| Lobulation | 0.047 | 1.56 | 1.00–2.41 | |||
| Spiculation | 0.037 | 1.64 | 1.03–26.61 | |||
| Vacuolar sign | 2.30 | 1.60–3.31 | 0.003 | 1.88 | 1.25–2.85 | |
| Air bronchogram | 3.75 | 2.61–5.41 | 3.73 | 2.47–5.65 | ||
| Maximum diameter ( | 2.21 | 1.55–3.16 | ||||
| Maximum CT value ( | 3.68 | 2.47–5.49 | 3.12 | 2.00–4.83 | ||
3.2Imaging findings
The preoperative imaging characteristics between the MPC group and the non-MPC group are shown in Table 1. The location of the lung lobes for mGGO nodules was comparable between the MPC group and non-MPC group (
In terms of marginal features of mGGO nodules, mGGO nodules with MPC were more likely to manifest as lobulation (83.3% vs. 76.1%,
3.3Independent risk factors for the presence of MPCin mGGO nodules in the training cohort
Firstly, we screened variables with statistical significance from the univariate analysis, including age, gender, adjacent to pleura, lobulation, spiculation, vacuolar sign, air bronchogram, maximum diameter (
Figure 3.
The construction and validation of a predictive nomogram based on clinical and radiological features in the training cohort. (a) The nomogram for the prediction of MPC among lung adenocarcinoma presenting as mGGO nodules. Five categorical variables from the multivariate logistic analysis were included in the model and had different contributions to the probability of MPC among mGGO nodules; (b) A ROC curve for the discriminative validation of the nomogram in the training cohort. The AUC value of the ROC curve was 0.783 (95%[CI] 0.744–0.822); (c) A calibration curve for the estimation of agreement between the predicted mGGO nodules with MPC and those of the nomogram.
![The construction and validation of a predictive nomogram based on clinical and radiological features in the training cohort. (a) The nomogram for the prediction of MPC among lung adenocarcinoma presenting as mGGO nodules. Five categorical variables from the multivariate logistic analysis were included in the model and had different contributions to the probability of MPC among mGGO nodules; (b) A ROC curve for the discriminative validation of the nomogram in the training cohort. The AUC value of the ROC curve was 0.783 (95%[CI] 0.744–0.822); (c) A calibration curve for the estimation of agreement between the predicted mGGO nodules with MPC and those of the nomogram.](https://content.iospress.com:443/media/cbm-prepress/cbm--1--1-cbm230104/cbm--1-cbm230104-g003.jpg)
3.4The preoperative predictive nomogram construction and validation
As shown in Fig. 3a, based on the five significant variables from multivariate analysis in the training cohort, we constructed a nomogram for the prediction of MPC in lung adenocarcinoma patients presenting as mGGO nodules. Based on the predictive nomogram, the air bronchogram was defined as the most dominant independent risk factor for the presence of MPC in mGGO nodules, followed by the maximum CT value (
Then the discriminative and consistent ability of the nomogram in the training cohort was validated. As shown in Fig. 3b, the cut-off score of the receiver operating characteristic (ROC) curve was 241.4 points and lung adenocarcinoma presenting as mGGO nodules could be further identified as MPC or non-MPC with a sensitivity of 72.4% and a specificity of 71.3%. Based on the ROC curve, favorable discrimination of the predictive ability was shown with an AUC value of 0.783 (95%[CI] 0.744–0.822), which demonstrated the satisfactory discrimination of the model. As for the consistent validation, in the training cohort, the calibration curve of the nomogram also showed high consistencies between the predicted and observed micropapillary-contained probability. Furthermore, the internal validation was implemented using the bootstrapping method by setting the number of iterations to 1000. And this predictive model calculated a corrected AUC of 0.774 (95% CI: 0.770–0.779).
3.5The predictive nomogram validation in the validation cohort
Accordingly, we validated the predictive nomogram in the validation cohort (Fig. 4a and b). The predictive model also demonstrated favorable discriminative ability with an AUC value of 0.799 (95%[CI] 0.732–0.866) in the validation cohort. The calibration curve also showed consistencies between the predicted and observed micropapillary-contained probability.
3.6mGGO nodules with MPC presented a higher aggressive potential
To assess the invasive potential of mGGO nodules with MPC, pleural and lymph node metastasis rates were compared between the two groups (Table 3). A total of 60.4% (424/702) mGGO nodules adjacent to the pleura underwent pleural elastic fiber staining, including 207 cases in the MPC group and 217 cases in the non-MPC group. Typically, mGGO nodules adjacent to the pleura in the MPC group were more likely to occur pleural invasion compared to the non-MPC group (29.3% vs. 5.5%,
Table 3
Histopathological characteristics of the study subjects
| Variates | MPC ( | Non-MPC ( | |||
| Pleural elastic fiber staining | 207 | 217 | |||
| Non-pleural invasion | 147 | (71.0%) | 205 | (94.5%) |
|
| Pleural invasion | 60 | (29.0%) | 12 | (5.5%) | |
| Lymph node dissection | 135 | 117 | |||
| Non-metastasis | 110 | (81.5%) | 116 | (99.1%) |
|
| Metastasis | 25 | (18.5%) | 1 | (0.9%) | |
| PD-L1 (22C3) |
| ||||
| Negative ( | 127 | (42.3%) | 278 | (69.2%) | |
| Low expression (1–50%) | 156 | (52.0%) | 121 | (30.1%) | |
| High expression ( | 17 | (5.7%) | 3 | (0.7%) | |
| Ki-67 |
| ||||
| Negative ( | 7 | (2.3%) | 18 | (4.5%) | |
| Low expression (1–30%) | 249 | (83.0%) | 382 | (95.0%) | |
| High expression ( | 44 | (14.7%) | 2 | (0.5%) | |
Figure 4.
The validation of the nomogram in the validation cohort. (a) A ROC curve for the discriminative validation of the nomogram from the training cohort. The AUC value of the ROC curve was 0.799 (95%[CI] 0.732–0.866) in the validation cohort; (b) A calibration curve for the estimation of agreement between the predicted mGGO nodules with MPC and those of the nomogram in the validation cohort.
![The validation of the nomogram in the validation cohort. (a) A ROC curve for the discriminative validation of the nomogram from the training cohort. The AUC value of the ROC curve was 0.799 (95%[CI] 0.732–0.866) in the validation cohort; (b) A calibration curve for the estimation of agreement between the predicted mGGO nodules with MPC and those of the nomogram in the validation cohort.](https://content.iospress.com:443/media/cbm-prepress/cbm--1--1-cbm230104/cbm--1-cbm230104-g004.jpg)
Then we compared the lymph node metastasis rates between the MPC group and the non-MPC group. The lymph node biopsy was implemented in 135 cases from the MPC group and 117 cases from the non-MPC group. In particular, the pathological findings suggested a higher ratio of lymph node metastasis in the MPC group (18.5% vs. 0.9%,
Table 4
Clinical and preoperative imaging characteristics in the training and validation cohort
| Variates | Training cohort | Validation cohort | ||||||||
|---|---|---|---|---|---|---|---|---|---|---|
| MPC | Non-MPC | MPC | Non-MPC | |||||||
| No. of patients | 228 | 299 | 72 | 103 | ||||||
| Age (y) | 63.3 | (62.1–64.5) | 60.5 | (59.3–61.7) | 0.002 | 62.9 | (60.7–64.0) | 58.4 | (55.7–61.1) | 0.036 |
| Gender (male) | 114 | (50%) | 96 | (32.1%) |
| 37 | (51.4%) | 35 | (34.0%) | 0.021 |
| Smoking history | 52 | (24.1%) | 48 | (15.1%) | 0.749 | 15 | (20.8%) | 15 | (14.6%) | 0.279 |
| Location of lung lobe | 0.522 | 0.835 | ||||||||
| Left upper lobe | 51 | (22.4%) | 69 | (23.1%) | 18 | (25.0%) | 24 | (23.3%) | ||
| Left lower lobe | 44 | (19.3%) | 40 | (13.4%) | 9 | (12.5%) | 9 | (8.7%) | ||
| Right upper lobe | 58 | (25.4%) | 85 | (28.4%) | 17 | (23.6%) | 34 | (33.0%) | ||
| Right middle lobe | 15 | (6.6%) | 25 | (8.4%) | 8 | (11.1%) | 10 | (9.7%) | ||
| Right lower lobe | 27 | (11.8%) | 40 | (13.4%) | 10 | (13.9%) | 13 | (12.6%) | ||
| Multiple lung lobes | 33 | (14.5%) | 40 | (13.3%) | 10 | (13.9%) | 13 | (12.6%) | ||
| Adjacent to pleura | 163 | (71.5%) | 163 | (54.5%) |
| 48 | (66.7%) | 49 | (47.6%) | 0.012 |
| Radiological features | ||||||||||
| Lobulation | 190 | (83.3%) | 228 | (76.3%) | 0.047 | 60 | (83.3%) | 78 | (75.7%) | 0.225 |
| Spiculation | 196 | (86.0%) | 236 | (78.9%) | 0.037 | 63 | (87.5%) | 71 | (68.9%) | 0.004 |
| Vacuolar sign | 158 | (69.3%) | 148 | (49.5%) |
| 48 | (66.7%) | 49 | (47.6%) | 0.002 |
| Air bronchogram sign | 155 | (68.0%) | 108 | (36.1%) |
| 55 | (74.6%) | 35 | (34.0%) |
|
| Vessel convergence | 73 | (32.0%) | 101 | (33.8%) | 0.670 | 30 | (41.7%) | 31 | (30.1%) | 0.114 |
| Maximum diameter (cm) |
| 0.001 | ||||||||
| | 115 | (50.4%) | 207 | (69.2%) | 43 | (59.7%) | 84 | (81.6%) | ||
| | 113 | (49.6%) | 92 | (30.8%) | 29 | (40.3%) | 19 | (18.4%) | ||
| Maximum CT value |
|
| ||||||||
| | 44 | (19.3%) | 140 | (46.8%) | 17 | (23.6%) | 54 | (52.4%) | ||
| | 184 | (80.7%) | 159 | (53.2%) | 55 | (76.4%) | 49 | (47.6%) | ||
Table 5
Histopathological characteristics in the training and validation cohort
| Variates | Training cohort | Validation cohort | ||||||||
|---|---|---|---|---|---|---|---|---|---|---|
| MPC | Non-MPC | MPC | Non-MPC | |||||||
| No. of patients | 228 | 299 | 72 | 103 | ||||||
| Pleural elastic fiber staining | 152 | 160 | 55 | 57 | ||||||
| Non-pleural invasion | 106 | (69.7%) | 149 | (93.1%) |
| 41 | (74.5%) | 56 | (98.2%) |
|
| Pleural invasion | 46 | (30.3%) | 11 | (6.9%) | 14 | (25.5%) | 1 | (1.8%) | ||
| Lymph node dissection | 101 | 86 | 34 | 31 | ||||||
| Non-metastasis | 83 | (82.2%) | 85 | (98.8%) |
| 27 | (79.4%) | 31 | (100.0%) | 0.008 |
| Metastasis | 18 | (17.8%) | 1 | (1.2%) | 7 | (20.6%) | 0 | (0%) | ||
| PD-L1 (22C3) |
| 0.009 | ||||||||
| Negative ( | 94 | (41.2%) | 211 | (70.6%) | 33 | (45.8%) | 67 | (65.0%) | ||
| Low expression (1–50%) | 120 | (52.6%) | 85 | (28.4%) | 36 | (50.0%) | 36 | (35.0%) | ||
| High expression ( | 14 | (6.1%) | 3 | (1.0%) | 3 | (4.2%) | 0 | (0%) | ||
| Ki-67 |
| 0.003 | ||||||||
| Negative ( | 7 | (3.1%) | 16 | (5.4%) | 0 | (0%) | 2 | (1.9%) | ||
| Low expression (1–30%) | 184 | (80.7%) | 281 | (94.0%) | 65 | (90.3%) | 101 | (98.1%) | ||
| High expression ( | 37 | (16.2%) | 2 | (0.7%) | 7 | (9.7%) | 0 | (0%) | ||
Notably, cases that tested with high Ki-67 expression (
3.7mGGO nodules with MPC were more likely to exhibit inhibitive tumor immune microenvironment
To explore the immune microenvironment characteristics among lung adenocarcinoma patients with and without MPC, we then compared the expression of the immune inhibitory molecule PD-L1. According to the immunohistochemistry staining results (Table 3), the proportion of cases that tested positive for PD-L1 was significantly higher in the MPC group compared with their non-MPC counterparts (57.7% vs. 30.8%,
4.Discussion
In this study, we found that the preoperative assessment of mGGO nodules with MPC implicated by clinical and radiological features could be very helpful for lung adenocarcinoma patients. Furthermore, we proposed an effective predictive nomogram to classify mGGO nodules with MPC in lung adenocarcinoma patients. It is a practical and non-invasive tool to assess the probability of MPC risk in mGGO nodules, thereby enabling timely identification for surgery and appropriate treatment when the samples are unobtainable.
Age and gender are controversial variables associated with pathological subtypes of lung adenocarcinoma [16, 17, 22]. In the present study, we found that the older (
The current study supported previously reported findings that lung adenocarcinoma with MPC was more likely to be associated with lymphatic and pleural invasion [7, 10]. Furthermore, for primary lung adenocarcinoma, a previous study demonstrated clinicopathological characteristics can provide predictive information of unexpected lymph node metastasis [23]. This further illustrated the importance of developing a pathological subtype predictive model, as this can also provide an early indication of the possibility of invasive capacity for primary lung adenocarcinoma.
The size was an important risk for the presence of MPC in lung adenocarcinoma according to previous research [15, 24]. Our data showed that the proportion of mGGO nodules with a maximum diameter
Tumor spread through air spaces pattern has been reported as a novel invasive pattern in lung adenocarcinoma [25]. Notably, a study conducted by Yotsukura, M et al. showed that air bronchogram sign was significantly associated with tumor spread through air spaces pattern and vacuole was an independent predictor of this invasive pattern [26]. Interestingly, among the internal imaging features of mGGO nodules, our data also demonstrated that the vacuolar sign and air bronchogram sign were the independent risk factors for the presence of MPC in lung adenocarcinoma. The above information may indicate why the mGGO nodule with MPC has a higher invasion capability.
The CT value inside adenocarcinoma is diverse, reflecting cellularity, density, and heterogeneous histological components within the tumor [27]. Because the mGGO nodules with MPC were also more likely to be found with high invasive ability, the quantitative CT indicators are non-negligible predictive variables. A study demonstrated that among lung adenocarcinoma presenting as GGO nodules, the invasive components were more likely to appear in areas with high CT values while adherent components appear in the site with low CT values [28]. Similarly, a recent study by Koezuka et al. also found that the combined use of mean and maximum CT values was useful for predicting lepidic-predominant lung adenocarcinoma [29]. As expected, the maximum CT value was an important independent predictor for the MPC among mGGO nodules in this study.
This study has some limitations. Firstly, this is a single-center retrospective study and the results obtained need to be further validated by subsequent multicenter studies. Additionally, the study subjects included are more likely to have higher-risk nodules, which may lead to selection bias. Since our data were retrospectively derived from cases in recent years, the lack of longitudinal follow-up information in this study is another limitation that cannot be ignored. The data on genetic mutations in this study were not fully available and their correlation with lung adenocarcinoma with MPC also needs to be further explored. Finally, all the nodules included in this cohort were known adenocarcinoma, the predictive model proposed in this study cannot be used in a GGO nodule that has no tissue diagnosis.
5.Conclusion
The predictive nomogram based on the multivariate logistic regression analysis proposed in this study showed that the air bronchogram was the most dominant independent risk factor for the presence of MPC in known lung adenocarcinoma presenting as mGGOs, followed by the maximum CT value (
Abbreviations
| mGGO: | Mixed ground-glass opacity |
| MPC: | Micropapillary component |
| AUC: | Area under the curve |
| CT: | Computed tomography |
| PD-L1: | Programmed cell death-Ligand 1 |
| ROC: | Receiver operating characteristic |
Author contributions
Conception: Cheng Chen and Weidong Zhu.
Interpretation or analysis of data: Ziwen Zhu and Weizhen Jiang.
Preparation of the manuscript: Danhong Zhou.
Revision for important intellectual content: Ziwen Zhu.
Supervision: Cheng Chen and Weidong Zhu.
Funding
The project was mainly supported by the National Natural Science Foundation of China (NSFC) grant (grant number 81672280), Jiangsu Provincial Medical Key Discipline (grant number ZDXK202201) and Project of Suzhou City (grant number SYS2021034).
Competing interests
The authors have no relevant financial or non-financial interests to disclose.
Ethics approval
This study was performed in line with the principles of the Declaration of Helsinki. This study was approved by the Institutional Review Boards of The First Affiliated Hospital of Soochow University (No.476 in 2022).
Acknowledgments
We would like to thank all the nurses and the clinical staff who provided care for the patient. We thank the funders of the National Natural Science Foundation of China (NSFC) grant (grant number 81672280), Jiangsu Provincial Medical Key Discipline (grant number ZDXK202201) and Project of Suzhou City (grant number SYS2021034) for supporting this work.
References
[1] | H. Sung, J. Ferlay, R.L. Siegel, M. Laversanne, I. Soerjomataram, A. Jemal and F. Bray, Global Cancer Statistics 2020: GLOBOCAN Estimates of Incidence and Mortality Worldwide for 36 Cancers in 185 Countries, CA Cancer J Clin 71: ((2021) ), 209–249. |
[2] | R. Qu, D. Tu, Y. Cai, W. Ping and X. Fu, Clinical features and surgical outcomes of young patients with lung adenocarcinoma manifesting as ground glass opacity, Front Oncol 12: ((2022) ), 979522. |
[3] | Y. Zhang, Z. Chen, H. Hu and H. Chen, Surgical Strategies for Pre- and Minimally Invasive Lung Adenocarcinoma 3.0: Lessons Learned From the Optimal Timing of Surgical Intervention, Semin Thorac Cardiovasc Surg 34: ((2022) ), 311–314. |
[4] | K.J. Butnor, Controversies and challenges in the histologic subtyping of lung adenocarcinoma, Transl Lung Cancer Res 9: ((2020) ), 839–846. |
[5] | Y. Huo, L. Sun, J. Yuan, H. Zhang, Z. Zhang, L. Zhang, W. Huang, X. Sun, Z. Tang, Y. Feng, H. Mo, Z. Yang, C. Zhang, Z. Yu, D. Yue, B. Zhang and C. Wang, Comprehensive analyses unveil novel genomic and immunological characteristics of micropapillary pattern in lung adenocarcinoma, Front Oncol 12: ((2022) ), 931209. |
[6] | V. Tancoš, M. Grendár, A. Farkašová, Z. Hutka, J. Mičák, Z. Kviatkovská, T.C. Hardman, G.A.D. Hardy and L. Plank, Programmed death ligand 1 protein expression, histological tumour differentiation and intratumoural heterogeneity in pulmonary adenocarcinoma, Pathology 52: ((2020) ), 538–545. |
[7] | K. Wang, M. Xue, J. Qiu, L. Liu, Y. Wang, R. Li, C. Qu, W. Yue and H. Tian, Genomics Analysis and Nomogram Risk Prediction of Occult Lymph Node Metastasis in Non-Predominant Micropapillary Component of Lung Adenocarcinoma Measuring ⩽ 3 cm, Front Oncol 12: ((2022) ), 945997. |
[8] | P. Bertoglio, V. Aprile, L. Ventura, M. Cattoni, D. Nachira, F. Lococo, M.R. Perez, F. Guerrera, F. Minervini, G. Querzoli, G. Bocchialini, D. Bacchin, F. Franzi, G. Rindi, S. Bellafiore, F. Femia, G.S. Bogina, P. Solli, P. Kestenholz, E. Ruffini, M. Paci, S. Margaritora, A.S. Imperatori, M. Lucchi, L. Gnetti and A.C. Terzi, Impact of High-Grade Patterns in Early-Stage Lung Adenocarcinoma: A Multicentric Analysis, Lung 200: ((2022) ), 649–660. |
[9] | B. Peng, G. Li and Y. Guo, Prognostic significance of micropapillary and solid patterns in stage IA lung adenocarcinoma, Am J Transl Res 13: ((2021) ), 10562–10569. |
[10] | S.H. Choi, J.Y. Jeong, S.Y. Lee, K.M. Shin, S.Y. Jeong, T.I. Park, Y.W. Do, E.B. Lee, Y. Seok, W.K. Lee, J.E. Park, S. Park, Y.H. Lee, H. Seo, S.S. Yoo, J. Lee, S.I. Cha, C.H. Kim and J.Y. Park, Clinical implication of minimal presence of solid or micropapillary subtype in early-stage lung adenocarcinoma, Thorac Cancer 12: ((2021) ), 235–244. |
[11] | Y. Hou, W. Song, M. Chen, J. Zhang, Q. Luo, S.W. Um, F. Facchinetti, S. Bongiolatti and Q. Zhou, The presence of lepidic and micropapillary/solid pathological patterns as minor components has prognostic value in patients with intermediate-grade invasive lung adenocarcinoma, Transl Lung Cancer Res 11: ((2022) ), 64–74. |
[12] | P. Li, L. Liu, D. Wang, R. Yang, Y. Xuan, Y. Han, J. Wang, L. Guo, L. Zhang, S. Zhang and Y. Wang, Genomic and clinicopathological features of lung adenocarcinomas with micropapillary component, Front Oncol 12: ((2022) ), 989349. |
[13] | B. Ouyang, M. Li, L. Li, S. Liu and M. Li, Characteristics of Ground-Glass Nodules Detected by Low-Dose Computed Tomography as a Regular Health Examination Among Chinese Hospital Employees and Their Parents, Front Oncol 11: ((2021) ), 661067. |
[14] | D. Halpenny, K. Das, E. Ziv, A. Plodkowski, J. Zheng, M. Capanu, N. Rekhtman, J. Montecalvo, S.B. Solomon and M.S. Ginsberg, Percutaneous computed tomography guided biopsy of sub-solid pulmonary nodules: differentiating solid from ground glass components at the time of biopsy, Clin Imaging 69: ((2021) ), 332–338. |
[15] | P.C. Tsai, Y.C. Yeh, P.K. Hsu, C.K. Chen, T.Y. Chou and Y.C. Wu, CT-Guided Core Biopsy for Peripheral Sub-solid Pulmonary Nodules to Predict Predominant Histological and Aggressive Subtypes of Lung Adenocarcinoma, Ann Surg Oncol 27: ((2020) ), 4405–4412. |
[16] | S. Park, S.M. Lee, S. Kim, J.G. Lee, S. Choi, K.H. Do and J.B. Seo, Volume Doubling Times of Lung Adenocarcinomas: Correlation with Predominant Histologic Subtypes and Prognosis, Radiology 295: ((2020) ), 703–712. |
[17] | Y. Xu, W. Ji, L. Hou, S. Lin, Y. Shi, C. Zhou, Y. Meng, W. Wang, X. Chen, M. Wang and H. Yang, Enhanced CT-Based Radiomics to Predict Micropapillary Pattern Within Lung Invasive Adenocarcinoma, Front Oncol 11: ((2021) ), 704994. |
[18] | F. Fu, C. Deng, W. Sun, Q. Zheng, Y. Jin, Y. Li, Y. Zhang and H. Chen, Distribution and concordance of PD-L1 expression by routine 22C3 assays in East-Asian patients with non-small cell lung cancer, Respir Res 23: ((2022) ), 302. |
[19] | Z.R. Liang, M. Ye, F.J. Lv, B.J. Fu, R.Y. Lin, W.J. Li and Z.G. Chu, Differential diagnosis of benign and malignant patchy ground-glass opacity by thin-section computed tomography, BMC Cancer 22: ((2022) ), 1206. |
[20] | A. Marx, J.K. Chan, J.M. Coindre, F. Detterbeck, N. Girard, N.L. Harris, E.S. Jaffe, M.O. Kurrer, E.M. Marom, A.L. Moreira, K. Mukai, A. Orazi and P. Ströbel, The 2015 World Health Organization Classification of Tumors of the Thymus: Continuity and Changes, J Thorac Oncol 10: ((2015) ), 1383–95. |
[21] | L. Miao, L. Yang, J.X. Zhang, X.J. Sun, H.H. Zhang, L.L. Qi and M. Li, Micronodular thymoma with lymphoid stroma: Contrast-enhanced CT features with histopathological correlation in 10 patients, Front Oncol 12: ((2022) ), 964882. |
[22] | S. Park, S.M. Lee, H.N. Noh, H.J. Hwang, S. Kim, K.H. Do and J.B. Seo, Differentiation of predominant subtypes of lung adenocarcinoma using a quantitative radiomics approach on CT, Eur Radiol 30: ((2020) ), 4883–4892. |
[23] | J.H. Hong, S. Park, H. Kim, J.M. Goo, I.K. Park, C.H. Kang, Y.T. Kim and S.H. Yoon, Volume and Mass Doubling Time of Lung Adenocarcinoma according to WHO Histologic Classification, Korean J Radiol 22: ((2021) ), 464–475. |
[24] | M. Jia, S. Yu, L. Cao, P.L. Sun and H. Gao, Clinicopathologic Features and Genetic Alterations in Adenocarcinoma In Situ and Minimally Invasive Adenocarcinoma of the Lung: Long-Term Follow-Up Study of 121 Asian Patients, Ann Surg Oncol 27: ((2020) ), 3052–3063. |
[25] | K. Masai, H. Sakurai, A. Sukeda, S. Suzuki, K. Asakura, K. Nakagawa, H. Asamura, S.I. Watanabe, N. Motoi and N. Hiraoka, Prognostic Impact of Margin Distance and Tumor Spread Through Air Spaces in Limited Resection for Primary Lung Cancer, J Thorac Oncol 12: ((2017) ), 1788–1797. |
[26] | L. Qin, Y. Sun, R. Zhu, B. Hu and J. Wu, Clinicopathological and CT features of tumor spread through air space in invasive lung adenocarcinoma, Front Oncol 12: ((2022) ), 959113. |
[27] | D. Eriguchi, Y. Shimada, K. Imai, H. Furumoto, T. Okano, R. Masuno, J. Matsubayashi, N. Kajiwara, T. Ohira and N. Ikeda, Predictive accuracy of lepidic growth subtypes in early-stage adenocarcinoma of the lung by quantitative CT histogram and FDG-PET, Lung Cancer 125: ((2018) ), 14–21. |
[28] | S. Koezuka, T. Mikami, N. Tochigi, A. Sano, Y. Azuma, T. Makino, H. Otsuka, K. Matsumoto, N. Shiraga and A. Iyoda, Toward improving prognosis prediction in patients undergoing small lung adenocarcinoma resection: Radiological and pathological assessment of diversity and intratumor heterogeneity, Lung Cancer 135: ((2019) ), 40–46. |
[29] | S. Koezuka, A. Sano, Y. Azuma, T. Sakai, K. Matsumoto, N. Shiraga, T. Mikami, N. Tochigi, Y. Murakami and A. Iyoda, Combination of mean CT value and maximum CT value as a novel predictor of lepidic predominant lesions in small lung adenocarcinoma presenting as solid nodules, Sci Rep 12: ((2022) ), 5450. |


