
Identification of TNFRSF1A as a potential biomarker for osteosarcoma
Abstract
BACKGROUND:
Osteosarcoma (OS) is a relatively rare malignant bone tumor in teenagers; however, its molecular mechanisms are not yet understood comprehensively.
OBJECTIVE:
The study aimed to use necroptosis-related genes (NRGs) and their relationships with immune-related genes to construct a prognostic signature for OS.
METHODS:
TARGET-OS was used as the training dataset, and GSE 16091 and GSE 21257 were used as the validation datasets. Univariate regression, survival analysis, and Kaplan-Meier curves were used to screen for hub genes. The immune-related targets were screened using immune infiltration assays and immune checkpoints. The results were validated using nomogram and decision curve analyses (DCA).
RESULTS:
Using univariate Cox regression analysis, TNFRSF1A was screened from 14 NRGs as an OS prognostic signature. Functional enrichment was analyzed based on the median expression of TNFRSF1A. The prognosis of the TNFRSF1A low-expression group in the Kaplan-Meier curve was notably worse. Immunohistochemistry analysis showed that the number of activated T cells and tumor purity increased considerably. Furthermore, the immune checkpoint lymphocyte activation gene 3 (LAG-3) is a possible target for intervention. The nomogram accurately predicted 1-, 3-, and 5-year survival rates. DCA validated the model (C
Conclusion:
TNFRSF1A can be used to elucidate the potential relationship between the immune microenvironment and NRGs in OS pathogenesis.
1.Introduction
Table 1
Baseline patient characteristics for three datasets
| GSE16091 | GSE21257 | TARGET | |
| Organism | Homo sapiens | Homo sapiens | Homo sapiens |
| Experiment type | Expression profiling by array | Expression profiling by array | Log2 (Count |
| Platforms | GPL96 | GPL10295 | Illumina |
| Sample (number) | 34 | 53 | 85 |
Osteosarcoma, a prevalent bone tumor, predominantly affects adolescents, with the disease typically manifesting between the ages of 15–20 [1]. This neoplasm exhibits a bimodal age distribution, featuring a secondary peak in incidence among individuals aged 65 and above [2]. In the year 2000, the mortality rate for osteosarcoma was 0.021 per 100,000 individuals, escalating to a peak of 0.132 per 100,000 individuals in 2018 [3]. Notably, the elderly subgroup manifests the lowest five-year survival rate, likely attributable to concurrent non-neoplastic complications [3]. Over the past two decades, the 5-year survival rate has shown improvement, reaching 60–70% in patients with localized tumors. However, for patients with recurrent or metastatic osteosarcoma, the 5-year survival rate remains below 25% [4]. Presently, early surgical intervention stands as the principal and pivotal therapeutic strategy. The administration of doxorubicin, cisplatin, and high-dose methotrexate, collectively known as “MAP,” coupled with limb-sparing surgery for primary tumor resection, is associated with an approximate 70% 5-year survival rate in cases of localized disease. In instances of distant metastasis, patients following the “MAP” treatment protocol demonstrate 5-year survival rates ranging from 10% to 40% [5]. Early diagnosis and treatment significantly enhance the prognosis of osteosarcoma. However, challenges arise due to a limited understanding of the disease’s origin, leading to diagnostic difficulties and treatment delays [6]. Recent advancements in biomedicine have positioned targeted therapy as a promising avenue for osteosarcoma treatment. This involves targeted inhibition of apoptosis- [7] and autophagy-related [8] genes, combined with immunotherapy to alleviate osteosarcoma. Despite these efforts, outcomes remain unsatisfactory, underscoring the imperative for further research to elucidate the molecular mechanisms of osteosarcoma immunotherapy and identify pertinent biomarkers for immune checkpoint inhibitors.
Necroptosis, a non-cysteine protease-dependent form of cell death, exhibits morphological features identical to those of cell necrosis. However, it occurs through a distinct programmed cell death mechanism that is completely independent of the apoptosis signaling pathway [9]. Necroptosis is involved in the pathogenesis of glioblastoma [10] and non-small cell lung cancer [11] and plays an essential role in orthopedic diseases. Necroptosis inhibitors provide significant relief from osteoarthritis [12] and osteonecrosis of the femoral head [13]; therefore, necroptosis genes may also be involved in OS pathogenesis.
To date, numerous studies have analyzed pathogenesis of OS from different perspectives. Li et al. constructed a prognostic model related to autophagy in OS using univariate/multivariate Cox regression and tested the model in a validation dataset, but lacked a joint analysis of immune infiltration [14]. Hua et al. employed non-negative matrix factorization (NMF) clustering and the least absolute shrinkage and selection operator (LASSO) algorithm to identify eight necroptosis-related genes (NRGs) in OS, which were validated with a validation cohort [15]. This study provides an initial assessment of immune infiltration and the tumor microenvironment in osteosarcoma; however, it is acknowledged that incorporating research pertaining to immune checkpoints would undoubtedly enhance the comprehensive understanding of these aspects. Zheng et al. screened seven lncRNAs related to necroptosis and survival analysis showed that the lncRNAs were closely associated with poor prognosis in high-risk patients. However, the study did not use a validation dataset to test the results [16]. Although many discoveries have been made regarding OS, the mechanisms associated with NRGs in OS remain elusive.
In the present study, univariate Cox regression was used to construct a necroptosis gene-related OS model to screen for the risk gene TNFRSF1A. Patients with OS were classified into high- and low-risk groups using the median TNFRSF1A expression level as the cut-off, and survival analysis was performed for both groups. Differentially expressed genes (DEGs) and functional enrichment were analyzed. Additionally, a combined analysis of immune infiltration and immune scores was performed for the OS group. Finally, a nomogram and decision curve analysis (DCA) were performed to examine the reliability of TNFRSF1A in the model. Our data indicate that targeting the TNFRSF1A gene might enhance the therapeutic treatment of OS.
2.Materials and methods
2.1Acquisition of gene expression data
Microarray expression profiles for OS were obtained from the Therapeutically Applicable Research to Generate Effective Treatments (TARGET) database (http://target.nci.nih.gov) [17], and microarray data from GSE16091 (GPL96) [18] and GSE21257 (GPL10295) [19] were collected from the Gene Expression Omnibus (GEO) database (https://www.ncbi.nlm. nih.gov/geo/) [20]. The three datasets were integrated using the limma package [21] and normalization within the dataset was performed using the normalizeBetweenArrays function. The TARGET-OS dataset was used as the training set, and GSE 16091 and GSE 21257 were used as the validation sets. All clinical information in the three datasets is presented in Table 1.
2.2Selection of necroptosis genes associated with survival outcome
Univariate Cox regression analysis was conducted to screen the TARGET-OS dataset genes, with
2.3Analysis of TNFRSF1A gene expression and prognosis in the TARGET-OS cohort
The Wilcoxon test was used to examine the expression of TNFRSF1A in different age (older or younger than 14 years) and sex groups (female or male); box plots were drawn at the nodes, with
2.4Analysis of DEGs
The DEGs in the three datasets were analyzed based on high- and low-expression groups of TNFRSF1A using the Limma package. The numbers of upregulated and downregulated genes were calculated. Volcano plots and heat maps were generated using the ggplot2 and heatmap packages. DEGs from the three datasets that were clustered by hierarchical clustering were considered intersections.
2.5Functional enrichment analysis
DEGs in TARGET-OS were analyzed and visualized for Gene Ontology (GO) [25] and Kyoto Encyclopedia of Genes and Genome (KEGG) [26] enrichment using the clusterProfiler [27, 28] and GOplot packages [29], with
2.6Protein-protein interaction network of NRGs
Fourteen NRGs were used to construct PPI networks in the STRING database [32] (https://string-db.org/) with a confidence threshold of 0.4. Correlation analysis was performed for NRGs in TARGET-OS. Subsequently, a correlation heat map was plotted, and points with significance were shown in color based on correlation coefficients. Box plots of the 14 NRGs are shown for GSE16091 and GSE21257, with
2.7Effect of TNFRSF1A gene expression grouping on immune cell infiltration
The immune cell immunoreactive gene sets obtained from the ImmPort database (http://www.immport.org) [33] were from a previous study [34]. Correlation analysis of anti-tumor immunity and pre-tumor suppression was performed by plotting correlation scatter plots for single-sample gene set enrichment analysis (ssGSEA) [35].
2.8Analysis of high and low TNFRSF1A expression for immunotherapy
Differences in expression at the immune checkpoints [36] were calculated for the three datasets. A violin plot was constructed using the ggplot2 package. The ESTIMATE [37] package was used to calculate stromal and immune scores, estimate scores, and determine tumor purity.
2.9Correlation analysis of different risk factors on the prognosis of OS
The prognosis-related indicators (age and sex) for OS were selected. Age and TNFRSF1A expression were used as continuous variables, whereas sex was used as a categorical variable. The Forest Plot [38] package [34] was used to determine the odds ratio of each factor. The ROC curve was constructed using the pROC package and the area under the curve (AUC) was calculated. The rms package [39] generated a nomogram to predict the relationships between the variables in the model and the effectiveness of model evaluation in TARGET-OS at one, three, and five years. Prognostic performance was examined using the concordance of the index (c-index) and
Figure 1.
Flow chart for the study. The flow chart illustrates the step-by-step workflow employed in the present study to investigate the role of TNFRSF1A in osteosarcoma development.
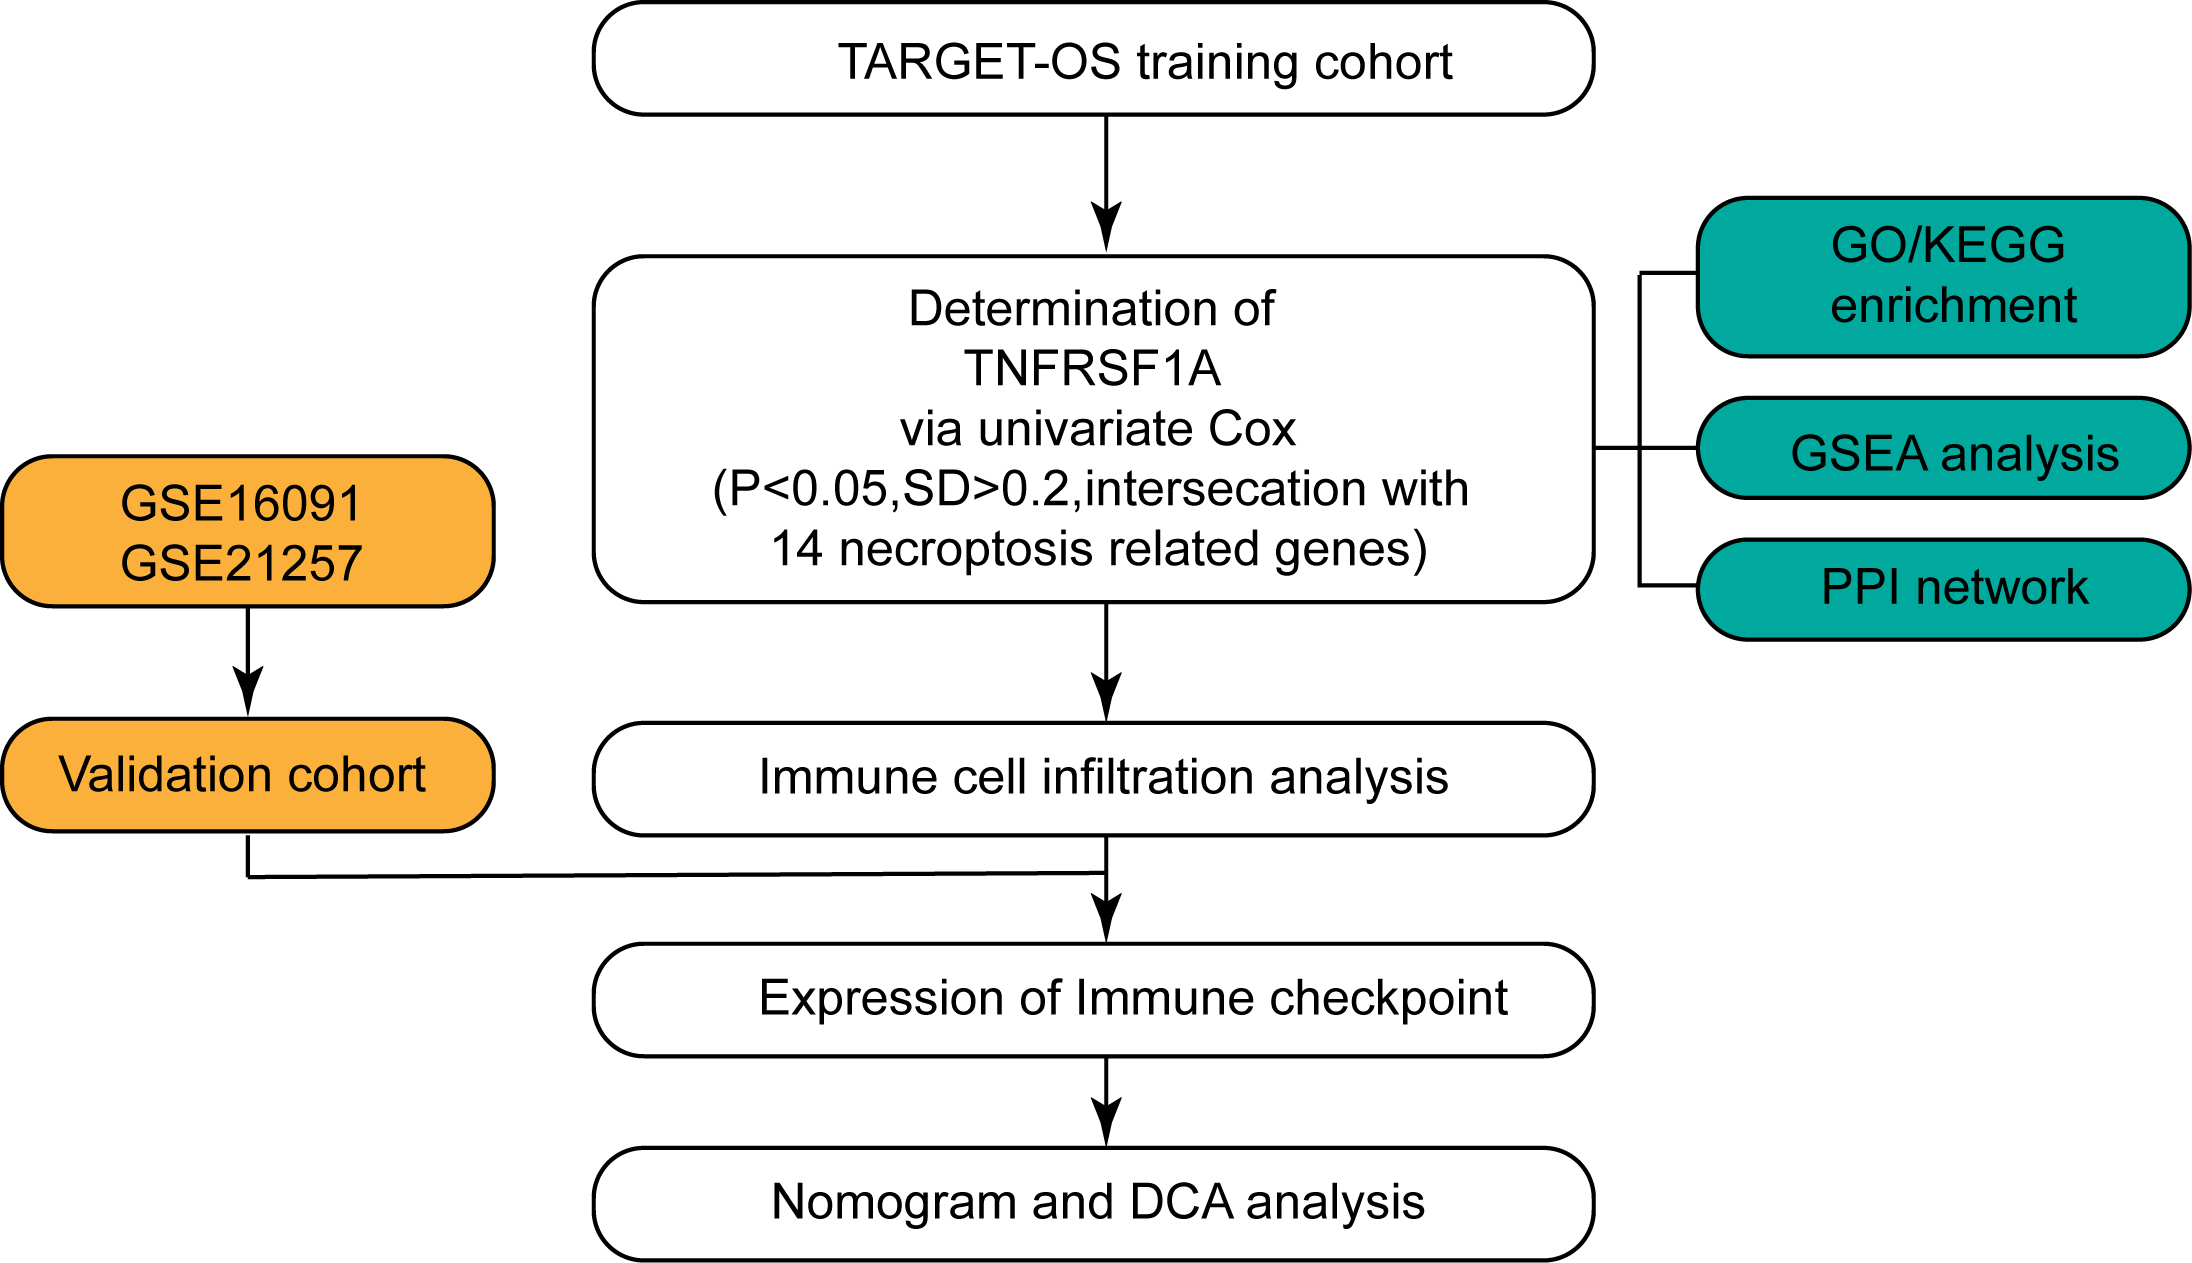
Figure 2.
The expression and prognostic analysis of NRGs in the TARGET-OS cohort. (a) Age-related expression of the TNFRSF1A gene in patients with OS; orange is less than 14 years; blue is greater than 14 years. (b) Expression of TNFRSF1A in different sexes; orange indicates males; blue indicates females. (c) K–M curve in different TNFRSF1A expression groups; orange is the high-expression group; blue is the low-expression group. (d) Box plot of NRGs expression in the two TNFRSF1A expression groups; blue is the high-expression group; red is the low-expression group. ns:
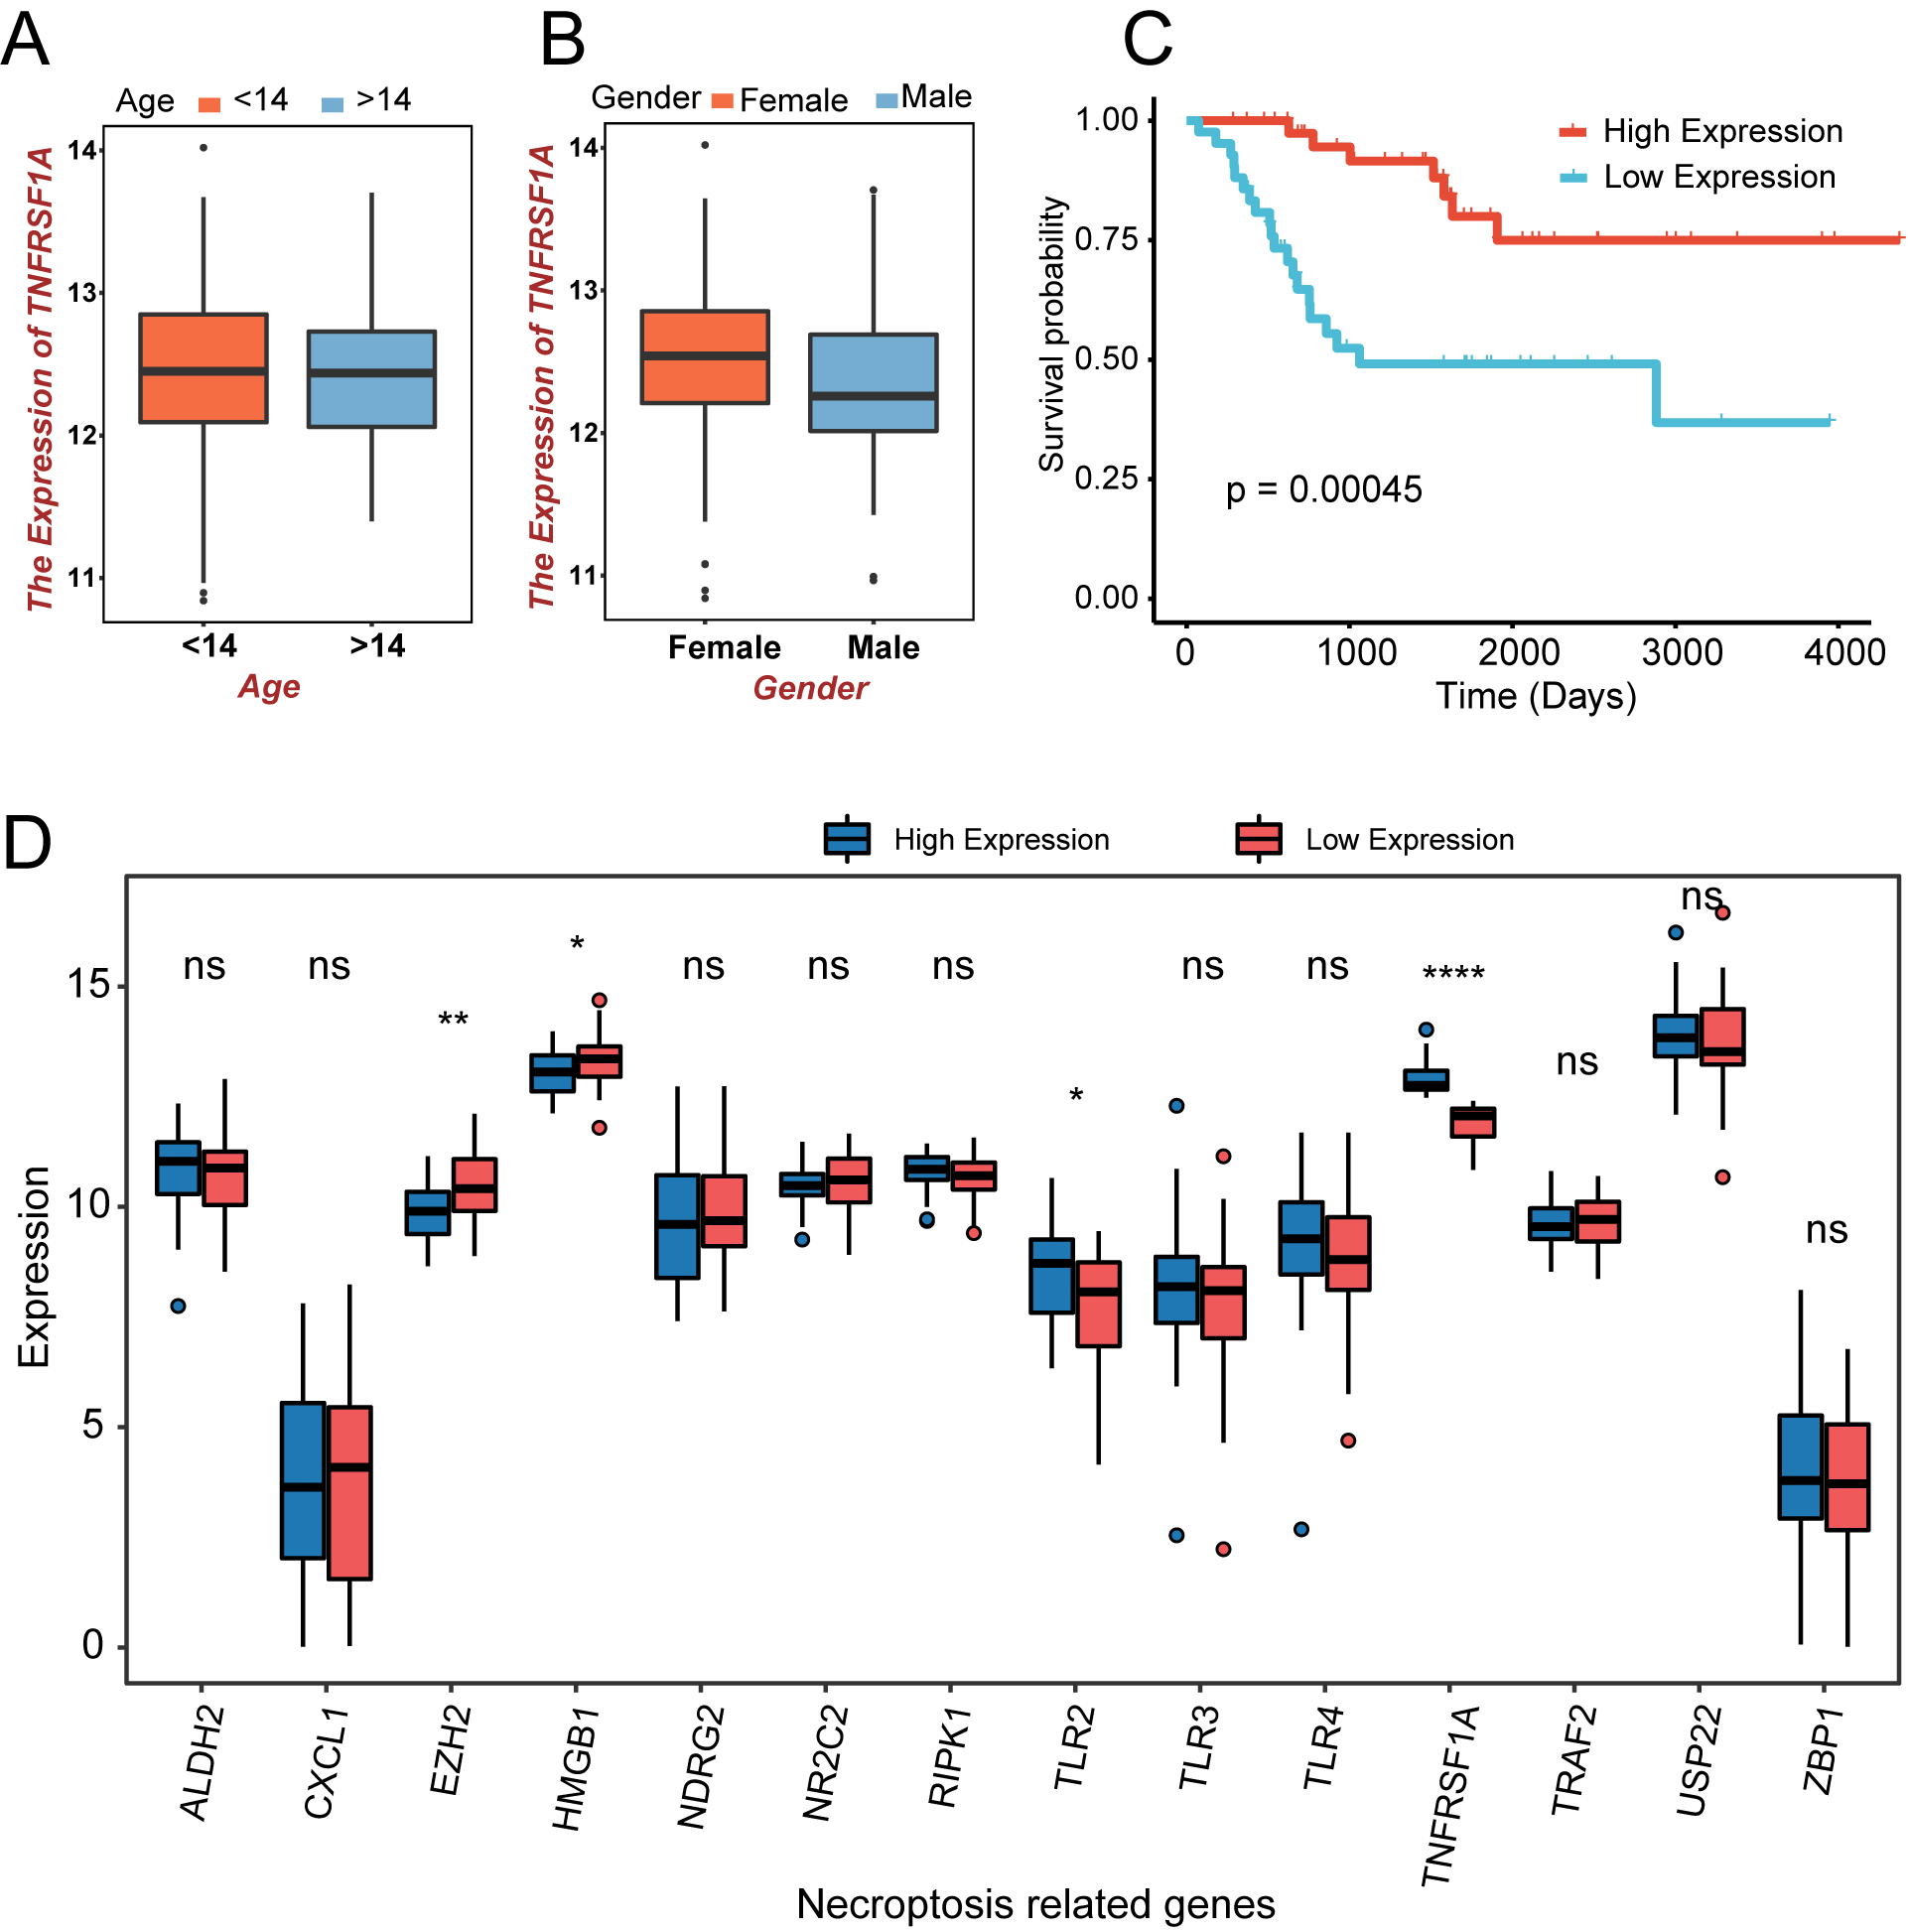
Figure 3.
DEGs in the TNFRSF1A high- and low-expression groups. (a–c) The DEGs of the TARGET-OS cohort and GSE16091 and GSE21257 datasets were screened and plotted for volcanoes, respectively, with blue representing downregulated genes and red representing upregulated genes. (d–f) Heatmaps of the top 10 DEGs in the TARGET-OS cohort and GSE16091 and GSE21257 datasets, respectively. (g) Clustered heat map of the expression profiles for the 28 DEGs common to the three datasets.
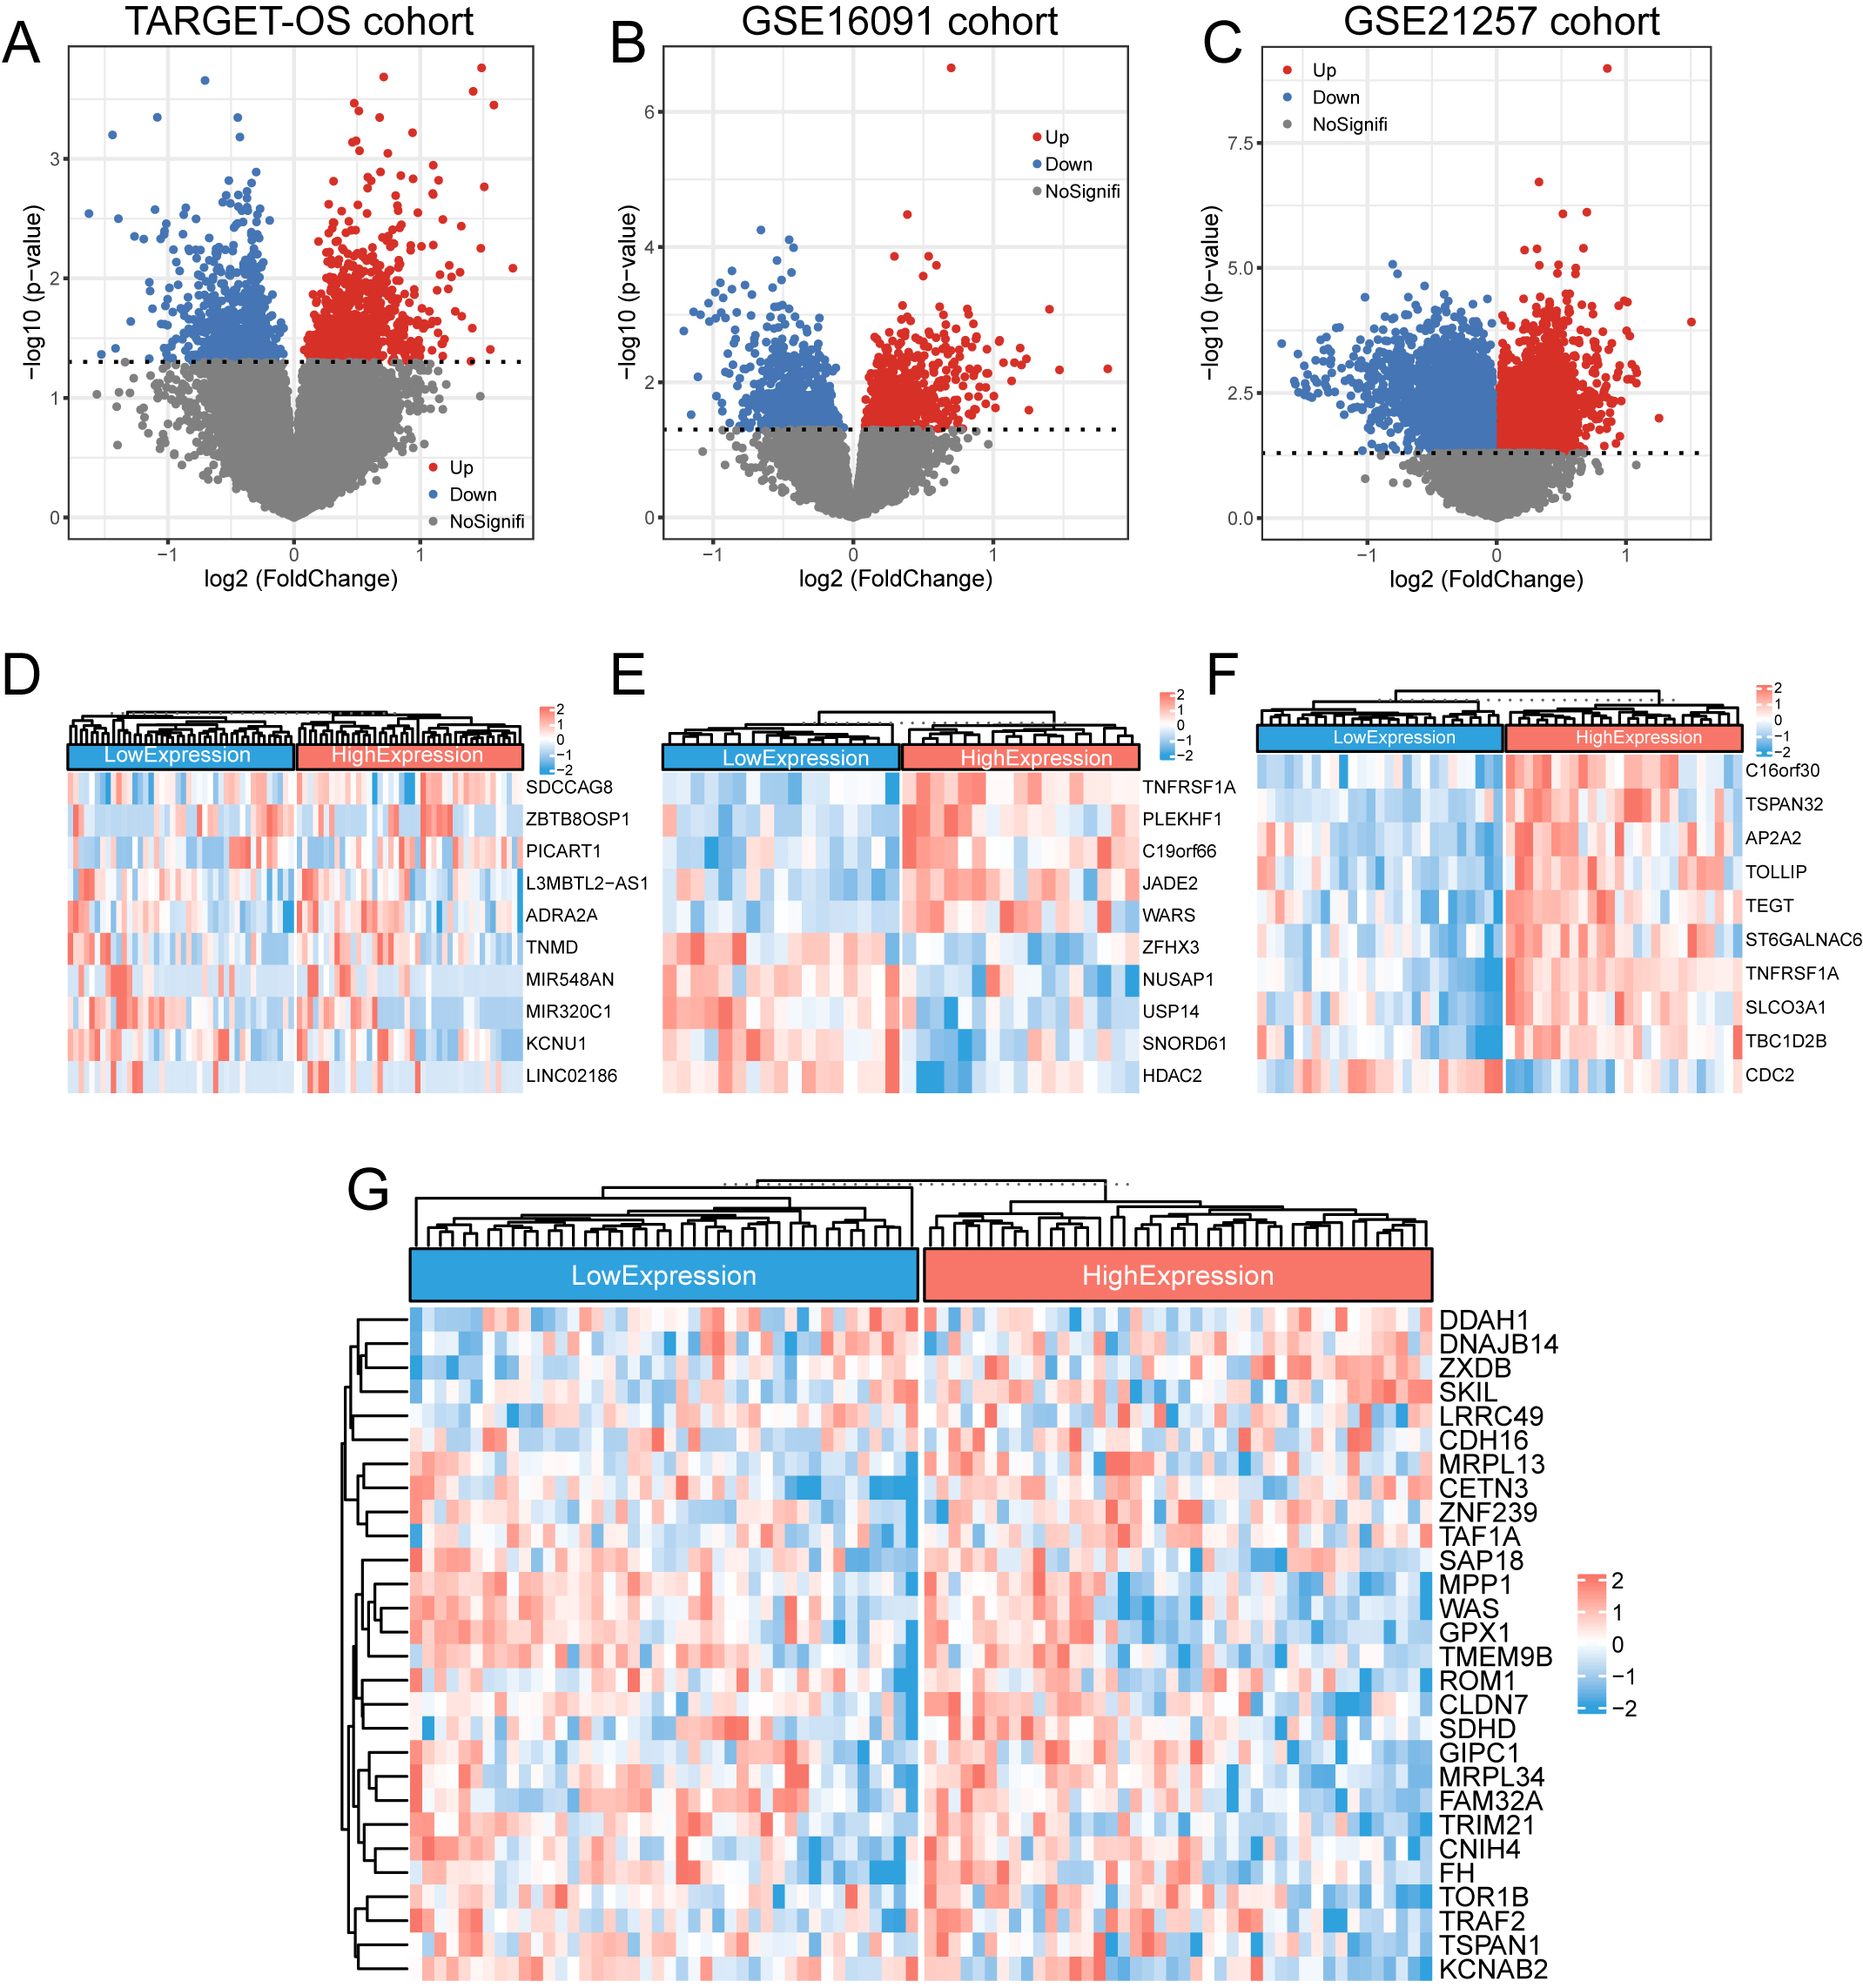
Figure 4.
PPI network analysis for NRGs. (a) PPI network plot for 14 NRGs. (b) Correlation heat map of 14 NRG expressions; points with absolute values of correlation coefficients greater than 0.5 are marked with color. Red represents positive and blue represents negative correlations. (c–d) Expression of 14 NRGs at different expression levels of TNFRSF1A in GSE16091 (c) and GSE21257 (d). ns:
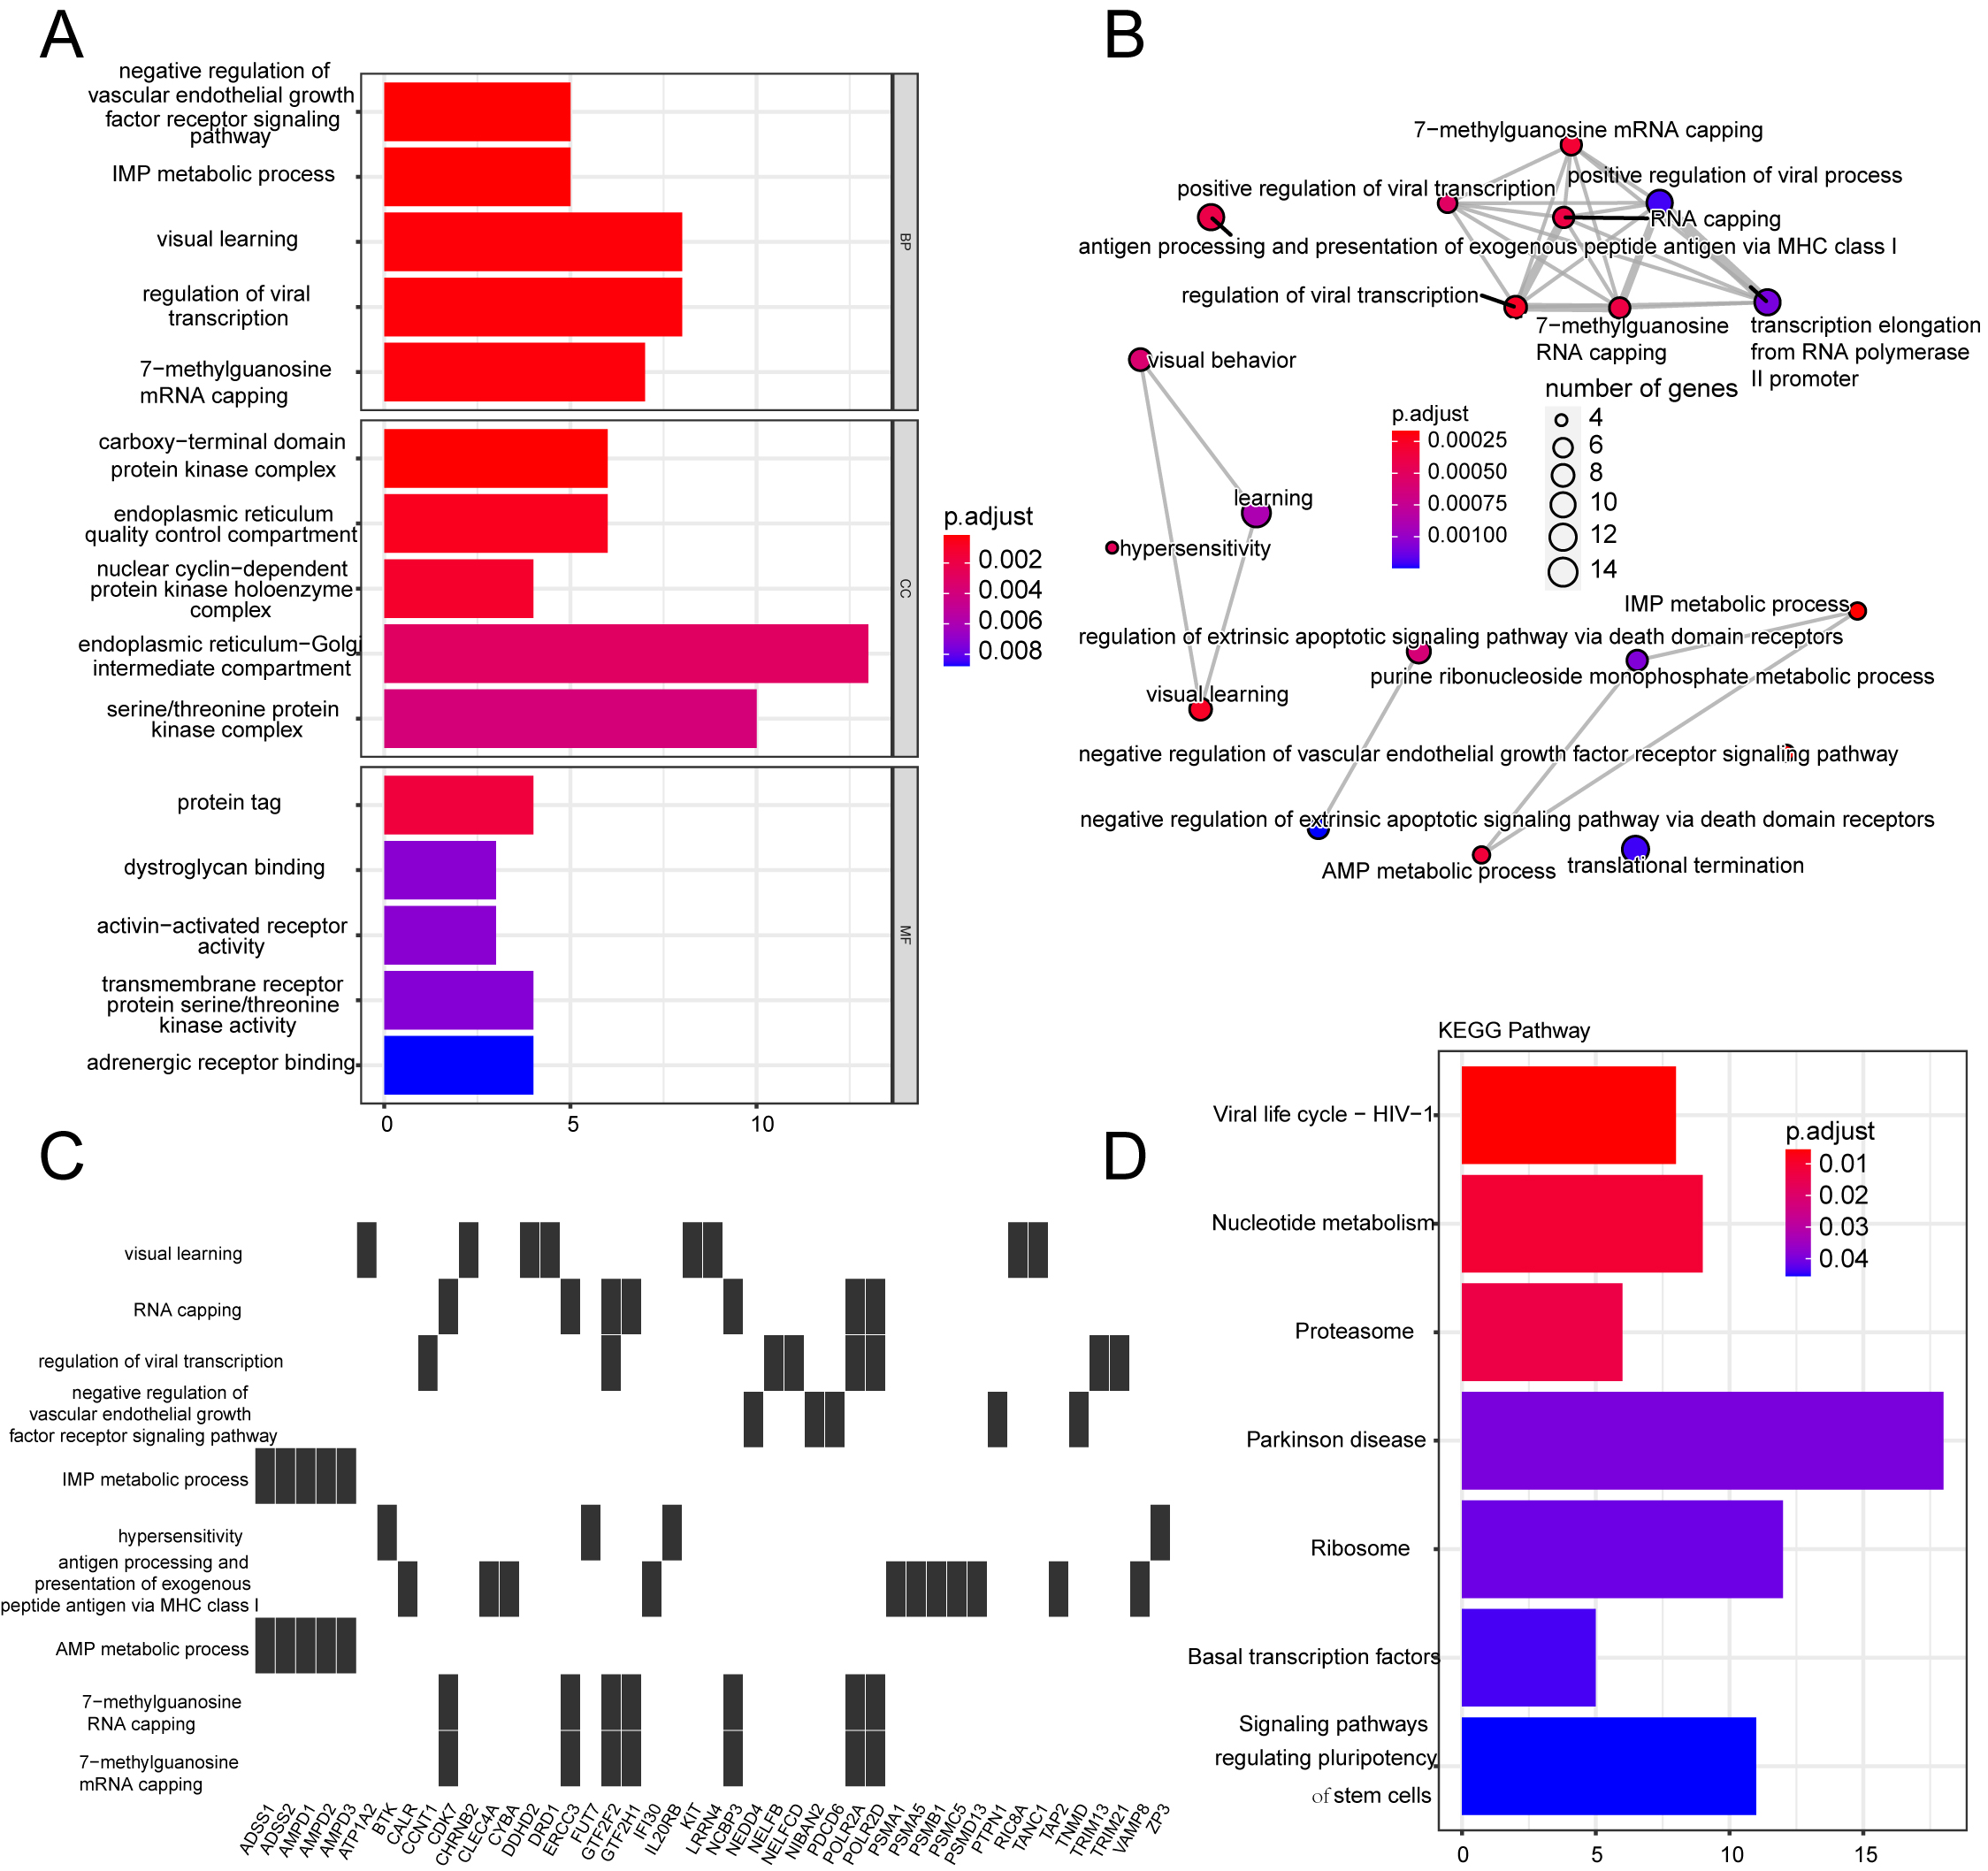
Figure 5.
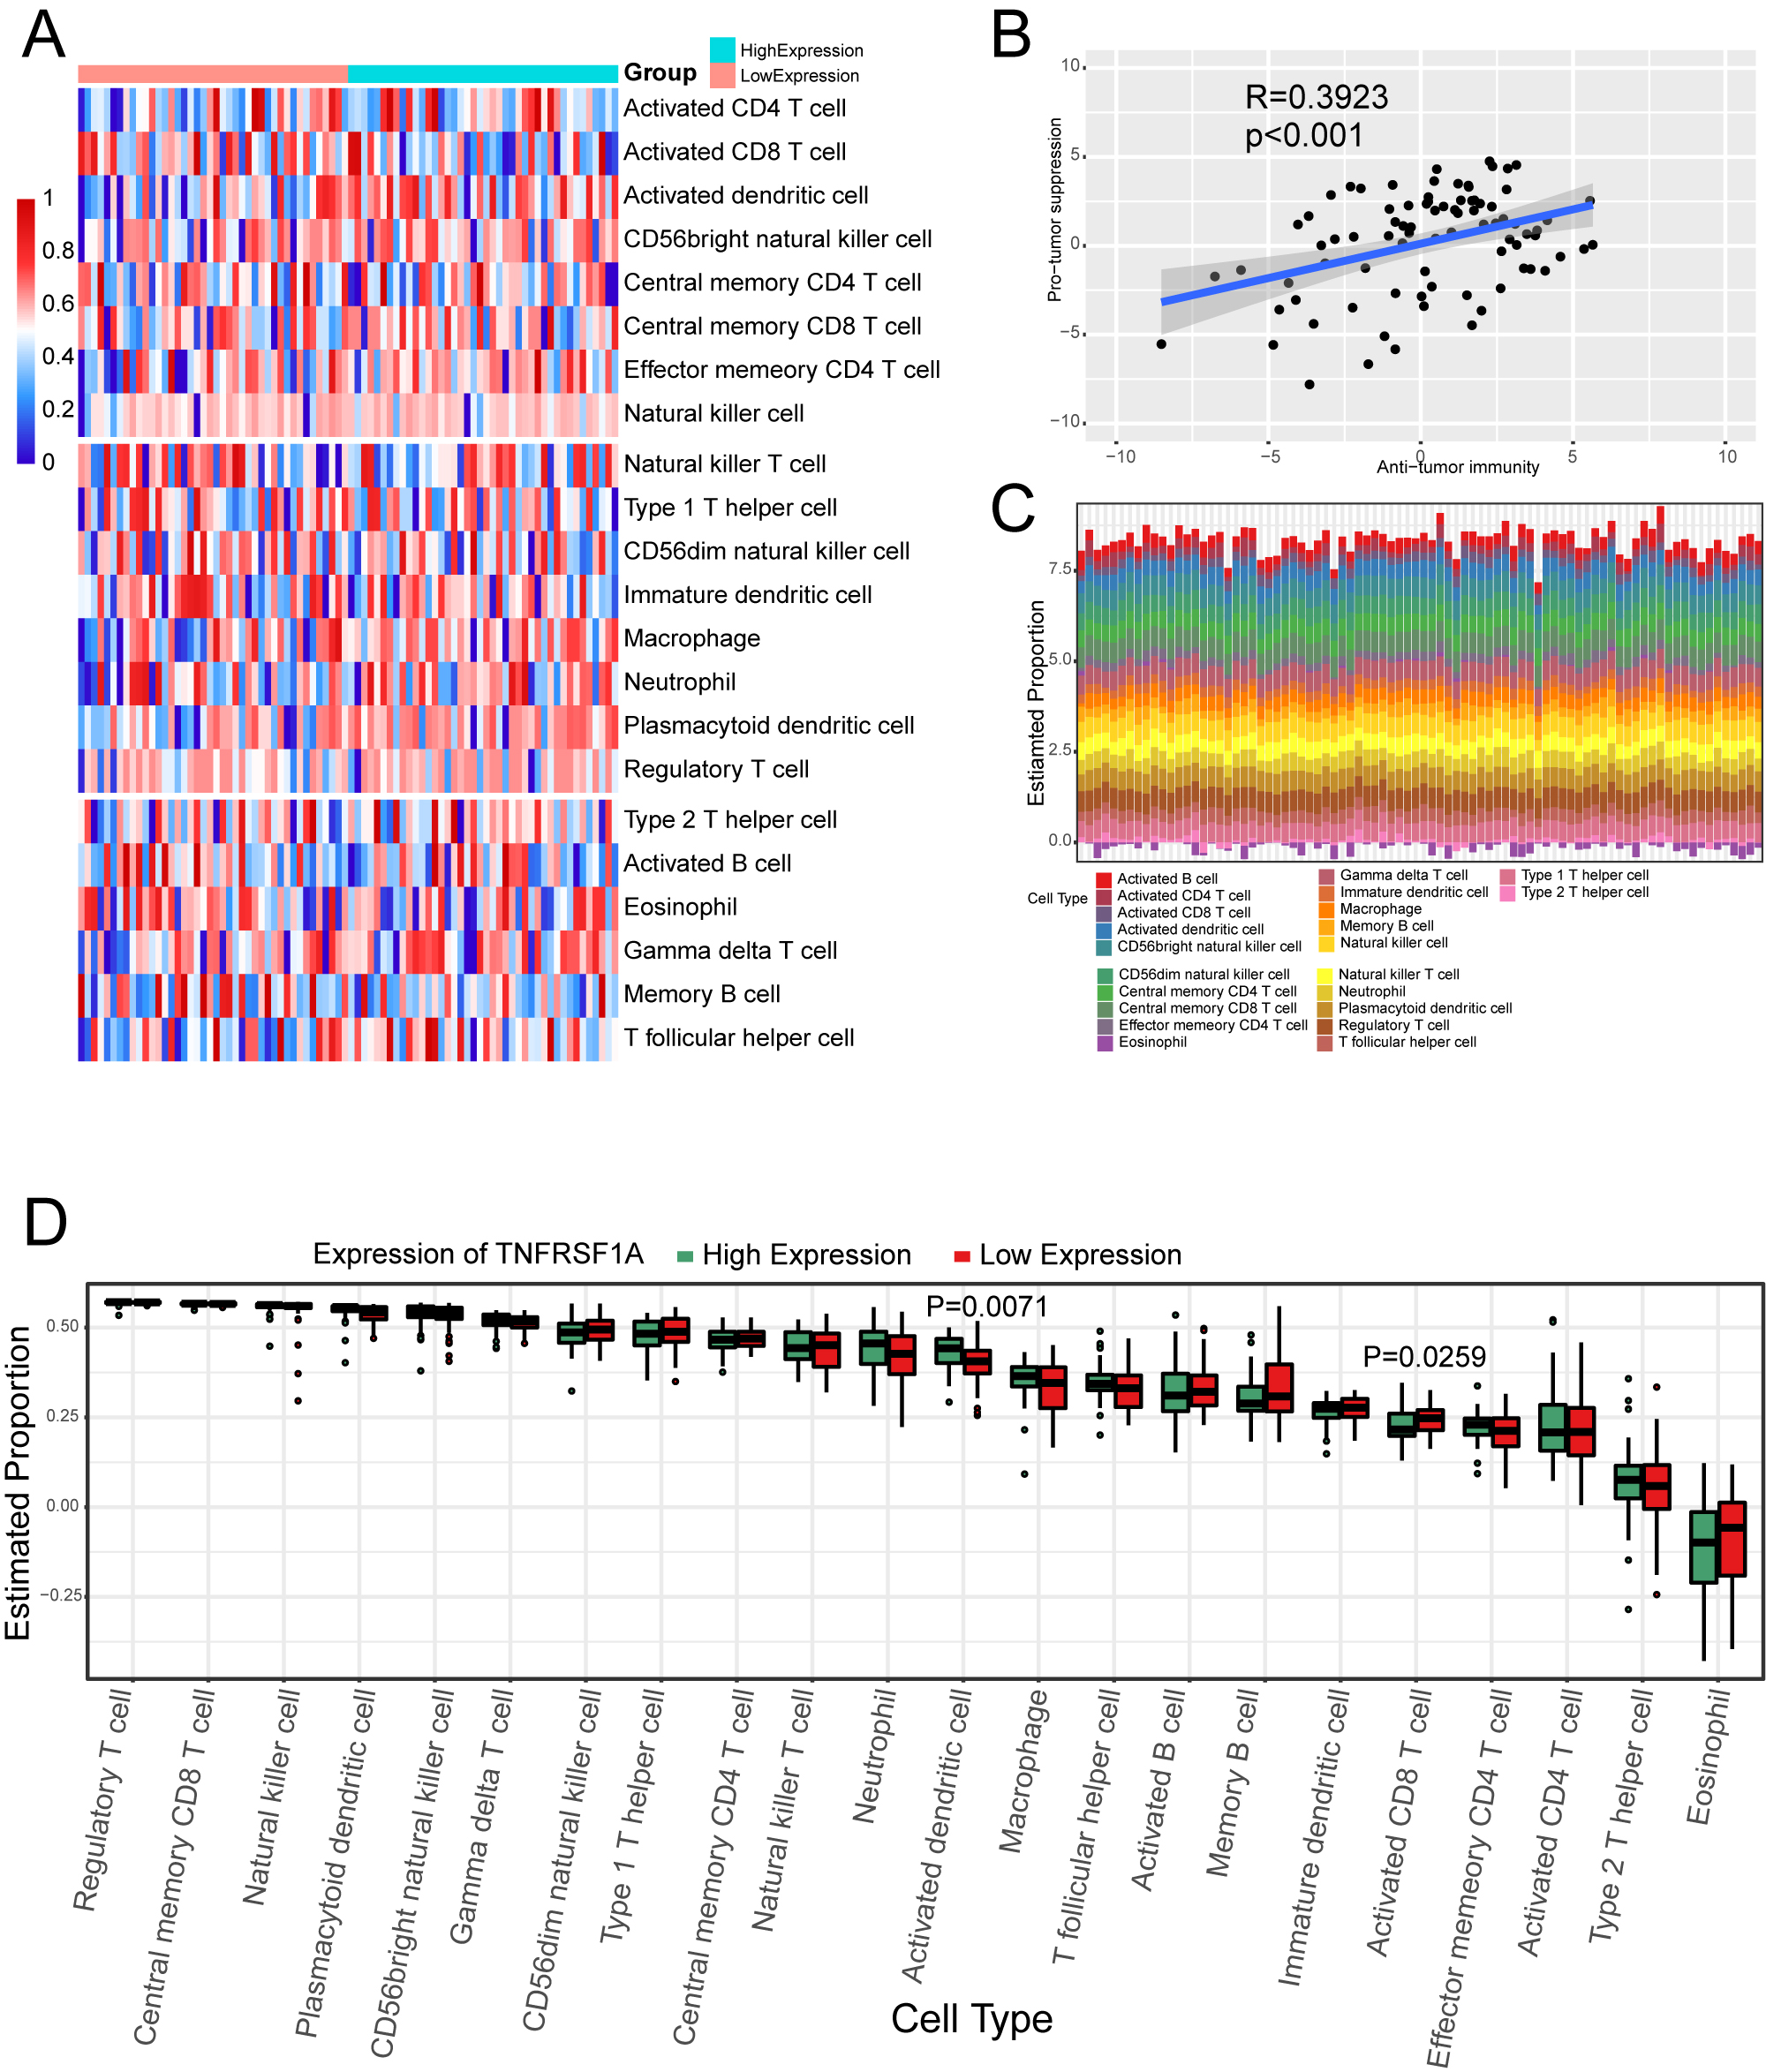
Effect of TNFRSF1A expression grouping on immune cell infiltration. (a) Heat map of ssGSEA immune cell enrichment fraction. Above the first dividing line are anti-tumor cells, between the two dividing lines are pro-tumor cells, and below the second dividing line are general immune cells. (b) Scatter plot of correlation between anti-tumor immunity and pro-tumor suppression. (c) Immune cell infiltration in TARGET-OS samples. (d) Box plot of the percentage of immune cells.
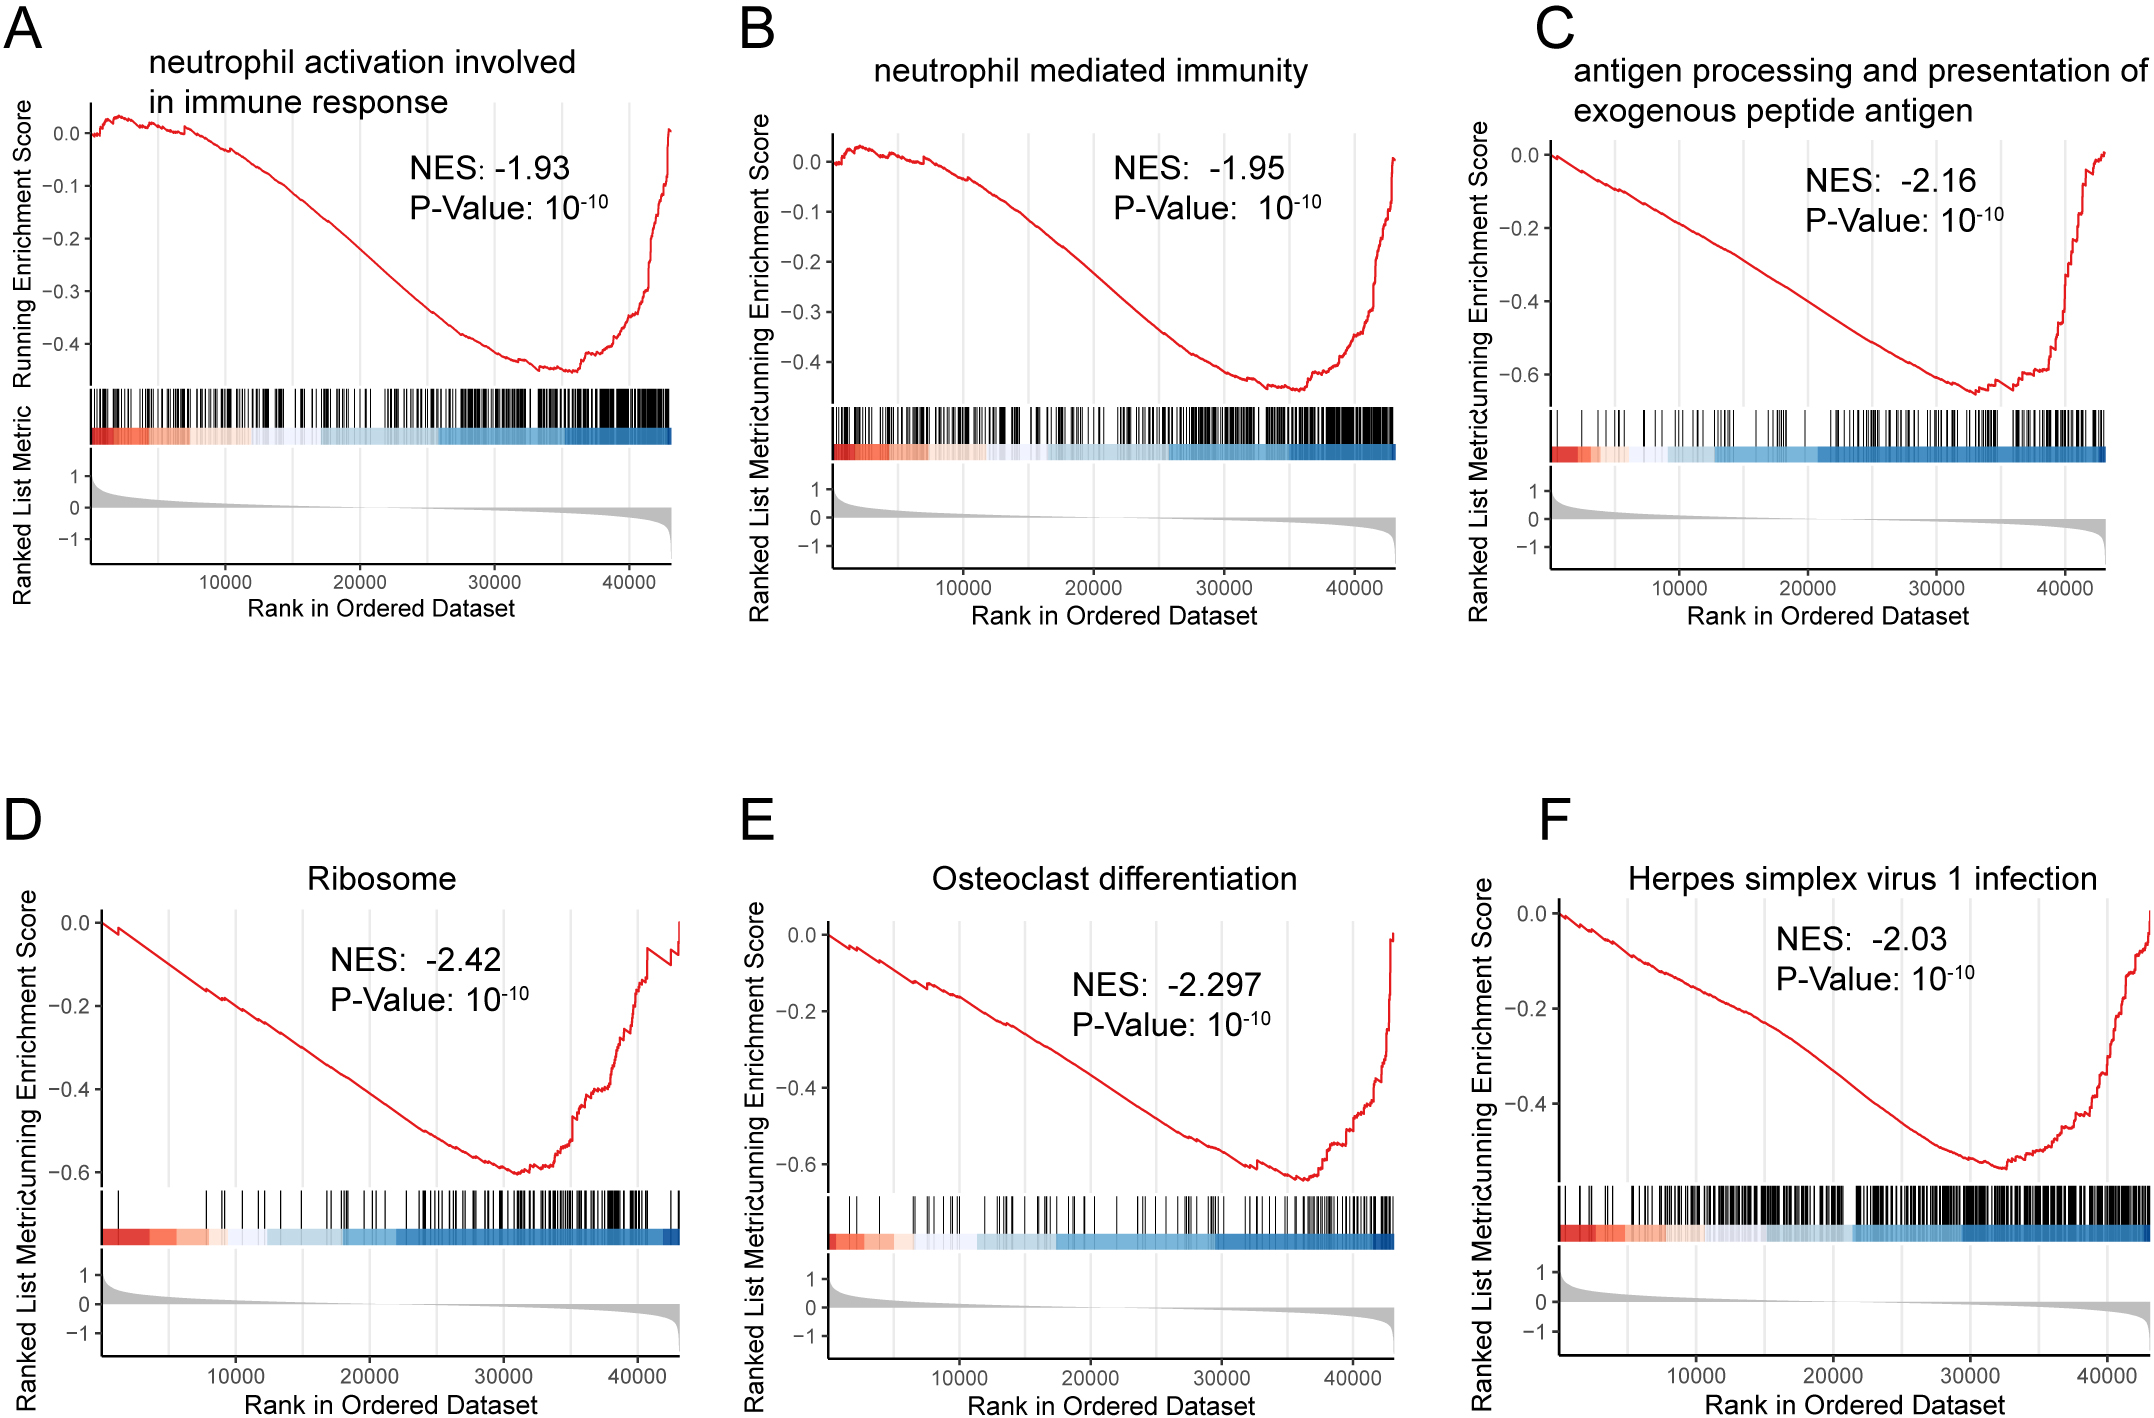
Figure 6.
Effect of TNFRSF1A expression grouping on immunotherapy in three datasets. (a–c) Expression of immune checkpoints CTLA4, LAG3, and TIGIT in the TARGET-OS cohort, GSE16091, and GSE21257 datasets. (d–g) Stromal score (d), immune score (e), estimate score (f), and tumor purity (g) were calculated using the TARGET-OS dataset in both the TNFRSF1A high- and- low-expression groups.
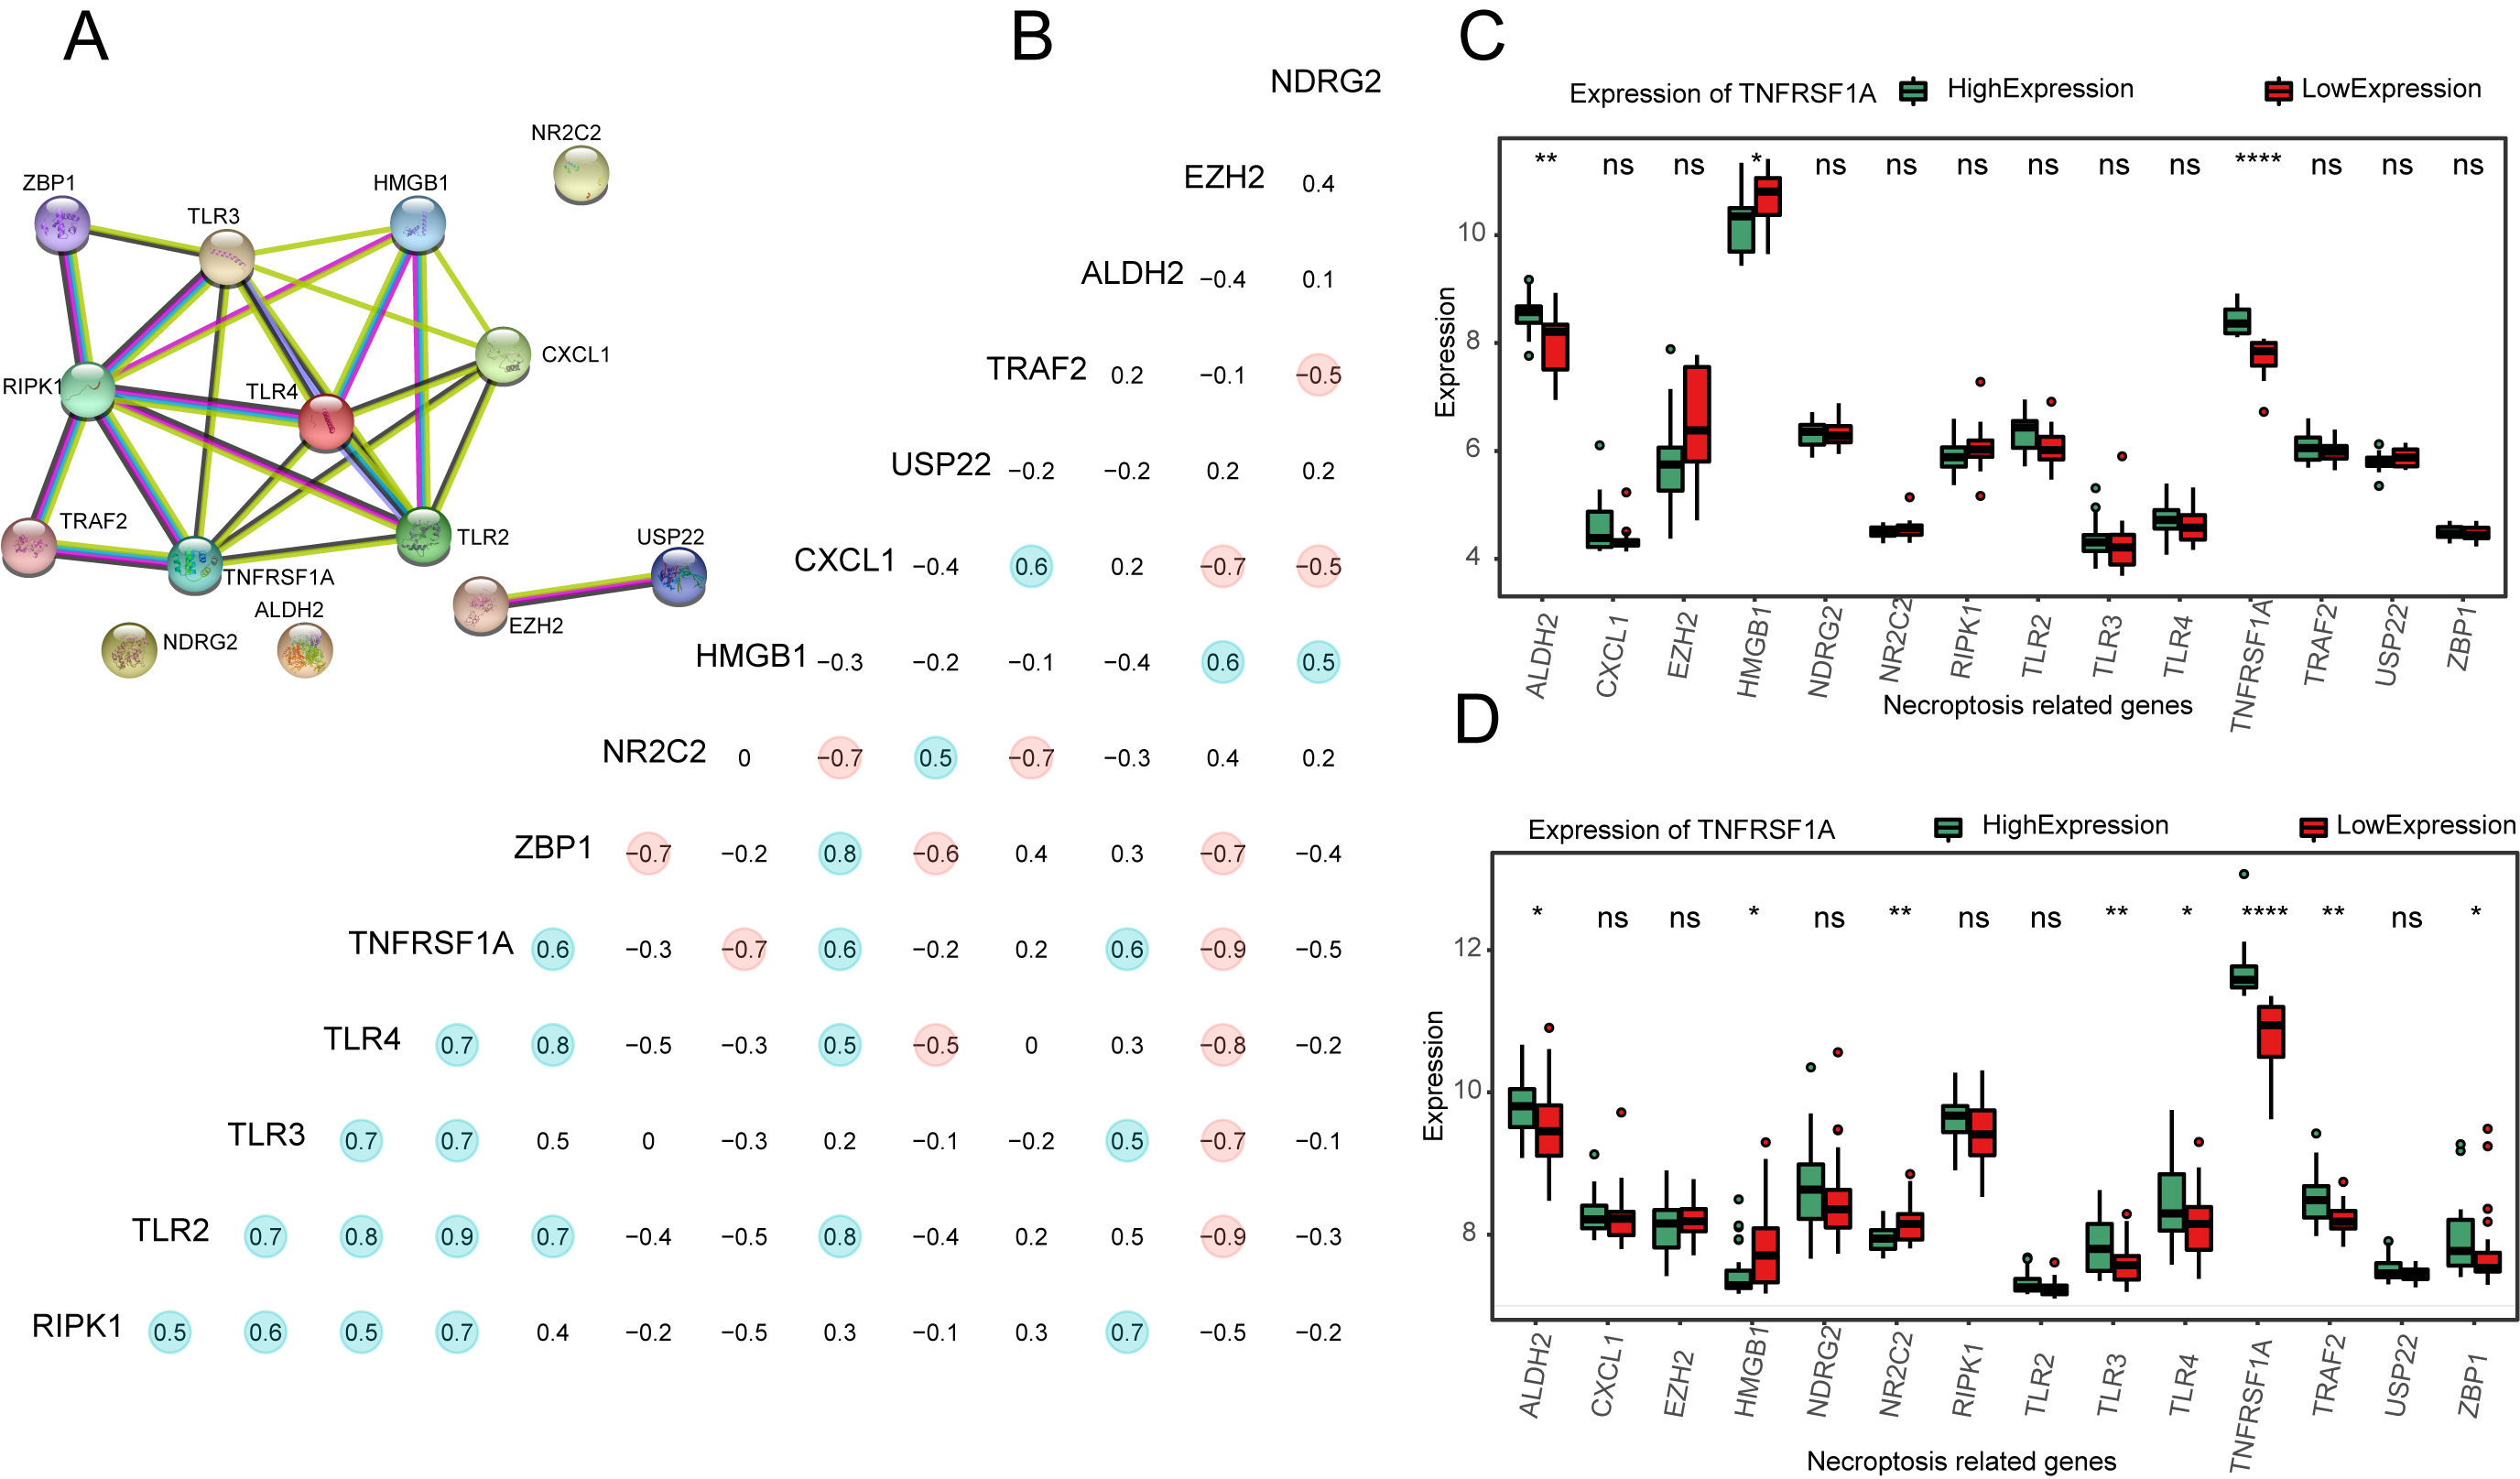
Figure 7.
Correlation analysis of different risk factors in OS prognosis. (a) Forest plot of TNFRSF1A expression, age, and sex in TARGET-OS cohort, labeled with HR and
2.10Statistical analysis
To compare variables between the two groups, the Student’s
3.Results
A flowchart of the study process is shown in Fig. 1. TNFRSF1A was screened from the intersection of TARGET-OS and NRGs using univariate Cox regression analysis. High- and low-expression groups were distinguished based on the median expression level of TNFRSF1A. There were no significant differences in TNFRSF1A expression in the age (older or younger than 14 years) and sex (female or male) subgroups of the TARGET-OS cohort, indicating that the expression of TNFRSF1A was not related to age or sex in patients with OS (Fig. 2a and b). However, the survival outcomes of the high-expression groups were better than those of the low-expression groups of TNFRSF1A (Fig. 2c). In addition to TNFRSF1A, the expression of three other genes in the 14 NRGs was significantly different between the two TNFRSF1A risk groups (Fig. 2d): TLR2 (
3.1DEG screening
In the TARGET-OS, GSE16091, and GSE21257 datasets, DEGs were screened using the median TNFRSF1A expression as a cut-off and for drawing volcano plots, with absolute values of Log2FC
3.2Enrichment analyses
A total of 1465 DEGs in the TARGET-OS dataset were analyzed using GO and KEGG enrichment analyses (Supplementary Table S1). GSEA was performed to clarify the different pathways and functions associated with different prognoses (Supplementary Table S2). Enrichment analysis primarily focuses on immune-related biological processes, including neutrophil activation, neutrophil-mediated immunity, and antigen-processing immune responses (Figs S1 and S2).
3.3PPI network analysis for NRGs
PPI network plots were constructed using the STRING database (Fig. 4a) and the correlation coefficients of the 14 NRGs were calculated. Those with absolute values greater than 0.5 were marked with color (Fig. 4b). The expression of NRGs was calculated and plotted as a box plot between the high- and low-expression groups of TNFRSF1A (Fig. 4c and d). In GSE16091, the expression of ALDH2 (
3.4Immune cell infiltration
Thedegree of immune cell enrichment was calculated using ssGSEA algorithm. The immune cell enrichment score was lower in the TNFRSF1A low-expression group than in the high-expression group (Fig. 5a). However, the correlation are weak between pro-tumor suppression and anti-tumor immunity (Fig. 5b). Immune cell infiltration analysis of Target-OS samples showed a low enrichment of type 2 T helper cells and a high enrichment of activated B cells (Fig. 5c). Box plots of the proportions of immune cells in the two TNFRSF1A groups showed a significant difference between activated dendritic cells and activated CD8
3.5Immunotherapy with immune checkpoints
The immune checkpoints Cytotoxic T lymphocyte-associated antigen-4 (CTLA4), lymphocyte activation gene 3 (LAG-3), and T cell immunoreceptor with Ig and ITIM domains (TIGIT) were selected to clarify the differences in immunotherapy for TNFRSF1A. In the TARGET-OS training set, the expression level of LAG3 was considerably higher in the TNFRSF1A high expression group (Fig. 6a). A similar trend was evident in the validation dataset, GSE16091 (Fig. 6b). However, none of the three immune checkpoints was differentially expressed in the GSE21257 dataset (Fig. 6c). Stromal score, immune score, estimated score, and tumor purity were calculated using the TARGET-OS dataset. The low-expression group had lower stromal, immune, and estimated scores (Fig. 6d–f). In contrast, the tumor purity of the high-expression group was much higher (Fig. 6g).
3.6Prognostic correlation of risk factors in OS
In the TARGET-OS dataset, a multivariate Cox regression analysis forest plot was constructed using TNFRSF1A expression, age, and sex (Fig. 7a). Only the factor “TNFRSF1A expression” was located to the left of the null line (HR
4.Discussion
OS, a rare malignant bone tumor, is characterized by the direct production of tumor cells in bone-like tissues, causing pathological changes in the body’s bone tissue that affect bone health. Recently, owing to the deficiency of early diagnostic markers and the rapid development of the disease, most patients with OS are already in advanced stages after diagnosis and must undergo surgery due to intolerable physical and psychological trauma [6]. In recent years, targeted gene therapy has emerged as a promising treatment for OS [8]. Necroptosis is a widely studied form of cell death, and many studies have shown that NRG can be used as a target molecule for the prognosis or diagnosis of diseases such as osteoarthritis [40] and osteoporosis [41]. However, the exact targets of NRG and its detailed therapeutic mechanisms remain unknown. In this study, TNFRSF1A, a critical NRG that can be used as a diagnostic marker for OS, was screened using univariate Cox regression analysis. We used TARGET-OS as the training group, and GSE16091 and GSE21257 as the validation groups. The normality and DCA curves confirmed the validity of the model. Immune infiltration and immune checkpoint analyses performed on the three datasets indicated that TNFRSF1A is a good diagnostic marker of OS.
Necroptosis is preprogrammed death triggered by death receptors, interferons, toll-like receptors, intracellular RNA and DNA sensors, and other mediators [42]. Based on univariate Cox regression analysis, among the 14 evaluated NRGs [22], the prioritization of TNFRSF1A arises from its noteworthy association with OS prognosis and its pertinence in immune-related mechanisms in OS pathogenesis. The decision to investigate TNFRSF1A was further grounded in its established involvement in immune signaling pathways and its potential capacity to modulate tumorigenesis. Consequently, TNFRSF1A was designated as the central focus of subsequent endeavors involving enrichment analyses, immune analyses, and prognostic modeling. TNFRSF1A encodes TNF receptor type I TNFR1, also known as CD120a [43]. In addition, TNFRSF1A has shown potential as a biomarker for various tumors. In non-small cell lung cancer, TNFRSF1A is closely correlated with tumor microenvironment changes and tumor mutation burden (TMB), and is positively correlated with the adverse prognosis of the disease [44]. In clear cell renal cell carcinoma, TNFRSF1A is significantly associated with clinicopathological features, TMB, and expected survival time [45]. These results contradict the results of the present study. However, TNFRSF1A acts as a protective gene involved in the regulation of pyroptosis in OS cells. In the high-risk OS group, the expression level of TNFRSF1A was reduced, whereas the incidence of pyroptosis was significantly increased [46]. The finding is consistent with the results of the present study. It has been suggested that TNFRSF1A, whether involved in necroptosis or pyroptosis, exerts an inhibitory effect on OS progression. Lung, renal, and breast cancers are visceral cancers that are mainly found in middle-aged and elderly individuals, whereas OS is more common in teenagers. Research indicates that TNFR1 is involved in the progression of lung cancer by mediating tumor cell-induced endothelial cell death, tumor cell extravasation, and metastatic seeding [47]. TNFR1 participates in the growth and survival of clear cell renal cell carcinoma by promoting cell cycle entry, activating NF-
In this study, we identified other potential NRGs associated with OS. HMGB1 mainly promotes inflammation, cell differentiation, and tumor cell migration [51]. However, in contrast to TNFRSF1A, HMGB1 is delineated as a gene associated with tumor malignancy, demonstrating the potential targeting efficacy of HMGB1 within the immune checkpoint and tumor microenvironment [52, 53]. Our study uncovers HMGB1 as a functionally implicated gene linked to adverse prognosis in OS, potentially rendering it a target for numerous non-coding RNAs that regulate this condition [54, 55]. Signal transducer and activator of transcription 3 (STAT3) is a recognized proto-oncogene, and its sustained activation is associated with the development of various cancers. In OS, elevated expression of STAT3 is linked to an adverse prognosis while driving disease processes, such as proliferation and immune evasion [56]. Wang et al. found that lncRNA AK093407 is highly expressed in both OS cells and tissues, facilitating cell proliferation and survival through STAT3 activation while inhibiting apoptosis in the OS cell line U-2OS [57]. Jiang et al. discovered that the combination of AMD3100 and triptolide effectively reduced the proliferation and metastasis of U2OS cells, while inducing apoptosis. This effect is potentially attributed to the modulation of NF-
Immune infiltration analysis showed that in the TNFRSF1A risk group, activated dendritic cell expression levels were high in the high-expression group, and activated CD8
This study had some limitations. First, as a bioinformatics analysis, this study presents a theoretical diagnostic model that has not been experimentally validated and its accuracy still needs to be evaluated. Therefore, larger sample sizes are required to verify and improve the clinical translation potential of the signature. In addition, limited genetic data are available for the analysis of immune infiltration and immune scores; therefore, heterotypic cell associations and disorders induced by various illnesses might contribute to bias in immunoassays. Finally, the relationship between the potential mechanism of TNFRSF1A and OS needs to be discussed in detail.
5.Conclusion
In this study, we identified TNFRSF1A as a critical necroptosis-based prognostic gene for OS using univariate Cox regression analysis. Immune analysis revealed the involvement of the immune checkpoint LAG-3 in CD8
Author contributions
Yuke Zhang and Kai Liu contributed to the conception, design, and manuscript preparation; Jianzhong Wang contributed to the revision of important intellectual content and supervision. All authors contributed to the article and approved the submitted version.
Funding
No Funding.
Supplementary data
The supplementary files are available to download from http://dx.doi.org/10.3233/CBM-230086.
Acknowledgments
The authors declare no conflict of interest. The dataset involved in the present study is available in the TARGET (http://target.nci.nih.gov) GSE16091 (https://www.ncbi.nlm.nih.gov/geo/query/acc.cgi?acc= GSE16091) and (GSE21257) (https://www.ncbi.nlm. nih.gov/geo/query/acc.cgi?acc=GSE21257) repository. This study was funded by National Natural Science Foundation of China (NSFC, No. 81860401).
References
[1] | M.W. Bishop, K.K. Ness, C. Li, W. Liu, D.K. Srivastava, W. Chemaitilly, K.R. Krull, D.M. Green, A.S. Pappo, L.L. Robison, M.M. Hudson and D.A. Mulrooney, Cumulative burden of chronic health conditions in adult survivors of osteosarcoma and ewing sarcoma: A report from the st. jude lifetime cohort study, Cancer Epidemiology, Biomarkers & Prevention 29: ((2020) ), 1627–1638. |
[2] | M.F. Hansen, M. Seton and A. Merchant, Osteosarcoma in paget’s disease of bone, Journal of Bone and Mineral Research 21: ((2006) ), P58–P63. |
[3] | Y. Xu, F. Shi, Y. Zhang, M. Yin, X. Han, J. Feng and G. Wang, Twenty-year outcome of prevalence, incidence, mortality and survival rate in patients with malignant bone tumors, International Journal of Cancer n/a: ((2023) ). |
[4] | L. Mirabello, R.J. Troisi and S.A. Savage, Osteosarcoma incidence and survival rates from 1973 to 2004, Cancer 115: ((2009) ), 1531–1543. |
[5] | M.A. Harris and C.J. Hawkins, Recent and ongoing research into metastatic osteosarcoma treatments, Int J Mol Sci 23: ((2022) ). |
[6] | B. Moukengue, M. Lallier, L. Marchandet, M. Baud’huin, F. Verrecchia, B. Ory and F. Lamoureux, Origin and therapies of osteosarcoma, Cancers (Basel) 14: ((2022) ). |
[7] | S. Miwa, N. Yamamoto, K. Hayashi, A. Takeuchi, K. Igarashi and H. Tsuchiya, Therapeutic targets for bone and soft-tissue sarcomas, Int J Mol Sci 20: ((2019) ). |
[8] | Y.X. Ge, T.W. Zhang, L. Zhou, W. Ding, H.F. Liang, Z.C. Hu, Q. Chen, J. Dong, F.F. Xue, X.F. Yin and L.B. Jiang, Enhancement of anti-PD-1/PD-L1 immunotherapy for osteosarcoma using an intelligent autophagy-controlling metal organic framework, Biomaterials 282: ((2022) ), 121407. |
[9] | C. Zhang and N. Liu, Ferroptosis, necroptosis, and pyroptosis in the occurrence and development of ovarian cancer, Front Immunol 13: ((2022) ), 920059. |
[10] | J. Clusmann, K.C. Franco, D.A.C. Suárez, I. Katona, M.G. Minguez, N. Boersch, K.P. Pissas, J. Vanek, Y. Tian and S. Gründer, Acidosis induces RIPK1-dependent death of glioblastoma stem cells via acid-sensing ion channel 1a, Cell Death Dis 13: ((2022) ), 702. |
[11] | J. Zhu, J. Wang, T. Wang, H. Zhou, M. Xu, J. Zha, C. Feng, Z. Shen, Y. Jiang and J. Chen, Identification of molecular subtypes, risk signature, and immune landscape mediated by necroptosis-related genes in non-small cell lung cancer, Front Oncol 12: ((2022) ), 955186. |
[12] | Y. Gong, J. Qiu, J. Ye, T. Jiang, W. Zhang, X. Zheng, Z. Zhu, L. Chen, Z. Wang, S. Mi and Z. Hong, AZ-628 delays osteoarthritis progression via inhibiting the TNF-α-induced chondrocyte necroptosis and regulating osteoclast formation, Int Immunopharmacol 111: ((2022) ), 109085. |
[13] | X. Fan, X. Xu, X. Wu, R. Xia, F. Gao, Q. Zhang and W. Sun, The protective effect of DNA aptamer on osteonecrosis of the femoral head by alleviating TNF-α-mediated necroptosis via RIP1/RIP3/MLKL pathway, J Orthop Translat 36: ((2022) ), 44–51. |
[14] | J. Li, X. Tang, Y. Du, J. Dong, Z. Zhao, H. Hu, T. Song, J. Guo, Y. Wang, T. Xu, C. Shao, Y. Sheng and Y. Xi, Establishment of an autophagy-related clinical prognosis model for predicting the overall survival of osteosarcoma, Biomed Res Int 2021: ((2021) ), 5428425. |
[15] | L. Hua, P. Lei and Y. Hu, Construction and validation model of necroptosis-related gene signature associates with immunity for osteosarcoma patients, Sci Rep 12: ((2022) ), 15893. |
[16] | Y. Zheng, J. Xu, J. Lin and Y. Lin, A Novel Necroptosis-Related lncRNA Signature for Osteosarcoma, Comput Math Methods Med 2022: ((2022) ), 8003525. |
[17] | S. Boboila, G. Lopez, J. Yu, D. Banerjee, A. Kadenhe-Chiweshe, E.P. Connolly, J.J. Kandel, P. Rajbhandari, J.M. Silva, A. Califano and D.J. Yamashiro, Transcription factor activating protein 4 is synthetically lethal and a master regulator of MYCN-amplified neuroblastoma, Oncogene 37: ((2018) ), 5451–5465. |
[18] | Y. Shi, R. He, Z. Zhuang, J. Ren, Z. Wang, Y. Liu, J. Wu, S. Jiang and K. Wang, A risk signature-based on metastasis-associated genes to predict survival of patients with osteosarcoma, J Cell Biochem 121: ((2020) ), 3479–3490. |
[19] | M. Yang, X. Ma, Z. Wang, T. Zhang, Y. Hua and Z. Cai, Identification of a novel glycolysis-related gene signature for predicting the prognosis of osteosarcoma patients, Aging (Albany NY) 13: ((2021) ), 12896–12918. |
[20] | T. Barrett, D.B. Troup, S.E. Wilhite, P. Ledoux, D. Rudnev, C. Evangelista, I.F. Kim, A. Soboleva, M. Tomashevsky and R. Edgar, NCBI GEO: Mining tens of millions of expression profiles-database and tools update, Nucleic Acids Res 35: ((2007) ), D760–5. |
[21] | M.E. Ritchie, B. Phipson, D. Wu, Y. Hu, C.W. Law, W. Shi and G.K. Smyth, limma powers differential expression analyses for RNA-sequencing and microarray studies, Nucleic Acids Res 43: ((2015) ), e47. |
[22] | N. Wang and D. Liu, Identification and validation a necroptosis-related prognostic signature and associated regulatory axis in stomach adenocarcinoma, Onco Targets Ther 14: ((2021) ), 5373–5383. |
[23] | J.C. Xi, H.Y. Zang, L.X. Guo, H.B. Xue, X.D. Liu, Y.B. Bai and Y.Z. Ma, The PI3K/AKT cell signaling pathway is involved in regulation of osteoporosis, J Recept Signal Transduct Res 35: ((2015) ), 640–645. |
[24] | L. Xiang, W. Yang, F. Wang and G. Liu, Circ_0083964 knockdown impedes rheumatoid arthritis progression via the miR-204-5p-dependent regulation of YY1, J Orthop Surg Res 17: ((2022) ), 558. |
[25] | M. Ashburner, C.A. Ball, J.A. Blake, D. Botstein, H. Butler, J.M. Cherry, A.P. Davis, K. Dolinski, S.S. Dwight, J.T. Eppig, M.A. Harris, D.P. Hill, L. Issel-Tarver, A. Kasarskis, S. Lewis, J.C. Matese, J.E. Richardson, M. Ringwald, G.M. Rubin and G. Sherlock, Gene ontology: Tool for the unification of biology. The Gene Ontology Consortium, Nat Genet 25: ((2000) ), 25–29. |
[26] | M. Kanehisa and S. Goto, KEGG: Kyoto encyclopedia of genes and genomes, Nucleic Acids Res 28: ((2000) ), 27–30. |
[27] | G. Yu, L.G. Wang, Y. Han and Q.Y. He, clusterProfiler: An R package for comparing biological themes among gene clusters, Omics 16: ((2012) ), 284–287. |
[28] | T. Wu, E. Hu, S. Xu, M. Chen, P. Guo, Z. Dai, T. Feng, L. Zhou, W. Tang, L. Zhan, X. Fu, S. Liu, X. Bo and G. Yu, clusterProfiler 4.0: A universal enrichment tool for interpreting omics data, Innovation (Camb) 2: ((2021) ), 100141. |
[29] | W. Walter, F. Sánchez-Cabo and M. Ricote, GOplot: An R package for visually combining expression data with functional analysis, Bioinformatics 31: ((2015) ), 2912–2914. |
[30] | A. Subramanian, P. Tamayo, V.K. Mootha, S. Mukherjee, B.L. Ebert, M.A. Gillette, A. Paulovich, S.L. Pomeroy, T.R. Golub, E.S. Lander and J.P. Mesirov, Gene set enrichment analysis: A knowledge-based approach for interpreting genome-wide expression profiles, Proc Natl Acad Sci U S A 102: ((2005) ), 15545–15550. |
[31] | A. Liberzon, C. Birger, H. Thorvaldsdóttir, M. Ghandi, J.P. Mesirov and P. Tamayo, The Molecular Signatures Database (MSigDB) hallmark gene set collection, Cell Syst 1: ((2015) ), 417–425. |
[32] | C. von Mering, M. Huynen, D. Jaeggi, S. Schmidt, P. Bork and B. Snel, STRING: A database of predicted functional associations between proteins, Nucleic Acids Res 31: ((2003) ), 258–261. |
[33] | P. Charoentong, F. Finotello, M. Angelova, C. Mayer, M. Efremova, D. Rieder, H. Hackl and Z. Trajanoski, Pan-cancer immunogenomic analyses reveal genotype-immunophenotype relationships and predictors of response to checkpoint blockade, Cell Rep 18: ((2017) ), 248–262. |
[34] | S. Bhattacharya, P. Dunn, C.G. Thomas, B. Smith, H. Schaefer, J. Chen, Z. Hu, K.A. Zalocusky, R.D. Shankar, S.S. Shen-Orr, E. Thomson, J. Wiser and A.J. Butte, ImmPort, toward repurposing of open access immunological assay data for translational and clinical research, Sci Data 5: ((2018) ), 180015. |
[35] | S. Hänzelmann, R. Castelo and J. Guinney, GSVA: Gene set variation analysis for microarray and RNA-seq data, BMC Bioinformatics 14: ((2013) ), 7. |
[36] | A. Kalbasi and A. Ribas, Tumour-intrinsic resistance to immune checkpoint blockade, Nat Rev Immunol 20: ((2020) ), 25–39. |
[37] | K. Yoshihara, M. Shahmoradgoli, E. Martínez, R. Vegesna, H. Kim, W. Torres-Garcia, V. Treviño, H. Shen, P.W. Laird, D.A. Levine, S.L. Carter, G. Getz, K. Stemke-Hale, G.B. Mills and R.G. Verhaak, Inferring tumour purity and stromal and immune cell admixture from expression data, Nat Commun 4: ((2013) ), 2612. |
[38] | X. Wu, S. Qiao, W. Wang, Y. Zhang, J. Shi, X. Zhang, W. Gu, X. Zhang, Y. Li, X. Ding, J. Wei, Y. Gu and H. Lai, Melatonin prevents peri-implantitis via suppression of TLR4/NF-κB, Acta Biomater 134: ((2021) ), 325–336. |
[39] | Y. Zhu, B. Chang, Y. Pang, H. Wang and Y. Zhou, Advances in Hypoxia-Inducible Factor-1 |
[40] | J. Cheng, X. Duan, X. Fu, Y. Jiang, P. Yang, C. Cao, Q. Li, J. Zhang, X. Hu, X. Zhang and Y. Ao, RIP1 perturbation induces chondrocyte necroptosis and promotes osteoarthritis pathogenesis via targeting BMP7, Front Cell Dev Biol 9: ((2021) ), 638382. |
[41] | B. He, Y. Zhu, H. Cui, B. Sun, T. Su and P. Wen, Comparison of Necroptosis With Apoptosis for OVX-Induced Osteoporosis, Front Mol Biosci 8: ((2021) ), 790613. |
[42] | X. Liu, F. Lu and X. Chen, Examination of the role of necroptotic damage-associated molecular patterns in tissue fibrosis, Front Immunol 13: ((2022) ), 886374. |
[43] | T. Akagi, S. Hiramatsu-Asano, K. Ikeda, H. Hirano, S. Tsuji, A. Yahagi, M. Iseki, M. Matsuyama, T.W. Mak, K. Nakano, K. Ishihara, Y. Morita and T. Mukai, TRAPS mutations in Tnfrsf1a decrease the responsiveness to TNFα via reduced cell surface expression of TNFR1, Front Immunol 13: ((2022) ), 926175. |
[44] | J. Dai and Y. Fu, Identification of necroptosis-related gene signature and characterization of tumour microenvironment infiltration in non-small-cell lung cancer, J Cell Mol Med 26: ((2022) ), 4698–4709. |
[45] | S. Xin, J. Mao, C. Duan, J. Wang, Y. Lu, J. Yang, J. Hu, X. Liu, W. Guan, T. Wang, S. Wang, J. Liu, W. Song and X. Song, Identification and quantification of necroptosis landscape on therapy and prognosis in kidney renal clear cell carcinoma, Front Genet 13: ((2022) ), 832046. |
[46] | Z. Li, C. Jin, X. Lu, Y. Zhang, Y. Zhang, J. Wen, Y. Liu, X. Liu and J. Li, Developing a 5-gene signature related to pyroptosis for osteosarcoma patients, J Oncol 2022: ((2022) ), 1317990. |
[47] | J. Bolik, F. Krause, M. Stevanovic, M. Gandraß, I. Thomsen, S.S. Schacht, E. Rieser, M. Müller, N. Schumacher, J. Fritsch, R. Wichert, E. Galun, J. Bergmann, C. Röder, C. Schafmayer, J.H. Egberts, C. Becker-Pauly, P. Saftig, R. Lucius, W. Schneider-Brachert, R. Barikbin, D. Adam, M. Voss, W. Hitzl, A. Krüger, B. Strilic, I. Sagi, H. Walczak, S. Rose-John and D. Schmidt-Arras, Inhibition of ADAM17 impairs endothelial cell necroptosis and blocks metastasis, J Exp Med 219: ((2022) ). |
[48] | M.M. Speeckaert, R. Speeckaert, M. Laute, R. Vanholder and J.R. Delanghe, Tumor necrosis factor receptors: Biology and therapeutic potential in kidney diseases, Am J Nephrol 36: ((2012) ), 261–270. |
[49] | E.M. Meškytė, L. Pezzè, L. Bartolomei, M. Forcato, I.A. Bocci, G. Bertalot, M. Barbareschi, L. Oliveira-Ferrer, A. Bisio, S. Bicciato, D. Baltriukienė and Y. Ciribilli, ETV7 reduces inflammatory responses in breast cancer cells by repressing the TNFR1/NF-κB axis, Cell Death Dis 14: ((2023) ), 263. |
[50] | S. Lin, L. Zhou, Y. Dong, Q. Yang, Q. Yang, H. Jin, T. Yuan and S. Zhou, Alpha-(16)-fucosyltransferase, (FUT8) affects the survival strategy of osteosarcoma by remodeling TNF/NF-κB2 signaling, Cell Death Dis 12: ((2021) ), 1124. |
[51] | F. Novelli, A. Bononi, Q. Wang, F. Bai, S. Patergnani, F. Kricek, E. Haglund, J.S. Suarez, M. Tanji, R. Xu, Y. Takanishi, M. Minaai, S. Pastorino, P. Morris, G. Sakamoto, H.I. Pass, H. Barbour, G. Gaudino, C. Giorgi, P. Pinton, J.N. Onuchic, H. Yang and M. Carbone, BAP1 forms a trimer with HMGB1 and HDAC1 that modulates gene × environment interaction with asbestos, Proc Natl Acad Sci U S A 118: ((2021) ). |
[52] | P. Hubert, P. Roncarati, S. Demoulin, C. Pilard, M. Ancion, C. Reynders, T. Lerho, D. Bruyere, A. Lebeau, C. Radermecker, M. Meunier, M.J. Nokin, E. Hendrick, O. Peulen, P. Delvenne and M. Herfs, Extracellular HMGB1 blockade inhibits tumor growth through profoundly remodeling immune microenvironment and enhances checkpoint inhibitor-based immunotherapy, J Immunother Cancer 9: ((2021) ). |
[53] | Y. Ren, L. Cao, L. Wang, S. Zheng, Q. Zhang, X. Guo, X. Li, M. Chen, X. Wu, F. Furlong, Z. Meng and K. Xu, Autophagic secretion of HMGB1 from cancer-associated fibroblasts promotes metastatic potential of non-small cell lung cancer cells via NFκB signaling, Cell Death Dis 12: ((2021) ), 858. |
[54] | P. Lou, T. Ding and X. Zhan, Long Noncoding RNA HNF1A-AS1 Regulates Osteosarcoma Advancement Through Modulating the miR-32-5p/HMGB1 Axis, Cancer Biother Radiopharm 36: ((2021) ), 371–381. |
[55] | Y. Yu, G. Dong, Z. Li, Y. Zheng, Z. Shi and G. Wang, circ-LRP6 contributes to osteosarcoma progression by regulating the miR-141-3p/HDAC4/HMGB1 axis, Int J Oncol 60: ((2022) ). |
[56] | Y. Liu, S. Liao, S. Bennett, H. Tang, D. Song, D. Wood, X. Zhan and J. Xu, STAT3 and its targeting inhibitors in osteosarcoma, Cell Prolif 54: ((2021) ), e12974. |
[57] | Long non-coding RNA AK093407 promotes proliferation and inhibits apoptosis of human osteosarcoma cells via STAT3 activation [Retraction], Am J Cancer Res 11: ((2021) ), 623. |
[58] | C. Jiang, X. Fang, H. Zhang, X. Wang, M. Li, W. Jiang, F. Tian, L. Zhu and Z. Bian, AMD3100 combined with triptolide inhibit proliferation, invasion and metastasis and induce apoptosis of human U2OS osteosarcoma cells, Biomed Pharmacother 86: ((2017) ), 677–685. |
[59] | S.P. Egusquiaguirre, J.E. Yeh, S.R. Walker, S. Liu and D.A. Frank, The STAT3 Target Gene TNFRSF1A Modulates the NF-κB Pathway in Breast Cancer Cells, Neoplasia 20: ((2018) ), 489–498. |
[60] | I.D. Oliveira, A.S. Petrilli, M.H. Tavela, M.A. Zago and S.R. de Toledo, TNF-alpha, TNF-beta, IL-6, IL-10, PECAM-1 and the MPO inflammatory gene polymorphisms in osteosarcoma, J Pediatr Hematol Oncol 29: ((2007) ), 293–297. |
[61] | X. Wang and Z. Liu, Systematic meta-analysis of genetic variants associated with osteosarcoma susceptibility, Medicine (Baltimore) 97: ((2018) ), e12525. |
[62] | J. Liu, J. Wang, W. Jiang and Y. Tang, Effect of cytotoxic T-lymphocyte antigen-4, TNF-alpha polymorphisms on osteosarcoma: Evidences from a meta-analysis, Chin J Cancer Res 25: ((2013) ), 671–678. |
[63] | J.A. Ligon, W. Choi, G. Cojocaru, W. Fu, E.H. Hsiue, T.F. Oke, N. Siegel, M.H. Fong, B. Ladle, C.A. Pratilas, C.D. Morris, A. Levin, D.S. Rhee, C.F. Meyer, A.J. Tam, R. Blosser, E.D. Thompson, A. Suru, D. McConkey, F. Housseau, R. Anders, D.M. Pardoll and N. Llosa, Pathways of immune exclusion in metastatic osteosarcoma are associated with inferior patient outcomes, J Immunother Cancer 9: ((2021) ). |
[64] | M. Gupta, K. Chandan and M. Sarwat, Natural products and their derivatives as immune check point inhibitors: Targeting cytokine/chemokine signalling in cancer, Semin Cancer Biol 86: ((2022) ), 214–232. |
[65] | S.R. Woo, M.E. Turnis, M.V. Goldberg, J. Bankoti, M. Selby, C.J. Nirschl, M.L. Bettini, D.M. Gravano, P. Vogel, C.L. Liu, S. Tangsombatvisit, J.F. Grosso, G. Netto, M.P. Smeltzer, A. Chaux, P.J. Utz, C.J. Workman, D.M. Pardoll, A.J. Korman, C.G. Drake and D.A. Vignali, Immune inhibitory molecules LAG-3 and PD-1 synergistically regulate T-cell function to promote tumoral immune escape, Cancer Res 72: ((2012) ), 917–927. |
[66] | H.A. Tawbi, D. Schadendorf, E.J. Lipson, P.A. Ascierto, L. Matamala, E. Castillo Gutiérrez, P. Rutkowski, H.J. Gogas, C.D. Lao, J.J. De Menezes, S. Dalle, A. Arance, J.J. Grob, S. Srivastava, M. Abaskharoun, M. Hamilton, S. Keidel, K.L. Simonsen, A.M. Sobiesk, B. Li, F.S. Hodi and G.V. Long, Relatlimab and Nivolumab versus Nivolumab in Untreated Advanced Melanoma, N Engl J Med 386: ((2022) ), 24–34. |


