
Urinary VOCs as biomarkers of early stage lung tumour development in mice
Abstract
BACKGROUND:
Lung cancer is the primary cause of cancer-induced death. In addition to prevention and improved treatment, it has increasingly been established that early detection is critical to successful remission.
OBJECTIVE:
The aim of this study was to identify volatile organic compounds (VOCs) in urine that could help diagnose mouse lung cancer at an early stage of its development.
METHODS:
We analysed the VOC composition of urine in a genetically engineered lung adenocarcinoma mouse model with oncogenic EGFR doxycycline-inducible lung-specific expression. We compared the urinary VOCs of 10 cancerous mice and 10 healthy mice (controls) before and after doxycycline induction, every two weeks for 12 weeks, until full-blown carcinomas appeared. We used SPME fibres and gas chromatography – mass spectrometry to detect variations in cancer-related urinary VOCs over time.
RESULTS:
This study allowed us to identify eight diagnostic biomarkers that help discriminate early stages of cancer tumour development (i.e., before MRI imaging techniques could identify it).
CONCLUSION:
The analysis of mice urinary VOCs have shown that cancer can induce changes in odour profiles at an early stage of cancer development, opening a promising avenue for early diagnosis of lung cancer in other models.
1.Introduction
Cancer is one of the deadliest diseases in the world, with more than nine million casualties in 2022 [1]. Of the many cancers affecting humans, 18% are lung cancers. In 90% of these cases, deaths are due to metastasis rather than primary tumours [2, 3]. Lung cancers, like many other cancers, are difficult to detect at early stages. In addition to improvements in prevention and treatment, there is growing evidence that early detection is often critical to successful remission: patients whose cancer was diagnosed and treated at an early stage were shown to have better long-term survival than patients whose tumours were not detected before the appearance of symptoms (e.g., cervical, colorectal, and breast cancers [4, 5]). The current diagnostic techniques are radiography, magnetic resonance imaging, and biopsy [6, 7]. These methods are effective, but they have the disadvantages of being either invasive, expensive, time-consuming, or necessitate facilities only present in large hospitals [8, 9, 10]. In addition to these diagnostic techniques, the search for specific biomarkers has increased with the progress of high-throughput techniques [11]. Diagnostic biomarkers include proteins, tumour antigens, and gene transcripts found in urine or blood [5, 12]. However, none of the biomarkers identified so far has sufficient sensitivity, specificity, or reproducibility to diagnose lung cancer early enough to prevent metastasis. The identification and validation of non-invasive biomarkers that could effectively help diagnose lung cancer at an early stage remain critical to address the main cause of human death by cancer in the world [13].
Over the past 20 years, increased attention has been devoted to exploring the potential use of volatile organic compounds (VOCs) as non-invasive biomarkers of early stage cancers. Two-thirds of these studies involved lung cancer [14]. Although many studies have indicated significant differences in the VOC profiles of healthy versus cancerous patients in humans [15, 16] or mice [17, 18], it is still unknown how early in cancer development variations in VOCs composition may take place.
The aim of this study was to identify candidate VOCs that may be associated with early cancer development. We used a genetically engineered mouse model (GEMM) harbouring two different transgenes, the lung-specific CCSP-rtTA and a human EGFR with an activating mutation (EGFRL858R) that after eight to 12 weeks of doxycycline treatment induce detectable EGFR-driven lung adenocarcinoma [19]. We compared VOC profiles of cancerous mice (CC) and their negative control littermates (NC). Since doxycycline is an antibiotic and may induce changes in gut microbiota, influencing mouse urinary VOCs [20], we compared VOCs in the urine of CC and NC mice before and after doxycycline treatment. We also compared VOC profiles of CC and NC mice at different stages of tumour development, seeking to identify specific VOCs that could help diagnose cancer development at earlier stages than the current diagnostic tools for lung cancer [19].
2.Materials and methods
2.1Ethical clearance
Our study involved a transgenic mouse model for which all precautions for animal welfare were taken. The project received ethical clearance by the Ethical Committee for Animal Experimentation (French Ministry of Higher Education, Research and Innovation) number 1645-22123.
2.2Mice
Urine samples were obtained from CCSP/EGFRTL transgenic mice, that were generated by crossing the Tet-ON-EGFRT790M/L858R transgenic mouse strain (hereinafter EGFRTL) with the CCSP-rtTA strain (hereafter CCSP) carrying rtTA, an inverse tetracycline-responsive element under the control of the lung-specific promoter CCSP. In CCSP/EGFRTL mice, the EGFR gene contains both L858R mutations (causing EGFR-constitutive activation in the absence of ligands such as EGF) and the T790M gate-keeper mutation (conferring resistance to the first generation of EGFR inhibitors, i.e., gefitinib/erlotinib). Crosses were kept in heterozygosity, so littermates could have any of the four possible genotypes: WT/WT, WT/EGFRTLtg, CCSPtg/WT, and CCSPtg/EGFRTLtg. In our experimental setting, we used WT/WT mice – lacking both the CCSP and EGFRTL transgenes – and so unable to develop tumours upon doxycycline induction (hereafter non-cancerous [NC] mice), and CCSPtg/EGFRTLtg mice carrying both transgenes so lung tumours develop upon doxycycline induction (hereafter cancerous [CC] mice). This system allows the expression of EGFRTL specifically in the lungs, but only upon doxycycline exposure, thus leading to the development of peripheral adenocarcinomas with bronchioloalveolar features in alveoli as well as papillary adenocarcinomas [19, 21]. Mice were 13 weeks old when doxycycline was added to their food for lung-specific oncogene induction.
Twenty transgenic male mice were involved in our study, 10 CC and 10 NC. They were bred at the IRCM (Montpellier Cancer Research Institute) and maintained at the breeding facilities of the IRD (Institute of research and development) of Montpellier at six weeks of age. Mice were kept in groups of two to four in transparent cages (26.8 cm
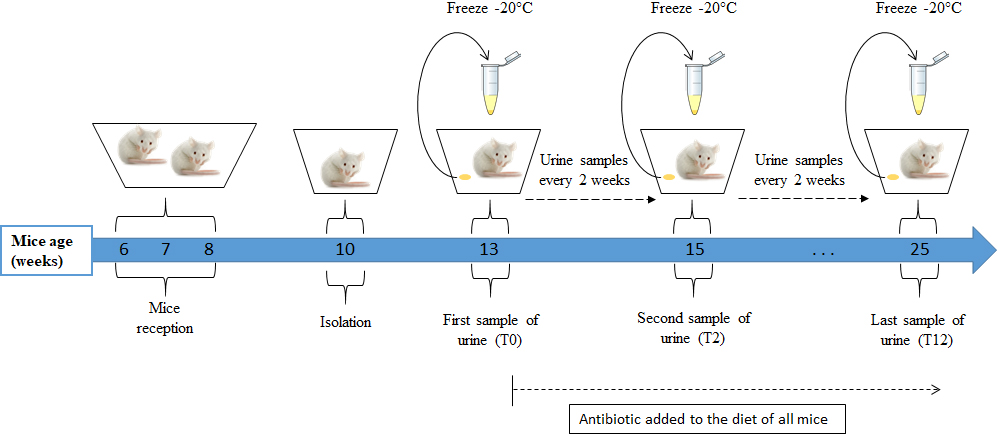
Figure 1.
Urine collection protocol. Mice were fed a diet containing doxycycline for 12 weeks starting from age 13 weeks; urine samples were collected every two weeks in Eppendorf tubes and kept at
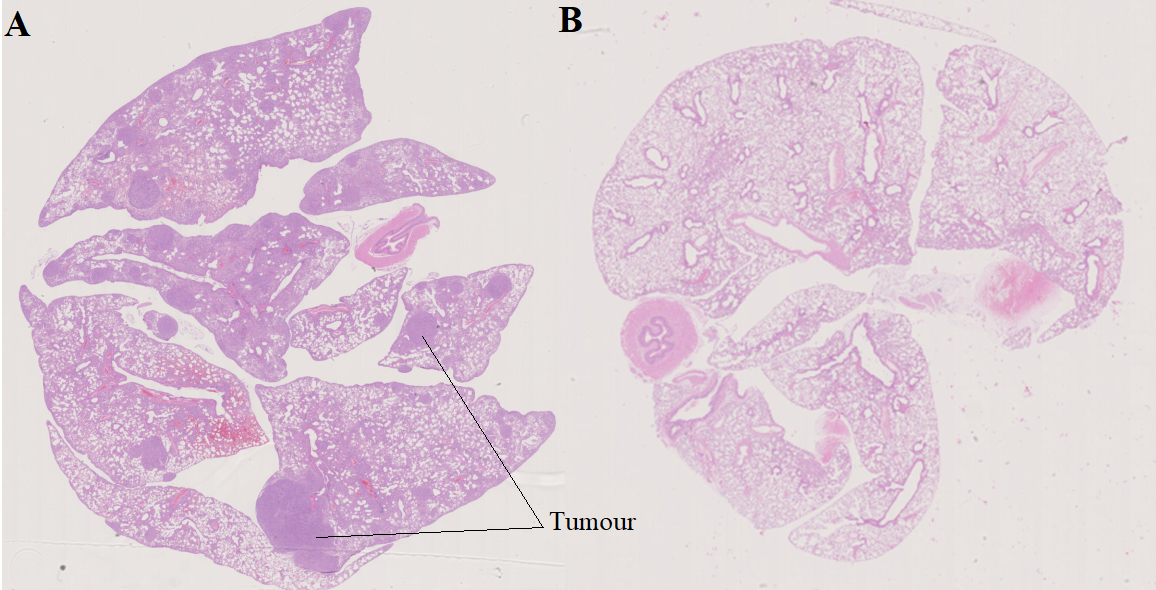
At the age of 25 weeks, all mice (NC and CC) were euthanized at the IRCM, where their lungs were examined. The presence or not of lung adenocarcinoma was confirmed by analysis of formalin-fixed paraffin-embedded lung sections that had been stained with hematoxylin-eosin (Fig. 2). After necropsy, two mice of the CC genotype showed no apparent lesions; although their VOCs were analysed, they were not included in our data set (Table S1). We therefore present below our analysis of the VOC profiles of urine samples obtained from 10 NC and eight CC mice.
Figure 2.
Formalin-fixed paraffin embedded lung sections with hematoxylin-eosin staining after 12 weeks of doxycycline treatment. A) cancerous mouse (CC); B) healthy mouse (NC).
2.3Urine sampling
Seven urine samples from each of the 18 male mice were obtained, one every two weeks. The first sample was collected before the addition of doxycycline (T0) and the last one 12 weeks later (T12) (Fig. 1). The urine-collection protocol was as follows: each mouse was placed individually in an empty cage previously washed with alcohol and left to dry. Mice were left to urinate in the cage for a maximum of one hour. The urine was collected with a micropipette, transferred to an Eppendorf tube, and kept frozen at
2.4Analysis and identification of VOCs in mouse urine
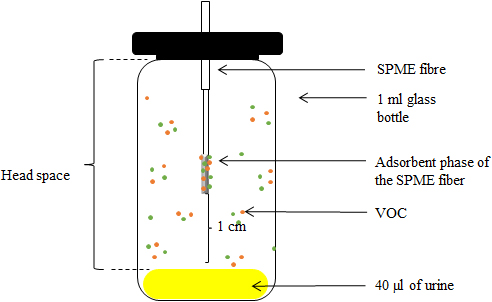
VOCs emanating from mouse urine were analysed using solid phase micro extraction (SPME, 65
Figure 3.
Schematic representation of the device used for sampling VOCs present in 40
As described elsewhere [22], VOCs were tentatively identified using peak retention time (RT) and mass spectra for each compound visible on the chromatogram. Retention indexes (RI) were calculated with reference to n-alkanes injected in the same GC-MS (Alkanes standard solution, 04070; Sigma-Aldrich, Darmstadt, Germany). Final identification of compounds was based on comparisons with mass spectrum databases (NIST 2007, Wiley Registry Ninth), with databases of compound RIs (e.g., Adams, 2007, Pubchem, https://pubchem.ncbi.nlm.nih.gov/), and standards when available. After tentative identification of all compounds and exclusion of those present in the technical controls, we calculated the surface of each compound’s peak area based on the total ion current chromatogram (TICC). The surface area of compounds that were only present as traces could not be calculated, so they were given an arbitrary value corresponding to 10% of the value obtained for the smallest peak present in our dataset. Because SPME extraction reflects the relative proportions of components in each sample, our calculations needed to consider this constraint for each compound and each individual to accurately compare VOC profiles of different individuals. For this, we divided a compound’s peak surface area by the sum of the peak areas of all compounds present in the individual profile. Hereafter, we refer to these values as relative quantities expressed in percentage.
Table 1
Results of F tests involving 10000 permutations following redundancy analyses testing factors that may impact variations in VOC composition (NC: non-cancerous mice; CC: cancerous mice)
| Conditional variable | Variance explained | Constrained variable | Variance explained | F |
| |
|---|---|---|---|---|---|---|
| Model 1: Impact of doxycycline | Fibre | 8.57% | Exp condition | 6.96% | 1.34 | 0.041 |
| treatment on VOC profiles of NC mice | Mouse identity | 43.13% | (T0, T2…T12) | |||
| Model 2: Impact of doxycycline | Fibre | 9% | Exp condition | 17.45% | 3.44 | |
| treatment on VOC profiles of CC mice | Mouse identity | 34.76% | (T0, T2…T12) | |||
| Model 3: Impact of doxycycline | Fibre | 5.07% | Status (NC /CC) | 55.36% | 14.38 | |
| treatment and health status on | Exp condition (T0, T2…T12) | 2.73 | ||||
| VOC profiles of all mice | Status | 5.83 | ||||
| Exp condition | 1.27 | 0.090 |
2.5Statistics
All statistical analyses were performed with RStudio software version 3.4.4 [23]. We used the following packages: ade4 [24], vegan [25], mixOmics [26], ggplot2 [27], RVAideMemoire [28], Hotelling [29], and nlme [30]. Normality and heteroscedasticity of residuals were checked visually after plotting the model residuals, and data were transformed when necessary (see below).
To compare variations in the relative proportions of VOCs emitted by NC and CC mice across experimental conditions (T0, T2, T4, T6, T8, T10, T12), a multivariate redundancy analysis (RDA) followed by permutation F tests were realised [31]. Relative proportions were CLR-transformed prior to RDAs. Because our data included zeroes, a small constant an order of magnitude smaller than the smallest non-zero value in our data was added to all values prior to transformations (e.g., 0.01 if the smallest non-zero value was 0.1). Data were then auto scaled to give equal weight to all compounds in the analyses. Factors included in the RDA depended on the hypothesis tested. We first questioned the impact of the doxycycline treatment, i.e., experimental condition (seven modalities, T0 to T12), on urine VOC composition. To address this question, we separately analysed CC and NC mice. These models included the experimental condition as an explanatory variable with conditional variables being fibres (two fibres used) and mouse identity. To assess VOC differences between NC and CC mice across experimental conditions, we designed a model including mouse identity nested within health status, health status (NC, CC), experimental condition, and the interaction between the last two factors as explanatory variables. Fibre identity was included as a conditional variable. VOCs showing an absolute correlation coefficient
3.Results
Thirty-six compounds were detected in our biological samples and absent from the technical controls (Table S2). Nineteen of these compounds were present in all samples while the other 27 were found in both CC and NC samples, although not in every sample (Table S3). Twenty-six of these compounds could be chemically identified, while the other 11 were unknown (Table S3). Among the molecules identified in this study, 10 had already been reported in human cancer studies and 11 in mouse cancer studies (details in Table S3).
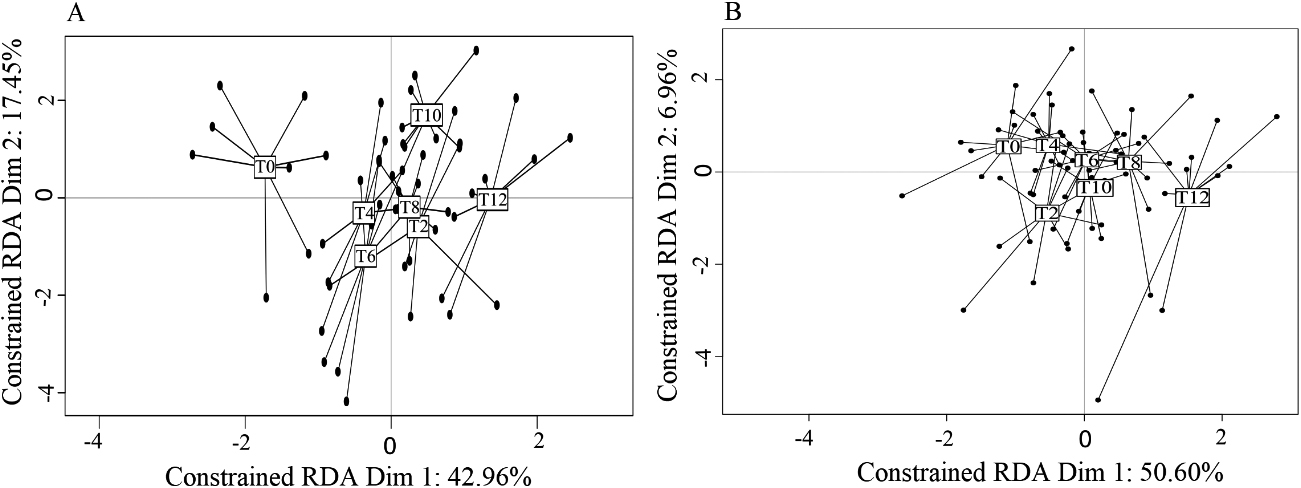
The RDA analyses indicated that VOC profiles of both CC and NC were influenced by the doxycycline treatment (Models 1 and 2, Table 1; all post-hoc tests comparing T0 with T2–T12,
Figure 5.
A) Graphical representation of the RDA results testing the influence of health status (cancerous: CC; non-cancerous: NC) and experimental condition (doxycycline treatment through time, T0-T12) on VOC profiles. The initial experimental condition (T0
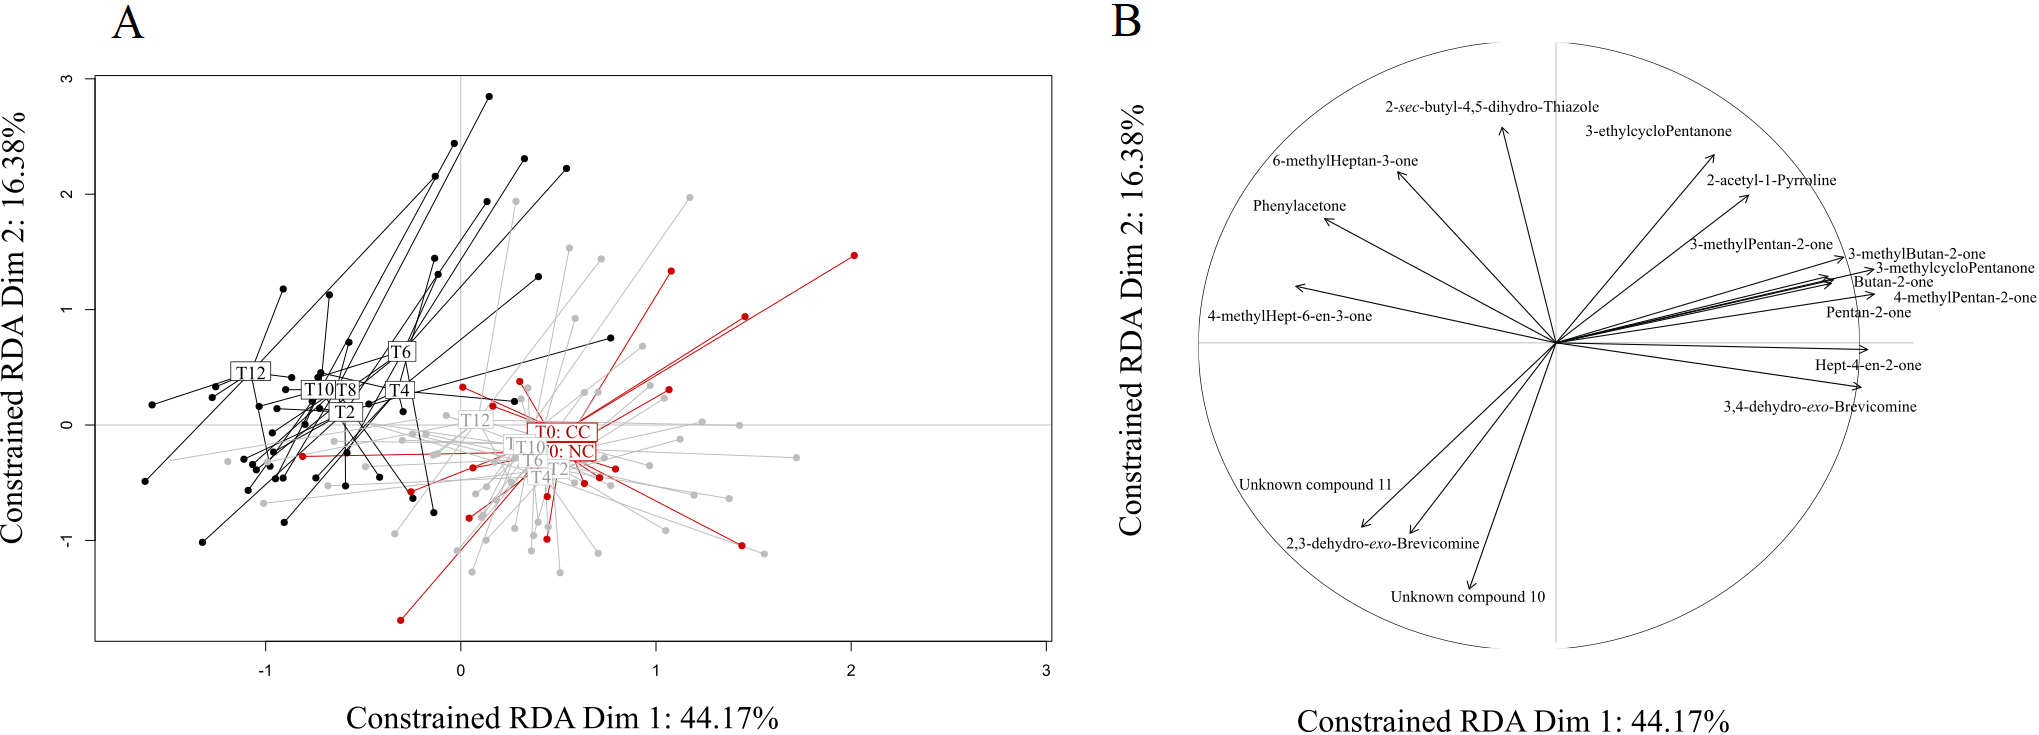
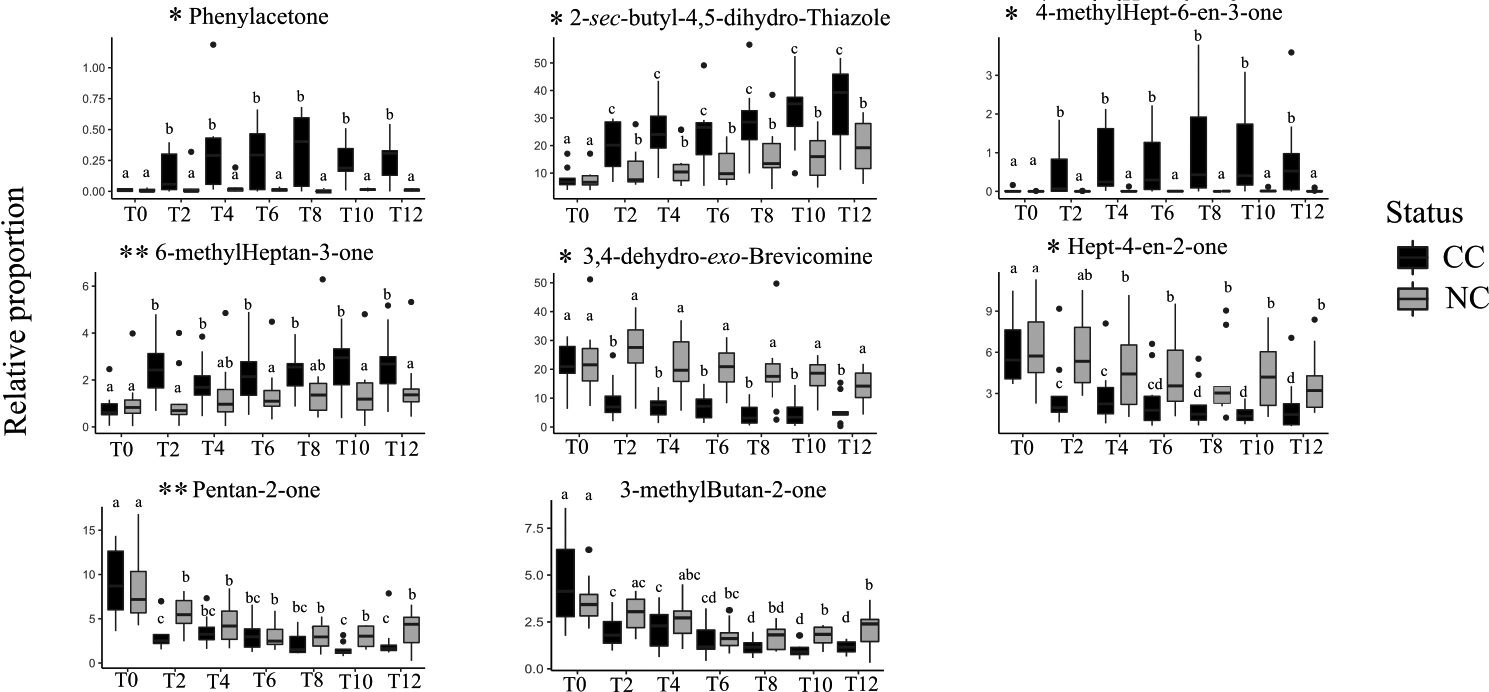
Given these results, we sought to identify specific compounds that could explain the above-described differences between CC and NC and hence would constitute potential biomarkers of cancer development. With this aim, we retained 17 VOCs showing an absolute correlation coefficient higher than 0.8 with the main RDA axes, and we further analysed their variations across health status and experimental conditions with univariate analyses (Table 2). Among these VOCs, six compounds showed no variation across treatments or between status (Table 2). Three other compounds, 3-methylcyclopentanone, 3-ethylcyclopentanone, and butan-2-one, varied by treatment but not between CC and NC, suggesting a direct effect of doxycycline but not a cancer effect. The relative proportions of two other VOCs, pentan-2-one and 3-methylbutan-2-one, were affected both by the doxycycline treatment per se and cancer development, displaying a highly heterogeneous pattern of variation (Fig. 2). While the variation of 3-methylbutan-2-one was impacted by both doxycycline and cancer development, its pattern of variation suggests that it could be a good candidate to diagnose later stages (T10, T12) of cancer development (Fig. 2). Remarkably, the last five VOCs showed significantly different relative proportions in CC and NC mice profiles starting at T2, a very early stage when only cancer lesions are observed, and through to T12 (Fig. 2). Three of these five compounds were present in small relative proportions (1–10%) in the mice profiles (phenylacetone, 4-methylhept-6-en-3-one, and hept-4-en-2-one), while two others, which are also male mouse pheromones, were present in large relative proportions (
Table 2
Summary results of univariate linear mixed models (lmm) applied to the relative proportions of 17 candidate biomarker VOCs retained from the redundancy analysis (see Fig. 5) with retention times (RT), retention indices (RI), and relative proportions (%, mean
Figure 6.
Variations in the relative proportions (%) of eight VOCs showing a significant difference between CC and NC (Table 2) at different times (T0 to T12). Cancerous mice (CC) are represented in black; non-cancerous mice (NC) are in grey. The box plots include minimum, lower quartile, median, upper quartile, and maximum values. Different letters on the boxplots indicate statistically significant differences (
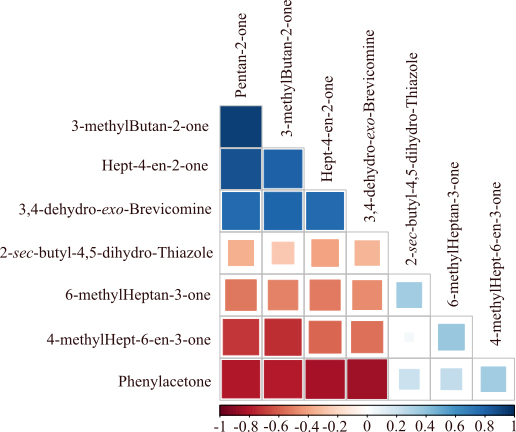
3,4-dehydro-exo-brevicomine variation showed a positive relation, although not necessarily similar responses to experimental conditions (Fig. 7). Other compounds were negatively correlated (i.e. phenylacetone and the 4 other compounds; or 4-methylhept-6-en-3-one, pentan-2-one and 3-methylbutan-2-one).
Figure 7.
Correlation between eight VOC showing a significant difference between CC and NC.
The metabolic pathways of the molecules identified in this study have never been explored. Pentan-2-one is the only compound present in the KEGG database, but not as part of Mus musculus metabolic pathway. The involvement of amino acids such as isoleucine or cysteine in the biosynthesis of the 2-sec-butyl-4,5-dihydro-thiazole was proposed by Pickett et al. (2014) [35].
4.Discussion
The use of urinary volatile biomarkers to diagnose a disease such as lung cancer is very promising: it is both minimally invasive and a rapid way to obtain a diagnosis. In this study, a lung cancer model was used to investigate the impact of tumour development on mouse urine VOC profiles and to identify potential candidate molecules that could help diagnose a cancer tumour at an early developmental stage, i.e., when cancer is not detected by small imaging techniques such as computed tomography. Lung cancer can have several clinical forms; we chose a mouse model that develops non-small cell lung adenocarcinoma (NSCLC), which is a good way to simulate a human lung cancer [19]. The two groups of mice, NC and CC, only differed by the presence of two transgenes, and this slight difference in their genotype did not seem to influence their urinary VOC profiles at T0, although it influenced other odour sources [36]. Our experimental design allowed us to distinguish between two distinct effects of doxycycline on mouse VOC profiles: its influence on microbiota, impacting odour production in both CC and NC mice, versus its induction of tumour development, which impacted the metabolism and odour production only of CC mice. Interestingly, the VOC profiles of the two CC mice that did not develop a lung tumour following doxycycline treatment were not different from the profiles of NC mice, strongly reinforcing our findings that cancer impacts VOC variations from an early stage of development (Table S1). We identified at least five compounds that could help diagnose lung cancer at all developmental stages, including when only small lesions are observed (stage T2).
The doxycycline treatment was continuous and lasted for 12 weeks. Doxycycline-driven alterations (independent of cancer development) were observed for three compounds, butan-2-one, 3-methylcyclopentane, and 3-ethylcyclopentanone. Butan-2-one was found both in mouse faeces [37] and urine [38, 39] and was shown to be a potential biomarker of epilepsy, with higher relative proportions in epileptic compared to control mice [38]. Consistent with our findings, this compound was often found in human cancer literature as a biomarker for cancer (Table S2). It was sometimes found in higher proportions [40, 41, 42, 43, 44, 45, 46, 47] and other times in lower proportions [48, 49, 50, 51] in patients with cancer. Butan-2-one is known to be produced by bacteria such as Pseudomonas, Staphylococcus, Escherichia coli, or Saccharomyces cerevisiae [52, 53, 54, 55, 56]. The lower relative proportion of this compound in mouse urine during antibiotic treatment suggests a negative impact of doxycycline on mouse microbiota. On the contrary, we observed that the relative proportions of 3-methylcyclopentanone and 3-ethylcyclopentanone significantly increased during doxycycline treatment. While these compounds were not reported in other mouse studies, they were found in all mice at all experimental conditions in the present study, albeit in low proportions (1–2%). Interestingly, these two compounds have been shown to be involved in territorial marking and to be emitted in high proportions in carnivores such as wolves, lions, the Siberian tiger, and badgers [57, 58, 59, 60]. Whether higher excretion of these compounds during the doxycycline treatment in our study relates to changes in mouse microbiota – favouring some convergence with carnivore microbiota – is a speculation that could be tested.
Tumour development impacted the VOC profile of cancerous mice at all stages of lung cancer development (from T2 to T12). Earlier studies indicated that two to three weeks of doxycycline treatment of CC mice resulted in alveoli lesions only visible with a histological approach, and the first lesions that could be revealed with small imaging techniques were visible only following five to six weeks of doxycycline treatment [19]. Urinary VOC analyses hence offer a relatively simple non-invasive method to diagnose early stage mouse lung cancer that imaging techniques could not detect. Here we identified five compounds indicative of cancer development from an early to a more evolved stage. Phenylacetone was a minor peak in the mouse VOC profile (less than 1%) whose relative proportion increased significantly in cancerous mice starting from T2. This amphetamine metabolite is often reported to be present in mice urine [39, 61, 62]; it was shown that its excretion tended to decrease with aging [63] although an increase in phenylacetone was also reported in mice showing Alzheimer’s disease [64]. Higher levels of phenylacetone in the urine of cancerous mice might be an indication of metabolic modifications during cancer development, which has often been reported in cancer research [65].
The relative proportions of hept-4-en-2-one, another candidate biomarker of early-stage tumour development, showed a significant decrease in CC profiles, with a significant drop from T0 to T2 and a second drop from T8 to T12. This compound was identified in the urine of healthy mice [38, 66], while epilepsy did not induce changes in its concentration [38]. Two other compounds, thiazoline and brevicomine – both testosterone-dependent mouse pheromones [67] – showed marked changes in association with tumour development starting at T2. These two pheromones were shown to be involved in advertising dominance [68] and their variation in cancerous mice might indicate that cancer development affected mouse metabolic paths involving testosterone, although to date the metabolic pathway of these two molecules remains unknown. This suggests that targeting testosterone-related compounds in humans might be of interest when tentatively diagnosing cancer with scent at an early stage of tumour development.
Two other compounds, 4-methylhept-6-en-3-one and 6-methylheptan-3-one, were found in higher proportions in CC compared NC mice two weeks after doxycycline treatment began, although the differences between CC and NC for 6-methylheptan-3-one proportions were not significant at T4 and T8. Both compounds have been described in other studies involving mice [69, 70] and were identified as markers of different diseases. For example, 6-methyl-heptan-3-one was found in higher relative proportions in the presence of mouse melanoma [17, 71] and mouse lung cancer [72] at advanced stages of cancer development. 4-methyl-6-hepten-3-one was found to increase in the profiles of mice with melanoma and to decrease in those with lung cancer [72]. Other studies found an increase in 4-methyl-6-hepten-3-one linked to Alzheimer’s disease [70]. 6-methyl-heptan-3-one was also reported to decrease in association with anxiety and depression in mice [63, 69, 73]. Finally, these two molecules are likely not specific of lung cancer but may constitute indicators of non-specific changes affecting an organism at the beginning of cancer tumour development.
Two molecules, pentan-2-one and 3-methylbutan-2-one, were affected at a late-stage of tumour development: their relative proportions decreased 10 weeks after the start of the doxycycline treatment in CC mice. These compounds have been reported in other mouse cancers, i.e., melanoma [71] and breast cancer [74]. However, earlier studies reported an increase in pentan-2-one, while a human lung cancer study [40] reported a decrease in the relative proportion of this molecule, a pattern consistent with our results. Furthermore, Liu and collaborators [75] reported the same pattern of reduction in the relative proportion of this compound in human colorectal cancer cell culture. Pentan-2-one and 3-methylbutan-2-one are ketones resulting from fat metabolism, and the reduction in their relative proportions in mouse urine may indicate a reduction in fatty acids oxidation rate. In addition, lower levels of pentan-2-one in CC mouse urine might be attributed to the downregulations of protein metabolism and of the ketogenic pathway caused by cancer [76]. Finally, 3-methylbutan-2-one, an indicator of late-stage of development of mouse lung tumour, revealed in our study, was reported to be linked to cancer in a publication analysing human saliva VOC profiles of patients affected by head and neck cancer [77].
The analysis of the correlation matrix suggests that the candidate molecules pointed out in this study may not be considered as inter-related, as some of them are negatively, positively, or even not correlated. Moreover, some molecules that show a positive correlation of their relative ratios did not respond in the same way to cancer induction. These candidate biomarkers might be considered as signals of metabolic changes induced by cancer development. Unfortunately, we were not able to identify any of the metabolic pathways in which these molecules may be involved. Future research will have to explore the metabolic pathways that may produce such molecules.
5.Conclusion
Cancer induced by doxycycline impacts the mouse urine VOC profiles. Remarkably, we identified, for the first time, five VOCs associated with an early stage of cancer development (two weeks). These VOCs could result from cancer inducing metabolic changes and/or the tumour per se producing some of the VOCs. Interestingly, some of the biomarker candidates identified in this study were also described in cancer development in human patients. This observation encourages us to propose more translational studies on humans. Moreover, our findings may encourage research focusing on VOCs, a non-invasive and inexpensive diagnostic tool, that could be promising. Different types of cancers have different VOC signatures, although most of the literature cited in our discussion suggests that some convergence and similarities in the influence of different types of cancer on VOCs may exist. Finally, the specific pathways impacted by cancer and inducing VOC changes may be worth a thorough investigation to better understand the general impact of cancer on the whole body; a research path that could help to develop new treatments or increase the efficiency of existing ones.
Funding
FG was supported by a doctoral fellowship from the University of Montpellier. FT was supported by the MAVA Foundation, the Hoffmann family and by the ANR TRANSCAN (ANR-18-CE35-0009). Analyses were realized with the support of LabEx CeMEB and an ANR Investissements d’avenir program (ANR-10-LABX-04- 01).
Authors’ contributions
Conception: F.G, G.G, F.T., and L.D.
Interpretation or analysis of data: F.G., G.G., B.B., and M.H.
Manuscript preparation: F.G. and G.G.
Revision for important intellectual content: F.G., G.G., F.T., L.D., M.H., B.B., A.M., and M.M.
Supervision: G.G, F.T., and L.D.
Funding acquisition: F.T.
All authors read and agreed on the final version of the manuscript.
Supplementary data
The supplementary files are available to download from http://dx.doi.org/10.3233/CBM-230070.
Acknowledgments
We thank Pascal Boutinaud, Nathalie Barougier, Pierre Caminade, and Camille Rosa for their support for animal husbandry and lab work.
References
[1] | B. Chhikara, K.P.-C.B. Letters and undefined 2023, Global Cancer Statistics 2022: the trends projection analysis, Biol Lett 10: ((2023) ), 451. |
[2] | H. Dillekås, M.S. Rogers and O. Straume, Are 90% of deaths from cancer caused by metastases? Cancer Med 8: ((2019) ), 5574–5576. |
[3] | C.L. Chaffer and R.A. Weinberg, A perspective on cancer cell metastasis, Science (1979) 331: ((2011) ), 1559–1564. |
[4] | S. Saadatmand, R. Bretveld, S. Siesling and M.M.A. Tilanus-Linthorst, Influence of tumour stage at breast cancer detection on survival in modern times: Population based study in 173 797 patients, BMJ 351: ((2015) ). |
[5] | J.A. Ludwig and J.N. Weinstein, Biomarkers in cancer staging, prognosis and treatment selection, Nat Rev Cancer 5: ((2005) ), 845–856. |
[6] | A.R.M. Al-shamasneh and U.H.B. Obaidellah, Artificial intelligence techniques for cancer detection and classification: review study, Eur Sci J 13: ((2017) ), 342–370. |
[7] | B. Prabhakar, P. Shende and S. Augustine, Current trends and emerging diagnostic techniques for lung cancer, Biomedicine and Pharmacotherapy 106: ((2018) ), 1586–1599. |
[8] | F. Cui, Z. Zhou and H.S. Zhou, Measurement and analysis of cancer biomarkers based on electrochemical biosensors, J Electrochem Soc 167: ((2020) ), 037525. |
[9] | K. Aruleba, G. Obaido, B. Ogbuokiri, A.O. Fadaka, A. Klein, T.A. Adekiya and R.T. Aruleba, Applications of computational methods in biomedical breast cancer imaging diagnostics: a review, Journal of Imaging 6: ((2020) ), 105. |
[10] | Z. He, Z. Chen, M. Tan, S. Elingarami, Y. Liu, T. Li, Y. Deng, N. He, S. Li, J. Fu and W. Li, A review on methods for diagnosis of breast cancer cells and tissues, Cell Prolif 53: ((2020) ), e12822. |
[11] | A.O. Gramolini, S.M. Peterman and T. Kislinger, Mass spectrometry-based proteomics: a useful tool for biomarker discovery? Clin Pharmacol Ther 83: ((2008) ), 758–760. |
[12] | M. Murdocca, F. Torino, S. Pucci, M. Costantini, R. Capuano, C. Greggi, C. Polidoro, G. Somma, V. Pasqualetti, Y.K. Mougang, A. Catini, G. Simone, R. Paolesse, A. Orlandi, A. Mauriello, M. Roselli, A. Magrini, G. Novelli, C. Di Natale and F.C. Sangiuolo, Urine LOX-1 and volatilome as promising tools towards the early detection of renal cancer, Cancers 13: ((2021) ), 4213. |
[13] | H. Sung, J. Ferlay, R.L. Siegel, M. Laversanne, I. Soerjomataram, A. Jemal and F. Bray, Global cancer statistics 2020: GLOBOCAN estimates of incidence and mortality worldwide for 36 cancers in 185 Countries, CA Cancer J Clin 71: ((2021) ), 209–249. |
[14] | F. Gouzerh, J.-M. Bessière, B. Ujvari, F. Thomas, A.M. Dujon and L. Dormont, Odors and cancer: Current status and future directions, Biochimica et Biophysica Acta (BBA) – Reviews on Cancer 1877: ((2022) ), 188644. |
[15] | J.E. Szulejko, T. Solouki, M. McCulloch, J. Jackson, D.L. McKee and J.C. Walker, Evidence for cancer biomarkers in exhaled breath, IEEE Sens J 10: ((2010) ), 185–210. |
[16] | C. Baldini, L. Billeci, F. Sansone, R. Conte, C. Domenici and A. Tonacci, Electronic nose as a novel method for diagnosing cancer: A systematic review, Biosensors (Basel) 10: ((2020) ), 1–21. |
[17] | A. Sever, A. Abd, Y. Matana, J. Gopas and Y. Zeiri, Biomarkers for Detection and Monitoring of B16 Melanoma in Mouse Urine and Feces, J Biomark 2015: ((2015) ), 9. |
[18] | K. Matsumura, M. Opiekun, H. Oka, A. Vachani, S.M. Albelda, K. Yamazaki and G.K. Beauchamp, Urinary volatile compounds as biomarkers for lung cancer: A proof of principle study using odor signatures in mouse models of lung cancer, PLoS One 5: ((2010) ), e8819. |
[19] | D. Li, T. Shimamura, H. Ji, L. Chen, H.J. Haringsma, K. McNamara, M.C. Liang, S.A. Perera, S. Zaghlul, C.L. Borgman, S. Kubo, M. Takahashi, Y. Sun, L.R. Chirieac, R.F. Padera, N.I. Lindeman, P.A. Jänne, R.K. Thomas, M.L. Meyerson, M.J. Eck, J.A. Engelman, G.I. Shapiro and K.K. Wong, Bronchial and peripheral murine lung carcinomas induced by T790M-L858R mutant EGFR respond to HKI-272 and rapamycin combination therapy, Cancer Cell 12: ((2007) ), 81–93. |
[20] | C.V. Lanyon, S.P. Rushton, A.G. O’Donnell, M. Goodfellow, A.C. Ward, M. Petrie, S.P. Jensen, L. Morris Gosling and D.J. Penn, Murine scent mark microbial communities are genetically determined, FEMS Microbiol Ecol 59: ((2007) ), 576–583. |
[21] | E.B. Mur, S. Bernardo, L. Papon, M. Mancini, E. Fabbrizio, M. Goussard, I. Ferrer, A. Giry, X. Quantin, J.L. Pujol, O. Calvayrac, H.P. Moll, Y. Glasson, N. Pirot, A. Turtoi, M. Cañamero, K.K. Wong, Y. Yarden, E. Casanova, J.C. Soria, J. Colinge, C.W. Siebel, J. Mazieres, G. Favre, L. Paz-Ares and A. Maraver, Notch inhibition overcomes resistance to tyrosine kinase inhibitors in EGFR-driven lung adenocarcinoma, J Clin Invest 130: ((2020) ), 612–624. |
[22] | F. Gouzerh, B. Buatois, M.R. Hervé, M. Mancini, A. Maraver, L. Dormont, F. Thomas and G. Ganem, Odours of cancerous mouse congeners: detection and attractiveness, Biol Open 11: ((2022) ), bio059208. |
[23] | R Core Team, A language and environment for statistical R Foundation for Statistical Computing, Vienna, Austria., ((2020) ). https://www.r-project.org/. |
[24] | J. Thioulouse, A.B. Dufour, T. Jombart, S. Dray, A. Siberchicot and S. Pavoine, Multivariate analysis of ecological data with ade4, Multivariate Analysis of Ecological Data with Ade4 ((2018) ), 1–294. |
[25] | J. Oksanen, F.G. Blanchet, M. Friendly, R. Kindt, P. Legendre, D. Mcglinn, P.R. Minchin, R.B. O’hara, G.L. Simpson, P. Solymos, M. Henry, H. Stevens, E. Szoecs and H.W. Maintainer, Package “vegan” title community ecology package version 25-7. ((2020) ). |
[26] | F. Rohart, B. Gautier, A. Singh and K.A. Lê Cao, mixOmics: An R package for ‘omics feature selection and multiple data integration, PLoS Comput Biol 13: ((2017) ), e1005752. |
[27] | M.H. Wickham, Package “ggplot2” type package title an implementation of the grammar of graphics, ((2014) ). |
[28] | M. Hervé, Package “RVAideMemoire” encoding latin type package title testing and plotting procedures for biostatistics, ((2022) ). |
[29] | J. Curran, Package “Hotelling” title hotelling’s test and variants, ((2021) ). |
[30] | J. Pinheiro, D. Bates, S. DebRoy, D. Sarkar, S. Heisterkamp, B. Van Willigen and R. Maintainer, Package “nlme” title linear and nonlinear mixed effects models, ((2021) ). |
[31] | M.R. Hervé, F. Nicolè and K.-A. Lê Cao, Multivariate analysis of multiple datasets: a practical guide for chemical ecology, Journal of Chemical Ecology 44: ((2018) ), 215–234. |
[32] | W.R. Rice, Analyzing tables of statistical tests, Evolution 43: ((1989) ), 223. |
[33] | M. Kanehisa and S. Goto, KEGG: Kyoto Encyclopedia of Genes and Genomes, Nucleic Acids Res 28: ((2000) ), 27–30. |
[34] | S. Zheng, T. Zeng, C. Li, B. Chen, C.W. Coley, Y. Yang and R. Wu, BioNavi-NP: Biosynthesis Navigator for Natural Products, ((2021) ). |
[35] | J.A. Pickett, S. Barasa and M.A. Birkett, Vertebrate pheromones and other semiochemicals: the potential for accommodating complexity in signalling by volatile compounds for vertebrate management, Biochem Soc Trans 42: ((2014) ), 846–850. |
[36] | F. Gouzerh, Conséquences écologiques, évolutives et appliquées des modifications d’odeurs corporelles associées au cancer, ((2022) ). |
[37] | B.S. Goodrich, S. Gambale, P.R. Penncuik and T.D. Redhead, Volatile compounds from excreta of laboratory mice (Mus musculus), Journal of Chemical Ecology 16: ((1990) ), 2107–2120. |
[38] | A. Fujita, M. Ota and K. Kato, Urinary volatile metabolites of amygdala-kindled mice reveal novel biomarkers associated with temporal lobe epilepsy, Scientific Reports 9: ((2019) ), 1–13. |
[39] | F. Röck, S. Mueller, U. Weimar, H.G. Rammensee and P. Overath, Comparative analysis of volatile constituents from mice and their urine, J Chem Ecol 32: ((2006) ), 1333–1346. |
[40] | K. Schallschmidt, R. Becker, C. Jung, W. Bremser, T. Walles, J. Neudecker, G. Leschber, S. Frese and I. Nehls, Comparison of volatile organic compounds from lung cancer patients and healthy controls – Challenges and limitations of an observational study, J Breath Res 10: ((2016) ), 46007. |
[41] | A. Bajtarevic, C. Ager, M. Pienz, M. Klieber, K. Schwarz, M. Ligor, T. Ligor, W. Filipiak, H. Denz, M. Fiegl, W. Hilbe, W. Weiss, P. Lukas, H. Jamnig, M. Hackl, A. Haidenberger, W. Miekisch, J. Schubert and A. Amann, Noninvasive detection of lung cancer by analysis of exhaled breath, BMC Cancer 16: ((2009) ), 1–16. |
[42] | X.-A. Fu, M. Li, R.J. Knipp, M.H. Nantz and M. Bousamra, Noninvasive detection of lung cancer using exhaled breath, Cancer Med 3: ((2014) ), 174–181. |
[43] | E. Gashimova, A. Temerdashev, V. Porkhanov, I. Polyakov, D. Perunov, A. Azaryan and E. Dmitrieva, Investigation of different approaches for exhaled breath and tumor tissue analyses to identify lung cancer biomarkers, Heliyon 6: ((2020) ), e04224. |
[44] | C. Wang, R. Dong, X. Wang, A. Lian, C. Chi, C. Ke, L. Guo, S. Liu, W. Zhao, G. Xu and E. Li, Exhaled volatile organic compounds as lung cancer biomarkers during one-lung ventilation, Sci Rep 4: ((2014) ), 1–8. |
[45] | B. Buszewski, A. Ulanowska, T. Kowalkowski and K. Cieliski, Investigation of lung cancer biomarkers by hyphenated separation techniques and chemometrics, Clin Chem Lab Med 50: ((2012) ), 573–581. |
[46] | K. Schallschmidt, R. Becker, H. Zwaka, R. Menzel, D. Johnen, C. Fischer-Tenhagen, J. Rolff and I. Nehls, In vitro cultured lung cancer cells are not suitable for animal-based breath biomarker detection, J Breath Res 9: ((2015) ), 027103. |
[47] | P. Porto-Figueira, J. Pereira, W. Miekisch and J.S. Câmara, Exploring the potential of NTME/GC-MS, in the establishment of urinary volatomic profiles. Lung cancer patients as case study, Scientific Reports 8: ((2018) ), 1–11. |
[48] | H. Amal, M. Leja, K. Funka, R. Skapars, A. Sivins, G. Ancans, I. Liepniece-Karele, I. Kikuste, I. Lasina and H. Haick, Detection of precancerous gastric lesions and gastric cancer through exhaled breath, Gut 65: ((2016) ), 400–407. |
[49] | A. Forleo, S. Capone, V. Longo, F. Casino, A.V. Radogna, P. Siciliano, M. Massaro, E. Scoditti, N. Calabriso and M.A. Carluccio, Evaluation of the volatile organic compounds released from peripheral blood mononuclear cells and THP1 cells under normal and proinflammatory conditions, Lecture Notes in Electrical Engineering 457: ((2018) ), 269–277. |
[50] | G. Peng, U. Tisch, O. Adams, M. Hakim, N. Shehada, Y.Y. Broza, S. Billan, R. Abdah-Bortnyak, A. Kuten and H. Haick, Diagnosing lung cancer in exhaled breath using gold nanoparticles, Nat Nanotechnol 4: ((2009) ), 669–673. |
[51] | W. Filipiak, A. Sponring, T. Mikoviny, C. Ager, J. Schubert, W. Miekisch, A. Amann and J. Troppmair, Release of volatile organic compounds (VOCs) from the lung cancer cell line CALU-1 in vitro, Cancer Cell Int 8: ((2008) ), 1–11. |
[52] | M.S. Yamaguchi, H.H. Ganz Id, A.W. Cho, T.H. Zaw, G. Jospin, M.M. Mccartney, C.E. Davis, J.A. Eisen Id and D.A. Coil, Bacteria isolated from Bengal cat (Felis catus |
[53] | H. Yoneda, D.J. Tantillo and S. Atsumi, Biological production of 2-Butanone in Escherichia coli, ChemSusChem 7: ((2014) ), 92–95. |
[54] | Z. Chen, H. Sun, J. Huang, Y. Wu and D. Liu, Metabolic engineering of Klebsiella pneumoniae for the production of 2-Butanone from glucose, PLoS One 10: ((2015) ), e0140508. |
[55] | L.D.J. Bos, P.J. Sterk and M.J. Schultz, Volatile metabolites of pathogens: a systematic review, PLoS Pathog 9: ((2013) ), e1003311. |
[56] | F. Harrison, K. Surendra Kaushik, K. Rumbaugh, K. Whiteson, J. Phan, S. Ranjbar, M. Kagawa, M. Gargus, A. Israel Hochbaum and K.L. Whiteson, Thriving under stress: Pseudomonas aeruginosa outcompetes the background polymicrobial community under treatment conditions in a novel chronic wound model, Front Cell Infect Microbiol 10: ((2020) ), 569685. |
[57] | K.M. Service, R.G. Brereton and S. Harris, Analysis of badger urine volatiles using gas chromatography-mass spectrometry and pattern recognition techniques, Analyst 126: ((2001) ), 615–623. |
[58] | S.B. Soso and J.A. Koziel, Characterizing the scent and chemical composition of Panthera leo marking fluid using solid-phase microextraction and multidimensional gas chromatography – mass spectrometry-olfactometry, Sci Rep 7: ((2017) ), 1–15. |
[59] | J. Raymer, D. Wiesler, M. Novotny, C. Asa, U.S. Seal and L.D. Mech, Chemical scent constituents in urine of wolf (canis lupus) and their dependence on reproductive hormones, J Chem Ecol 12: ((1986) ). |
[60] | S.B. Soso and J.A. Koziel, Analysis of odorants in marking fluid of siberian tiger (Panthera tigris altaica) using simultaneous sensory and chemical analysis with headspace solid-phase microextraction and multidimensional gas chromatography-mass spectrometry-olfactometry, Molecules 21: ((2016) ), 834. |
[61] | K. Miyashita and A.B. Robinson, Identification of compounds in mouse urine vapor by gas chromatography and mass spectrometry, Mech Ageing Dev 13: ((1980) ), 177–184. |
[62] | F.J. Schwende, D. Wiesler, J.W. Jorgenson, M. Carmack and M. Novotny, Urinary volatile constituents of the house mouse,Mus musculus, and their endocrine dependency, Journal of Chemical Ecology 12: ((1986) ), 277–296. |
[63] | M.L. Schaefer, K. Wongravee, M.E. Holmboe, N.M. Heinrich, S.J. Dixon, J.E. Zeskind, H.M. Kulaga, R.G. Brereton, R.R. Reed and J.M. Trevejo, Mouse urinary biomarkers provide signatures of maturation, diet, stress level, and diurnal rhythm, Chem Senses 35: ((2010) ), 459–471. |
[64] | B.A. Kimball, D.A. Wilson and D.W. Wesson, Alterations of the volatile metabolome in mouse models of Alzheimer’s disease, Nature Publishing Group 6: ((2015) ), 19495. |
[65] | R.A. Cairns, I. Harris, S. Mccracken and T.W. Mak, Cancer cell metabolism, Cold Spring Harb Symp Quant Biol 76: ((2011) ), 299–311. |
[66] | B. Jemiolo, T.M. Xie, F. Andreolini, A.E.M. Baker and M. Novotny, The t complex of the mouse: chemical characterization by urinary volatile profiles, Journal of Chemical Ecology 17: ((1991) ), 353–367. |
[67] | M. Novotny, F.J. Schwende, D. Wiesler, J.W. Jorgenson and M. Carmack, Identification of a testosterone-dependent unique volatile constituent of male mouse urine: 7-exo-ethyl-5-methyl-68-dioxabicyclo[3.2.1]-3-octene, Experientia 40: ((1984) ), 217–219. |
[68] | M. Novotny, S. Harvey, B. Jemiolo and J. Alberts, Synthetic pheromones that promote inter-male aggression in mice, Proc Natl Acad Sci U S A 82: ((1985) ), 2059–2061. |
[69] | A. Fujita, T. Okuno, M. Oda and K. Katoid, Urinary volatilome analysis in a mouse model of anxiety and depression, PLoS One 15: ((2020) ), e0229269. |
[70] | H. Tian, H. Wen, X. Yang, S. Li and J. Li, Exploring the effects of anthocyanins on volatile organic metabolites of alzheimer’s disease model mice based on HS-GC-IMS and HS-SPME-GC–MS, Microchemical Journal 162: ((2021) ), 105848. |
[71] | A. Kokocinska-Kusiak, J. Matalińska, M. Sacharczuk, M. Sobczyńska, K. Góral-Radziszewska, B. Wileńska, A. Misicka and T. Jezierski, Can mice be trained to discriminate urine odor of conspecifics with melanoma before clinical symptoms appear? Journal of Veterinary Behavior 39: ((2020) ), 64–76. |
[72] | Y. Hanai, K. Shimono, H. Oka, Y. Baba, K. Yamazaki and G.K. Beauchamp, Analysis of volatile organic compounds released from human lung cancer cells and from the urine of tumor-bearing mice, Cancer Cell Int 12: ((2012) ), 7. |
[73] | J. Kwak, A. Willse, K. Matsumura, M.C. Opiekun, W. Yi, G. Preti, K. Yamazaki and G.K. Beauchamp, Genetically-based olfactory signatures persist despite dietary variation, PLoS One 3: ((2008) ), e3591. |
[74] | M. Woollam, M. Teli, P. Angarita-Rivera, S. Liu, A.P. Siegel, H. Yokota and M. Agarwal, Detection of volatile organic compounds (VOCs) in urine via gas chromatography-mass spectrometry QTOF to differentiate between localized and metastatic models of breast cancer, Scientific Reports 9: ((2019) ), 1–12. |
[75] | D. Liu, L. Ji, M. Li, D. Li, L. Guo, M. Nie, D. Wang, Y. Lv, Y. Bai, M. Liu, G. Wang, Y. Li, P. Yu, E. Li and C. Wang, Analysis of volatile organic compounds released from SW480 colorectal cancer cells and the blood of tumor-bearing mice, Transl Cancer Res 8: ((2019) ), 2736. |
[76] | T. Ligor, P. Adamczyk, T. Kowalkowski, I.A. Ratiu, A. Wenda-Piesik and B. Buszewski, Analysis of VOCs in urine samples directed towards of bladder cancer detection, Molecules 27: ((2022) ), 5023. |
[77] | H. Shigeyama, T. Wang, M. Ichinose, T. Ansai and S.W. Lee, Identification of volatile metabolites in human saliva from patients with oral squamous cell carcinoma via zeolite-based thin-film microextraction coupled with GC–MS, Journal of Chromatography B 1104: ((2019) ), 49–58. |


