
Comprehensive analysis and establishment of a prognostic model based on non-genetic predictors in multiple myeloma1
Abstract
BACKGROUND:
Multiple myeloma (MM) is a systemic hematological malignancy usually incurable. The value of some important prognostic factors may gradually decrease.
OBJECTIVE:
We aimed to explore the non-genetic indexes, prognostic models, and significance of clinical staging systems of MM.
METHODS:
A retrospective analysis was conducted on clinical data from 110 patients with MM who first visit the First Affiliated Hospital of Guangzhou Medical University between September 2005 to December 2018.
RESULTS:
Bone marrow plasma cell percentage (BMPC%), cystatin C (CysC), and
CONCLUSIONS:
BMPC%, CysC, and
1.Introduction
Multiple myeloma (MM) is a systemic hematological malignancy that is usually incurable. The World Health Organization classifies MM as a lymphoproliferative B-cell disease [1]. There is an excess amount of myeloma (M) protein, a monoclonal immunoglobulin (Ig), in the serum of patients with MM. A small group of MM is classified as unsecreted MM when M protein cannot be detected in the serum. The incidence of MM is 1.6 cases per 100 000 persons per year, accounting for approximately 10% of all hematological malignancies, and is continuously increasing in China [2].
The clinical manifestations of MM are unclear and can be easily ignored. The symptoms reported by patients with MM on presentation are often non-specific and may already have been present for an extended period. Anemia of unknown origin is found in 73% of patients, bone pain in 58%, and fatigue in 32%. Approximately 25% of patients report unexplained weight loss, and renal function is often impaired [3]. In addition to clinical history and physical examination, the diagnosis of MM involves clinical chemistry, cytogenetic analysis of the bone marrow, and radiological investigation to detect bone changes [4].
The prognosis of MM is heterogeneous, and factors affecting prognosis include host factors, tumor burden, genetic abnormalities, and response to treatment [5]. In recent years, several new therapeutic agents have been developed and approved for the treatment of MM, including proteasome inhibitors (PIs), immunomodulatory drugs (IMiDs), monoclonal antibodies (mAbs), as well as histone deacetylase (HDAC) inhibitors [6, 7], and have improved the prognosis of MM patients in multiple ways. PIs, such as bortezomib, carfilzomib, and ixazomib, have shown efficacy in inducing apoptosis of MM cells and sensitizing them to chemotherapy [8]. IMiDs, such as lenalidomide and pomalidomide, have immunomodulatory effects, including enhancing the activity of T cells and natural killer cells against MM cells. The use of mAbs, such as daratumumab and elotuzumab, has led to improved immune-mediated tumor targeting and killing of MM cells [9]. Finally, HDAC inhibitors, such as panobinostat and vorinostat, have demonstrated the ability to induce apoptosis and inhibit the proliferation of tumor cells in MM [10]. The development and use of these new agents have significantly improved the prognosis of MM patients, leading to increased response rates, prolonged progression-free survival (PFS), and improved overall survival (OS).
Recently, researchers have found that patients with MM carrying the same genetic factors usually have different prognoses, suggesting a contribution of non-genetic factors [11]. The Durie-Salmon (D-S) stage and international staging system (ISS) are the most common clinical staging systems used for patients with MM. D-S staging classifies tumor burden into three stages based on serum/urine M protein, hemoglobin, X-ray examination, tumor cell count, and serum calcium of the patients. The ISS divides MM into three stages according to the levels of albumin and serum
2.Materials and methods
This was a single-center retrospective clinical study. A total of 110 patients diagnosed with MM at the First Affiliated Hospital of Guangzhou University of Chinese Medicine between September 2005 and December 2018 were enrolled in this study. The study was approved by the First Affiliated Hospital of Guangzhou University of Chinese Medicine and conformed to the Helsinki Declaration of 1964 (revised in 2013) concerning human and animal rights. Due to the investigation being carried out through retrospective review of medical records and no foreseeable impact on the rights and/or welfare of the participants involved, ethics approval was not required. Additionally, consent from study participants was not required because the study only involved a retrospective review of medical records. The First Affiliated Hospital of Guangzhou University of Chinese Medicine granted Ethical approval to carry out the study within its facilities (Ethical Application Ref: K-2022-033).
2.1Inclusion criteria
Patients included in the study met the international diagnosis of MM and were staged according to the D-S and ISS criteria [14]. In addition, the included patients were treated according to their normal clinical conditions and could cooperate with the improvement of various examinations. Meanwhile, inclusion criteria included good reading ability, ability to respond, and clear consciousness. Treatment options included chemotherapy with bortezomib and conventional chemotherapy without bortezomib.
2.2Exclusion criteria
The exclusion criteria included patients to whom medication was not administered; who underwent hematopoietic stem cell transplantation; who were pregnant or lactating women; with any serious concomitant systemic disorder or uncontrollable infection; with decompensated heart, lung, or renal failure; and to whom chemotherapy was intolerable.
2.3Observational index
All clinical variables were collected from electronic medical records held by the First Affiliated Hospital of Guangzhou University of Chinese Medicine, including age, sex, time of initial diagnosis, first symptom, underlying disease, clinical stage, treatment plan, clinical classification, bone marrow plasma cell percentage (BMPC%), white blood cell count (WBC), neutrophil count (NEU), lymphocyte count (LYM), monocyte count (MONO), red blood cell count (RBC), hemoglobin volume (HGB), red blood cell distribution width (RDW), platelet count (PLT), IgA, IgG, total serum calcium (Ca), urine hormone (urea), creatinine (Cre), alkaline phosphatase (ALP), alanine aminotransferase (ALT), lactate dehydrogenase (LDH), cystatin C (CysC),
2.4Experimental instruments and methods
Serum immunofixation electrophoresis (IFE) was performed using automatic capillary electrophoresis (Sebia). Serum
2.5Outcomes and measurements
The primary outcome was OS obtained at initial diagnosis to the date of death or the end of follow-up and from the date of known survival in patients who were lost to follow-up. The secondary outcome was PFS, which was the time from the first treatment to disease progression, recurrence, death, or termination of follow-up.
2.6Statistical analyses
SPSS (version 27.0 for Windows, IBM, USA) and GraphPad Software (San Diego, California, USA) were used for statistical analysis and mapping of data. Quantitative data were expressed as mean
3.Results
3.1Demographic and baseline clinical characteristics
Between September 2005 and December 2018, 110 eligible patients from the First Affiliated Hospital of Guangzhou University of Chinese Medicine were enrolled in the study. Underlying medical conditions were present in 69.1% of the patients. Hypertension, diabetes, coronary heart disease, and kidney stones are common in patients with MM. The most common first symptom reported was ostealgia (77.3%), followed by anemia (10.9%). Ostealgia mainly included pain in the lower back, rib, hip, and calf. Overall characteristics of the patients are presented in Table 1, alongside the statistics of the clinical test results.
Table 1
The baseline characteristics of the participants
| Characteristics | Number | Percentage (%) | x |
|---|---|---|---|
| Case, N | 110 | – | – |
| Sex | |||
| Male | 58 | 52.7 | – |
| Female | 52 | 47.3 | – |
| Underlying disease | |||
| Yes | 76 | 69.1 | – |
| No | 34 | 30.9 | – |
| Regimen | |||
| Bortezomib included | 45 | 40.9 | – |
| Bortezomib not included | 69 | 59.1 | – |
| Immunofixation electrophoresis | |||
| Light chain type | 19 | 17.3 | – |
| IgA type | 24 | 21.8 | – |
| IgG type | 62 | 56.4 | – |
| Other | 5 | 4.5 | – |
| The first symptom | |||
| Ostealgia | 85 | 77.3 | – |
| Anemia | 12 | 10.9 | – |
| Other | 13 | 11.8 | – |
| Age | 110 | – | (61, 13) |
| BMPC (%) | 110 | – | (27.5, 31.00) |
| WBC (*109/L) | 110 | – | (5.48, 2.66) |
| NEU (*109/L) | 110 | – | (2.94, 2.16) |
| LYM (*109/L) | 110 | – | (1.795, 0.95) |
| MONO (*109/L) | 110 | – | (0.45, 0.25) |
| RBC (*1012/L) | 110 | – | 3.164 |
| HGB (g/L) | 110 | – | 89.78 |
| RDW (%) | 110 | – | (15.45, 3.88) |
| PLT (*109/L) | 110 | – | 198.76 |
| NLR | 110 | – | (1.625, 1.30) |
| PLR | 110 | – | 111.95 |
| RPR | 110 | – | (0.10, 0.17) |
| IgG (g/L) | 95 | – | (14.95, 49.19) |
| IgA (g/L) | 93 | – | (0.357, 1.470) |
| Ca (mmol/L) | 110 | – | (2.28, 0.3) |
| Cre (umol/L) | 110 | – | (92, 103) |
| UREA (mmol/L) | 110 | – | (6.06, 4.49) |
| ALP (U/L) | 103 | – | (78, 40) |
| ALT (U/L) | 110 | – | (14, 11) |
| LDH (U/L) | 84 | – | (152.5, 64) |
| CysC (mg/L) | 96 | – | (1.205, 1.06) |
| | 110 | – | (4.175, 5.24) |
3.2Intergroup comparison of D-S and ISS stage
According to the grouping of the D-S and ISS stages, a comparative analysis between the observational index and grouping was carried out. In the three groups of the D-S stage, the results from the analysis showed that RBC, HGB, RDW, IgA, Cre, urea, ALP, CysC, and
Table 2
Correlation analysis of observational indexes with D-S and ISS stage
| Characteristics | Normality test ( | D-S stage ( | ISS stage ( | D-S stage correlation | ISS stage correlation |
|---|---|---|---|---|---|
| BMPC (%) | 0.000 | 0.059 | 0.016 | 0.299 | 0.305 |
| WBC (*10 | 0.000 | 0.544 | 0.671 | 0.008 | |
| NEU (*10 | 0.000 | 0.741 | 0.444 | 0.045 | |
| LYM (*10 | 0.000 | 0.162 | 0.837 | ||
| MONO (*10 | 0.000 | 0.803 | 0.057 | 0.010 | 0.346 |
| RBC (*10 | 0.200 | 0.000 | 0.006 | ||
| HGB (g/L) | 0.200 | 0.000 | 0.002 | ||
| RDW (%) | 0.037 | 0.004 | 0.768 | 0.264 | |
| PLT (*10 | 0.190 | 0.403 | 0.926 | ||
| NLR | 0.000 | 0.692 | 0.722 | 0.143 | |
| PLR | 0.078 | 0.719 | 0.624 | ||
| RPR | 0.000 | 0.082 | 0.247 | 0.311 | |
| IgG (g/L) | 0.000 | 0.716 | 0.005 | 0.061 | |
| IgA (g/L) | 0.000 | 0.001 | 0.194 | ||
| Ca (mmol/L) | 0.000 | 0.217 | 0.712 | 0.068 | |
| Cre (umol/L) | 0.000 | 0.013 | 0.000 | 0.253 | 0.550 |
| UREA (mmol/L) | 0.000 | 0.038 | 0.000 | 0.237 | 0.553 |
| ALP (U/L) | 0.000 | 0.016 | 0.293 | 0.164 | |
| ALT (U/L) | 0.000 | 0.087 | 0.009 | ||
| LDH (U/L) | 0.001 | 0.860 | 0.681 | ||
| CysC (mg/L) | 0.000 | 0.011 | 0.000 | 0.316 | 0.610 |
| 0.000 | 0.001 | 0.000 | 0.392 | 0.610 |
Note:
Table 3
Results of multiple comparisons between D-S stages and test indicators
| Stage |
| RBC ( | HGB ( | RDW ( | IgA ( | Cre ( | Urea ( | ALP ( | CysC ( | |||||||||||
|---|---|---|---|---|---|---|---|---|---|---|---|---|---|---|---|---|---|---|---|---|
| I | 19 | 3. | 8258 | 115. | 58 | 14. | 6579 | 10. | 40493 | 105. | 05 | 6. | 4726 | 114. | 05 | 1. | 3113 | 3. | 2435 | |
| II | 21 | 3. | 0195 | 89. | 14 | 15. | 0286 | 14. | 04874 | 100. | 71 | 7. | 4981 | 72. | 37 | 1. | 5605 | 4. | 3611 | |
| III | 70 | 2. | 8186 | 79. | 71 | 16. | 5814 | 7. | 94671 | 170. | 9 | 8. | 7253 | 71. | 23 | 1. | 8672 | 6. | 6273 | |
|
| 13. | 780 | 27. | 010 | 11. | 21 | 13. | 495 | 8. | 702 | 6. | 538 | 8. | 228 | 9. | 063 | 13. | 204 | ||
| III/I |
| 0. | 000 | 0. | 000 | 0. | 010 | 0. | 012 | 0. | 035 | 0. | 032 | 0. | 012 | 0. | 011 | 0. | 003 | |
| II/I |
| 0. | 001 | 0. | 000 | 0. | 121 | 0. | 185 | 0. | 210 | 0. | 138 | 0. | 224 | 0. | 389 | 0. | 265 | |
| III/II |
| 0. | 126 | 0. | 224 | 0. | 348 | 0. | 013 | 0. | 004 | 0. | 852 | 0. | 223 | 0. | 456 | 0. | 365 | |
Note:
Table 4
Results of multiple comparisons between ISS stages and test indicators
| Stage |
| RBC ( | HGB ( | Cre ( | Urea ( | ALT ( | CysC ( | BMPC ( | IgG ( | |||||||||||
|---|---|---|---|---|---|---|---|---|---|---|---|---|---|---|---|---|---|---|---|---|
| I | 21 | 3. | 4467 | 101. | 6 | 103. | 67 | 5. | 9895 | 17. | 57 | 1. | 1818 | 2. | 1925 | 28. | 05 | 20. | 0822 | |
| II | 41 | 3. | 11 | 88. | 02 | 105. | 46 | 6. | 7226 | 17. | 67 | 1. | 3027 | 4. | 2903 | 31. | 9 | 41. | 1766 | |
| III | 48 | 2. | 779 | 80. | 85 | 197. | 98 | 9. | 9973 | 15. | 17 | 2. | 2161 | 8. | 4318 | 42. | 77 | 24. | 9037 | |
| H | 5. | 416 | 6. | 517 | 8. | 702 | 6. | 538 | 4. | 888 | 9. | 063 | 13. | 204 | 8. | 233 | 10. | 717 | ||
| III/I |
| 0. | 002 | 0. | 000 | 0. | 000 | 0. | 000 | 0. | 089 | 0. | 000 | 0. | 000 | 0. | 169 | 0. | 096 | |
| II/I |
| 0. | 232 | 0. | 025 | 0. | 253 | 0. | 328 | 0. | 246 | 0. | 188 | 0. | 001 | 0. | 536 | 0. | 232 | |
| III/II |
| 0. | 315 | 0. | 126 | 0. | 002 | 0. | 002 | 0. | 009 | 0. | 000 | 0. | 001 | 0. | 046 | 0. | 004 | |
Note:
3.3Univariate and multivariate analysis of count data
Cox univariate and multivariate analyses were performed on factors, including sex, underlying disease, treatment protocol, D-S stage, ISS stage, and IFE. The results of univariate analysis showed that ISS stage, treatment plan, and IFE type had significant effects on the three-year OS of patients with MM (
Table 5
Univariate and multivariate Cox proportional hazards regression models of count data for 3-year OS and PFS in MM patients
| Factors |
| 3-year OS mean (month) | 3-year PFS mean (month) | Univariate | Multivariate | ||||||
| OS | PFS | ||||||||||
| HR | 95.0% CI | HR | 95.0% CI | ||||||||
| Gender | 0.538 | 0.904 | |||||||||
| Male | 58 | 26.93 | 29.58 | ||||||||
| Female | 52 | 26.73 | 27.12 | ||||||||
| Comorbidities | 0.888 | 0.994 | |||||||||
| Yes | 76 | 27.15 | 29.54 | ||||||||
| No | 34 | 26.11 | 27.04 | ||||||||
| Treatment protocol | 0.015 | 0.073 | 0.458 | 0.251–0.833 | 0.011 | 0.370 | 0.143–0.962 | 0.041 | |||
| Bortezomib | 45 | 30.24 | 34.40 | ||||||||
| included | |||||||||||
| Bortezomib | 65 | 24.47 | 25.46 | ||||||||
| not included | |||||||||||
| D-S stage | 0.138 | 0.281 | |||||||||
| I | 19 | 24.31 | 25.99 | ||||||||
| II | 21 | 30.85 | 32.02 | ||||||||
| III | 70 | 26.31 | 28.61 | ||||||||
| ISS stage | 0.020 | 0.109 | 0.044 | ||||||||
| I | 21 | 23.76 | 26.27 | 0.465 | 0.216–1.001 | 0.05 | |||||
| II | 41 | 30.61 | 30.59 | 1.054 | 0.522–2.127 | 0.883 | |||||
| III | 48 | 24.91 | 25.03 | ||||||||
| Immunoglobulins | 0.024 | 0.001 | 0.033 | ||||||||
| Light chain | 19 | 30.47 | 31.62 | 1.770 | 0.742–4.224 | 0.198 | 0.856 | 0.230–3.194 | 0.817 | ||
| IgA | 24 | 25.25 | 29.05 | 1.425 | 0.640–3.176 | 0.386 | 1.347 | 0.467–3.885 | 0.582 | ||
| IgG | 62 | 27.67 | 26.748 | 11.062 | 3.252–37.628 | 30.226 | 2.660–343.470 | 0.006 | |||
| Others | 5 | 10.20 | 5.00 | ||||||||
HR
Figure 1.
Kaplan-Meier survival analysis of predictors for OS, including treatment protocol and ISS stage. Kaplan-Meier survival analysis for A) ISS stage (
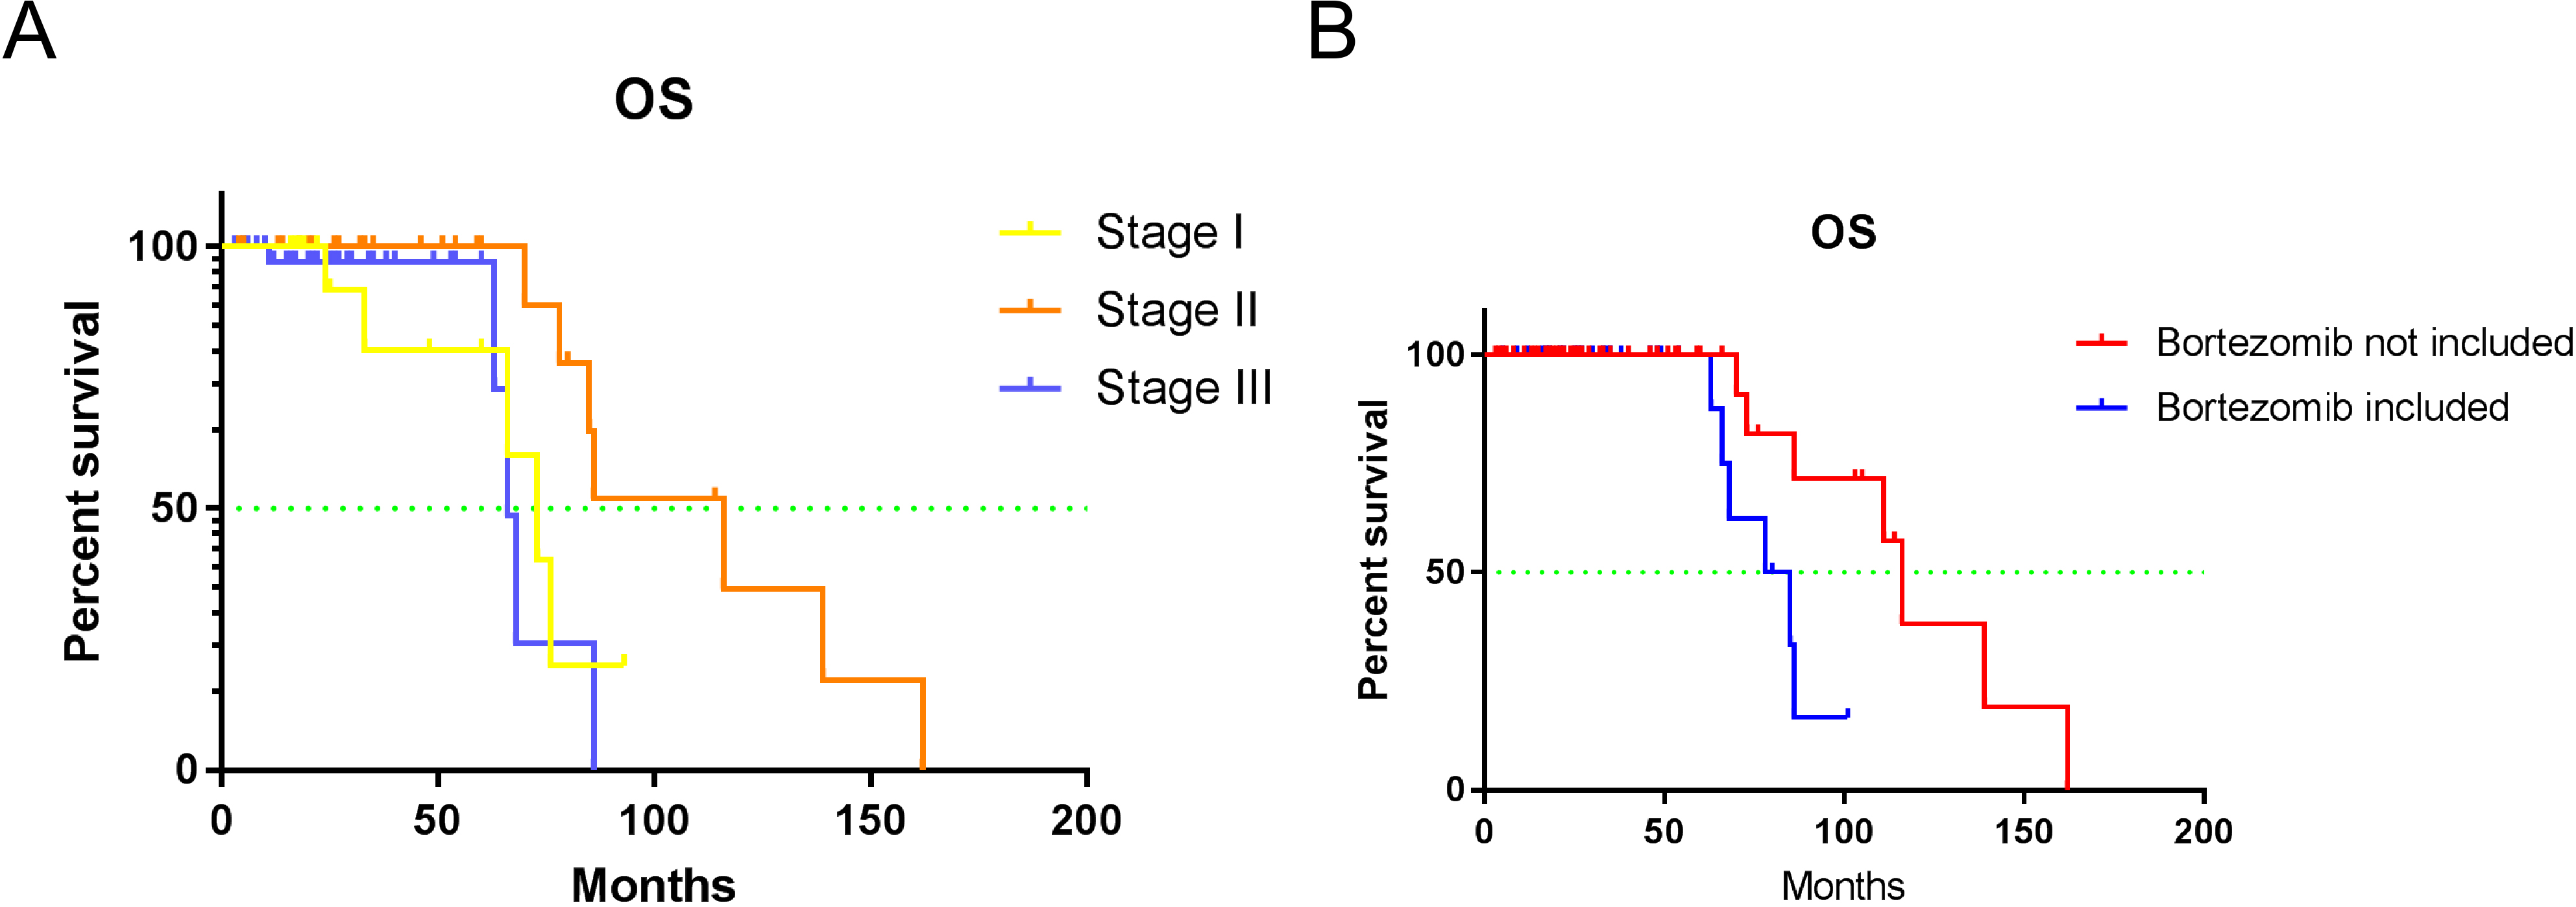
Table 6
Univariate and multivariate Cox proportional hazards regression models of measurement data for 3-year OS and PFS in MM patients
| Factors | Univariate | Multivariate | |||||
|---|---|---|---|---|---|---|---|
| OS | PFS | OS | |||||
| HR | HR | HR | 95.0% CI | ||||
| Age (year) | 1.019 | 0.155 | 1.001 | 0.931 | |||
| BMPC (%) | 0.995 | 0.488 | 0.994 | 0.555 | |||
| WBC (*10 | 1.043 | 0.284 | 1.093 | 0.234 | |||
| NEU (*10 | 1.036 | 0.447 | 1.136 | 0.117 | |||
| LYM (*10 | 1.083 | 0.178 | 0.896 | 0.620 | |||
| MONO (*10 | 1.097 | 0.090 | 1.038 | 0.646 | 1.105 | 0.983–1.242 | 0.045 |
| RBC (*10 | 1.070 | 0.668 | 1.000 | 0.999 | |||
| HGB (g/L) | 1.006 | 0.265 | 0.999 | 0.911 | |||
| RDW (%) | 0.968 | 0.477 | 1.010 | 0.870 | |||
| PLT (*10 | 1.001 | 0.534 | 0.999 | 0.749 | |||
| NLR | 1.003 | 0.947 | 1.072 | 0.181 | |||
| PLR | 1.002 | 0.244 | 1.003 | 0.185 | |||
| RPR | 0.02 | 0.003 | 0.099 | 0.127 | 0.037 | 0.002–0.887 | 0.042 |
| IgG (g/L) | 0.987 | 0.019 | 0.994 | 0.366 | |||
| IgA (g/L) | 1.006 | 0.254 | 1.003 | 0.785 | |||
| Ca (mmol/L) | 1.445 | 0.249 | 1.766 | 0.170 | |||
| Cre (umol/L) | 1.001 | 0.548 | 1.001 | 0.501 | |||
| UREA (mmol/L) | 1.003 | 0.909 | 1.015 | 0.711 | |||
| ALP (U/L) | 1.003 | 0.125 | 1.001 | 0.707 | |||
| ALT (U/L) | 0.990 | 0.417 | 0.976 | 0.223 | |||
| LDH (U/L) | 1.004 | 0.043 | 1.003 | 0.184 | |||
| CysC (mg/L) | 1.145 | 0.271 | 1.151 | 0.352 | |||
| 1.045 | 0.156 | 1.089 | 0.043 | ||||
HR
3.4Univariate and multivariate analysis of measurement data
Table 6 shows the analysis of measurement data using univariate and multivariate analysis models. The results from the univariate analysis showed that RPR, MONO, IgG, and LDH had significant effects on the three-year OS of patients with MM, while only
3.5Establishment of the prognostic model
RPR and MONO showed statistical significance in multiple factors and were used to establish the prognostic model performed using R (v3.6.3); the results showed that MONO
Table 7
Risk score for MM patients
| Patient | RPR | MONO (*10 | Risk score | Risk |
|---|---|---|---|---|
| 1 | 0.06 | 1.25 | High | |
| 2 | 0.08 | 0.203 | High | |
| 3 | 0.07 | 0.525 | High | |
| 4 | 0.09 | 0.352 | High | |
| 5 | 0.06 | 0.263 | High | |
| 6 | 0.05 | 0.421 | High | |
| 7 | 0.06 | 0.323 | High | |
| 8 | 0.11 | 0.57 | Low | |
| 9 | 0.10 | 0.36 | Low | |
| 10 | 0.07 | 0.46 | High | |
| 11 | 0.18 | 0.19 | Low | |
| 12 | 0.06 | 0.62 | High | |
| 13 | 0.11 | 0.24 | Low | |
| 14 | 0.13 | 0.18 | Low | |
| 15 | 0.22 | 0.43 | Low | |
| 16 | 0.06 | 0.5 | High | |
| 17 | 0.05 | 0.43 | High | |
| 18 | 0.04 | 0.36 | High | |
| 19 | 0.08 | 0.26 | High | |
| 20 | 0.10 | 0.67 | Low | |
| 21 | 0.06 | 0.87 | High | |
| 22 | 0.10 | 0.68 | High | |
| 23 | 0.09 | 0.65 | High | |
| 24 | 0.06 | 0.59 | High | |
| 25 | 0.30 | 0.35 | Low | |
| 26 | 0.07 | 0.78 | High | |
| 27 | 0.31 | 0.61 | Low | |
| 28 | 0.11 | 0.52 | Low | |
| 29 | 0.46 | 0.3 | Low | |
| 30 | 0.31 | 0.39 | Low | |
| 31 | 0.10 | 0.72 | Low | |
| 32 | 0.05 | 0.39 | High | |
| 33 | 0.11 | 12.9 | 0.088 | High |
| 34 | 0.13 | 0.21 | Low | |
| 35 | 0.05 | 1.48 | High | |
| 36 | 0.10 | 0.56 | Low | |
| 37 | 0.08 | 0.56 | High | |
| 38 | 0.21 | 7.0 | Low | |
| 39 | 0.09 | 0.38 | High | |
| 40 | 0.09 | 0.40 | High | |
| 41 | 0.12 | 0.35 | Low | |
| 42 | 0.13 | 0.44 | Low | |
| 43 | 0.22 | 0.19 | Low | |
| 44 | 0.06 | 0.24 | High | |
| 45 | 0.19 | 0.36 | Low | |
| 46 | 0.05 | 0.29 | High | |
| 47 | 0.09 | 0.34 | High | |
| 48 | 0.08 | 0.37 | High | |
| 49 | 0.05 | 0.36 | High | |
| 50 | 0.09 | 0.27 | High | |
| 51 | 0.11 | 0.24 | Low | |
| 52 | 0.06 | 0.40 | High | |
| 53 | 0.08 | 0.67 | High | |
| 54 | 0.10 | 0.60 | Low | |
| 55 | 0.07 | 0.69 | High | |
| 56 | 0.07 | 0.45 | High | |
| 57 | 0.06 | 2.40 | High | |
| 58 | 0.06 | 0.75 | High | |
| 59 | 0.19 | 0.28 | Low |
|
Table 7, continued | ||||
| Patient | RPR | MONO (*10 | Risk score | Risk |
| 60 | 0.07 | 0.44 | High | |
| 61 | 0.04 | 0.56 | High | |
| 62 | 0.48 | 0.33 | Low | |
| 63 | 0.04 | 1.27 | High | |
| 64 | 0.46 | 0.16 | Low | |
| 65 | 0.22 | 0.26 | Low | |
| 66 | 0.07 | 0.04 | High | |
| 67 | 0.05 | 0.58 | High | |
| 68 | 0.09 | 0.39 | High | |
| 69 | 0.07 | 0.38 | High | |
| 70 | 0.03 | 0.53 | High | |
| 71 | 0.44 | 0.65 | Low | |
| 72 | 0.12 | 0.28 | Low | |
| 73 | 0.04 | 7.1 | 0.083 | High |
| 74 | 0.05 | 0.69 | High | |
| 75 | 0.06 | 0.45 | High | |
| 76 | 0.10 | 0.84 | Low | |
| 77 | 0.11 | 0.79 | Low | |
| 78 | 0.06 | 0.94 | High | |
| 79 | 0.17 | 0.23 | Low | |
| 80 | 0.06 | 0.47 | High | |
| 81 | 0.05 | 0.44 | High | |
| 82 | 0.36 | 0.14 | Low | |
| 83 | 0.08 | 0.84 | High | |
| 84 | 0.07 | 1.61 | High | |
| 85 | 0.07 | 0.29 | High | |
| 86 | 0.05 | 0.23 | High | |
| 87 | 0.19 | 0.2 | Low | |
| 88 | 0.05 | 0.41 | High | |
| 89 | 0.10 | 0.39 | Low | |
| 90 | 0.14 | 0.42 | Low | |
| 91 | 0.13 | 0.44 | Low | |
| 92 | 0.07 | 0.7 | High | |
| 93 | 0.18 | 0.08 | Low | |
| 94 | 0.10 | 0.43 | Low | |
| 95 | 0.19 | 0.47 | Low | |
| 96 | 0.44 | 0.36 | Low | |
| 97 | 0.36 | 0.43 | Low | |
| 98 | 0.59 | 0.25 | Low | |
| 99 | 0.70 | 0.52 | Low | |
| 100 | 0.51 | 0.32 | Low | |
| 101 | 0.42 | 0.68 | Low | |
| 102 | 0.56 | 0.51 | Low | |
| 103 | 0.74 | 0.51 | Low | |
| 104 | 0.34 | 0.32 | Low | |
| 105 | 0.44 | 0.43 | Low | |
| 106 | 0.24 | 0.45 | Low | |
| 107 | 0.40 | 0.2 | Low | |
| 108 | 0.41 | 0.32 | Low | |
| 109 | 0.48 | 0.22 | Low | |
| 110 | 0.48 | 0.17 | Low | |
Table 8
Comparison of risk scores in MM patients
| Risk score |
| Three-year OS mean (month) | |
|---|---|---|---|
| High risk | 56 | 24.911 | 0.015 |
| Low risk | 54 | 28.833 |
Figure 2.
Kaplan-Meier survival analysis of the high- and low-risk groups.
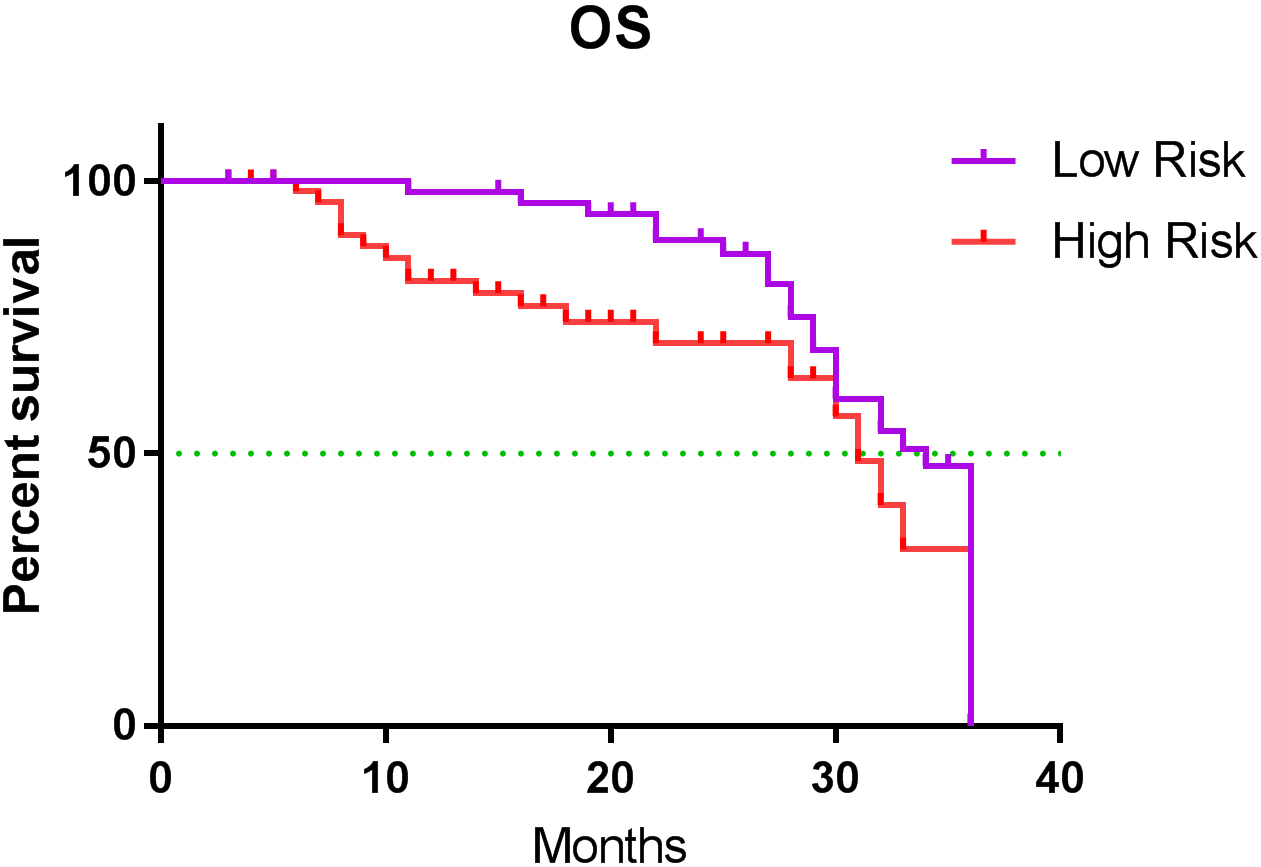
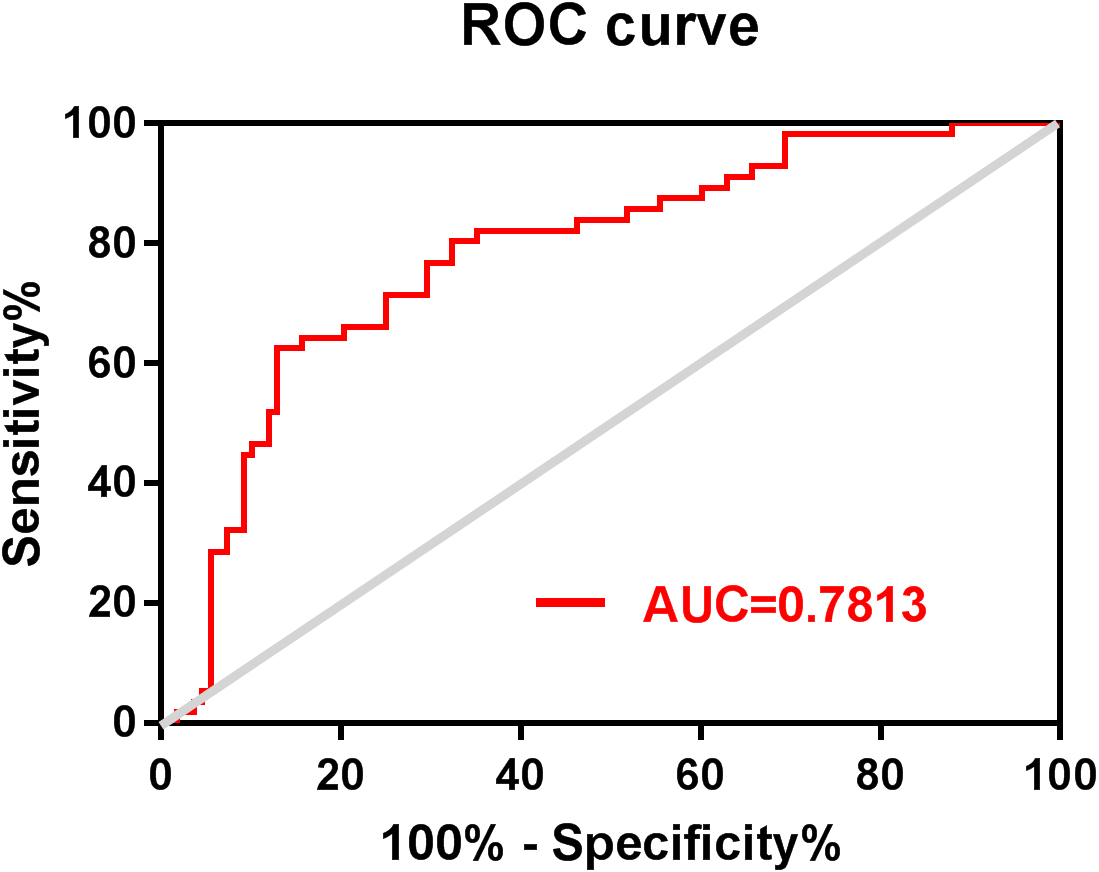
Figure 3.
ROC curve of the risk score of three-year mortality of patients with MM. ROC: receiver operating characteristic; MM: multiple myeloma.
4.Discussion
MM is a malignant disease characterized by clonal proliferation of plasma cells, which tends to occur in the elderly population. In our study, the onset age of MM ranged from 31 to 84 years, with a median of 61 and a concentration between 50 and 70 years (68 cases, 61.8%), which is similar to the results of a retrospective study in China [2]. The prognosis of patients with MM is markedly heterogeneous, and early clinical manifestations lack specificity. In our study, the primary symptoms of MM were bone pain (77.3%), followed by anemia (10.9%), and other symptoms, such as bleeding and foam urine, accounting for a small proportion, which is consistent with results from a previous study [15]. Bone pain is often regarded as the primary symptom of MM because it is difficult for patients to ignore and cannot be missed during diagnosis and treatment.
In clinical practice, the most common current prognostic assessment systems are D-S and ISS staging [16, 17]. In our study, 17.3%, 19.1%, and 63.6% of the patients were grouped into stages I, II, and III, respectively, according to D-S staging, suggesting that most of the patients with MM were in the mid or late stages of the disease when they were first diagnosed. Univariate and multivariate analyses showed that there was no significant difference in the prognosis between patients grouped according to the D-S stages. In terms of ISS groups, 19.1%, 37.3%, and 43.6% of the patients were classified as stage I, II, and III, respectively. Univariate analysis showed that the different ISS stages were closely related to the OS of patients with MM, suggesting that ISS staging may guide the prognosis of patients with MM better than D-S staging.
In our study, we found that BMPC%, CysC, and
With the development of immunosuppressants and protease inhibitors, bortezomib has become the first-line therapy for MM. As a PI, it can reduce the level of cytokines by reversibly binding to the 26S proteasome, thereby reducing its activity, which blocks the degradation pathways of various intracellular proteins, induces apoptosis of tumor cells, and inhibits the growth and proliferation of tumor cells [21, 22]. In our study, the treatment regimens were divided into bortezomib and non-bortezomib groups. Univariate and multivariate analyses showed that the treatment regimens, including bortezomib, had better three-year OS and PFS (
Anemia is a major clinical manifestation in patients with MM. The infiltration of myeloma cells can directly destroy red blood cells, and the production of erythropoietin decreases owing to the renal involvement of MM [23]. In our study, RBC and HGB in patients were negatively correlated with their D-S and ISS stages, suggesting that the RBC and HGB not only can be used as screening indicators for anemia in patients with MM but also have guiding value for clinical staging and curative effects. In the pathogenesis of MM, tumor-associated macrophages derived from circulating monocytes can induce angiogenesis as well as inhibit growth factors and cytokines involved in the immune response, thereby promoting tumor progression [24]. Both univariate and multivariate analyses showed that the MONO had a significant impact on OS in patients with MM. In addition, the MONO was positively correlated with the ISS stage in between-group comparisons; therefore, the MONO was higher in patients at D-S or ISS stage III than in those with stage I. Therefore, monocytes could serve as a factor in the prognosis of MM. The RPR is often considered to have a close relationship with inflammation and tumors. According to some studies, the RPR reflects the inflammatory state of the tumor-related microenvironment and plays an important role in the proliferation and metastasis of tumor cells [25, 26]. Our results of the univariate analysis showed that the RPR had a significant effect on the OS and PFS of patients with MM, while the results of the multivariate analysis showed that the RPR only had a significant effect on OS. The establishment of a prognostic model based on the MONO and RPR can be used to monitor the tumor microenvironment of MM and infer tumor progression. These two non-genetic indicators are easier to measure and are not affected by nutritional status. Most importantly, they have good prognostic values. In our prognostic model, the mean OS of the high-risk group was 24.911 months, and the mean OS time of the low-risk group was 28.833 months. The risk of death was significantly higher in the high-risk group than in the low-risk group (
Our study shares some common limitations with similar retrospective studies, including selection bias in patients and treatment due to the study design, as well as a potentially small sample size due to being conducted at a single center. We acknowledge these limitations, which should be considered when interpreting our findings. However, our study also had important strengths. We used a conceptual model to optimize our investigative approach, allowing us to identify pertinent and modifiable factors of MM that can be targeted to prevent adverse clinical outcomes. Our findings suggest that non-genetic predictors are modifiable risk factors for MM and can be targeted in future treatment strategies to improve patient outcomes. In addition, we proposed a prognostic model based on the RPR and MONO as risk factors that have important prognostic value for MM patients. The model can divide patients into low-and high-risk groups based on different prognostic indexes, enabling clinicians to tailor treatment plans accordingly. This approach can improve patient outcomes and reduce treatment-related toxicities. Risk stratification is crucial for MM patients, and our proposed prognostic model has significant clinical implications. It highlights the importance of individualized treatment plans based on the risk factors of patients, which can improve patient outcomes and reduce the risk of adverse events. Nevertheless, further research is needed to validate our proposed model in larger, multicenter cohorts and identify additional prognostic indicators to further refine risk stratification. We also recognize the need for exploring the identification of modifiable risk factors for MM in greater detail to identify new therapeutic targets.
5.Conclusion
In conclusion, the levels of CysC and
Funding
The author(s) disclose receipt of the following financial support for the research, authorship, and/or publication of this article: This work was supported by funding from the Guangdong Provincial Bureau of Traditional Chinese Medicine (Fund No. 20211137).
Author contributions
Conception: MingFeng Xiao.
Interpretation or analysis of data: Shumin Xu and Lu Lu.
Preparation of the manuscript: MingFeng Xiao.
Revision for important intellectual content: Man Luo.
Supervision: Weiguo Lu and MingFeng Xiao.
Declaration of conflicting interests
The authors declare no conflict of interest.
Data availability
The datasets generated and/or analyzed during the current study are available from the corresponding author upon reasonable request.
Acknowledgments
We would like to thank Editage for the language editing provided for this manuscript.
References
[1] | C. Gerecke, S. Fuhrmann, S. Strifler, M. Schmidt-Hieber, H. Einsele and S. Knop, The diagnosis and treatment of multiple myeloma, Dtsch Arztebl Int 113: ((2016) ), 470–476. |
[2] | S. Wang, L. Xu, J. Feng, Y. Liu, L. Liu, J. Wang, J. Liu, X. Huang, P. Gao, J. Lu and S. Zhan, Prevalence and Incidence of Multiple Myeloma in Urban Area in China: A National Population-Based Analysis, Front Oncol 9: ((2019) ), 1513. |
[3] | R.A. Kyle, M.A. Gertz, T.E. Witzig, J.A. Lust, M.Q. Lacy, A. Dispenzieri, R. Fonseca, S.V. Rajkumar, J.R. Offord, D.R. Larson, M.E. Plevak, T.M. Therneau and P.R. Greipp, Review of 1027 patients with newly diagnosed multiple myeloma, Mayo Clin Proc 78: ((2003) ), 21–33. |
[4] | M. Dimopoulos, R. Kyle, J.P. Fermand, S.V. Rajkumar, J. San Miguel, A. Chanan-Khan, H. Ludwig, D. Joshua, J. Mehta, M. Gertz, H. Avet-Loiseau, M. Beksaş, K.C. Anderson, P. Moreau, S. Singhal, H. Goldschmidt, M. Boccadoro, S. Kumar, S. Giralt, N.C. Munshi and S. Jagannath, Consensus recommendations for standard investigative workup: Report of the International Myeloma Workshop Consensus Panel 3, Blood 117: ((2011) ), 4701–4705. |
[5] | O. Landgren and S.V. Rajkumar, New developments in diagnosis, prognosis, and assessment of response in multiple myeloma, Clin Cancer Res 22: ((2016) ), 5428–5433. |
[6] | M.A. Dimopoulos, A. Oriol, H. Nahi, J. San-Miguel, N.J. Bahlis, S.Z. Usmani, N. Rabin, R.Z. Orlowski, M. Komarnicki, K. Suzuki, T. Plesner, S.S. Yoon, D. Ben Yehuda, P.G. Richardson, H. Goldschmidt, D. Reece, S. Lisby, N.Z. Khokhar, L. O’Rourke, C. Chiu, X. Qin, M. Guckert, T. Ahmadi and P. Moreau, Daratumumab, lenalidomide, and dexamethasone for multiple myeloma, N Engl J Med 375: ((2016) ), 1319–1331. |
[7] | P. Moreau, A. Chanan-Khan, A.W. Roberts, A.B. Agarwal, T. Facon, S. Kumar, C. Touzeau, E.A. Punnoose, J. Cordero, W. Munasinghe, J. Jia, A.H. Salem, K.J. Freise, J.D. Leverson, S.H. Enschede, J.A. Ross, P.C. Maciag, M. Verdugo and S.J. Harrison, Promising efficacy and acceptable safety of venetoclax plus bortezomib and dexamethasone in relapsed/refractory MM, Blood 130: ((2017) ), 2392–2400. |
[8] | P. Moreau, M. Attal, C. Hulin, B. Arnulf, K. Belhadj, L. Benboubker, M.C. Béné, A. Broijl, H. Caillon, D. Caillot, J. Corre, M. Delforge, T. Dejoie, C. Doyen, T. Facon, C. Sonntag, J. Fontan, L. Garderet, K.S. Jie, L. Karlin, F. Kuhnowski, J. Lambert, X. Leleu, P. Lenain, M. Macro, C. Mathiot, F. Orsini-Piocelle, A. Perrot, A.M. Stoppa, N.W. van de Donk, S. Wuilleme, S. Zweegman, B. Kolb, C. Touzeau, M. Roussel, M. Tiab, J.P. Marolleau, N. Meuleman, M.C. Vekemans, M. Westerman, S.K. Klein, M.D. Levin, J.P. Fermand, M. Escoffre-Barbe, J.R. Eveillard, R. Garidi, T. Ahmadi, S. Zhuang, C. Chiu, L. Pei, C. de Boer, E. Smith, W. Deraedt, T. Kampfenkel, J. Schecter, J. Vermeulen, H. Avet-Loiseau and P. Sonneveld, Bortezomib, thalidomide, and dexamethasone with or without daratumumab before and after autologous stem-cell transplantation for newly diagnosed multiple myeloma (CASSIOPEIA): A randomised, open-label, phase 3 study, Lancet 394: ((2019) ), 29–38. |
[9] | M. Attal, P.G. Richardson, S.V. Rajkumar, J. San-Miguel, M. Beksac, I. Spicka, X. Leleu, F. Schjesvold, P. Moreau, M.A. Dimopoulos, J.S. Huang, J. Minarik, M. Cavo, H.M. Prince, S. Macé, K.P. Corzo, F. Campana, S. Le-Guennec, F. Dubin and K.C. Anderson, Isatuximab plus pomalidomide and low-dose dexamethasone versus pomalidomide and low-dose dexamethasone in patients with relapsed and refractory multiple myeloma (ICARIA-MM): A randomised, multicentre, open-label, phase 3 study, Lancet 394: ((2019) ), 2096–2107. |
[10] | M. Jan, I. Scarfò, R.C. Larson, A. Walker, A. Schmidts, A.A. Guirguis, J.A. Gasser, M. Słabicki, A.A. Bouffard, A.P. Castano, M.C. Kann, M.L. Cabral, A. Tepper, D.E. Grinshpun, A.S. Sperling, T. Kyung, Q.L. Sievers, M.E. Birnbaum, M.V. Maus and B.L. Ebert, Reversible ON- and OFF-switch chimeric antigen receptors controlled by lenalidomide, Sci Transl Med 13: ((2021) ). |
[11] | K. Brigle and B. Rogers, Pathobiology and diagnosis of multiple myeloma, Semin Oncol Nurs 33: ((2017) ), 225–236. |
[12] | L.G. Conté, M.G. Figueroa, V.V. Lois, C.M. Cabrera, R.A. León, L.H. García and R.H. Rojas, Prognostic value of the new international staging system in multiple myeloma. Comparison with Durie-Salmon staging system, Rev Med Chil 136: ((2008) ), 7–12. |
[13] | S.V. Rajkumar, Multiple myeloma: Every year a new standard? Hematol Oncol 37 Suppl 1: ((2019) ), 62–65. |
[14] | A.J. Cowan, D.J. Green, M. Kwok, S. Lee, D.G. Coffey, L.A. Holmberg, S. Tuazon, A.K. Gopal and E.N. Libby, Diagnosis and management of multiple myeloma: A review, Jama 327: ((2022) ), 464–477. |
[15] | A. Seesaghur, N. Petruski-Ivleva, V.L. Banks, J.R. Wang, A.Abbasi, D. Neasham and K. Ramasamy, Clinical features and diagnosis of multiple myeloma: A population-based cohort study in primary care, BMJ Open 11: ((2021) ), e052759. |
[16] | B.G. Durie and S.E. Salmon, A clinical staging system for multiple myeloma. Correlation of measured myeloma cell mass with presenting clinical features, response to treatment, and survival, Cancer 36: ((1975) ), 842–854. |
[17] | A. Palumbo, H. Avet-Loiseau, S. Oliva, H.M. Lokhorst, H. Goldschmidt, L. Rosinol, P. Richardson, S. Caltagirone, J.J. Lahuerta, T. Facon, S. Bringhen, F. Gay, M. Attal, R. Passera, A. Spencer, M. Offidani, S. Kumar, P. Musto, S. Lonial, M.T. Petrucci, R.Z. Orlowski, E. Zamagni, G. Morgan, M.A. Dimopoulos, B.G. Durie, K.C. Anderson, P. Sonneveld, J. San Miguel, M. Cavo, S.V. Rajkumar and P. Moreau, Revised international staging system for multiple myeloma: A report from international myeloma working group, J Clin Oncol 33: ((2015) ), 2863–2869. |
[18] | X.Y. Wu, J.M. Shi, Y. Tao and Z. Li, Diagnostic Value of IGF-I, β2-MG and SF for Patients with Multiple Myeloma and Their Relationship with Clinical Staging, Zhongguo Shi Yan Xue Ye Xue Za Zhi 26: ((2018) ), 802–806. |
[19] | E. Terpos, E. Katodritou, M. Roussou, A. Pouli, E. Michalis, S. Delimpasi, A. Parcharidou, Z. Kartasis, A. Zomas, A. Symeonidis, N.A. Viniou, N. Anagnostopoulos, T. Economopoulos, K. Zervas and M.A. Dimopoulos, High serum lactate dehydrogenase adds prognostic value to the international myeloma staging system even in the era of novel agents, Eur J Haematol 85: ((2010) ), 114–119. |
[20] | M. Gkotzamanidou, E. Kastritis, M.R. Gavriatopoulou, N. Nikitas, D. Gika, D. Mparmparousi, C. Matsouka, E. Terpos and M.A. Dimopoulos, Increased serum lactate dehydrongenase should be included among the variables that define very-high-risk multiple myeloma, Clin Lymphoma Myeloma Leuk 11: ((2011) ), 409–413. |
[21] | G. Cengiz Seval and M. Beksac, The safety of bortezomib for the treatment of multiple myeloma, Expert Opin Drug Saf 17: ((2018) ), 953–962. |
[22] | K. Colson, D.S. Doss, R. Swift, J. Tariman and T.E. Thomas, Bortezomib, a newly approved proteasome inhibitor for the treatment of multiple myeloma: Nursing implications, Clin J Oncol Nurs 8: ((2004) ), 473–480. |
[23] | A.S. Al Saleh, M.H. Sidiqi, A. Dispenzieri, P. Kapoor, E. Muchtar, F.K. Buadi, R. Warsame, M.Q. Lacy, D. Dingli, N. Leung, W.I. Gonsalves, T.V. Kourelis, M.A. Gertz, R.S. Go, R.A. Kyle, S.V. Rajkumar and S.K. Kumar, Hematopoietic score predicts outcomes in newly diagnosed multiple myeloma patients, Am J Hematol 95: ((2020) ), 4–9. |
[24] | T. Chanmee, P. Ontong, K. Konno and N. Itano, Tumor-associated macrophages as major players in the tumor microenvironment, Cancers (Basel) 6: ((2014) ), 1670–1690. |
[25] | S. Meng, Z. Ma, C. Lu, H. Liu, H. Tu, W. Zhang and F. Zhou, Prognostic Value of Elevated Red Blood Cell Distribution Width in Chinese Patients with Multiple Myeloma, Ann Clin Lab Sci 47: ((2017) ), 282–290. |
[26] | J. Wang, X. Xie, F. Cheng, X. Zhou, J. Xia, X. Qian, L. Wang and H. Guo, Evaluation of pretreatment red cell distribution width in patients with multiple myeloma, Cancer Biomark 20: ((2017) ), 267–272. |


