
Pan-cancer transcriptomic data of ABI1 transcript variants and molecular constitutive elements identifies novel cancer metastatic and prognostic biomarkers
Abstract
BACKGROUND:
Abelson interactor 1 (ABI1) is associated with the metastasis and prognosis of many malignancies. The association between ABI1 transcript spliced variants, their molecular constitutive exons and exon–exon junctions (EEJs) in 14 cancer types and clinical outcomes remains unsolved.
OBJECTIVE:
To identify novel cancer metastatic and prognostic biomarkers from ABI1 total mRNA, TSVs, and molecular constitutive elements.
METHODS:
Using data from TCGA and TSVdb database, the standard median of ABI1 total mRNA, TSV, exon, and EEJ expression was used as a cut-off value. Kaplan-Meier analysis, Chi-squared test (
RESULTS:
A total of 35 ABI1-related factors were found to be closely related to the prognosis of eight candidate cancer types. A total of 14 ABI1 TSVs and molecular constitutive elements were identified as novel metastatic and prognostic biomarkers in four cancer types. A total of 13 ABI1 molecular constitutive elements were identified as independent prognostic biomarkers in six cancer types.
CONCLUSIONS:
In this study, we identified 14 ABI1-related novel metastatic and prognostic markers and 21 independent prognostic factors in total 8 candidate cancer types.
1.Introduction
Cancer is a major public health problem worldwide, being the second leading cause of death in the United States and the third in China [1, 2]. Although there has been tremendous progress in the diagnosis and treatment of this condition, the prognosis of patients with tumor metastasis is poor. Metastasis is still the largest obstacle to resolving cancer cases and the main cause of cancer-related death [3, 4].
Metastatic cells exhibit extraordinary phenotypic plasticity, not only in adapting to unfamiliar microenvironments but also in surviving aggressive treatments and immune responses. A major source of phenotypic variability is alternative splicing (AS) of pre-messenger RNA [5]. There are multiple transcript spliced variants (TSVs) in many mRNAs related to tumor metastasis and prognosis, and their protein expression products act either synergistically or antagonistically, and jointly participate in the precise regulation of tumor cell adhesion, invasion, migration, and other tumor cell behaviors [5, 6, 7].
Abelson interactor 1 (ABI1) encodes a class of adaptor proteins that can form complexes with one or more proteins (e.g.WAVE2, NWASP, EPS8 and PI3K) to play important pathophysiological roles [8]. Previous studies showed that the abnormal expression and phosphorylation of ABI1 are involved in the invasion and metastasis of various malignant tumors (colorectal cancer, gastric cancer, pancreatic cancer, hepatocellular carcinoma, breast cancer, leukemia, prostate cancer, and ovarian cancer, etc.), being closely related to their prognosis [9, 10, 11, 12, 13, 14, 15, 16, 17, 18, 19, 20, 21, 22, 23, 24, 25, 26].
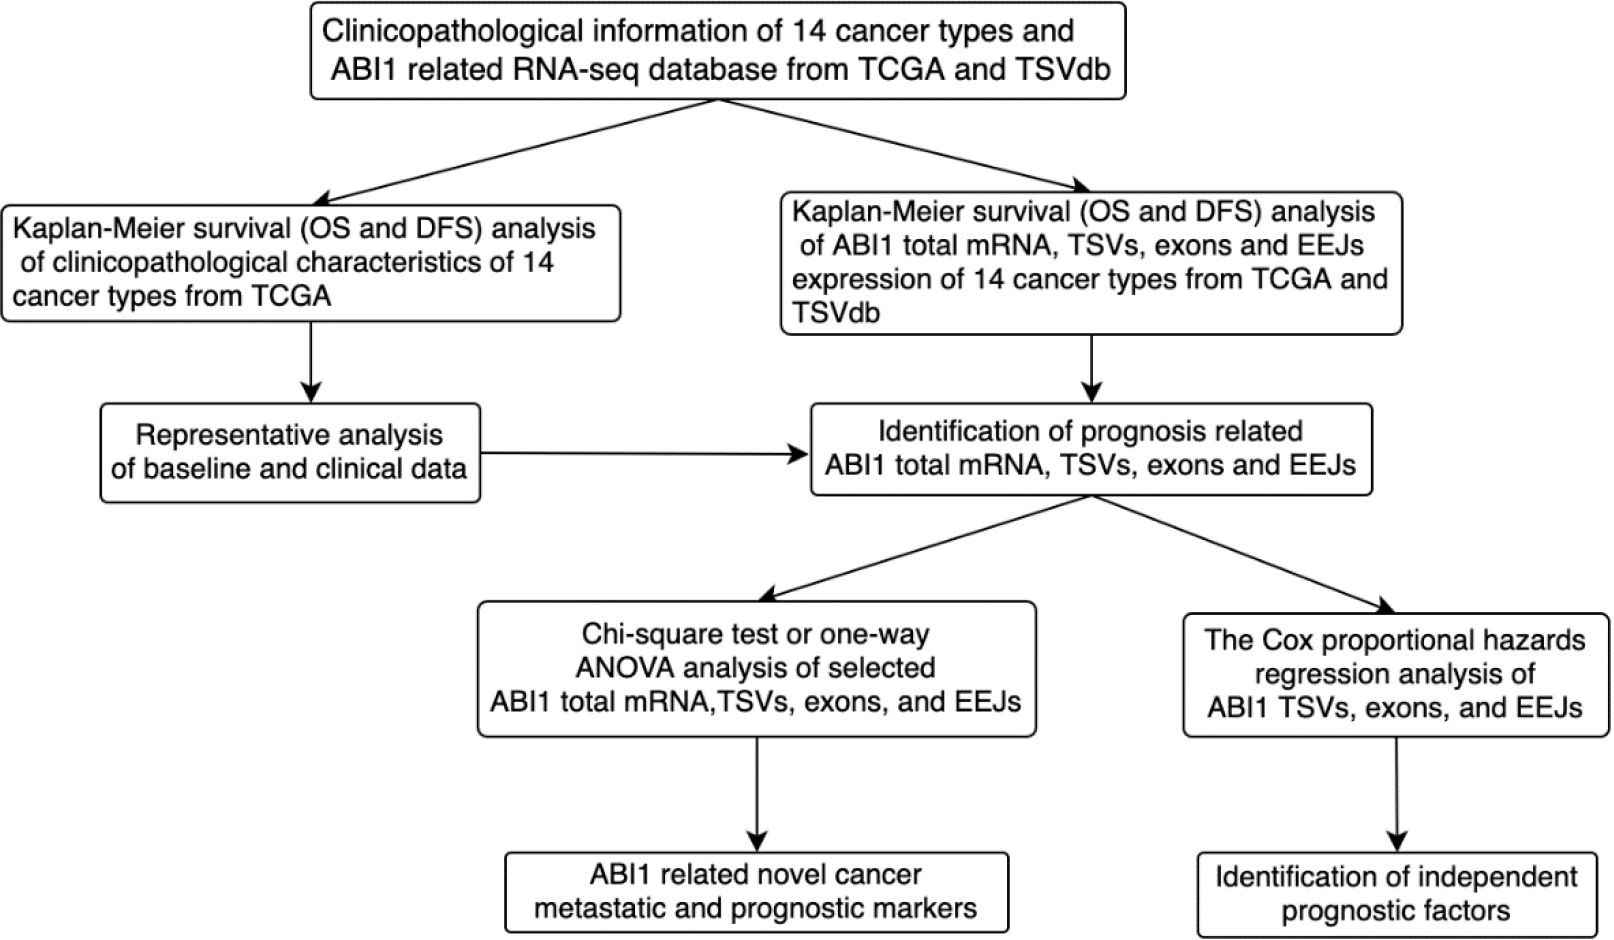
Figure 1.
Flowchart for the identification and analysis of metastatic and prognostic ABI1 total mRNA, TSVs, exons, and EEJs in pan-cancer.
The human ABI1 gene is located at chromosome 10p11.2, and its pre-mRNA can be spliced into at least 12 different ABI1-TSVs. They encode twelve different protein isoforms, and their significant differences in functional domains suggest that the regulation of ABI1-TSVs in pathophysiological processes may be meticulous and complex [8, 24, 25, 26].
Based on previous data analysis of The Cancer Genomic Atlas (TCGA) and TSVdb database (http://tsvdb. com) and in vivo and in vitro studies, we found that alternative splicing is an important mechanism by which ABI1 plays a precise regulatory role in colorectal cancer metastasis, and the key ABI1-TSVs can be used as not only potential molecular markers for colorectal cancer (CRC) metastasis and prognostic assessment [25, 26], but also as important therapeutic targets with their molecular constitutive elements, exons and exon-exon junctions (EEJs). By extension, we believe that it is theoretically and practically significant to systematically analyze the roles and potential applications of ABI1-TSVs and their molecular constitutive elements in the diagnosis and treatment of many cancer types.
As Fig. 1 shows, we preliminarily explored the value of applying ABI1-TSVs and their molecular constitutive elements in the diagnosis and treatment of many cancer types. Based on TCGA and TSVdb databases, we also screened and identified the ABI1-related molecular markers (total mRNA, TSVs, exons, and EEJs) that are closely related to metastasis and function as independent prognostic factors across many cancers.
Table 1
The correlation between clinicopathological characteristics and poor prognosis (OS/DFS) in various tumors
| Cancer species | Gender | Age | Race | T stage | N stage | M stage | Clinical stage | Cancer status | ||||||||||
|---|---|---|---|---|---|---|---|---|---|---|---|---|---|---|---|---|---|---|
| No. | Prognosis |
|
|
|
|
|
|
|
|
|
|
|
|
|
|
|
| |
| 1 | BLCA (311 cases) | OS | 0.049 | 0.826 | 12.335 | 0.000 | 3.479 | 0.176 | 8.136 | 0.043 | 9.439 | 0.024 | 2.156 | 0.142 | 20.020 | 0.000 | 30.561 | 0.000 |
| DFS | 1.004 | 0.316 | 0.004 | 0.950 | 2.074 | 0.354 | 1.556 | 0.667 |
|
|
|
| 12.934 | 0.005 | 20.134 | 0.000 | ||
| 2 | BRCA (991 cases) | OS | 0.696 | 0.405 | 18.566 | 0.000 | 1.875 | 0.392 | 10.753 | 0.013 | 23.571 | 0.000 | 25.110 | 0.000 | 46.962 | 0.000 | 117.173 | 0.000 |
| DFS | 0.952 | 0.329 | 0.825 | 0.364 | 3.245 | 0.952 | 27.012 | 0.000 | 25.162 | 0.000 | 17.217 | 0.000 | 33.657 | 0.000 | 217.268 | 0.000 | ||
| 3 | CESC (233 cases) | OS |
|
| 0.710 | 0.400 | 0.835 | 0.629 | 8.353 | 0.039* | 8.091 | 0.004 | 1.480 | 0.224 |
|
| 89.919 | 0.000 |
| DFS |
|
| 0.121 | 0.728 | 6.108 | 0.047 | 1.121 | 0.571 | 8.539 | 0.003 | 0.069 | 0.792 |
|
| 102.749 | 0.000 | ||
| 4 | ESCA (180 cases) | OS | 2.833 | 0.092 | 0.388 | 0.533 | 3.248 | 0.197 | 3.202 | 0.361 | 13.834 | 0.003 | 14.639 | 0.000 | 25.958 | 0.000** | 13.261 | 0.000 |
| DFS | 1.777 | 0.182 | 0.689 | 0.407 | 17.550 | 0.000 | 5.528 | 0.137 | 1.948 | 0.583 |
|
| 3.728 | 0.155 | 0.002 | 0.968 | ||
| 5 | KICH (61 cases) | OS | 0.039 | 0.843 | 0.677 | 0.410 | 4.287 | 0.117 | 9.729 | 0.002 | 52.991 | 0.000 | 9.368 | 0.002 | 48.238 | 0.000 | 30.429 | 0.000 |
| DFS | 3.771 | 0.052 | 0.244 | 0.622 | 0.045 | 0.831 | 0.548 | 0.459 |
|
|
|
| 0.719 | 0.698 | 11.169 | 0.001 | ||
| 6 | KIRC (500 cases) | OS | 0.009 | 0.925 | 12.651 | 0.000 | 0.854 | 0.652 | 94.391 | 0.000 | 14.799 | 0.000 | 96.607 | 0.000 | 128.481 | 0.000 | 128.587 | 0.000 |
| DFS | 2.664 | 0.104 | 0.153 | 0.696 | 0.000 | 0.994 | 6.067 | 0.048 | 0.156 | 0.693 |
|
| 6.176 | 0.046 | 25.605 | 0.000 | ||
| 7 | KIRP (245 cases) | OS | 0.245 | 0.621 | 0.093 | 0.760 | 4.895 | 0.087 | 36.002 | 0.000** | 13.540 | 0.001 | 108.495 | 0.000 | 75.629 | 0.000 | 48.119 | 0.000 |
| DFS | 4.693 | 0.003 | 0.000 | 0.996 | 21.314 | 0.000 | 4.896 | 0.086 | 5.282 | 0.022 |
|
| 8.254 | 0.016* | 0.055 | 0.815 | ||
| 8 | LIHC (304 cases) | OS | 0.648 | 0.421 | 1.246 | 0.264 | 1.067 | 0.587 | 52.808 | 0.000 | 1.470 | 0.225 | 7.965 | 0.005 | 38.536 | 0.000 | 2.898 | 0.089 |
| DFS | 0.562 | 0.453 | 0.227 | 0.634 | 4.210 | 0.122 | 44.158 | 0.000 | 0.408 | 0.523 | 4.666 | 0.000 | 39.763 | 0.000 | 65.909 | 0.000 | ||
| 9 | LUAD (430 cases) | OS | 0.004 | 0.948 | 1.853 | 0.173 | 5.056 | 0.008 | 7.085 | 0.069 | 11.230 | 0.004 | 0.907 | 0.341 | 43.327 | 0.000 | 31.536 | 0.000 |
| DFS | 0.138 | 0.710 | 2.847 | 0.092 | 0.100 | 0.951 | 53.660 | 0.000 | 0.985 | 0.611 |
|
| 1.233 | 0.540 | 34.466 | 0.000 | ||
| 10 | LUSC (420 cases) | OS | 0.463 | 0.496 | 3.473 | 0.062 | 1.732 | 0.421 | 4.879 | 0.181 | 0.232 | 0.63 | 0.37 | 0.543 | 5.726 | 0.126 | 18.594 | 0.000 |
| DFS | 2.868 | 0.090 | 0.429 | 0.512 | 1.234 | 0.54 | 2.848 | 0.416 | 0.051 | 0.821 |
|
| 0.016 | 0.992 | 28.468 | 0.000 | ||
| 11 | OV (298 cases) | OS |
|
| 5.308 | 0.021 | 0.192 | 0.909 |
|
|
|
|
|
| 4.067 | 0.131 | 29.907 | 0.000 |
| DFS |
|
| 1.330 | 0.249 | 0.061 | 0.970 |
|
|
|
|
|
| 3.542 | 0.170 | 55.296 | 0.000 | ||
| 12 | PAAD (148 cases) | OS | 1.762 | 0.184 | 2.587 | 0.108 | 0.206 | 0.902 | 5.635 | 0.131 | 6.581 | 0.010 | 0.068 | 0.794 | 5.314 | 0.150 | 21.705 | 0.000 |
| DFS | 2.962 | 0.085 | 0.661 | 0.416 | 0.276 | 0.599 | 4.462 | 0.216 | 8.086 | 0.004 |
|
| 5.656 | 0.059 | 6.241 | 0.012 | ||
| 13 | PRAD (225 cases) | OS |
|
|
|
|
|
|
|
|
|
|
|
|
|
|
|
|
| DFS | 0.000 | 0.998 |
|
| 0.390 | 0.823 | 8.340 | 0.015 | 0.722 | 0.395 |
|
| 8.878# | 0.003 | 59.815 | 0.000 | ||
| 14 | STAD (318 cases) | OS | 0.030 | 0.863 | 1.773 | 0.183 | 0.043 | 0.979 | 5.321 | 0. 150 | 5.234 | 0.155 | 2.899 | 0.089 | 7.230 | 0.065 | 18.255 | 0.000 |
| DFS | 4.346 | 0.037 | 0.017 | 0.897 | 8.091 | 0.018 | 9.879 | 0.020 | 0.126 | 0.988 |
|
| 3.263 | 0.196 | 9.932 | 0.002 | ||
BLCA (Bladder urothelial carcinoma); BRCA (Breast invasive carcinoma); CESC (Cervical squamous cell carcinoma); ESCA (Esophageal adenocarcinoma); KICH (Kidney chromophobe); KIRC (Kidney renal clear cell carcinoma); KIRP (Kidney papillary renal cell carcinoma); LIHC (Liver hepatocellular Carcinoma); LUAD (Lung adenocarcinoma); LUSC (Lung Squamous Cell Carcinoma); OV (Ovarian serous cystadenocarcinoma); PAAD (Pancreatic adenocarcinoma); PRAD (Prostate adenocarcinoma) STAD (Stomach adenocarcinoma);
2.Materials and methods
2.1Acquisition of clinicopathological information and RNA sequencing data
As Table 1 shows, we downloaded clinicopathological information on patients with 14 cancer types from TCGA (version 20,160,128) [27], and sequencing data on ABI1 total mRNA, TSVs, and molecular constitutive elements (exons and EEJs) from TSVdb [28]. A total of 4439 patients (BLAC 311, BRAC 991, CESC 233, ESCA 180, KICH 60, KIRC 500, KIRP 245, LIHC 304, LUAD 430, LUSC 420, OV 298, PAAD 128, and STAD 318) with complete overall survival data and 225 patients (PRAD, cases without mortality) with complete disease-free survival data were selected in our study.
Table 2
The correlation between ABI1 total mRNA, TSVs and OS/DFS in selected tumors
| Cancer species | BLCA | BLCA | BRAC | BRAC | ESCA | ESCA | KICH | KICH | ||||||||
|---|---|---|---|---|---|---|---|---|---|---|---|---|---|---|---|---|
| Prognosis | OS | DFS | OS | DFS | OS | DFS | OS | DFS | ||||||||
| ABI1 related factors |
|
|
|
|
|
|
|
|
|
|
|
|
|
|
|
|
| ABI1-Total mRNA | 0.728 | 0.393 | 1.160 | 0.282 | 1.369 | 0.242 | 0.002 | 0.964 | 0.000 | 0.992 | 1.060 | 0.303 | 1.453 | 0.228 | 2.638 | 0.104 |
| ABI1-TSV-1 | 3.845 | 0.050* | 4.909 | 0.027* | 0.870 | 0.351 | 2.254 | 0.133 | 0.148 | 0.701 | 0.003 | 0.959 | 0.220 | 0.639 | 0.095 | 0.758 |
| ABI1-TSV-2 | 0.212 | 0.645 | 0.071 | 0.790 | 0.001 | 0.974 | 0.017 | 0.895 | 0.871 | 0.351 | 0.167 | 0.682 | 2.087 | 0.149 | 1.931 | 0.165 |
| ABI1-TSV-3 | 7.193 | 0.007* | 7.193 | 0.007* | 0.014 | 0.907 | 1.541 | 0.215 | 4.121 | 0.042* | 0.838 | 0.360 | 0.334 | 0.563 | 0.294 | 0.587 |
| ABI1-TSV-4 | 4.096 | 0.043* | 4.096 | 0.043* | 0.712 | 0.399 | 0.213 | 0.644 | 5.307 | 0.021** | 1.593 | 0.207 | 1.826 | 0.177 | 1.092 | 0.296 |
| ABI1-TSV-5 | 1.472 | 0.225 | 1.472 | 0.225 | 1.142 | 0.215 | 2.876 | 0.090 | 0.149 | 0.700 | 0.639 | 0.424 | 0.341 | 0.559 | 0.298 | 0.585 |
| ABI1-TSV-6 | 1.192 | 0.275 | 1.192 | 0.275 | 0.024 | 0.876 | 0.235 | 0.628 | 0.016 | 0.898 | 0.092 | 0.761 | 0.594 | 0.441 | 0.067 | 0.796 |
| ABI1-TSV-7 | 1.415 | 0.234 | 1.415 | 0.234 | 0.010 | 0.921 | 0.006 | 0.940 | 0.708 | 0.400 | 0.151 | 0.698 | 1.369 | 0.242 | 0.272 | 0.602 |
| ABI1-TSV-8 | 1.857 | 0.173 | 1.857 | 0.173 | 0.864 | 0.353 | 1.213 | 0.271 | 0.026 | 0.871 | 1.684 | 0.194 | 0.058 | 0.810 | 0.067 | 0.796 |
| ABI1-TSV-9 | 0.155 | 0.694 | 0.254 | 0.615 | 0.447 | 0.504 | 0.025 | 0.875 | 0.268 | 0.604 | 0.004 | 0.951 | 0.519 | 0.471 | 0.112 | 0.738 |
| ABI1-TSV-10 | 0.485 | 0.486 | 0.034 | 0.854 | 0.126 | 0.722 | 0.044 | 0.834 | 1.012 | 0.314 | 0.167 | 0.682 | 0.981 | 0.322 | 2.211 | 0.137 |
| ABI1-TSV-11 | 0.377 | 0.539 | 0.004 | 0.952 | 1.262 | 0.261 | 1.473 | 0.225 | 4.099 | 0.043* | 1.163 | 0.281 | 0.543 | 0.461 | 0.319 | 0.572 |
| ABI1-TSV-12 | 1.755 | 0.185 | 0.800 | 0.371 | 0.770 | 0.380 | 0.067 | 0.796 | 0.880 | 0.348 | 0.140 | 0.709 | 0.335 | 0.563 | 0.359 | 0.549 |
| Cancer species | KIRC | KIRC | KIRP | KIRP | LIHC | LIHC | LUAD | LUAD | ||||||||
|---|---|---|---|---|---|---|---|---|---|---|---|---|---|---|---|---|
| Prognosis | OS | DFS | OS | DFS | OS | DFS | OS | DFS | ||||||||
| ABI1 related factors |
|
|
|
|
|
|
|
|
|
|
|
|
|
|
| p |
| ABI1-Total mRNA | 1.299 | 0.254 | 3.332 | 0.068 | 5.404 | 0.020* | 4.306 | 0.038* | 2.522 | 0.112 | 2.205 | 0.138 | 5.598 | 0.018* | 0.028 | 0.868 |
| ABI1-TSV-1 | 5,876 | 0.015** | 1.172 | 0.279 | 0.369 | 0.544 | 0.058 | 0.810 | 3.524 | 0.060 | 1.383 | 0.240 | 3.211 | 0.062 | 0.009 | 0.923 |
| ABI1-TSV-2 | 1.287 | 0.257 | 0.003 | 0.956 | 2.729 | 0.099 | 0.009 | 0.923 | 2.033 | 0.154 | 0.276 | 0.600 | 0.339 | 0.560 | 0.074 | 0.785 |
| ABI1-TSV-3 | 0.364 | 0.546 | 0.003 | 0.956 | 0.687 | 0.407 | 0.008 | 0.927 | 0.605 | 0.437 | 3.375 | 0.066 | 7.723 | 0.005** | 0.008 | 0.927 |
| ABI1-TSV-4 | 9.790 | 0.002** | 0.107 | 0.743 | 0.098 | 0.754 | 0.820 | 0.365 | 3.914 | 0.048* | 0.375 | 0.540 | 1.523 | 0.217 | 0.684 | 0.408 |
| ABI1-TSV-5 | 0.017 | 0.897 | 0.679 | 0.410 | 1.880 | 0.17 | 3.510 | 0.061 | 0.063 | 0.802 | 0.000 | 0.988 | 0.873 | 0.350 | 2.430 | 0.119 |
| ABI1-TSV-6 | 0.659 | 0.417 | 0.237 | 0.627 | 1.940 | 0.164 | 0.109 | 0.741 | 1.442 | 0.230 | 0.981 | 0.322 | 0.416 | 0.519 | 0.017 | 0.895 |
| ABI1-TSV-7 | 0.002 | 0.965 | 0.027 | 0.869 | 0.001 | 0.976 | 1.730 | 0.188 | 1.155 | 0.283 | 0.626 | 0.429 | 0.244 | 0.621 | 0.131 | 0.717 |
| ABI1-TSV-8 | 8.664 | 0.003** | 0.560 | 0.454 | 4.135 | 0.042* | 0.791 | 0.374 | 1.626 | 0.202 | 0.905 | 0.341 | 1.021 | 0.312 | 0.147 | 0.701 |
| ABI1-TSV-9 | 0.072 | 0.788 | 0.118 | 0.731 | 0.017 | 0.896 | 0.695 | 0.404 | 0.007 | 0.934 | 2.939 | 0.086 | 0.553 | 0.457 | 1.339 | 0.247 |
| ABI1-TSV-10 | 0.011 | 0.915 | 0.353 | 0.552 | 0.400 | 0.527 | 1.105 | 0.293 | 0.121 | 0.728 | 0.592 | 0.442 | 0.508 | 0.476 | 0.763 | 0.382 |
| ABI1-TSV-11 | 0.072 | 0.788 | 0.118 | 0.731 | 0.305 | 0.581 | 0.002 | 0.964 | 0.004 | 0.953 | 0.009 | 0.926 | 0.049 | 0.825 | 1.069 | 0.301 |
| ABI1-TSV-12 | 2.024 | 0.155 | 0.107 | 0.744 | 0.049 | 0.824 | 10.635 | 0.001* | 0.846 | 0.358 | 2.939 | 0.086 | 0.025 | 0.875 | 0.675 | 0.411 |
*Poor prognosis; **Good prognosis.
Table 3
The correlation between ABI1 exons and OS/DFS in selected tumors
| Cancer species | BLCA | BLCA | BRAC | BRAC | ESCA | ESCA | KICH | KICH | ||||||||
|---|---|---|---|---|---|---|---|---|---|---|---|---|---|---|---|---|
| Prognosis | OS | DFS | OS | DFS | OS | DFS | OS | DFS | ||||||||
| ABI1 related factors |
|
|
|
|
|
|
|
|
|
|
|
|
|
|
|
|
| ABI1-Exon-1 | 8.131 | 0.004* | 1.612 | 0.204 | 0.201 | 0.654 | 0.053 | 0.818 | 1.327 | 0.249 | 0.022 | 0.882 | 7.700 | 0.006* | 0.723 | 0.395 |
| ABI1-Exon-2 | 0.169 | 0.681 | 0.184 | 0.668 | 0.006 | 0.940 | 1.121 | 0.290 | 0.620 | 0.431 | 2.422 | 0.431 | 0.341 | 0.559 | 0.298 | 0.585 |
| ABI1-Exon-3 | 6.584 | 0.010* | 1.658 | 0.198 | 0.169 | 0.681 | 0.000 | 0.998 | 4.028 | 0.045** | 0.097 | 0.756 | 7.524 | 0.006* | 0.813 | 0.367 |
| ABI1-Exon-4 | 6.981 | 0.008* | 3.327 | 0.068 | 1.338 | 0.247 | 0.015 | 0.903 | 5.495 | 0.019** | 0.004 | 0.953 | 8.456 | 0.004* | 0.723 | 0.395 |
| ABI1-Exon-5 | 3.772 | 0.052 | 3.278 | 0.070 | 0.016 | 0.900 | 0.000 | 0.991 | 2.459 | 0.117 | 10.216 | 0.001* | 1.396 | 0.237 | 0.294 | 0.587 |
| ABI1-Exon-7 | 6.292 | 0.012* | 4.002 | 0.045* | 1.124 | 0.289 | 0.469 | 0.494 | 1.893 | 0.169 | 0.097 | 0.756 | 4.313 | 0.038* | 0.380 | 0.538 |
| ABI1-Exon-8 | 7.470 | 0.006* | 5.398 | 0.020* | 0.884 | 0.357 | 0.177 | 0.674 | 2.522 | 0.112 | 0.004 | 0.932 | 4.060 | 0.044* | 0.174 | 0.677 |
| ABI1-Exon-9 | 10.531 | 0.001* | 4.323 | 0.038* | 0.733 | 0.392 | 0.017 | 0.896 | 1.813 | 0.178 | 0.007 | 0.932 | 8.073 | 0.004* | 0.216 | 0.642 |
| ABI1-Exon-10 | 1.503 | 0.220 | 9.216 | 0.002* | 1.534 | 0.216 | 0.081 | 0.896 | 0.351 | 0.554 | 0.104 | 0.747 | 0.514 | 0.474 | 0.654 | 0.419 |
| ABI1-Exon-11.1-11.2 | 4.661 | 0.031* | 2.541 | 0.111 | 1.299 | 0.216 | 0.081 | 0.776 | 9.389 | 0.002** | 0.001 | 0.980 | 3.750 | 0.053* | 0.095 | 0.758 |
| ABI1-Exon-12 | 7.344 | 0.007* | 5.286 | 0.021* | 1.410 | 0.235 | 1.148 | 0.284 | 3.618 | 0.057 | 0.140 | 0.708 | 2.034 | 0.154 | 1.092 | 0.296 |
| ABI1-Exon-13 | 2.084 | 0.149 | 1.623 | 0.203 | 1.957 | 0.162 | 0.016 | 0.900 | 1,317 | 0.251 | 0.168 | 0.682 | 1.349 | 0.246 | 0.216 | 0.642 |
| ABI1-Exon-14 | 1.252 | 0.263 | 0.234 | 0.629 | 2.411 | 0.121 | 0.129 | 0.719 | 0.859 | 0.354 | 0.013 | 0.909 | 1.453 | 0.228 | 2.184 | 0.139 |
| Cancer species | KIRC | KIRC | KIRP | KIRP | LIHC | LIHC | LUAD | LUAD | ||||||||
|---|---|---|---|---|---|---|---|---|---|---|---|---|---|---|---|---|
| Prognosis | OS | DFS | OS | DFS | OS | DFS | OS | DFS | ||||||||
| ABI1 related factors |
|
|
|
|
|
|
|
|
|
|
|
|
|
|
|
|
| ABI1-Exon-1 | 17.738 | 0.000** | 0.001 | 0.972 | 1.267 | 0.260 | 5.427 | 0.020* | 0.274 | 0.600 | 0.590 | 0.443 | 2.468 | 0.116 | 0.592 | 0.442 |
| ABI1-Exon-2 | 3.149 | 0.076 | 0.128 | 0.720 | 0.057 | 0.811 | 1.023 | 0.312 | 0.173 | 0.678 | 0.066 | 0.797 | 0.056 | 0.812 | 1.636 | 0.201 |
| ABI1-Exon-3 | 12.658 | 0.000** | 0.515 | 0.473 | 1.016 | 0.313 | 6.197 | 0.013* | 5.776 | 0.016* | 3.344 | 0.067 | 7.481 | 0.006* | 0.201 | 0.654 |
| ABI1-Exon-4 | 16.206 | 0.000** | 0.000 | 0.996 | 2.239 | 0.135 | 6.688 | 0.010* | 7.605 | 0.006* | 3.766 | 0.052* | 4.513 | 0.034* | 0.002 | 0.962 |
| ABI1-Exon-5 | 8.947 | 0.003** | 0.837 | 0.360 | 1.215 | 0.270 | 2.386 | 0.122 | 0.707 | 0.400 | 0.001 | 0.982 | 2.259 | 0.133 | 0.005 | 0.944 |
| ABI1-Exon-7 | 17.299 | 0.000** | 0.304 | 0.581 | 2.463 | 0.117 | 7.057 | 0.007* | 6.864 | 0.009* | 2.368 | 0.124 | 2.482 | 0.115 | 0.027 | 0.870 |
| ABI1-Exon-8 | 16.115 | 0.000** | 0.002 | 0.967 | 2.468 | 0.116 | 5.012 | 0.024* | 5.900 | 0.015* | 3.697 | 0.055 | 6.814 | 0.009* | 0.002 | 0.968 |
| ABI1-Exon-9 | 18.230 | 0.000** | 0.001 | 0.979 | 1.383 | 0.240 | 7.045 | 0.008* | 7.888 | 0.005* | 4.423 | 0.035* | 5.540 | 0.019* | 0.022 | 0.081 |
| ABI1-Exon-10 | 0.048 | 0.826 | 0.512 | 0.474 | 2.336 | 0.126 | 0.208 | 0.649 | 1.797 | 0.180 | 0.641 | 0.423 | 4.343 | 0.037** | 1.937 | 0.164 |
| ABI1-Exon-11.1-11.2 | 17.825 | 0.000** | 0.000 | 0.996 | 0.972 | 0.324 | 6.845 | 0.009* | 10.325 | 0.001* | 5.750 | 0.016* | 1.240 | 0.265 | 1.488 | 0.233 |
| ABI1-Exon-12 | 19.471 | 0.000** | 0.067 | 0.796 | 1.326 | 0.250 | 4.921 | 0.021* | 8.555 | 0.003* | 2.950 | 0.086 | 1.573 | 0.210 | 0.255 | 0.613 |
| ABI1-Exon-13 | 7.862 | 0.005** | 1.618 | 0.203 | 3.210 | 0.073 | 3.365 | 0.067 | 15.847 | 0.000* | 5.607 | 0.018* | 1.980 | 0.159 | 0.024 | 0.878 |
| ABI1-Exon-14 | 1.725 | 0.189 | 1.200 | 0.273 | 0.253 | 0.615 | 1.526 | 0.217 | 12.464 | 0.000* | 3.924 | 0.048* | 3.792 | 0.052* | 0.802 | 0.370 |
*Poor prognosis; **Good prognosis.
Table 4
The correlation between ABI1 Constitutive EEJs and OS/DFS in selected tumors
| Cancer species | BLCA | BLCA | BRAC | BRAC | ESCA | ESCA | KICH | KICH | ||||||||
|---|---|---|---|---|---|---|---|---|---|---|---|---|---|---|---|---|
| Prognosis | OS | DFS | OS | DFS | OS | DFS | OS | DFS | ||||||||
| ABI1 related factors |
|
|
|
|
|
|
|
|
|
|
|
|
|
|
|
|
| ABI1-EEJ-2-1 | 0.465 | 0.495 | 0.581 | 0.446 | 0.126 | 0.723 | 0.403 | 0.525 | 0.031 | 0.861 | 2.094 | 0.148 |
|
|
|
|
| ABI1-EEJ-3-1 | 0.000 | 0.999 | 1.052 | 0.305 | 0.164 | 0.685 | 0.033 | 0.857 | 1.573 | 0.210 | 0.807 | 0.369 | 0.021 | 0.886 | 0.350 | 0.554 |
| ABI1-EEJ-3-2 | 1.925 | 0.165 | 0.355 | 0.552 | 0.016 | 0.898 | 1.702 | 0.192 | 0.715 | 0.398 | 0.350 | 0.554 | 0.107 | 0.743 | 0.045 | 0.831 |
| ABI1-EEJ-4-3 | 0.016 | 0.899 | 2.204 | 0.138 | 0.097 | 0.755 | 0.515 | 0.473 | 1.213 | 0.271 | 0.012 | 0.912 | 2.263 | 0.132 | 0.045 | 0.831 |
| ABI1-EEJ-5-4 | 1.072 | 0.300 | 0.752 | 0.386 | 0.073 | 0.787 | 0.021 | 0.885 | 1.047 | 0.306 | 0.562 | 0.454 | 0.681 | 0.409 | 0.350 | 0.554 |
| ABI1-EEJ-7-3 | 0.881 | 0.348 | 1.838 | 0.175 | 0.499 | 0.480 | 0.600 | 0.438 | 2.606 | 0.106 | 0.073 | 0.786 | 4.521 | 0.033* | 1.002 | 0.317 |
| ABI1-EEJ-7-4 | 0.949 | 0.330 | 1.797 | 0.180 | 1.367 | 0.242 | 0.629 | 0.428 | 0.007 | 0.935 | 0.257 | 0.612 | 3.813 | 0.051* | 2.184 | 0.139 |
| ABI1-EEJ-7-5 | 0.332 | 0.565 | 1.712 | 0.191 | 0.448 | 0.503 | 0.196 | 0.658 | 0.696 | 0.404 | 1.081 | 0.298 | 0.006 | 0.938 | 0.216 | 0.642 |
| ABI1-EEJ-8-7 | 1.429 | 0.232 | 0.227 | 0.634 | 0.010 | 0.922 | 0.559 | 0.455 | 0.441 | 0.507 | 3.527 | 0.060 | 2.218 | 0.136 | 0.095 | 0.758 |
| ABI1-EEJ-9-8 | 1.723 | 0.189 | 2.742 | 0.098 | 1.565 | 0.211 | 7.619 | 0.006* | 0.343 | 0.558 | 0.008 | 0.928 | 0.003 | 0.958 | 0.002 | 0.963 |
| ABI1-EEJ-10-9 | 1.763 | 0.184 | 0.096 | 0.757 | 0.757 | 0.384 | 0.013 | 0.911 | 0.000 | 0.997 | 0.023 | 0.881 |
|
|
|
|
| ABI1-EEJ-11.1-9 | 0.027 | 0.870 | 0.794 | 0.373 | 1.453 | 0.228 | 0.024 | 0.876 | 3.789 | 0.052 | 3.299 | 0.069 | 2.348 | 0.125 | 0.265 | 0.607 |
| ABI1-EEJ-11.2-9 | 4.014 | 0.045* | 0.016 | 0.900 | 3.803 | 0.051** | 0.035 | 0.851 | 1.591 | 0.207 | 0.120 | 0.729 | 0.606 | 0.436 | 1.948 | 0.265 |
| ABI1-EEJ-11.1-10 | 0.112 | 0.738 | 0.096 | 0.757 | 1.236 | 0.266 | 0.014 | 0.907 | 10.096 | 0.001* | 1.071 | 0.301 |
|
|
|
|
| ABI1-EEJ-12-9 | 0.198 | 0.656 | 0.067 | 0.796 | 1.364 | 0.243 | 1.264 | 0.261 | 0.436 | 0.509 | 0.189 | 0.664 | 1.202 | 0.273 | 0.112 | 0.738 |
| ABI1-EEJ-13-9 | 0.001 | 0.980 | 0.017 | 0.898 | 0.177 | 0.674 | 0.351 | 0.553 | 6.517 | 0.011* | 6.033 | 0.014* | 0.004 | 0.948 | 0.216 | 0.642 |
| ABI1-EEJ-12-11.2 | 0.090 | 0.764 | 1.512 | 0.219 | 3.519 | 0.061 | 0.044 | 0.833 | 6.331 | 0.012** | 3.413 | 0.065 | 0.051 | 0.821 | 1.815 | 0.178 |
| ABI1-EEJ-13-11.2 | 0.709 | 0.400 | 0.001 | 0.971 | 6.711 | 0.010** | 0.008 | 0.931 | 0.905 | 0.341 | 0.254 | 0.614 | 0.940 | 0.332 | 1.948 | 0.163 |
| ABI1-EEJ-13-12 | 1.374 | 0.241 | 0.021 | 0.884 | 0.703 | 0.402 | 2.012 | 0.156 | 6.060 | 0.014** | 4.149 | 0.042* | 0.037 | 0.848 | 0.022 | 0.881 |
| ABI1-EEJ-14-13 | 8.533 | 0.003** | 6.483 | 0.011** | 1.241 | 0.265 | 0.037 | 0.848 | 4.181 | 0.041* | 0.010 | 0.919 | 7.7000 | 0.006** | 0.000 | 0.987 |
|
Table 4, continued | ||||||||||||||||
| Cancer species | KIRC | KIRC | KIRP | KIRP | LIHC | LIHC | LUAD | LUAD | ||||||||
| Prognosis | OS | DFS | OS | DFS | OS | DFS | OS | DFS | ||||||||
| ABI1 related Factors |
|
|
|
|
|
|
|
|
|
|
|
|
|
|
|
|
| ABI1-EEJ-2-1 | 0.173 | 0.805 | 0.128 | 0.720 | 0.119 | 0.730 | 0.145 | 0.704 |
|
|
|
| 0.106 | 0.745 | 1.726 | 0.189 |
| ABI1-EEJ-3-1 | 11.303 | 0.001** | 0.055 | 0.814 | 0.232 | 0.630 | 1.284 | 0.257 | 4.113 | 0.043** | 0.068 | 0.795 | 4.537 | 0.033* | 1.407 | 0.236 |
| ABI1-EEJ-3-2 | 0.743 | 0.389 |
|
|
|
|
|
| 0.000 | 0.986 | 0.523 | 0.470 | 1.277 | 0.259 | 5.673 | 0.017* |
| ABI1-EEJ-4-3 | 1,414 | 0.234 | 0.046 | 0.830 | 1.428 | 0.232 | 0.014 | 0.906 | 0.036 | 0.850 | 0.490 | 0.484 | 3.846 | 0.050* | 2.674 | 0.102 |
| ABI1-EEJ-5-4 | 0.380 | 0.538 | 0.686 | 0.407 | 0.099 | 0.753 | 1.225 | 0.268 | 0.225 | 0.635 | 0.487 | 0.485 | 5.503 | 0.019** | 3.027 | 0.082 |
| ABI1-EEJ-7-3 | 3.692 | 0.055** | 1.052 | 0.305 | 0.000 | 0.985 | 3.492 | 0.062 | 3.894 | 0.048* | 0.196 | 0.658 | 0.018 | 0.893 | 1.149 | 0.284 |
| ABI1-EEJ-7-4 | 9.495 | 0.002** | 0.295 | 0.587 | 0.040 | 0.841 | 0.373 | 0.541 | 1.397 | 0.237 | 0.006 | 0.938 | 4.436 | 0.035* | 1.433 | 0.231 |
| ABI1-EEJ-7-5 | 1.399 | 0.237 | 0.632 | 0.427 | 0.318 | 0.573 | 2.864 | 0.091 | 0.152 | 0.696 | 0.081 | 0.776 | 7.743 | 0.005** | 0.030 | 0.862 |
| ABI1-EEJ-8-7 | 1.960 | 0.162 | 0.072 | 0.789 | 1.582 | 0.208 | 0.524 | 0.469 | 1.368 | 0.242 | 2.209 | 0.154 | 0.519 | 0.471 | 1.292 | 0.256 |
| ABI1-EEJ-9-8 | 0.029 | 0.864 | 0.103 | 0.748 | 0.917 | 0.338 | 0.280 | 0.597 | 2.784 | 0.095 | 2.730 | 0.098 | 0.249 | 0.618 | 0.853 | 0.356 |
| ABI1-EEJ-10-9 | 0.223 | 0.636 | 0.568 | 0.451 | 25.245 | 0.000* | 6.038 | 0.014* | 0.363 | 0.547 | 0.438 | 0.508 | 2.048 | 0.152 | 2.545 | 0.111 |
| ABI1-EEJ-11.1-9 | 1.612 | 0.204 | 0.160 | 0.689 | 0.316 | 0.574 | 1.662 | 0.197 | 3.459 | 0.063 | 0.582 | 0.446 | 0.951 | 0.329 | 0.003 | 0.960 |
| ABI1-EEJ-11.2-9 | 0.364 | 0.546 | 1.124 | 0.289 | 2.287 | 0.130 | 0.035 | 0.851 | 2.298 | 0.130 | 6.603 | 0.012* | 1.922 | 0.166 | 1.965 | 0.161 |
| ABI1-EEJ-11.1-10 | 0.713 | 0.398 | 0.433 | 0.510 |
|
|
|
| 0.169 | 0.681 | 23.823 | 0.000* | 0.274 | 0.600 |
|
|
| ABI1-EEJ-12-9 | 1.967 | 0.161 | 1.013 | 0.314 | 0.065 | 0.798 | 0.752 | 0.386 | 0.008 | 0.928 | 1.556 | 0.212 | 2.677 | 0.102 | 0.803 | 0.370 |
| ABI1-EEJ-13-9 | 0.795 | 0.372 | 0.682 | 0.409 | 0.127 | 0.721 | 0.229 | 0.632 | 0.328 | 0.567 | 3.135 | 0.077 | 0.034 | 0.854 | 0.619 | 0.431 |
| ABI1-EEJ-12-11.2 | 0.027 | 0.871 | 0.704 | 0.401 | 0.003 | 0.954 | 2.510 | 0.113 | 3.343 | 0.068 | 0.077 | 0.781 | 1.962 | 0.161 | 0.005 | 0.942 |
| ABI1-EEJ-13-11.2 | 0.018 | 0.895 | 0.947 | 0.331 | 0.355 | 0.551 | 0.013 | 0.910 | 0.131 | 0.718 | 1.494 | 0.222 | 7.648 | 0.006** | 2.486 | 0.115 |
| ABI1-EEJ-13-12 | 0.343 | 0.558 | 0.450 | 0.502 | 0.186 | 0.666 | 0.129 | 0.719 | 1.360 | 0.244 | 1.372 | 0.241 | 4.707 | 0.030* | 0.275 | 0.600 |
| ABI1-EEJ-14-13 | 9.132 | 0.003* | 0.042 | 0.838 | 0.167 | 0.682 | 0.235 | 0.628 | 0.500 | 0.480 | 0.322 | 0.570 | 2.159 | 0.142 | 0.245 | 0.621 |
*Poor prognosis; **Good prognosis.
2.2Baseline analysis and cancer type selection
As Tables 2, 3 and 4 shows, after the Kaplan–Meier analysis, cancer types with at least two of T-, N-, M-,and/or clinical stages significantly associated with overall survival (OS) and/or disease-free survival (DFS) were selected as candidate cancer types for subsequent analysis.
Identification of ABI1-related and novel metastatic and prognostic biomarkers in pan-cancer.
The standard median RNA-Seq by Expectation Maximization (RSEM) value (from the TSVdb database) was used as a cut-off value to define high or low expression levels of ABI1 total mRNA, TSVs (Table 2), and molecular constitutive elements exons (Table3) and EEJs (Table 4). Those prognosis-related ABI1 total mRNA, TSVs, and constitutive elements (exons and EEJs) screened in pan-cancer by the Kaplan–Meier analysis and the novel metastatic and prognostic biomarkers were identified by further chi-squared test (
2.3Identification of ABI1-related and independent prognostic biomarkers in pan-cancer
Combining the baseline and ABI1-related survival analyses, Cox regression analysis was further performed to identify the independent prognostic factors from ABI1 total mRNA, TSVs, and molecular constitutive elements (exons and EEJs) expressed in pan-cancer.
2.4Statistical analysis
Statistical analysis was performed using SPSS 20.0 (IBM, Chicago, IL, USA). Kaplan–Meier analysis and log-rank test were used for survival analysis to determine the prognostic values of ABI1 total mRNA, TSVs, and molecular constitutive elements (exons and EEJs) in various cancer types. Those that are significantly correlated with prognosis were selected for further chi-squared test (
3.Results
3.1Correlation between clinicopathological characteristics and overall survival (OS)/disease-free survival (DFS) in various tumors
As shown in Table 1, T-, N-, M-, and clinical stages represent the main characteristics of metastasis in tumor patients. Our analysis of the correlations of T-, N-, M-, and clinical stages with overall survival (OS) and/or disease-free survival (DFS) found that, among the 14 cancer types (BLCA, BRAC, CESE, ESCA, KICH, KIRC, KIRP, LIHC, LUSC, LUAD, OV, PAAD, PRAD, and STAD), only 8 have at least 2 of T-, N-, M-, and clinical stages closely related to OS and/or DFS. All eight cancer types (BLCA, BRAC, ESCA, KICH, KIRC, KIRP, LIHC, and LUAD) were selected to perform subsequent screening and identification of prognosis-related ABI1 total mRNA, TSVs, exons, and EEJs.
3.2Correlations of ABI1 total mRNA, TSVs, exon, and EEJs expression levels with overall survival (OS)/disease-free survival (DFS) in eight selected cancers
As shown in Tables 2, 3 and 4, with regard to cancer types, we screened 14, 3, 11, 10, 17, 12, 13, and 15 ABI1 total mRNA, TSVs, exons, and EEJs closely related to OS and/or DFS in BLCA, BRAC, ESCA, KICH, KIRC, KIRP, LIHC, and LUAD, respectively.
In BLCA, KICH, and LIHC, with the exceptions of upregulated expression of ABI1-EEJ-14-13 (BLCA and KICH) and ABI-EEJ-3-1 (LIHC) indicating a good prognosis, upregulated expression of the other 13 (BLCA), 9 (KICH), and 12 (LIHC) ABI1-related factors indicated a poor prognosis. Meanwhile, in KIRC, with the exception that the upregulated expression of ABI1-EEJ-14-13 indicated a poor prognosis, the upregulated expression of all of the 16 ABI1-related factors indicated a good prognosis.
In BRAC, patients with high expression of ABI1-EEJ-11.2-9 and 13-11.2 had long OS, and patients with high expression of ABI1-EEJ-9-8 had short DFS. In ESCA, the high expression of ABI1-TSV-3, -11, ABI1-EEJ-11.1-10, -13-9, -14-13 predicted a poor prognosis, while the high expression of ABI1-TSV-4, ABI1-exon-3, -4, -11, ABI1-EEJ-12-11.2 and -13-12 predicted a good prognosis. In LUAD, patients with high expression of ABI1 total mRNA, ABI1-exon-3, -4, -8, -9, -14, ABI1-EEJ-3-1, -4-3, -7-4, and 13-12 had long OS, while patients with high expression of ABI1-TSV-3, ABI1-exon-10, ABI1-EEJ-5-4, -7-5, and -13-11.2 had short OS.
In KIRP, the upregulated expression of all of 12 ABI1-related factors was associated with poor prognosis, of which 2 were associated with short OS and 10 with short DFS.
From the ABI1-related factors studied, the prognosis of KIRP and LUAD patients with high expression of ABI1 total mRNA is poor. No prognosis-related ABI1-TSVs were screened in patients with BRAC and KICH. Upregulated ABI1-TSV-1 expression is involved in the poor prognosis of patients with BLCA. High expression of ABI1-TSV-3 is related to the poor prognosis of patients with BLCA and ESCA, but to the good prognosis of patients with LUAD. High expression of ABI1-TSV-4 is related to the poor prognosis of patients with BLCA and LIHC, but the good prognosis of patients with ESCA and LIHC. High expression of ABI1-TSV-8 is related to the poor prognosis of patients with KIRP, but the good prognosis of patients with KIRC. Upregulated ABI1-TSV-11 expression is involved in the poor prognosis of patients with ESCA.
No prognosis-related ABI1-exons were screened in patients with BRAC and KIRP. High ABI1-exon-1 expression is related to the poor prognosis of patients with BLCA and KICH, but the good prognosis of patients with KIRC. Upregulated expression of both ABI1-exon-3 and -4 is involved in the poor prognosis of patients with BLCA, KICH, LIHC, and LUAD, but in the good prognosis of patients with ESCA and KIRC. High ABI1-exon-5 expression is related to the good prognosis of patients with KIRC. High ABI1-exon-7 expression is related to the poor prognosis of patients with BLCA, KICH, and LIHC, but the good prognosis of patients with KIRC. High ABI1-exon-8 and -9 expression is involved in the poor prognosis of patients with BLCA, KICH, LIHC, and LUAD, but the good prognosis of patients with KIRP. High ABI1-exon-11 expression is involved in the poor prognosis of patients with BLCA, KICH, and LIHC, but the good prognosis of patients with ESCA and KIRP. High ABI1-exon-12 expression is involved in the poor prognosis of patients with BLCA and LIHC, but the good prognosis of patients with KIRC. High ABI1-exon-13 expression is involved in the poor prognosis of patients with LIHC, but the good prognosis of patients with KIRC. High ABI1-exon-14 expression is involved in the poor prognosis of patients with LIHC and LUAD.
Upregulated ABI1-EEJ-3-1 expression is related to shorter OS in LUAD, but longer OS in LIHC and KIRC. High expression of ABI1-EEJ-4-3 in patients with LUAD is associated with a shorter OS, while high ABI1-EEJ-5-4 and -7-5 are associated with longer OS. High ABI1-EEJ-7-3 and -7-4 expression is related to shorter OS in patients with LIHC and KICH but longer OS in patients with KIRC. ABI1-EEJ-10-9 upregulation is involved in poor prognosis in patients with KIRP and shorter DFS in patients with BRAC. ABI1-EEJ-11.1-10 is related to shorter OS in ESCA and DFS in LIHC. ABI1-EEJ-11.2-9 is related to shorter OS in BLCA and DFS in LIHC, but longer OS in BRAC. ABI1-EEJ-12-11.2 is associated with longer OS, while ABI1-EEJ-13-9 is associated with shorter OS in patients with ESCA. High ABI1-13-11.2 expression shows poor prognosis in patients with LUAD and good prognosis in patients with BRAC. ABI1-EEJ-13-12 is related to good prognosis in patients with ESCA. ABI1-EEJ-14-13 is associated with poor prognosis in patients with ESCA and KIRC, but good prognosis in patients with BLCA and KICH.
Table 5
Identification ABI1 TSV and molecular constitutive elements as metastatic and prognostic biomarkers in selected tumors
| Cancer types | ABI1 related factors | Statistics | T stage | N stage | M stage | Clinical stage | Statistics | T stage | N stage | M stage | Clinical stage |
|---|---|---|---|---|---|---|---|---|---|---|---|
| BLCA | ABI1-TSV-3* | 11.350 | 12.823 | 11.493 | 12.546 |
| 0.150 | 0.218 | 0.195 | 0.157 | |
|
| 0.045 | 0.021 | 0.005 | 0.004 |
| 0.054 | 0.005 | 0.057 | 0.003 | ||
| ABI1-Exon-1* | 6.272 | 4.162 | 3.579 | 11.404 |
| 0.123 | 0.123 | 0.176 | 0.150 | ||
|
| 0.281 | 0.516 | 0.192 | 0.007 |
| 0.115 | 0.115 | 0.086 | 0.005 | ||
| ABI1-Exon-9 | 3.739 | 6.134 | 4.365 | 7.673 |
| 0.053 | 0.127 | 0.172 | 0.103 | ||
|
| 0.588 | 0.276 | 0.137 | 0.037 |
| 0.497 | 0.105 | 0.093 | 0.055 | ||
| ESCA | ABI1-TSV-11 | 12.153 | 4.448 | 8.106 | 17.878 |
| 0.120 | 0.114 | 0.037 | ||
|
| 0.025 | 0.345 | 0.016 | 0.001 |
| 0.157 | 0.112 | 0.178 | 0.625 | ||
| ABI1-Exon-5 | 10.878 | 3.488 | 8.229 | 8.225 |
| 0.115 | 0.121 | ||||
|
| 0.021 | 0.470 | 0.015 | 0.077 |
| 0.120 | 0.658 | 0.992 | 0.108 | ||
| ABI1-EEJ-13-9* | 15.765 | 19.607 | 8.690 | 17.933 |
| 0.233 | 0.000 | ||||
|
| 0.005 | 0.000 | 0.012 | 0.001 |
| 0.135 | 0.002 | 0.496 | 0.998 | ||
| ABI1-EEJ-12-11** | 22.056 | 15.725 | 15.038 | 19.803 |
| 0.054 | |||||
|
| 0.000 | 0.003 | 0.000 | 0.000 |
| 0.462 | 0.006 | 0.137 | 0.191 | ||
| ABI1-EEJ-13-12** | 14.556 | 15.124 | 14.916 | 18.329 |
| 0.085 | |||||
|
| 0.009 | 0.004 | 0.000 | 0.001 |
| 0.251 | 0.002 | 0.033 | 0.045 | ||
| KICH | ABI1-Exon-7* | 6.845 | 9.056 | 1.357 | 9.040 |
| 0.385 | 0.036 | |||
|
| 0.061 | 0.029 | 0.507 | 0.025 |
| 0.119 | 0.014 | 0.836 | 0.167 | ||
| ABI1-EEJ-14-13** | 3.930 | 4.861 | 3.357 | 9.796 |
| 0.110 | 0.076 | ||||
|
| 0.226 | 0.182 | 0.187 | 0.008 |
| 0.363 | 0.033 | 0.118 | 0.528 | ||
| KIRC | ABI1-TSV-1** | 10.164 | 0.826 | 1.264 | 14.531 |
| |||||
|
| 0.017 | 0.662 | 0.532 | 0.002 |
| 0.049 | 0.533 | 0.275 | 0.037 | ||
| ABI1-TSV-4** | 14.929 | 0.033 | 3.003 | 12.122 |
| ||||||
|
| 0.002 | 0.984 | 0.223 | 0.007 |
| 0.000 | 0.973 | 0.215 | 0.002 | ||
| ABI1-Exon-1** |
| 11.334 | 1.679 | 8.442 | 10.628 |
| |||||
|
| 0.010 | 0.432 | 0.015 | 0.014 |
| 0.002 | 0.469 | 0.107 | 0.002 | ||
| ABI1-Exon-3** | 9.247 | 1.277 | 9.286 | 9.377 |
| ||||||
|
| 0.026 | 0.528 | 0.010 | 0.025 |
| 0.005 | 0.491 | 0.248 | 0.006 | ||
| ABI1-Exon-4** | 13.094 | 1.277 | 16.342 | 14.227 |
| ||||||
|
| 0.004 | 0.528 | 0.000 | 0.003 |
| 0.001 | 0.491 | 0.015 | 0.000 | ||
| ABI1-Exon-7** | 9.294 | 0.943 | 16.151 | 8.071 |
| ||||||
|
| 0.026 | 0.624 | 0.000 | 0.045 |
| 0.005 | 0.513 | 0.083 | 0.005 | ||
| ABI1-Exon-8** | 8.111 | 1.679 | 14.119 | 7.524 |
| ||||||
|
| 0.044 | 0.432 | 0.001 | 0.057 |
| 0.009 | 0.469 | 0.324 | 0.014 | ||
| ABI1-Exon-11** | 8.090 | 2.681 | 6.528 | 9.092 |
| ||||||
|
| 0.044 | 0.262 | 0.038 | 0.028 |
| 0.006 | 0.427 | 0.116 | 0.007 | ||
| ABI1-Exon-12** | 19.528 | 0.268 | 11.752 | 20.087 |
| ||||||
|
| 0.000 | 0.875 | 0.003 | 0.000 |
| 0.000 | 0.606 | 0.003 | 0.000 | ||
| ABI1-Exon-13 | 1.548 | 0.831 | 8.118 | 2.338 |
| ||||||
|
| 0.671 | 0.660 | 0.017 | 0.505 |
| 0.376 | 0.863 | 0.684 | 0.487 | ||
| ABI1-EEJ-3-1** | 6.509 | 0.657 | 8.442 | 6.812 |
| ||||||
|
| 0.089 | 0.720 | 0.015 | 0.078 |
| 0.012 | 0.705 | 0.107 | 0.009 | ||
| ABI1-EEJ-14-13* | 18.349 | 1.585 | 12.579 | 15.605 |
| 0.141 | 0.074 | 0.099 | 0.162 | ||
|
| 0.000 | 0.453 | 0.002 | 0.001 |
| 0.000 | 0.256 | 0.032 | 0.000 |
The correlation between ABI1 TSVs, Constitutive exons and EEJs and T, N, M or Clinical Stage in selected tumors. *poor prognosis; **good prognosis.
3.3TCGA and TSVdb pan-cancer transcriptomic data analysis of ABI1 TSVs, exons, and EEJs identifies novel cancer metastatic markers (Table 5)
To screen and identify ABI1-related factors related to tumor metastasis, we used chi-squared test and Kendall’s tau statistic to establish the correlations of prognosis-related ABI1 total mRNA, ABI1-TSV, ABI1-exon, and ABI1-EEJ expression levels with T-, N-, M-, and clinical stages.
As shown in Table 5, prognosis- and metastasis-related ABI1 factors were screened in only 4 (BLCA, ESCA, KICH, and KIRC) of the 8 selected cancer types. In BLCA, the high expression of ABI1-TSV-3 and ABI1-exon-1 was not only positively correlated with metastasis, but also a key factor associated with poor prognosis. In ESCA, the high expression of ABI1-EEJ-13-9 is a poor prognostic factor positively related to metastasis, while ABI1-EEJ-12-11 and ABI1-EEJ-13-12 are good prognostic factors negatively related to metastasis. In KICH, the high expression of ABI1-exon-7 is a poor prognostic factor positively related to metastasis, while ABI1-EEJ-14-13 is a good prognostic factor negatively related to metastasis. Except for ABI1-EEJ-14-13, the high expression of 10 other ABI1 factors was negatively correlated with metastasis, which was a key factor associated with the good prognosis of KIRC.
Table 6
Identification ABI1 molecular constitutive elements as independent prognostic factors in selected tumors
| Cancer species | Independent risk factors | Prognosis | HR | Cancer species | Independent risk factors | Prognosis | HR |
|---|---|---|---|---|---|---|---|
| BLCA | ABI1-Exon-3 | OS* | HR | BLCA | ABI1-Exon-10 | DFS* | HR |
| BRAC | ABI1-EEJ-11.2-9 | OS** | HR | BRAC | ABI1-EEJ 9-8 | DFS* | HR |
| ABI1-EEJ-13-11.2 | OS** | HR | |||||
| ESCA | ABI1-Exon-11.1-11.2 | OS** | HR | ESCA | ABI1-Exon-5 | DFS* | HR |
| ABI1-EEJ-11.1-10 | OS* | HR | |||||
| KIRC | ABI1-Exon-5 | OS** | HR | KIRC |
|
|
|
| ABI1-Exon-9 | OS** | HR | |||||
| ABI1-Exon-11.1-11.2 | OS** | HR | |||||
| KIRP |
|
|
| KIRP | ABI1-TSV-12 | DFS* | HR |
| ABI1-Exon-7 | DFS* | HR | |||||
| LIHC | ABI1-Exon-14 | OS* | HR | LIHC | ABI1-Exon-13 | DFS* | HR |
| ABI1-Exon-14 | DFS* | HR | |||||
| ABI1-EEJ-11.2-9 | DFS* | HR | |||||
| LUAD | ABI1-Exon-8 | OS* | HR | LUAD |
|
|
|
| ABI1-EEJ-3-1 | OS* | HR | |||||
| ABI1-EEJ-4-3 | OS* | HR | |||||
| ABI1-EEJ-13-11.2 | OS** | HR |
*Poor prognosis; **Good prognosis.
3.4TCGA and TSVdb pan-cancer transcriptomic data analysis of ABI1 TSVs, exons, and EEJs identifies novel and independent prognostic markers (Table 6)
To screen and identify ABI1-related factors that can act as independent prognostic markers, we performed Cox proportional hazards regression analysis of ABI1 TSVs, exons, and EEJs. As shown in Table 6, a total of 13 ABI1-related and independent OS prognostic factors were identified from 7 cancer types (BLCA, BRAC, ESCA, KIRC, KIRP, LIHC, and LUAD) and eight ABI1-related and independent DFS prognostic factors were identified from 5 cancer types (BLCA, BRCA, ESCA, KIRP, and LIHC).
4.Discussion
Clinical, in vitro, and in vivo studies have shown that the abnormal expression and phosphorylation of ABI1 play an important role in the occurrence and progression of many tumors [9, 10, 11, 12, 13, 14, 15, 16, 17, 18, 19, 20, 21, 22, 23, 24, 25, 26]. ABI1 functions as an oncogene in colorectal cancer, breast cancer, liver cancer, pancreatic cancer, and ovarian cancer, and patients suffering from these conditions with high ABI1 expression have a high rate of metastasis and a poor prognosis [10, 11, 12, 13, 14, 15, 16, 17, 18, 21, 22, 23]. Meanwhile, it also functions as an anti-oncogene in gastric cancer and prostate cancer, so patients suffering from these conditions with high ABI1 expression have a low rate of metastasis and a good prognosis [9, 19, 20]. The mechanism by which ABI1 can form complexes with a variety of proteins is insufficient to explain these contradictory roles in different tumors, while the fact that ABI1 encodes multiple transcript variants (protein isoforms) may be important for explaining this. It is also an important link towards the future development of ABI1-based tumor diagnosis and treatment methods.
Here, we obtained clinical and RNA sequencing data from TCGA and TSVdb databases, and identified for the first time that the elevated expression of ABI1 total mRNA, TSVs, and molecular constitutive elements (exons and EEJs) was related to metastasis and prognosis, and their respective functions as independent prognostic factors in all eight selected cancer types (Tables 1 and 2). Among the eight selected cancer types, ABI1-related factors (total mRNA, TSVs, exons, and EEJs) have three different patterns of correlation with prognosis. In BLCA, KICH, KIRP, and LIHC, ABI1-related factors are associated with a poor prognosis in terms of OS, KIRC and BRAC are mainly associated with a good prognosis in terms of OS, while in ESCA and LUAD, these two correlation patterns coexist; this resembles our previous results on colorectal cancer [25, 26] and unpublished data]. This result for LIHC is consistent with that reported previously [12], while the result for BRAC is inconsistent [13]. This discrepancy may be mainly due to the difference between protein-based and nucleic acid-based detections, or because there is no further pathological grouping of BRAC.
The above three patterns of correlations between ABI1-related factors and prognosis suggest the need to use different research strategies to study the molecular mechanisms and application potential of ABI1 in various cancers. Regarding the first and second patterns, we need to know more about the mechanism regulating its expression and the types of protein complexes that it forms (WAVE2, NWASP, or EPS8 complex). For the third pattern, we also need to consider the synergy and/or antagonism of ABI1-TSVs and molecular constitutive elements, respectively.
Metastasis is the key factor leading to poor cancer prognosis, with which ABI1 is closely related. We analyzed the correlation between 35 ABI1-related prognostic factors (identified from eight tumor types) and metastasis-related indicators, which identified 14 metastatic and prognostic biomarkers from four cancer types. These results provide good reference data for clarifying the mechanism by which ABI1 affects tumor metastasis and developing targeted therapy for tumor metastasis from different perspectives. In BLCA, we can focus on the structure of ABI-TSV-3 and ABI1-exon-1 to explore the molecular mechanisms by which they affect metastasis and prognosis. In ESCA, based on the structural characteristics of EEJs (such as ABI1-EEJ-13-9), we can establish specific nested RT-PCR and/or rolling-circle amplification (RCA) technology for the evaluation of clinical metastasis and prognosis [29]. Based on the EEJ splicing pattern, we can also screen the target exon-skipping and exon-inclusion SSO (splicing switching oligonucleotides) [30] and minigene technology [31] for specific intervention in the splicing pattern of EEJ, so as to achieve the purpose of treatment.
As Table 6 shows, we identified 21 ABI1-related independent prognostic biomarkers, of which 13 OS-related biomarkers were from 6 cancer types and 8 DFS-related biomarkers were from 5 cancer types. Like the above metastatic and prognostic markers, most of them are categorized as markers expressed at exon [32] and/or EEJ levels. This also means that the expression of ABI1 total mRNA, TSVs, exons, and EEJs has different values for understanding the molecular mechanism by which ABI1 acts in tumors and developing ABI1-based diagnostic and therapeutic methods.
Taking the findings of this study together, using TCGA and TSVdb RNA-seq data, we systematically analyzed the correlations of the expression levels of ABI1 total mRNA, TSVs, exons, and EEJs with tumorigenesis and progression in many cancer types. We found that ABI1-TSVs and their molecular components (exons and EEJs) have significant specificity depending on the cancer type, which provides clinical data support for the accurate diagnosis and treatment of various cancer types based on ABI1. At the same time, it further proves that the ABI1 splicing mechanism is the key mechanism affecting the occurrence and development of various cancer types, in addition to abnormal expression and phosphorylation. The establishment of a complete set of research models for the screening, functional and mechanistic analysis, detection, and targeting of ABI1 TSVs and molecular components provides a good reference for research on such TSVs. At the same time, the establishment of research models based on ABI1-TSVs and molecular constitutive elements is also of great value for research on other gene TSVs.
This study is still limited to a preliminary analysis of bioinformatic data of ABI1-TSVs and molecular constitutive elements (exons and EEJs). In future study, the obtained results need to be further verified, in combination with in vivo/in vitro experiments and clinical studies.
Abbreviation
Bladder urothelial carcinoma: BLCA
Breast invasive carcinoma: BRCA
Cervical squamous cell carcinoma: CESC
Esophageal carcinoma: ESCA
Kidney chromophobe: KICH
Kidney renal clear cell carcinoma: KIRC
Kidney renal papillary cell carcinoma: KIRP
Liver hepatocellular carcinoma: LIHC
Lung adenocarcinoma: LUAD
Lung squamous cell carcinoma: LUSC
Ovarian serous cystadenocarcinoma: OV
Pancreatic adenocarcinoma: PAAD
Prostate adenocarcinoma: PRAD
Stomach adenocarcinoma: STAD
Wiskott-Aldrich syndrome protein family verprolin homologous protein 2: WAVE2
Neural Wiskott-Aldrich syndrome: NWASP
Epidermal growth factor receptor pathway substrate 8: EPS8
Phosphatidylinositol-3-kinase: PI3K
Author contributions
Conception: Jingzhu Guo and Weidong Yu.
Interpretation or analysis of data: Tingru Lin and Yifang Peng.
Preparation of the manuscript: Tingru Lin, Na Wu and Weidong Yu.
Revision for important intellectual content: Mei Li, Yulan Liu and Xin Yu.
Supervision: Na Wu and Weidong Yu.
Acknowledgments
This study was supported by grants from the National Natural Science Foundation of China (Nos. 30872923, 81672853, 32070116) and Peking University People’s Hospital Research and Development Foundation (No. RDB 2020-11). We also thank the editors from BioMed Proofreading LLC for comprehensive editing of this manuscript.
We acknowledge TCGA, TSVdb and NCBI database for providing their platforms and contributors for uploading their meaningful datasets.
References
[1] | R.L. Siegel, K.D. Miller, H.E. Fuchs and A. Jemal, Cancer statistics, CA Cancer J Clin 72: ((2022) ), 7–33. |
[2] | M. Zhou, H. Wang, X. Zeng, P. Yin, J. Zhu, W. Chen, X. Li, L. Wang, L. Wang, Y. Liu, J. Liu, M. Zhang, J. Qi, S. Yu, A. Afshin, E. Gakidou, S. Glenn, V.S. Krish, M.K. Miller-Petrie, W.C. Mountjoy-Venning, E.C. Mullany, S.B. Redford, H. Liu, M. Naghavi, S.I. Hay, L. Wang, C.J.L. Murray and X. Liang, Mortality, morbidity, and risk factors in China and its provinces, 1990–2017: a systematic analysis for the Global Burden of Disease Study 2017, Lancet 394: ((2019) ), 1145–1158. |
[3] | J. Fares, M.Y. Fares, H.H. Khachfe, H.A. Salhab and Y. Fares, Molecular principles of metastasis: a hallmark of cancer revisited, Signal Transduct Target Ther 5: ((2020) ), 28. |
[4] | R. Banerjee, J. Smith, M.R. Eccles, R.J. Weeks and A. Chatterjee, Epigenetic basis and targeting of cancer metastasis, Trends Cancer 8: ((2022) ), 226–241. |
[5] | D.M. Marzese, A.O. Manughian-Peter, J.I.J. Orozco and D.S.B. Hoon, Alternative splicing and cancer metastasis: prognostic and therapeutic applications, Clin Exp Metastasis 35: ((2018) ), 393–402. |
[6] | J. De Faria Poloni and D. Bonatto, Influence of transcriptional variants on metastasis, RNA Biol 15: ((2018) ), 1006–1024. |
[7] | E. Sebestyen, M. Zawisza and E. Eyras, Detection of recurrent alternative splicing switches in tumor samples reveals novel signatures of cancer, Nucleic Acids Res 43: ((2015) ), 1345–56. |
[8] | |
[9] | M. Cui, W. Yu, J. Dong, J. Chen, X. Zhang and Y. Liu, Downregulation of ABI1 expression affects the progression and prognosis of human gastric carcinoma, Med Oncol 27: ((2010) ), 632–9. |
[10] | K. Steinestel, S. Bruderlein, J.K. Lennerz, J. Steinestel, K. Kraft, C. Propper, V. Meineke and P. Moller, Expression and Y435-phosphorylation of Abelson interactor 1 (Abi1) promotes tumour cell adhesion, extracellular matrix degradation and invasion by colorectal carcinoma cells, Mol Cancer 13: ((2014) ), 145. |
[11] | J. Tod, C.J. Hanley, M.R. Morgan, M. Rucka, T. Mellows, M.A. Lopez, P. Kiely, K.A. Moutasim, S.J. Frampton, D. Sabnis, D.R. Fine, C. Johnson, J.F. Marshall, G. Scita, V. Jenei and G.J. Thomas, Pro-migratory and TGF-beta-activating functions of alphavbeta6 integrin in pancreatic cancer are differentially regulated via an Eps8-dependent GTPase switch, J Pathol 243: ((2017) ), 37–50. |
[12] | J.L. Wang, T.T. Yan, C. Long and W.W. Cai, Oncogenic function and prognostic significance of Abelson interactor 1 in hepatocellular carcinoma, Int J Oncol 50: ((2017) ), 1889–1898. |
[13] | C. Wang, D. Tran-Thanh, J.C. Moreno, T.R. Cawthorn, L.M. Jacks, D.Y. Wang, D.R. McCready and S.J. Done, Expression of Abl interactor 1 and its prognostic significance in breast cancer: a tissue-array-based investigation, Breast Cancer Res Treat 129: ((2011) ), 373–86. |
[14] | C. Wang, R. Navab, V. Iakovlev, Y. Leng, J. Zhang, M.S. Tsao, K. Siminovitch, D.R. McCready and S.J. Done, Abelson interactor protein-1 positively regulates breast cancer cell proliferation, migration, and invasion, Mol Cancer Res 5: ((2007) ), 1031–9. |
[15] | X. Sun, C. Li, C. Zhuang, W.C. Gilmore, E. Cobos, Y. Tao and Z. Dai, Abl interactor 1 regulates Src-Id1-matrix metalloproteinase 9 axis and is required for invadopodia formation, extracellular matrix degradation and tumor growth of human breast cancer cells, Carcinogenesis 30: ((2009) ), 2109–16. |
[16] | Y. Li, N. Clough, X. Sun, W. Yu, B.L. Abbott, C.J. Hogan and Z. Dai, Bcr-Abl induces abnormal cytoskeleton remodeling, beta1 integrin clustering and increased cell adhesion to fibronectin through the Abl interactor 1 pathway, J Cell Sci 120: ((2007) ), 1436–46. |
[17] | W. Yu, X. Sun, N. Clough, E. Cobos, Y. Tao and Z. Dai, Abi1 gene silencing by short hairpin RNA impairs Bcr-Abl-induced cell adhesion and migration in vitro and leukemogenesis in vivo, Carcinogenesis 29: ((2008) ), 1717–24. |
[18] | X. Sun, Y. Li, W. Yu, B. Wang, Y. Tao and Z. Dai, MT1-MMP as a downstream target of BCR-ABL/ABL interactor 1 signaling: polarized distribution and involvement in BCR-ABL-stimulated leukemic cell migration, Leukemia 22: ((2008) ), 1053–6. |
[19] | X. Xiong, A. Chorzalska, P.M. Dubielecka, J.R. White, Y. Vedvyas, C.V. Hedvat, A. Haimovitz-Friedman, J.A. Koutcher, J. Reimand, G.D. Bader, J.A. Sawicki and L. Kotula, Disruption of Abi1/Hssh3bp1 expression induces prostatic intraepithelial neoplasia in the conditional Abi1/Hssh3bp1 KO mice, Oncogenesis 1: ((2012) ), e26. |
[20] | D. Nath, X. Li, C. Mondragon, D. Post, M. Chen, J.R. White, A. Hryniewicz-Jankowska, T. Caza, V.A. Kuznetsov, H. Hehnly, T. Jamaspishvili, D.M. Berman, F. Zhang, S.H.Y. Kung, L. Fazli, M.E. Gleave, G. Bratslavsky, P.P. Pandolfi and L. Kotula, Abi1 loss drives prostate tumorigenesis through activation of EMT and non-canonical WNT signaling, Cell Commun Signal 17: ((2019) ), 120. |
[21] | J. Zhang, L. Tang, Y. Chen, Z. Duan, L. Xiao, W. Li, X. Liu and L. Shen, Upregulation of Abelson interactor protein 1 predicts tumor progression and poor outcome in epithelial ovarian cancer, Hum Pathol 46: ((2015) ), 1331–40. |
[22] | H. Chen, X. Wu, Z.K. Pan and S. Huang, Integrity of SOS1/ EPS8/ABI1 tri-complex determines ovarian cancer metastasis, Cancer Res 70: ((2010) ), 9979–90. |
[23] | D. Fang, H. Chen, J.Y. Zhu, W. Wang, Y. Teng, H.F. Ding, Q. Jing, S.B. Su and S. Huang, Epithelial-mesenchymal transition of ovarian cancer cells is sustained by Rac1 through simultaneous activation of MEK1/2 and Src signaling pathways, Oncogene 36: ((2017) ), 1546–1558. |
[24] | R.A. Baba, H.F. Bhat, L.A. Wani, M. Bashir, M.M. Wani, S.K. Qadri and F.A. Khanday, E3B1/ABI-1 isoforms are down-regulated in cancers of human gastrointestinal tract, Dis Markers 32: ((2012) ), 273–9. |
[25] | K. Li, Y.F. Peng, J.Z. Guo, M. Li, Y. Zhang, J.Y. Chen, T.R. Lin, X. Yu and W.D. Yu, Abelson interactor 1 splice isoform-L plays an anti-oncogenic role in colorectal carcinoma through interactions with WAVE2 and full-length Abelson interactor 1, World J Gastroenterol 27: ((2021) ), 1595–1615. |
[26] | Y. Zhang, Z. Zhong, M. Li, J. Chen, T. Lin, J. Sun, D. Wang, Q. Mu, H. Su, N. Wu, A. Liu, Y. Yu, M. Zhang, Y. Liu, J. Guo and W. Yu, The roles and prognostic significance of ABI1-TSV-11 expression in patients with left-sided colorectal cancer, Sci Rep 11: ((2021) ), 10734. |
[27] | TCGA, http://cancergenome.nih.gov. |
[28] | W. Sun, T. Duan, P. Ye, K. Chen, G. Zhang, M. Lai and H. Zhang, TSVdb: a web-tool for TCGA splicing variants analysis, BMC Genomics 19: ((2018) ), 405. |
[29] | Z. Sun, N. Ji, R. Zhao, J. Liang, J. Jiang and H. Tian, Extrachromosomal circular DNAs are common and functional in esophageal squamous cell carcinoma, Ann Transl Med 9: ((2021) ), 1464. |
[30] | Q. Wu, Y. Zhang, H. An, W. Sun, R. Wang, M. Liu and K. Zhang, The landscape and biological relevance of aberrant alternative splicing events in esophageal squamous cell carcinoma, Oncogene 40: ((2021) ), 4184–4197. |
[31] | J.L. Caswell, R. Camarda, A.Y. Zhou, S. Huntsman, D. Hu, S.E. Brenner, N. Zaitlen, A. Goga and E. Ziv, Multiple breast cancer risk variants are associated with differential transcript isoform expression in tumors, Hum Mol Genet 24: ((2015) ), 7421–31. |
[32] | Z. Yin, X. Yan, Q. Wang, Z. Deng, K. Tang, Z. Cao and T. Qiu, Detecting Prognosis Risk Biomarkers for Colon Cancer Through Multi-Omics-Based Prognostic Analysis and Target Regulation Simulation Modeling, Front Genet 11: ((2020) ), 524. |


