
From space to biomedicine: Enabling biomarker data science in the cloud
Abstract
NASA’s Jet Propulsion Laboratory (JPL) is advancing research capabilities for data science with two of the National Cancer Institute’s major research programs, the Early Detection Research Network (EDRN) and the Molecular and Cellular Characterization of Screen-Detected Lesions (MCL), by enabling data-driven discovery for cancer biomarker research. The research team pioneered a national data science ecosystem for cancer biomarker research to capture, process, manage, share, and analyze data across multiple research centers. By collaborating on software and data-driven methods developed for space and earth science research, the biomarker research community is heavily leveraging similar capabilities to support the data and computational demands to analyze research data. This includes linking diverse data from clinical phenotypes to imaging to genomics. The data science infrastructure captures and links data from over 1600 annotations of cancer biomarkers to terabytes of analysis results on the cloud in a biomarker data commons known as “LabCAS”. As the data increases in size, it is critical that automated approaches be developed to “plug” laboratories and instruments into a data science infrastructure to systematically capture and analyze data directly. This includes the application of artificial intelligence and machine learning to automate annotation and scale science analysis.
1.Introduction
Space and biomedicine share many common characteristics as a science discipline. Both heavily focus on observational data acquired from a mission or science experiment in order to validate a hypothesis. As the capabilities of instruments that generate scientific observations have substantially increased in resolution and fidelity, the approach to using data – and the opportunity to analyze the data using data-driven analysis methods – has significantly raised the importance of data science as a discipline. High resolution imaging and other instruments routinely generate data on the terabyte scale, and an experiment or a mission can last years, therefore it is not unusual to see a collection of instruments that generate petabyte data results. The NASA Indian Synthetic Aperture Radar Mission (NISAR) [1] which is launching in 2021 is anticipated to generate approximately 85 terabytes of science data per day. As a spaceborne mission, it can downlink massive data through ground stations that can now sustain accelerating data rates. Robotic space science missions typically generate smaller raw datasets because of the limited bandwidth from instruments in deep space, but have a larger variety of objects being observed from missions orbiting planets, surface missions such as Mars Perseverance, and flyby missions observing planets and other objects in the solar system and beyond. As data collected is returned to Earth, raw telemetry is processed through a series of scientific data pipelines, generating massive data collections – whether from instruments observing Earth or space – that are archived and made available for higher order data analysis.
Biomedicine, in particular cancer research, shares many of the same data-intensive computational patterns that are exhibited in space and earth missions. Instruments generate massive data. Data must be transferred, processed, stored, discovered, accessed, and analyzed. Combining and linking data offers opportunities that provide a more holistic view over single dataset analysis. Linking clinical data with data observations acquired from instruments provides opportunities for exploring cohorts where data-driven methods from artificial intelligence, machine learning, and biostatistics can be applied to classify, find features in the data, and apply computational methods for scientific inference. In the end, the discovery and validation of a cancer biomarker – as an indicator or potential indicator of disease – is leveraging a massive data and computational infrastructure that must be in place to make scientific progress.
Cloud computing provides a significant advancement as a computing “as-a-service” infrastructure to enable data science for scientific analysis [2]. In addition to providing an on-demand compute infrastructure to enable storage, computation and hosting of software services, it provides capabilities to increase scientific collaboration by providing a central hub that brings data and computation together. As data increases, keeping data centrally located, as well as moving computation for analysis to where the data is stored, can help science analysis scale in the petabyte data era. Using a cloud-based “open science” approach will continue to unlock new opportunities for collaboration, gaining insight from data, and creating and validating scientific models (e.g., physics, biological, and machine learning) from the data. Increasing access to data, sharing tools and services, and creating new paradigms for collaboration will provide unprecedented opportunities to leverage artificial intelligence and machine learning, providing the computational power and massive data collections necessary to fully realize the potential of these data-driven approaches.
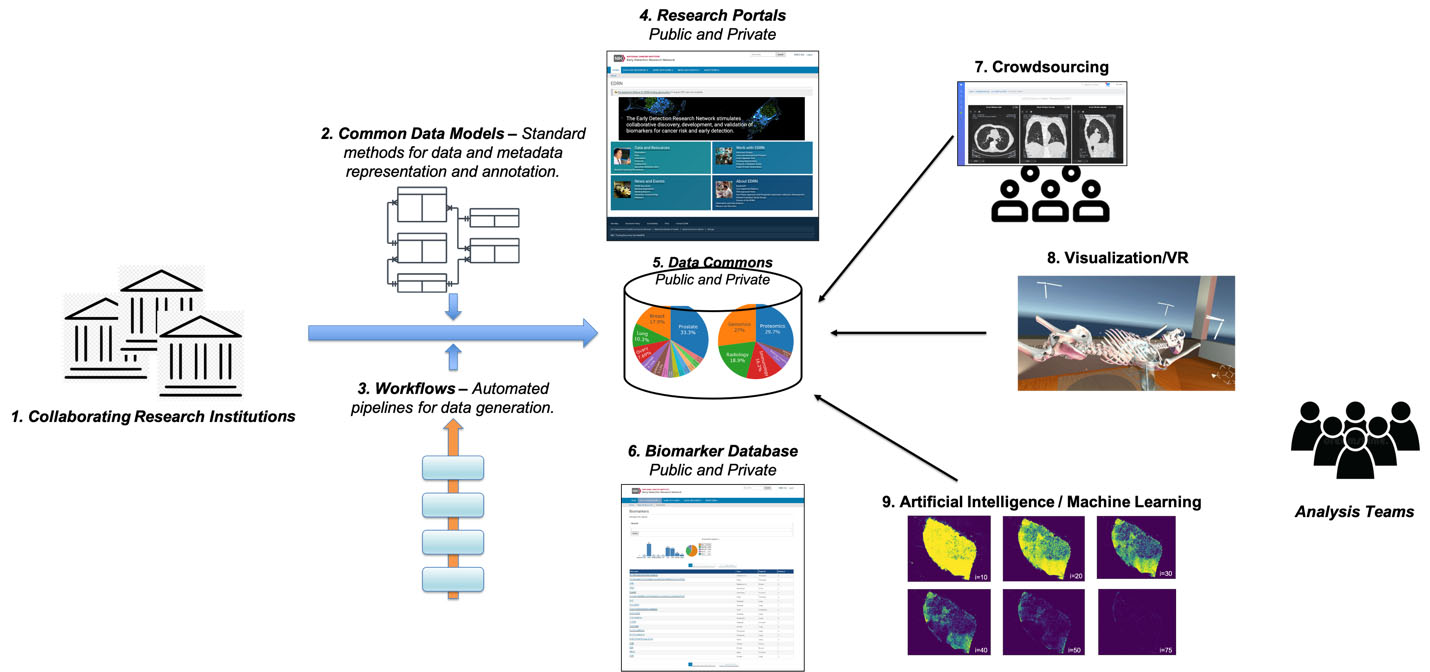
Figure 1.
Biomarkers Knowledge System: On the left, collaborating research institutions use research questions and use-cases to feed into instruments and thence to a laboratory biorepository; that is informed by common data models and workflows to engender the data commons. The data commons itself is aggregated with research portals and biomarkers. This then enables research tools including crowdsourcing, visualization (via virtual reality), and artificial intelligence machine learning – all of which are leveraged by analysis teams towards discovery.
NASA’s Jet Propulsion Laboratory (JPL) leads the data science program for the Cancer Biomarkers Research Group (CBRG) at the National Cancer Institute (NCI), developing and transferring data science methods between NASA and the NIH, and constructing a national data science ecosystem connecting academic centers to support the increased sharing and use of data – all coupled with advancing capabilities in Artificial Intelligence (AI) and Machine Learning (ML) [3]. A few key programs that are being supported through this partnership include the Early Detection Research Network (EDRN) [4] and the Consortium for Molecular and Cellular Characterization of Screen-Detected Lesions (MCL) [5]. These programs have seen a substantial increase of data to the terabyte scale, as cancer biomarkers have become a data-intensive science. Cancer imaging and sequencing drives this mushrooming of data volumes. However, the greater challenge is ensuring that multi-omic analysis approaches can be applied to link the data together and support analysis of different types of cohorts as part of the analysis of varied biomarker validation studies.
2.Data generation and sharing in early detection of cancer biomarkers
Through the collaboration with JPL, programs such as the EDRN have developed informatics tools and databases to support biomarker development and validation by creating an infrastructure that captures and links data from across the EDRN using nearly 1,600 annotations of cancer biomarkers, to terabytes of analysis results in the EDRN data commons, known as LabCAS (Laboratory Catalog and Archive Service) [6]. The entire knowledge environment is integrated with the EDRN web-based portal, providing secure, multi-layer access to data for EDRN, NCI, research and public communities [7]. Several tools employed are open source and are developed through collaborations with NCI’s Information Technology for Cancer Research (ITCR) program. These tools support processing, capture, curation and sharing of data before publication; a national biomarker knowledge system. The system currently consists of approximately:
• 1,600 biomarkers
• 200 protocols
• 2,500 publications
• 100 terabytes of cancer research data and images
These tools and databases are accessible online and provide a wealth of support for driving collaborative science for cancer biomarker research.
Data standardization is vital, not just as data volumes increase, but also due to the need for machine-readable and automated approaches to data analysis and data-driven discovery. Biomarker data programs, including the EDRN and MCL, have developed standards for data collection and annotation, in concert with NCI’s initiatives in data standardization and harmonization [8, 9]. Common data elements (CDEs) have been established identifying standard data structures and values to support consistency in building biomarker data collections. The data science teams on these programs have developed information models that describe the data to ensure that CDEs can be used to link different types of data together. CDEs provide the foundation for data management, search, and analytics, by standardizing the labeling required for training AI models [11].
The overall knowledge system is depicted in Fig. 1. This includes the common data elements, workflows, research portals, tools for crowdsourcing, visualization, and AI/ML to enable collaborative analysis by the research community. These will be further described in the subsequent sections.
3.Enabling a data-hub for cancer biomarker analysis on the cloud
NASA JPL has developed a “data commons” or “data hub” called LabCAS (“Laboratory Catalog and Archive Service”) based on similar capabilities required for earth and space science. LabCAS is a web-enabled environment that provides a cloud-based infrastructure to capture, organize, and enable centralized access and data analysis for consortium-based biomarker programs at the National Cancer Institute (NCI) based on a metadata-driven data science architecture [11]. It provides a comprehensive suite of services for managing scientific data captured in biomedical research throughout its full lifecycle, supporting both limited and restricted access to pre-publication data as well as open access to post-publication data. It also supports a set of microservices that can be run as workflows implementing various science data pipelines as well as other directed computing tasks (e.g., metadata validation, data transformation, etc.).
The LabCAS architecture is composed of a front-end web portal, where users can login to browse, inspect, visualize and download data; and a back-end software infrastructure in the cloud that exposes a rich set of data and metadata APIs for programmatic access to integrate data directly into analytical tools. The data infrastructure sits on a highly scalable, open source search engine (Apache Solr) which allows for rapid searching of metadata. Data is stored in large computing buckets, currently Amazon’s Simple Storage Service (S3). Orchestrated computation can be run as a set of jobs that can take full advantage of scaling in the cloud. These are elaborated on in Section 4.
Table 1
A sample of biomarker data captured in LabCAS from EDRN
| Collection title | Organ | Discipline | Institution | Principal investigator |
|---|---|---|---|---|
| Benign breast disease pathology slide images | Breast | Pathology imaging | University of Kansas | Andrew Godwin |
| Ductal carcinoma in situ (DCIS) pathology slide images | Breast | Pathology imaging | University of Kansas | Andrew Godwin |
| Combined imaging and blood biomarkers for breast cancer diagnosis | Breast | Radiology | Duke University and H. Lee Moffitt Cancer Center and Research Institute Inc. | Jeffery Mark and John Heine |
| Lung team project 2 Images | Lung | Radiology | Boston University | Marc Lenburg |
| Prostate MRI | Prostate | Radiology | University of Michigan | John Wei |
Figure 2.
Organization of Data in the LabCAS Data Commons: collections comprise datasets which themselves comprise files; although not depicted, datasets themselves may contain nested datasets (which may contain nested datasets and so on), allowing for deep hierarchies as needed for scientific use cases.
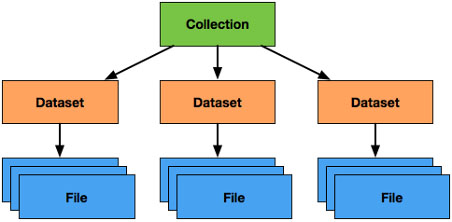
LabCAS stores data as collections, datasets, and files as shown in Fig. 2. Datasets can be nested allowing a flexible topology of data as required by different studies for capturing and organizing data. Files represent different types of measurements and analysis from images to time series to clinical data. Common data elements (CDEs) are used to standardize the metadata for collections, datasets, and files and to describe the study and/or data itself. Specific data dictionaries can be put in place to extend the metadata for any one of these constructs. For example, an imaging data dictionary can be used to annotate image files. Likewise, a data dictionary for the Precancer Atlas can be used to add additional metadata around collections or datasets which can be useful for fully capturing the data for that project. The metadata provided to LabCAS can be indexed by the integrated search engine to allow rapid searching and classification of the data holdings.
Data in LabCAS is captured as a set of files. These can be versioned to support re-processing along with corrections to data. Files can be accessed and downloaded as a set of data or individually through either the portal or a set of APIs. The APIs can be embedded into data analysis software – such as Jupyter Notebooks and R routines – to pull data from the data commons and support analysis, including directly in the cloud or locally to a scientist user. Access to all data is controlled through a security service which grants access based on a user’s role and permission to access the data. All access points, including the portal, go through the API which leverages the security service.
A large number of biomarker data collections have been captured for EDRN. These include collections that span multiple organ types and a variety of data including images from validation studies and specimen reference sets that link to data from laboratory tracking tools at EDRN’s Data Management and Coordinating Center (DMCC). A few of these data collections are identified in Table 1.
In addition, data captured in LabCAS can be externally cited in publications. LabCAS provides a mapping to DataCite metadata [12] which allows it to serve as a publisher of data on behalf of the biomarker programs it is supporting. Publications are provided with an external digital object identifier (DOI) [13] which is used in publications to link the paper to the scientific data following a publication model for data itself. This allows LabCAS to be used to capture both raw and processed data, including any version-specific results, supporting requirements around access to data and for reproducibility purposes.
Figure 3.
Data Dashboard in LabCAS; this screenshot shows the LabCAS user interface that runs in any modern web browser.
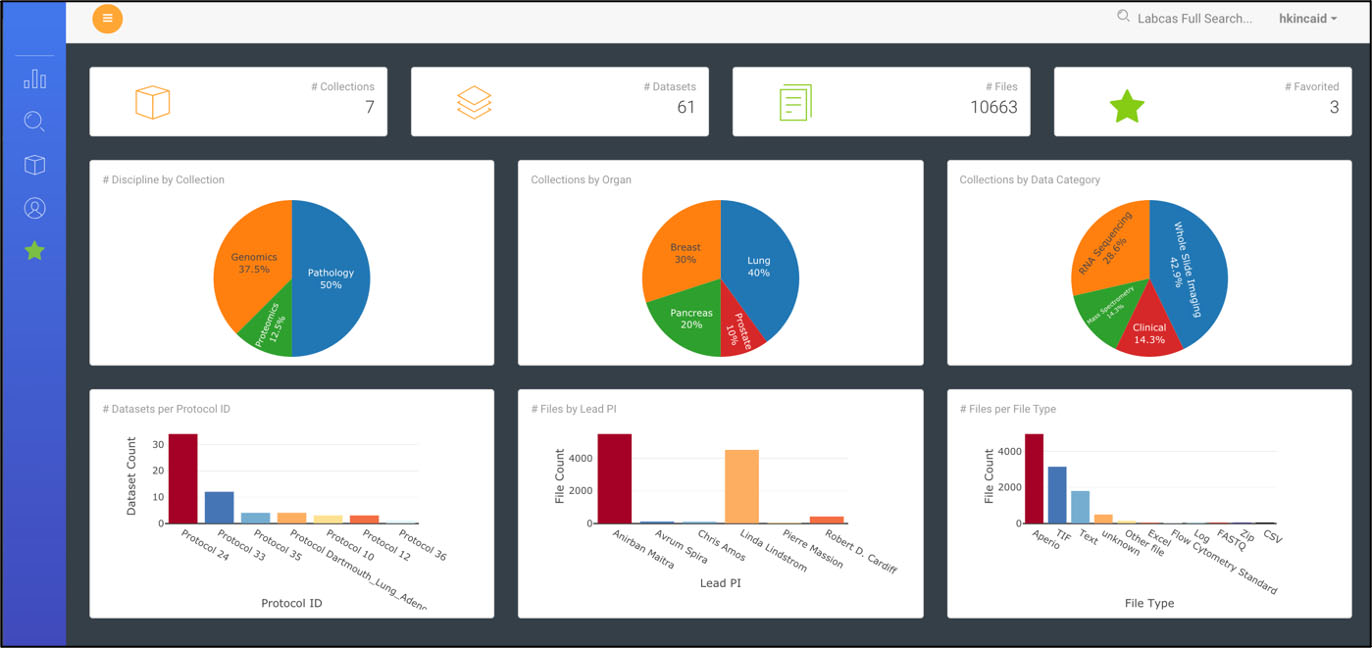
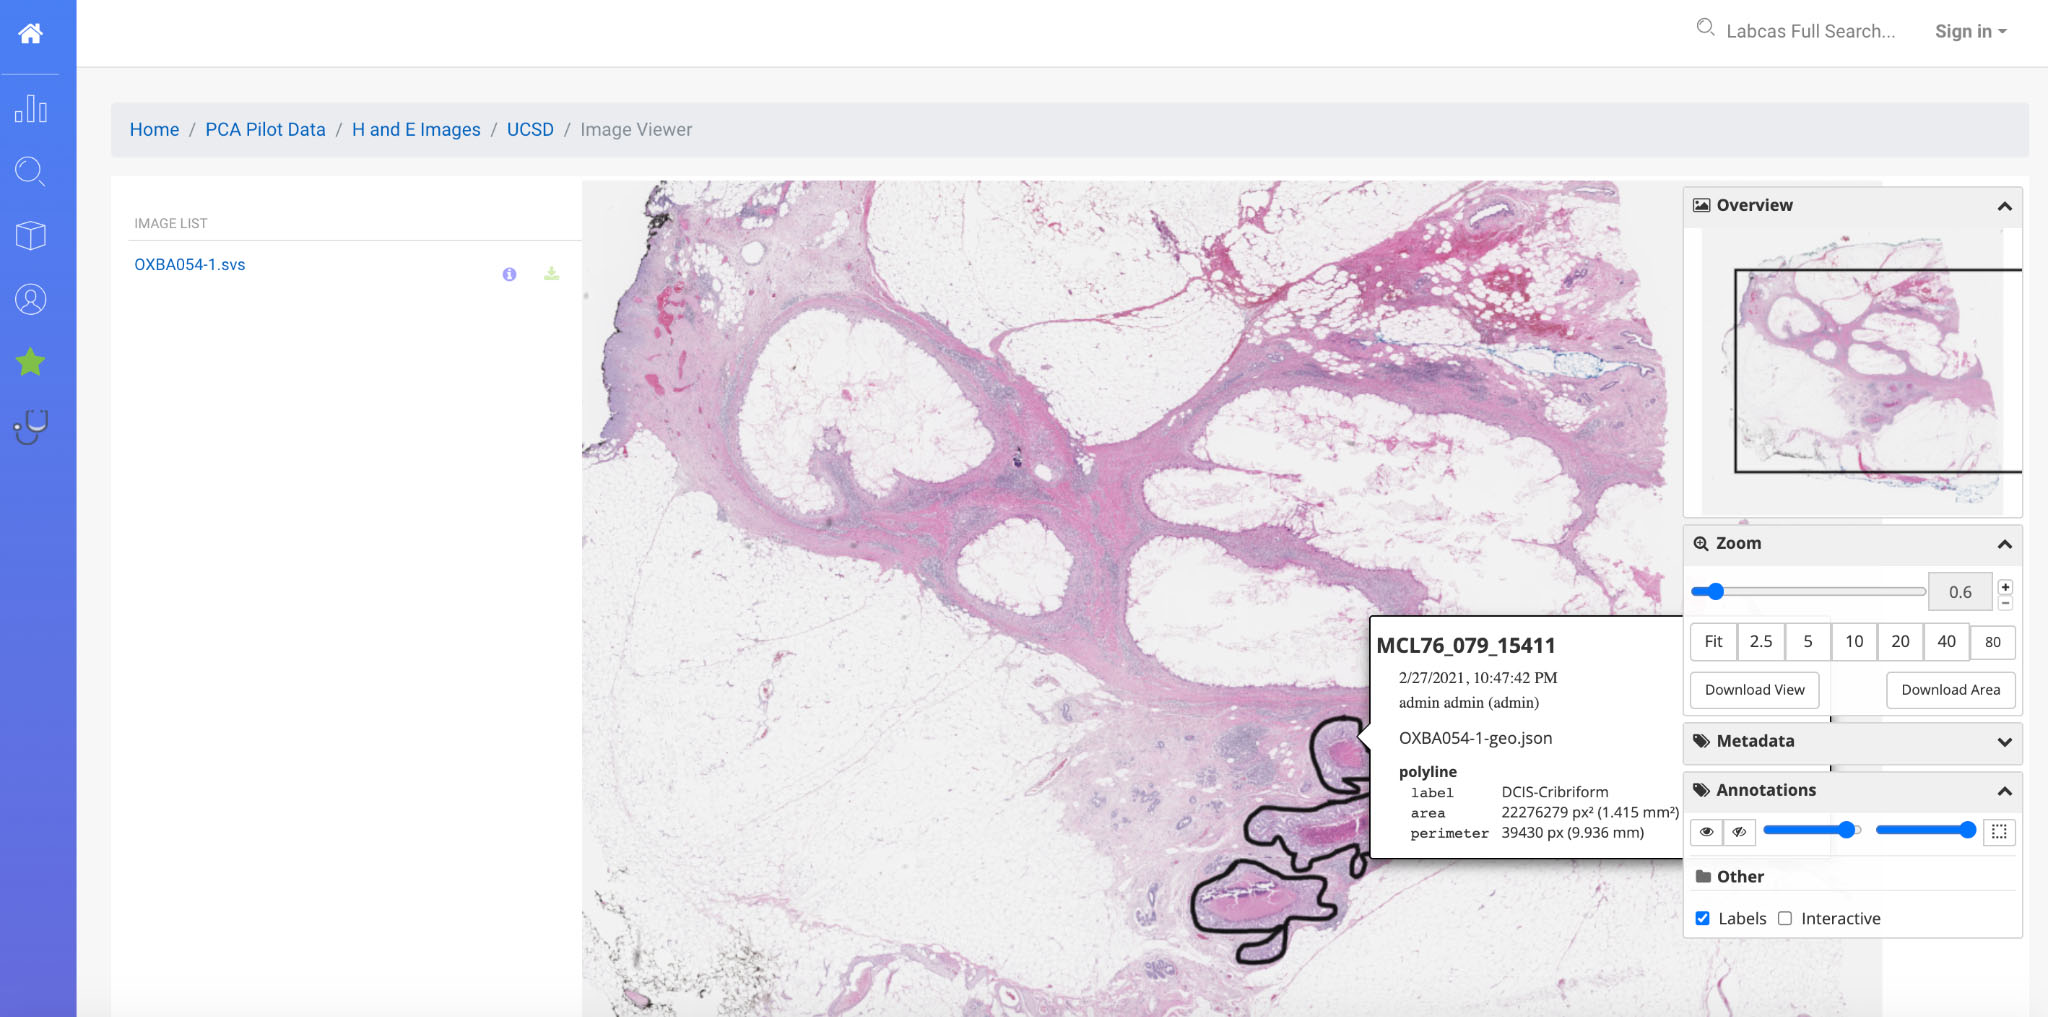
Figure 4.
Annotated H&E Image in LabCAS; this screenshot depicts the high-resolution slide imagery capabilities of LabCAS offered through a web browser.
The front-end web portal provides a rich set of tools for navigating, searching, viewing and downloading data and metadata on the cloud. The data dashboard shown in Fig. 3 is an interactive data visualization of all data captured that provides views of data categorized by standard metadata expressed by the CDEs – such as, title, study, discipline, organ, and other data-specific features. Users can drill down or search data by clicking on a specific category in a visualization. A free text search and advanced faceted search allows users to seek collections, datasets, and files leveraging the powerful capabilities of Solr to execute complex queries. The advanced faceted search is built using the standard metadata (CDEs) and can be customized based on different metadata. Customized searches can be captured and saved by users. A table view of all data in LabCAS, based on user credentials and permissions, allows users to view all data by collection, organ, discipline, institution, and PI. Data used frequently by a users can be “starred” and added to a favorites list for easy access.
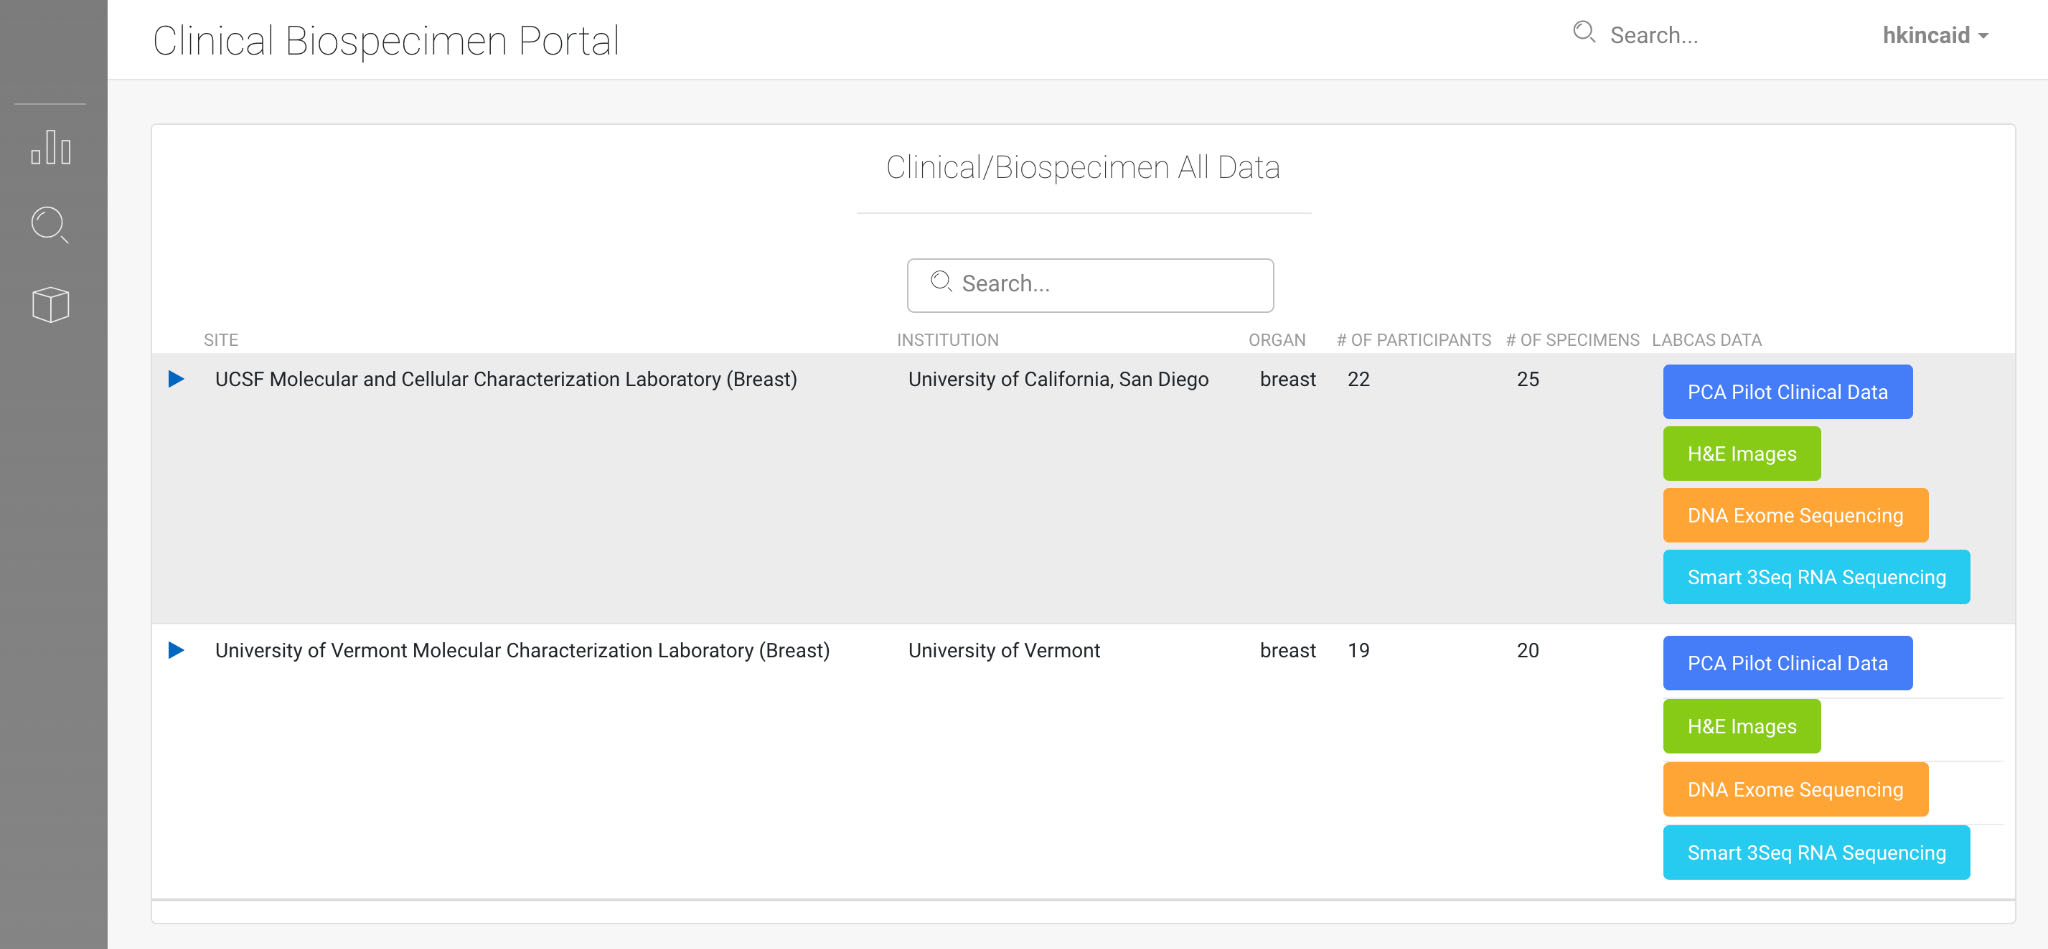
Figure 5.
LabCAS Clinical Viewer; this screenshot demonstrates a companion application to LabCAS that enables refined search and discovery of clinical biospecimen data by demographic, organ, and other parameters; like LabCAS, it also runs in any modern web browser.
LabCAS also provides the ability for viewing images as both thumbnails and originals as shown in Fig. 4. Open source software viewers are integrated into LabCAS and allow for navigation, as well as viewing annotations. Image files such as DICOM, SVS, SCN, and TIFF can be viewed providing seamless visualization, interactivity, and collaboration. For studies supporting image analysis, external science publications can link directly to annotated images providing interactive display modes using the DOI citation approach described earlier.
LabCAS also provides the ability to link assay data and clinical data. This allows for the ability to classify data into cohorts and to link clinical data to biospecimen, imaging, and genomics information. Figure 5 shows an example of the clinical viewer.
Security, including user and group authentication and authorization, is tightly integrated with all data collected in LabCAS. Metadata at the collection, dataset, and file levels are annotated with groups that identify the permissions, including read and write, to ensure that data can only be accessed and/or modified by those users who belong to privileged groups. This allows specific research laboratories to be set up as groups with users assigned to those groups. Principal investigators that lead groups can then authorize who has access to any data they publish to LabCAS. Data can also be set to larger group permissions at the consortium level or for public access. This allows a number of combinations for laboratories to perform collaborative analysis and for the consortium to organize biomarker research.
LabCAS is also leveraged for the the Pre-Cancer Atlas (PCA) Pilot project, an effort of MCL, that comprises data for the characterization of molecular alterations in precancerous lesions and the corresponding microenvironment in four major organ sites in order to uncover the molecular and cellular determinants of premalignancy and establish standardized sequencing and immunohistochemistry protocols on FFPE precancerous tissue. This includes evaluation of the technical feasibility of a single nuclei sequencing of small FFPE pre-cancer lesions. Successful completion of the proposed pilot study will set the stage for expansion and development of a comprehensive Pre-Cancer Atlas (PCA) as part of the NCI’s Cancer Moonshot Program.
To support the MCL PCA pilot, we have captured data as shown in Table 2 related to breast cancer from the University of California, San Diego and the University of Vermont. This data is annotated with the common data elements from MCL. The H&E images are publicly released and linked to publications for direct access [16].
Figure 6.
Similarities between the SDS used for the “Sherloc” and “Pixl” instruments aboard the NASA Mars2020 Perseverance rover, and as deployed in LabCAS to support the EDRN and MCL consortia. Input data (from Mars and LabCAS, respectively) enter workflow engines (CWS and Airflow) which both serve as input to computing clusters. These then generate output data (Martian rock spectral signatures and tumor identification and image co-registration, respectively).
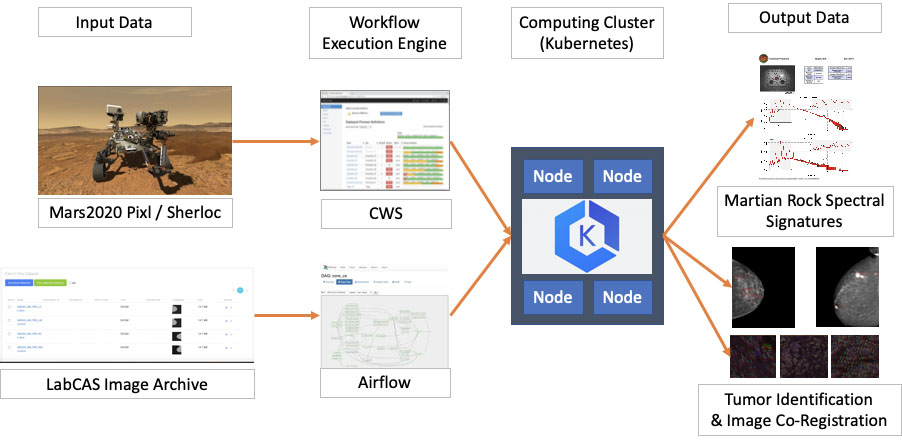
Table 2
| DNA exome sequencing FASTQ files |
| Smart-3Seq sequencing FASTQ files |
| H&E images and annotations |
| Multiplex IHC (mIHC) images |
| Clinical and biospecimen metadata |
Finally, LabCAS can be used to execute data intensive processing pipelines as structured workflows with scalable computation on the cloud. It also provides customizable user input, automatic publication of output with controlled access and allows for repeatable and reproducible results for everything from simple microservices to complex deep learning algorithms. This will be further expanded on in Section 4.
4.Centralizing data analysis pipelines on the cloud
One of the core capabilities of the LabCAS infrastructure is the ability to execute arbitrarily complex workflows on massive datasets in the cloud. This data processing architecture has been developed at JPL in strict synergy with other data processing efforts for space and earth missions, such as for some of the instruments carried by the Mars2020 Perseverance rover (currently on the surface of Mars), or for the Mission Data System of the upcoming Europa Clipper mission (scheduled for launch in 2024).
At a high level, the Science Data System (SDS) used by LabCAS or by some space and earth missions to process data is comprised of two main software components (see Fig. 6):
• A Workflow Execution Engine: a service capable of interpreting, submitting and monitoring complex data processing workflows, i.e. structured sequences of tasks that define how to access input data from collecting instruments, which data processing or machine learning algorithms to execute, and where to store the output data. In LabCAS, this role is fulfilled by Airflow [14], a popular open source workflow engine initially developed by Airbnb, and later transitioned to the Apache Software Foundation. Some of Airflow’s most valuable characteristics include a fully featured user interface to submit and monitor workflows, a modular design that lets it interact with several database backends and computing clusters, and the flexibility to author workflows as Python functions and classes. In LabCAS, Airflow is deployed in the AWS cloud as a set of interacting Docker containers.
• A computing cluster: a service capable of provisioning and managing the necessary hardware and network resources, and of executing the tasks and algorithms scheduled by the Workflow Execution Engine. LabCAS uses Kubernetes to execute containerized data processing algorithms on a scalable set of worker nodes, and to monitor jobs to completion. Kubernetes [15] is the most popular container orchestration engine, originally developed at Google, and now adopted by all major cloud providers, and supported by a large open source community.
A centralized analysis pipeline can be used to standardize analysis across centers for collaborative biomarker studies. This can include genomics, imaging, and processing of other datasets which are submitted to LabCAS. Derived or processed results along with the raw data can be captured in LabCAS and referenced in papers, as identified in Section 3. Algorithms developed by the investigator can be packed and deployed in the cloud as “containers” allowing them to be integrated into the processing infrastructure of LabCAS. Computationally expensive algorithms can be scaled on different hardware in the cloud to provide sufficient CPU and memory capacity required for executing those jobs. Specialized hardware, such as GPU machines, can be used by those algorithms (e.g., neural networks) that reap such benefits. The integration of the data, algorithms, and computational infrastructure exploits the elastic capabilities provided through on-demand, cloud computing services.
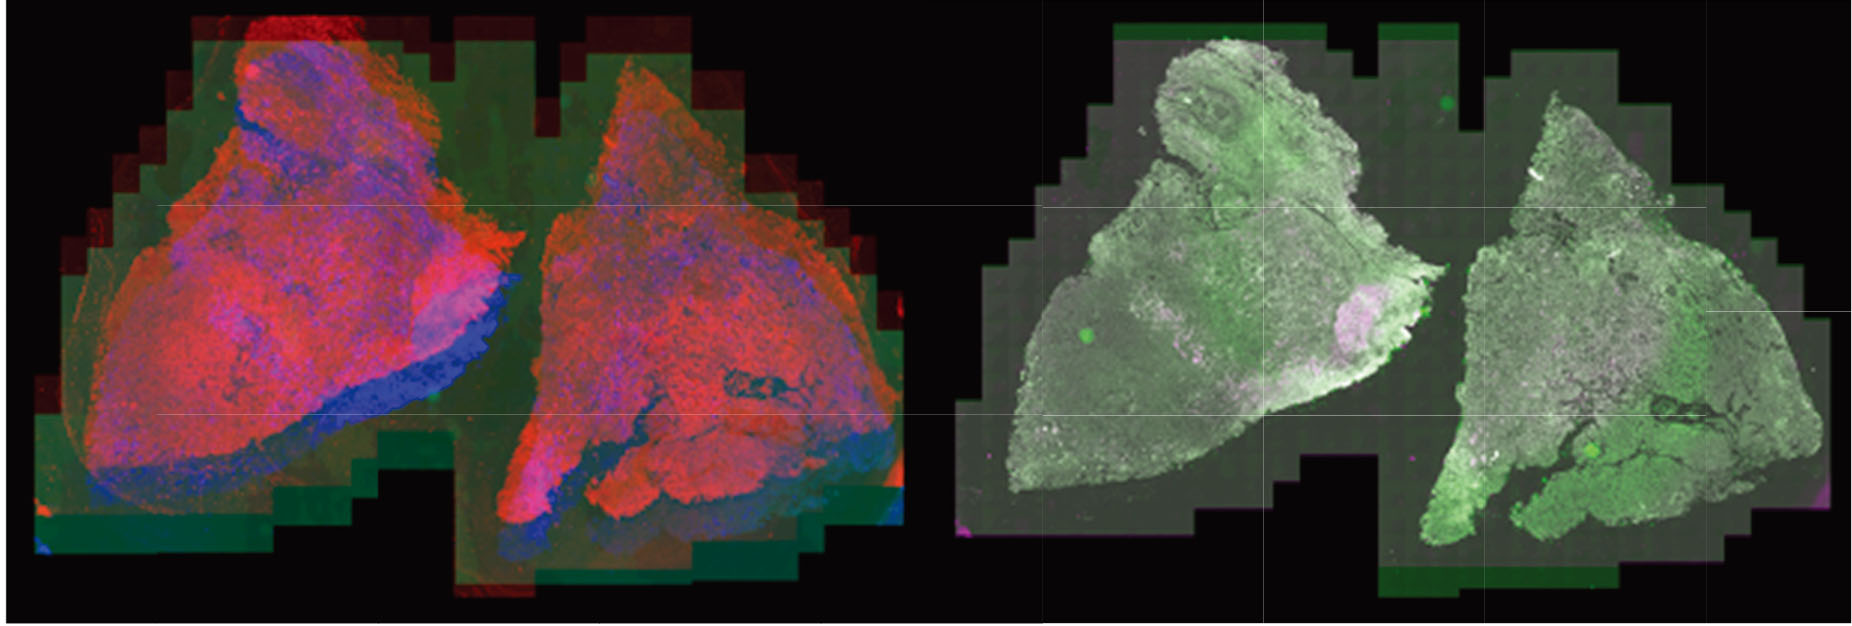
Most recently, the LabCAS SDS has been used to execute data processing workflows for registering very large, multiplexed tissue scans for the University of Nebraska Medical Center. Multiplexed images consist of up to 45 individual image frames, each of which have billions of pixels staining nuclei and cell components with different antigens to identify cell behavior in the tumor microenvironment. (Left: whole tissue scans superimposed out of alignment, right: whole tissue scans superimposed after alignment).
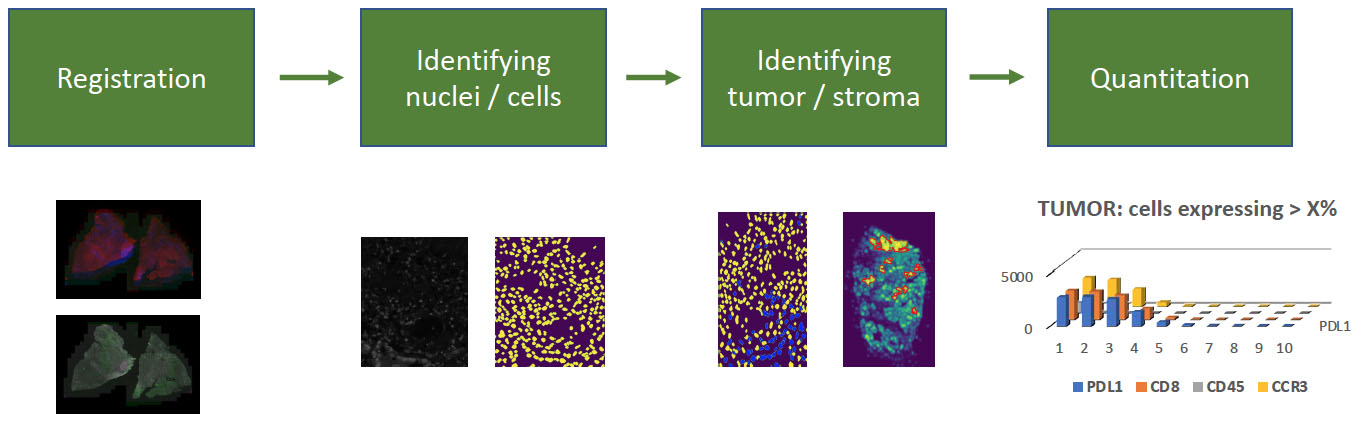
The full analysis workflow has additional steps, including nuclei detection, tumor identification based on antigen expression, and quantification of antigen behavior which could help identify new cancer biomarkers. Nuclei and tumor identification steps use convolutional neural networks to segment nuclei and identify tumor regions. These workflow components are candidates to be integrated into LabCAS SDS.
For executing a machine learning algorithm for the identification of tumor candidates in a standard set of mammograms collected by the H. Lee Moffitt Cancer Center and Duke University, we incorporated in LabCAS a pipeline put together by Joseph Lo et al. that identifies malignancies in 2D Full-Frame Digital Mammography mass detection images. It uses a variant of the RetinaNet (a YOLO model with multi-head attention). It marks boxes on the images and provides probabilities for lesions, malignancies, lymph nodes, architectural distortions, asymmetry, etc. The pretrained weights are provided and can be applied to newer images for inferencing, and also have the potential for leveraging with somewhat different datasets through transfer learning.
5.Moving towards interactive, data-driven methods
With the progress in improved computing power, and potent machine learning libraries, the desire to use such tools everywhere is self-evident. Applying machine learning generally requires clean, homogeneous, and large datasets. These are often hard to put together in the medical realm due to a number of reasons including privacy issues, different progression levels, and a variety of non-uniform datasets. We are starting to generate large datasets aided by domain experts that can then be bootstrapped for machine learning on even larger datasets. We use tools like Zooniverse, the precursor of which was used for classification of galaxies and then further generalized for myriad tasks. Zooniverse is primarily for citizen science where non-experts can provide annotations with the help of tutorials and field guides. Such a tool can be used in a restricted fashion just for the domain experts, but clearly has the potential for being opened up more widely for simpler tasks. We have put together a workflow involving Zooniverse and 3D Slicer to label tumors in lungs. The datasets will be used with deep learning techniques like convolutional neural networks that are data hungry. They could also be used to quantify cross-reader bias. This is generalizable to other organs and is a step towards the Image Atlas.
There is large untapped potential to explore methodologies developed in different fields. For example, understanding large scale structure on cosmological scales involves studying the filaments that connect galaxy clusters. Using an analogous technique for quantifying the neo-vascularization in breast tissue along with dynamic and morphologic characteristics of small enhancing lesions (e.g. washout dynamics) we are using morphology maps to compare vessel densities in longitudinal data [17]. Using a training set of known cases and capitalizing on 2D and 3D convolutional neural networks (CNNs) it is possible to identify neo-vascularization as well as progress. The quantification is being extended to additional datasets and can be potentially useful for other cancers as well.
Similarly we are using another technique from astronomy to identify prostate cancers. Detecting tumors early is important to reduce mortality rates and to treat patients least intrusively. But early diagnosis should not lead to over-treatment either, especially for benign tumors, or those that do not affect the patient’s well-being. We use longitudinal prostate cancer mpMRI data for patients enrolled in an active surveillance (AS) trial at University of Miami. Patients are surveilled yearly with mpMRI and MRI-Ultrasound fused biopsy up to 3 years after enrollment. The Apparent Diffusion Coefficient (ADC), high b-value (BVAL) images from the Diffusion Weighted Imaging (DWI), the early enhancing Dynamic Contrast Enhanced (DCE) series, and T2-weighted MRIs are combined using a technique from the pages of basic astronomy. Images in varying filters are composed into Hertzsprung-Russel diagrams that inform about stellar properties, dividing the stars into main sequence, dwarfs, and giants of different types. We trained a Faster R-CNN model to identify tumors using IBM’s Maximo Visual Inspector. By varying the minimum confidence in the identification on the combined channels, we are able to capture a much larger set of smaller tumors. While only a biopsy is the final confirmation, by studying the tumors in patients that progressed to treatment (PR) and those under active surveillance (AS) we can attach a certain amount of trust to our findings. The technique could be generalized to other cancers.
Figure 7.
Virtual reality (VR) application demonstration depicting exploration of volumetric scientific data in a three-dimensional space.
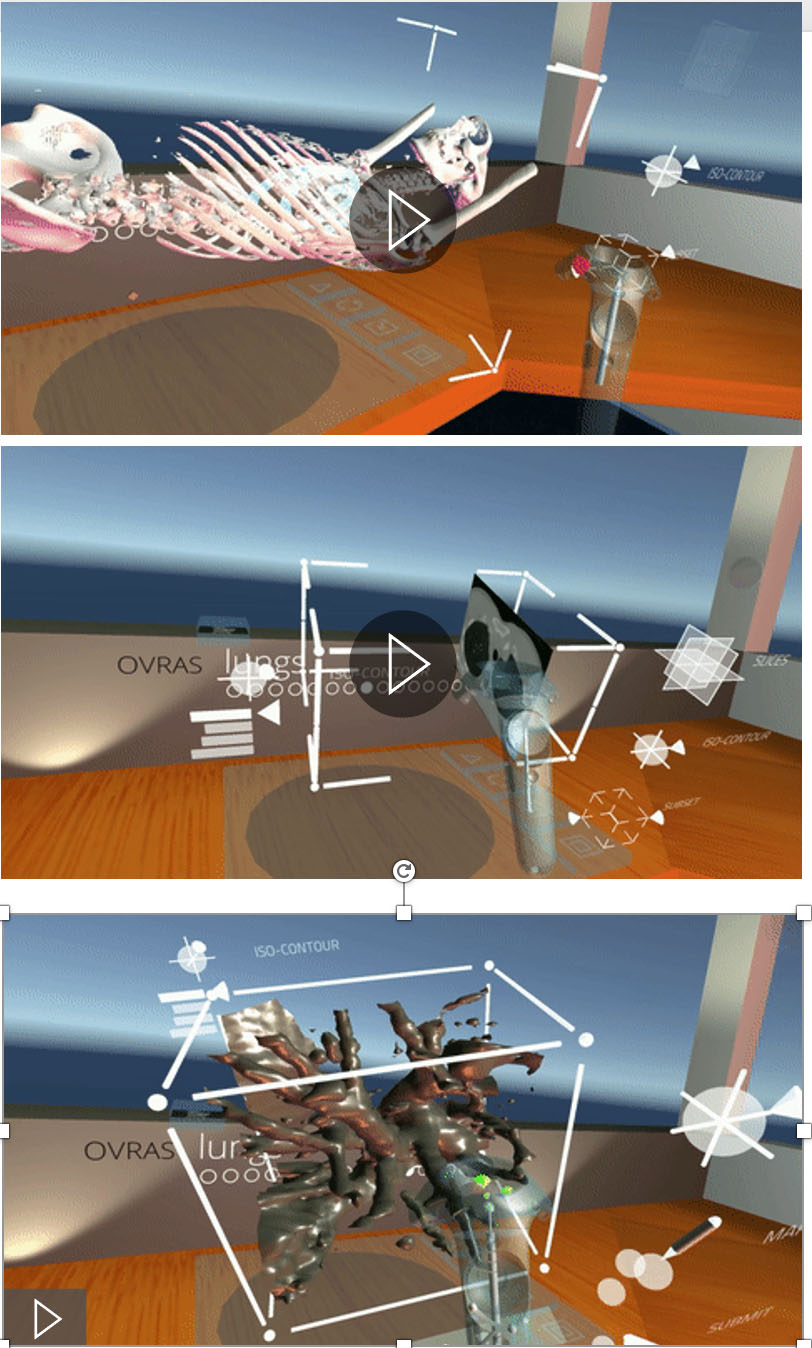
Figure 8.
Qualifying vascularity in breast tissue; eigenvalues demonstrate the detection of vessels and features in breast image samples.
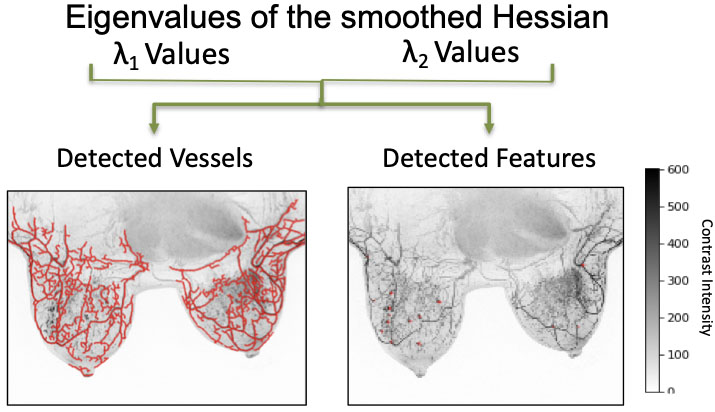
Virtual Reality is increasingly used to understand complex structures that are not evident in two dimensions. We have created a viable work space in Virtual Reality for direct interaction with intrinsically three dimensional data, where a user can easily pick up, manipulate, and annotate 3D models. We have created an efficient mechanism to create a training dataset for a machine-learning based classification tool by marking candidate nodules from actual 3D CT-Scans by inspecting the data through slicing tools and density isocontours/isosurfaces [18] (Fig. 7). This ability allows for a wider collaboration, and the creation of a viable and clean training data set ultimately leading to better understanding of tumors at all levels of progression. We are in the process of extending the use of this tool to other organs, for example, the breasts (see Fig. 8).
6.Conclusion
Capabilities to support big data and data science are increasingly being used to empower data-intensive activities. This includes areas such as cloud computing and artificial intelligence. We have found significant opportunities to transfer capabilities between space science and cancer biomarkers that have helped to advance cancer biomarker research with a number of tools and capabilities that set the stage for collaborative data science with large-scale biomarker research consortia. This includes the Early Detection Research Network and the Molecular and Cellular Characterization of Screen-Detection Lesions.
Cloud computing has transformed the biomarker science community as collaborative analysis of massive datasets, the need for shared access to data, and the opportunity to apply data-driven methods are being realized. Cancer biomarker research is at the forefront of this change as the NCI has constructed consortia charged with bringing together multiple disciplines in order to have the skills needed to support the discovery and validation of biomarkers through collaborative analysis approaches. Data science is now a central skill and cloud computing provides an essential capability to enable increased collaboration. This is essential to support science activities as the data and computing demands increase.
JPL and NCI have developed a “data hub” in the cloud, which provides a backbone for data analysis and artificial intelligence capabilities to make possible increased data sharing, training of AI models, and linking of data and publications for reproducibility. As data sizes increase, there is a growing need to push as much computation to the “edge” as possible. The centralization of data, computation, and algorithms with LabCAS, the data commons infrastructure for cancer biomarkers, is providing a path forward for many cancer biomarker consortia, enabling a shift towards greater numbers of data-intensive approaches.
Moving forward, data science – including cloud computing and artificial intelligence – is going to play a pivotal role in enabling collaborative research. Increased use of data commons infrastructures and data hubs; sharing of data, methods, and models for artificial intelligence; and the use of cloud computing for large-scale storage and computation is going to become critical as the size of cancer biomarker data collections continues to skyrocket. At the same time, these capabilities will help accelerate discovery by harnessing automated methods and the power of big data to drive insight through the consortia that the NCI is leading in early detection of cancer.
Acknowledgments
The research was carried out at the Jet Propulsion Laboratory, California Institute of Technology, under a contract with the National Aeronautics and Space Administration (80NM0018D0004).
References
[1] | https://earthdata.nasa.gov/learn/articles/tools-and-technology-articles/getting-ready-for-nisar. |
[2] | C.L. Gentemann, C. Holdgraf, R. Abernathey, D. Crichton, J. Colliander, E.J. Kearns et al., Science storms the cloud, AGU Advances 2: ((2021) ), e2020AV000354. doi: 10.1029/2020AV000354. |
[3] | D.J. Crichton, A. Altinok, C.I. Amos, K. Anton, L. Cinquini, M. Colbert, Z. Feng, A. Goel, S. Kelly, H. Kincaid, D. Liu, S. Lombeyda, A. Mahabal, A. Mishra, C. Patriotis and S. Srivastava, Cancer biomarkers and big data: A planetary science approach, Cancer Cell 38: (6) (14 Dec (2020) ), 757–760. doi: 10.1016/j.ccell.2020.09.006. Epub 2020 Sep 24. PMID: 32976775. |
[4] | S. Srivastava, The early detection research network: 10-year outlook, Clinical Chemistry 59: (1) ((2020) ), 60–67, doi: 10.1373/clinchem.2012.184697. |
[5] | S. Srivastava, E. Koay, A. Borowsky, A. De Marzo, S. Ghosh, P. Wagner and B. Kramer, Cancer overdiagnosis: a biological challenge and clinical dilemma, Nature Reviews Cancer 19: ((2019) ), 349–358. |
[6] | S. Srivastava and P. Wagner, The early detection research network: A national infrastructure to support the discovery, development, and validation of cancer biomarkers, Cancer Epidemiol Biomarkers Prev 29: (12) ((2020) ), 2401–2410. doi: 10.1158/1055-9965.EPI-20-0237. |
[7] | |
[8] | M.D. Winget, J.A. Baron, M.R. Spitz, D.E. Brenner, D. Warzel, H. Kincaid, M. Thornquist and Z. Feng, Development of common data elements: The experience of and recommendations from the early detection research network, Int J Med Inform 70: (1) ((2003) Apr), 41–8. doi: 10.1016/s1386-5056(03)00005-4. PMID: 12706181. |
[9] | D.B. Warzel, C. Andonaydis, B. McCurry et al., Common data element (CDE) management and deployment in clinical trials, AMIA Annu Symp Proc 2003, (2003) , p. 1048. |
[10] | Y. Roh, G. Heo and S.E. Whang, A survey on data collection for machine learning: A big data – ai integration perspective, IEEE Transactions on Knowledge and Data Engineering 33: (4) (1 April (2021) ), 1328–1347, doi: 10.1109/TKDE.2019.2946162. |
[11] | D. Crichton, A. Mahabal, K. Anton et al., The EDRN knowledge environment: an open source, scalable informatics platform for biological sciences research, Proc. SPIE 10194, Micro- and Nanotechnology Sensors, Systems, and Applications IX, 101942A (18 May (2017) ); doi: 10.1117/12.2263842. |
[12] | DataCite Metadata Working Group. ((2021) ). DataCite Metadata Schema Documentation for the Publication and Citation of Research Data and Other Research Outputs. Version 4.4. DataCite e.V. doi: 10.14454/3w3z-sa82. |
[13] | ISO 26324:2012(en), Information and documentation – Digital object identifier system. ISO. Retrieved 20 April 2016. |
[14] | Apache Airflow: https://airflow.apache.org/. |
[15] | Kubernetes: https://kubernetes.io/. |
[16] | Daniela Nachmanson, Adam Officer, Hidetoshi Mori, Jonathan Gordon, Mark F. Evans, Joseph Steward, Huazhen Yao, Thomas O’Keefe, Farnaz Hasteh, Gary S. Stein, Kristen Jepsen, Donald L. Weaver, Gillian L. Hirst, Brian L. Sprague, Laura J. Esserman, Alexander D. Borowsky, Janet L. Stein, Olivier Harismendy. bioRxiv 2021.05.11.443641; doi: 10.1101/2021.05.11.443641. |
[17] | D.E. Frankhauser, T. Jovanovic-Talisman, L. Lai et al., Spatiotemporal strategies to identify aggressive biology in precancerous breast biopsies, WIREs Mech Dis 13: ((2021) ), e1506. doi: 10.1002/wsbm.1506. |
[18] | S. Lombeyda, A. Mahabal, G. Djorgovski, D. Crichton, H. Kincaid, S. Srivastava and C. Patriotis, OVS+Tumor: a tool for enhanced lung tumor annotation in VR for machine learning training and analysis, ACM SIGGRAPH 2019 Virtual, Augmented, and Mixed Reality (SIGGRAPH ’19). Association for Computing Machinery, New York, NY, USA, Article 26, 1. doi: 10.1145/3306449.3328825. |


