
Multi-OMICs data analysis identifies molecular features correlating with tumor immunity in colon cancer
Abstract
BACKGROUND:
There is a current need for new markers with higher sensitivity and specificity to predict immune status and optimize immunotherapy use in colon cancer.
OBJECTIVE:
We aimed to investigate the multi-OMICs features associated with colon cancer immunity and response to immunotherapy.
METHODS:
We evaluated the association of multi-OMICs data from three colon cancer datasets (TCGA, CPTAC2, and Samstein) with antitumor immune signatures (CD8
RESULTS:
Two gene mutations (TERT and ERBB4) correlated with antitumor cytolytic activity found also correlated with improved survival in immunotherapy-treated colon cancers. Moreover, the expression of numerous genes was associated with antitumor immunity, including GBP1, GBP4, GBP5, NKG7, APOL3, IDO1, CCL5, and CXCL9. We clustered colon cancer samples into four immuno-distinct clusters based on the expression levels of 82 genes. We have also identified two proteins (PREX1 and RAD50), ten miRNAs (hsa-miR-140, 146, 150, 155, 342, 59, 342, 511, 592 and 1977), and five oncogenic pathways (CYCLIN, BCAT, CAMP, RB, NRL, EIF4E, and VEGF signaling pathways) significantly correlated with antitumor immune signatures.
CONCLUSION:
These molecular features are potential markers of tumor immune status and response to immunotherapy.
1.Introduction
Colon cancer is one of the most prevalent and lethal cancers worldwide [1]. Although the incidence is slightly reduced in developed countries due to the application of screening programs, colon cancer mortality remains high as patients are usually diagnosed at late stages, especially in countries with low socioeconomic status [2]. Surgery and/or chemotherapy are currently the standard treatment for colon cancer but clinical outcomes vary, although a better prognosis is generally observed in early stage compared to late stage of disease [3]. The reported immunogenic nature of some colon tumors has encouraged the development of colon cancer immune-modulating therapies. Modulation of colon cancer immune microenvironment either through enhancing tumor antigenicity (e.g. cancer vaccines), or reversing the antitumor immune response suppression (e.g. immune checkpoint therapies), have been extensively studied [4, 5]. Clinically, immune checkpoint therapies, namely anti-PD1 drugs, have produced incredible responses in treating a subset of colon cancer patients with hyper-mutated, microsatellite instable (MSI-H/MSI) tumors [5, 6, 7]. Markers of MSI status have since received increased attention in the clinical settings to guide the clinical use of PD1 blockade therapies in colon cancer [8, 9]. Microsatellite stable (MSS) cancers, on the other hand, have been invariably addressed as immunotherapy resistant cancers. Several immunogenomic studies have indicated that subgroups of MSS tumors might be responsive to immunotherapy [10, 11]. Moreover, the consensus molecular subgroups have distinct immune profiles [12]. The first subgroup (CMS1) corresponds to the previously identified MSI-H with high immune infiltration in the tumor microenvironment. The second and third subgroups (CMS2 and CMS3) are tumors with limited immune infiltration, while the fourth subgroup (CMS4) is characterized by a high stromal composition and immune-suppressing microenvironment. In each of (CMS2, CMS3, and CSM4), however, a fraction of hyper-mutated tumors was detected [12]. This overlap indicates that the previously used cancer immunotherapy markers (MSI status and tumor mutation burden), as they overlook the MSS colon tumors which might respond to immunotherapy, equally, they may also fail to predict the MSI-H subsets that responded poorly to immunotherapy. These findings highlight the need for an extensive analysis of the mechanisms regulating the tumor immune microenvironment. Understanding these mechanisms can help in identifying new and robust markers of colon cancer immunotherapy and developing effective strategies to counter immunotherapy resistance [13].
In the pursuit of more accurate or novel markers of tumor immune responses, tumor lymphocyte infiltration was verified as a reliable predictor of colon cancer clinical outcomes. The evidenced utility of immune scores in predicting patients’ survival and clinical outcome has paved the way for further research on the tumor immune microenvironment and its regulatory mechanisms [14]. The prominent advancement in OMICs technologies facilitated a comprehensive and integrative analysis of colon cancer pathogenic mechanisms [15, 16]. These technologies have recently been applied to study disease’s molecular features and their correlation with prognosis and clinical outcomes [17]. Such studies have led to the identification of important driver genes, proteins, and miRNAs in colon cancer development and progression [18, 19, 20]. In addition, several susceptibilities, diagnostic, and prognostic markers have been identified [17, 21]. Moreover, the progressive advancement in OMICs technologies has facilitated the qualitative and quantitative evaluation of tumor immune infiltration and allowed researchers to dissect key features regulating tumor immune microenvironment [13]. This will hopefully lead to the development of new immune-modulatory strategies and the identification of sensitive markers to such immunotherapy strategies [13].
In this study we applied bioinformatics analysis of three OMICs datasets of colon adenocarcinoma (COAD). Our aim was to dissect the molecular components and mechanisms that regulate tumor immune microenvironment and to highlight the clinical potentials of these as biomarkers of immunotherapy utility in colon cancer.
2.Methods
2.1Datasets
We downloaded the (gene somatic mutation data, gene expression data, protein expression data, miRNA expression data, and clinical data) for the TCGA-COAD cohort (
2.2Quantification of the immune signature enrichment levels (ISELs) in COAD samples
We analyzed the TCGA-COAD and CPTAC2-COAD samples’ immune signature enrichment levels (ISELs) using three immune signatures: CD8
2.3ISELs associations with various OMICS features in COAD
We analyzed the TCGA-COAD and CPTAC2-COAD samples’ gene mutation data for significant associations with ISELs using the Mann-Whitney U test. We then used the Pearson correlation to identify the genes, proteins, and miRNAs with expression levels significantly correlated with ISELs. In addition, we used single-sample gene-set enrichment analysis (ssGSEA) to quantify the activity of oncogenic pathways in TCGA-COAD samples using KEGG oncogenic gene sets and identified the cancer-associated pathways (top 50 ssGSEA enriched pathways), with activities significantly associated with ISELs according to Spearman correlation test [28]. For all previous tests, we used the Benjamini Y and Hochberg false discovery rate (FDR) method [29] to adjust for multiple tests with a threshold of FDR
2.4Gene-set enrichment analysis
We used GSEA [30] to determine the KEGG pathways that were significantly enriched for the genes having significant expression correlations with ISELs.
2.5Survival analysis
We investigated the associations of gene mutations significantly correlated with ISELs and immunotherapy survival by comparing the overall survival (OS) between mutant and wildtype COAD samples in the three cohorts (one immunotherapy-treated cohort and two untreated cohorts). We used the Kaplan Meier survival curves to demonstrate the OS time differences with each gene and the log-rank test to evaluate the significance of OS time differences.
2.6Cluster analysis
We also used genes with expression highly correlated (
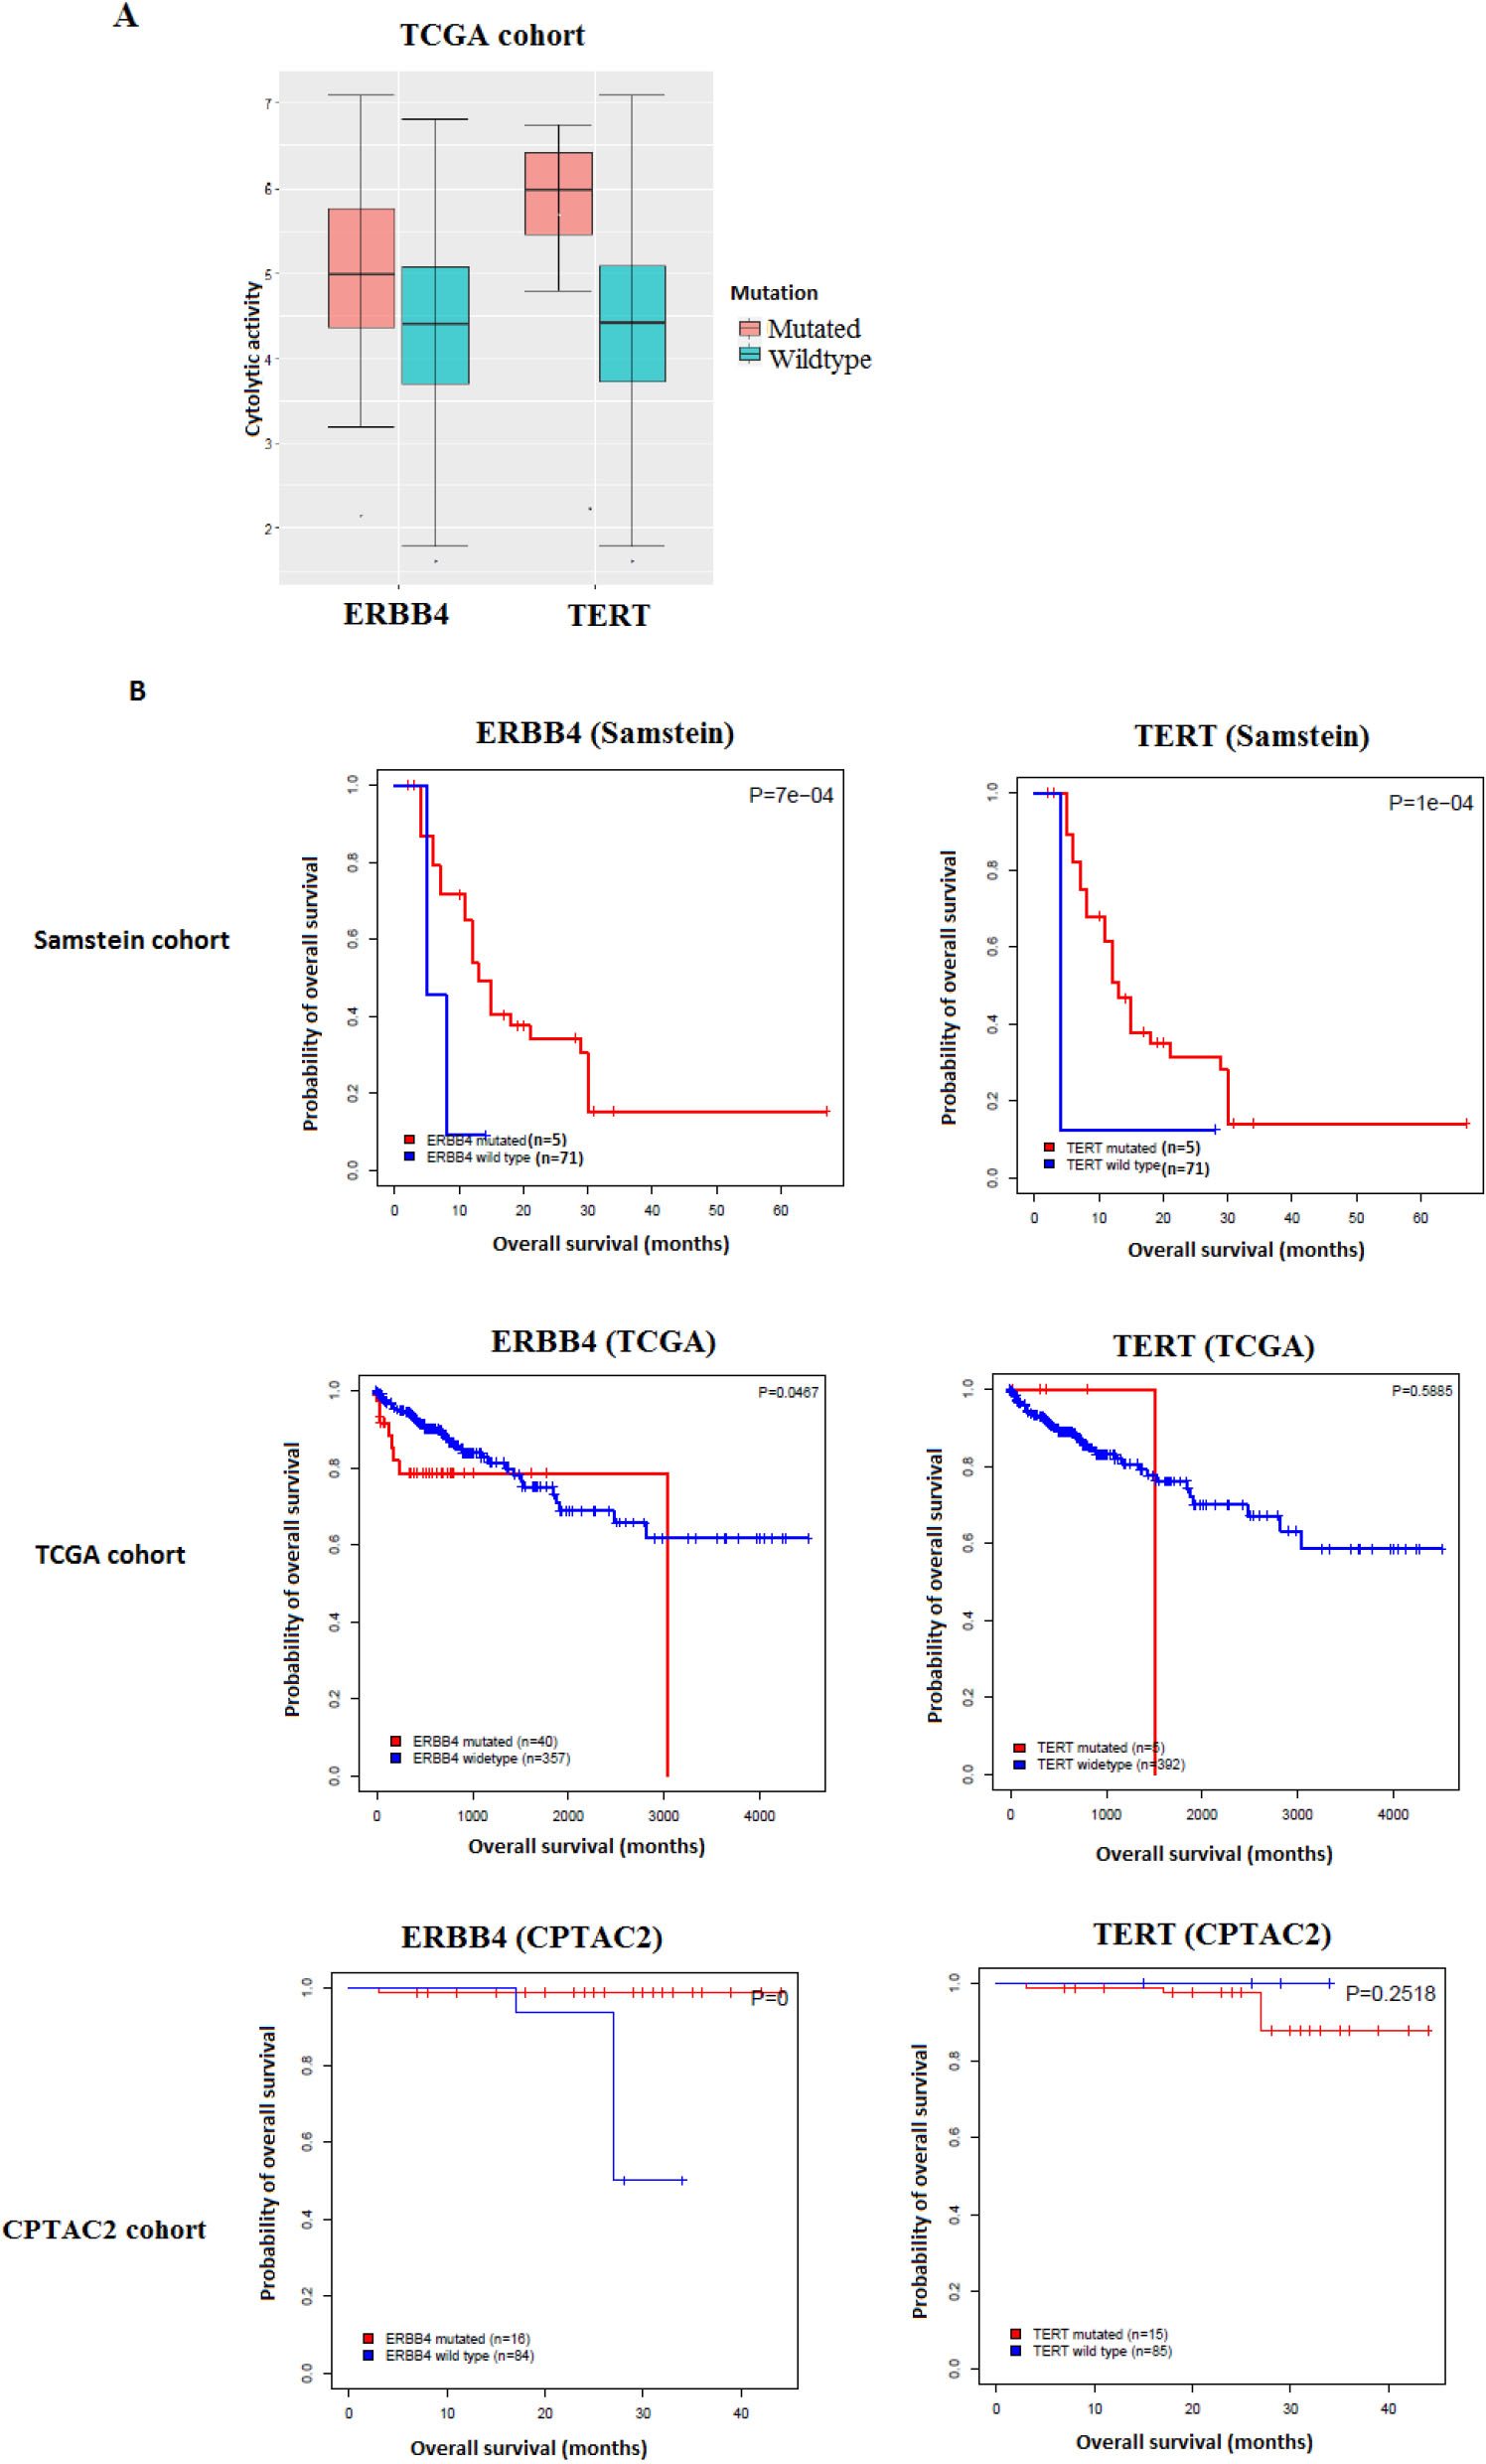
Figure 1.
Gene mutations associated with antitumor immune response and better immunotherapy response in COAD. A. The mutations of two genes are consistently associated with the elevated cytolytic activity in TCGA-COAD cohort (Mann-Whitney U test, FDR
3.Results
3.1Gene mutations associated with antitumor immune response in COAD
Analyzing the TCGA-COAD cohort samples, we identified 2123 gene mutations that are significantly positively correlated with heightened CD8
We then assessed the clinical potential of the validated gene mutations by exploring their associations with OS in the immunotherapy-untreated TCGA-COAD and CPTAC2-COAD cohorts and comparing the results to those of the immunotherapy-treated (im-
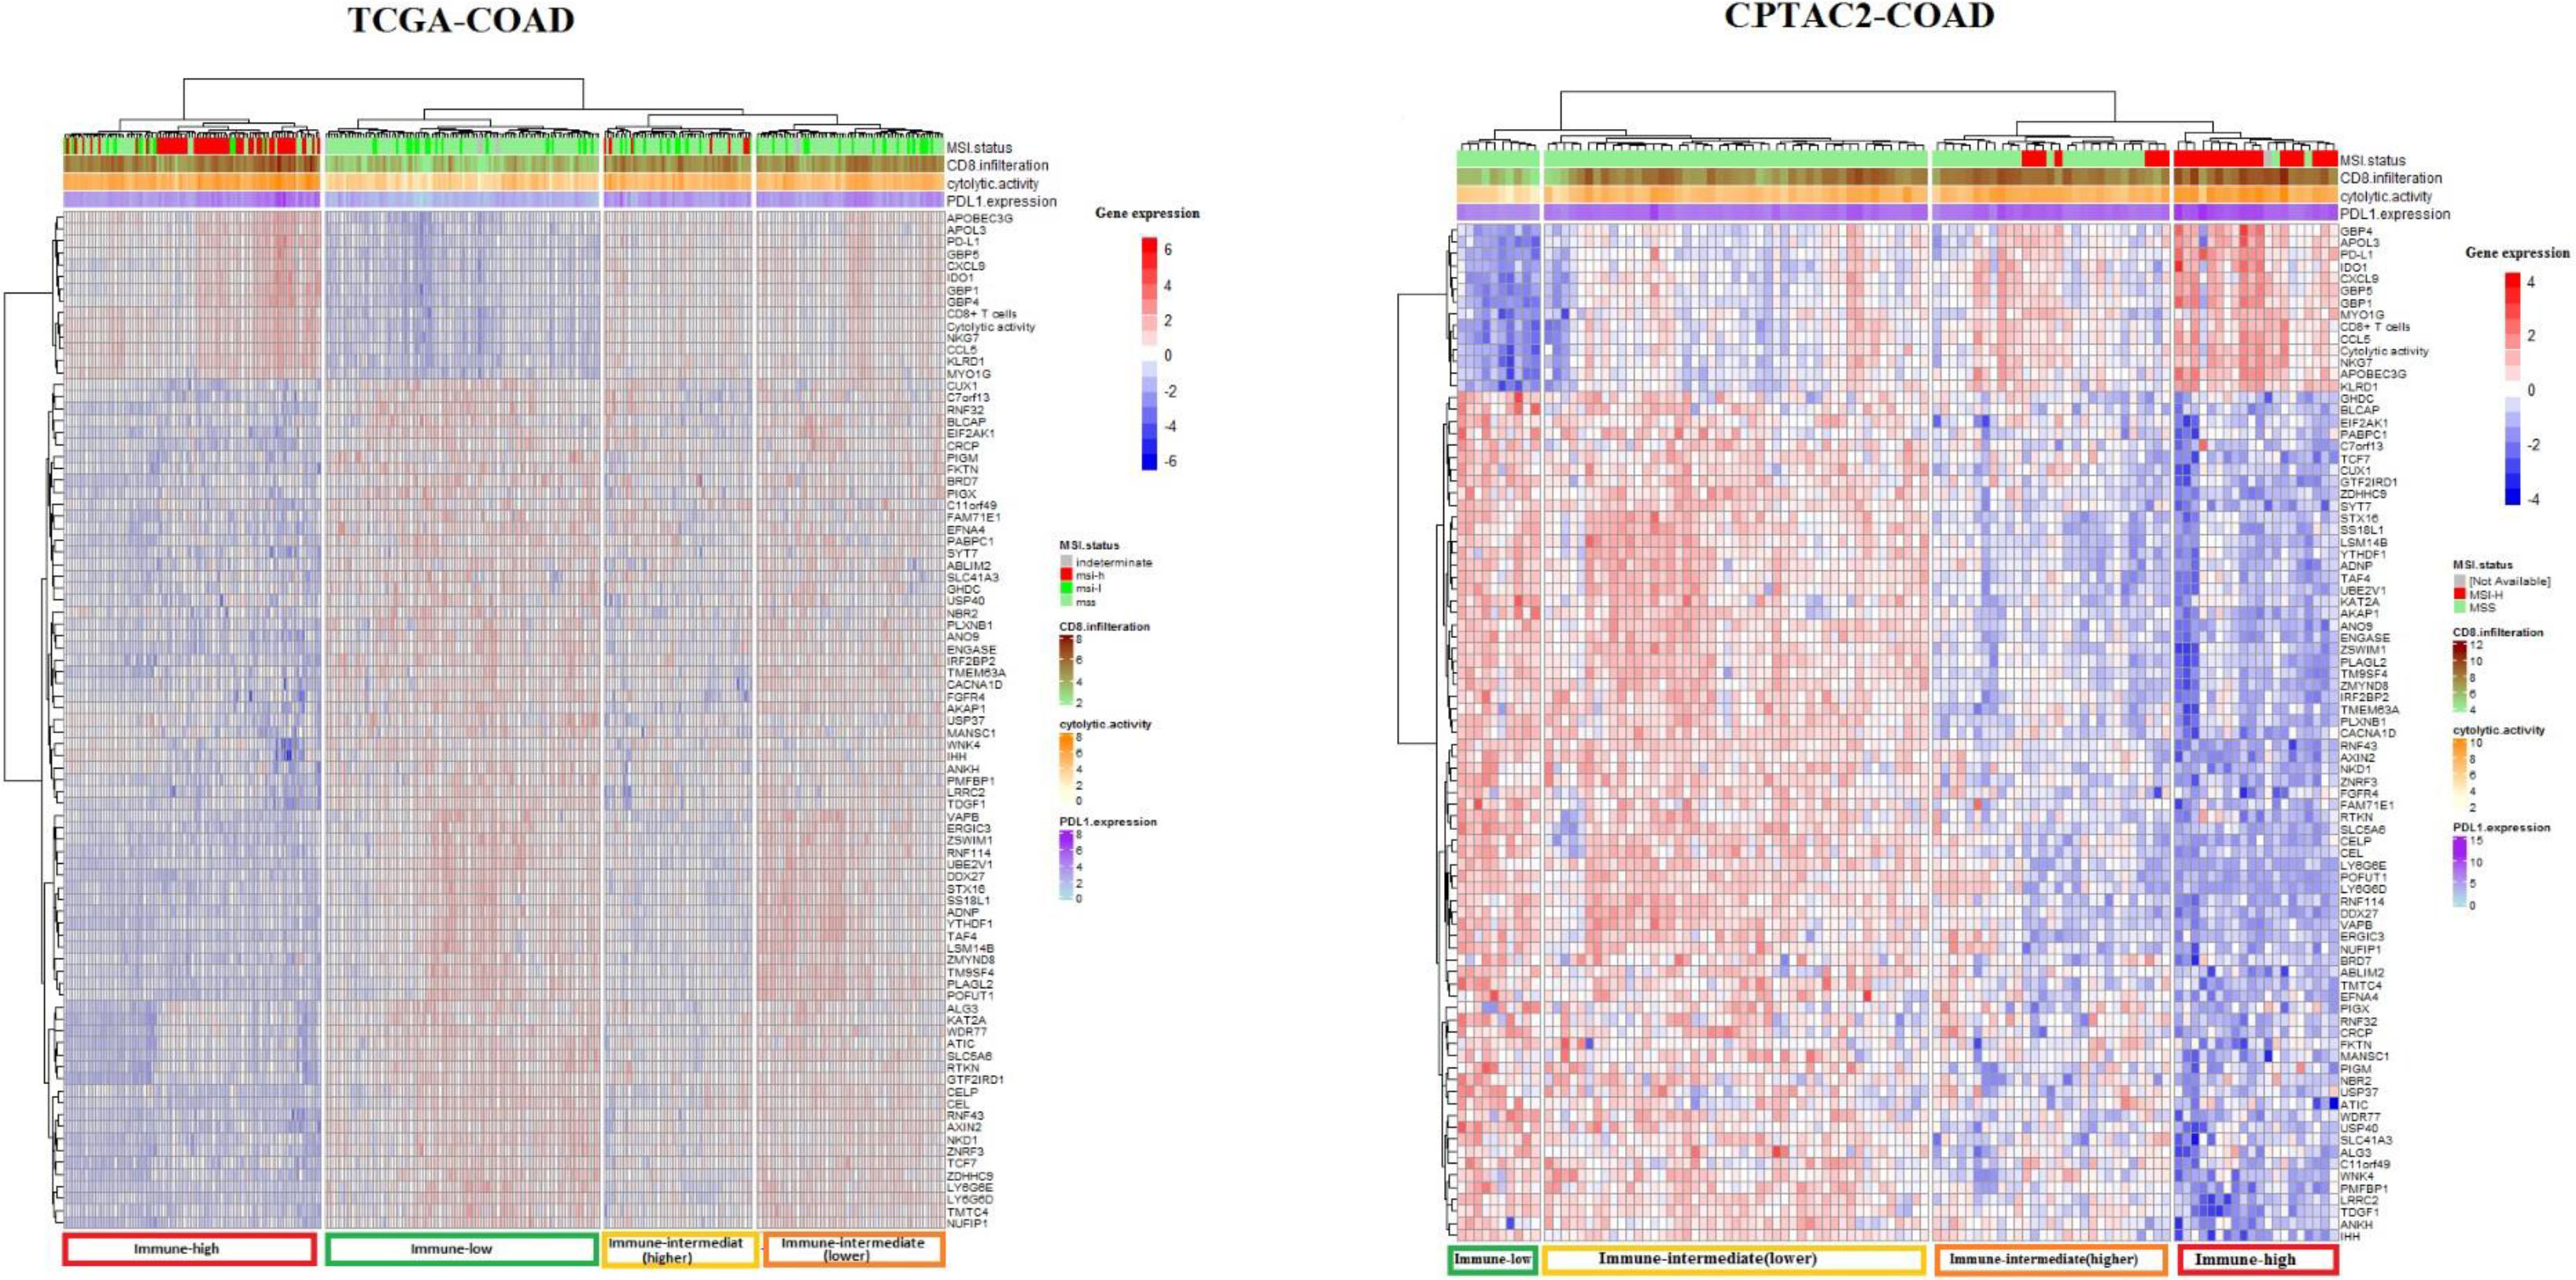
Figure 2.
Cluster analysis of TCGA-COAD and CAPTAC2-COAD datasets samples using 82 genes associated with tumor immune signatures. Cluster Heatmaps showing four clusters of TCGA-COAD and CAPTAC2-COAD samples clustered by 82 genes expression with a distinct immune profile in each cluster. Note that the immune-high cluster composes MSI-H as well as MSS and MSI-L samples, while some of the MSI-H samples clustered in classes other than the immune-high.
mune checkpoint inhibitors-treated) Samstein cohort. We found that the mutations of two genes (TERT and ERBB4) were correlated with elevated ICA activity and demonstrated a significant positive correlation with OS in the immunotherapy-treated Samstein cohort, while they showed no such a correlation in the immunotherapy-untreated cohorts (Fig. 1).
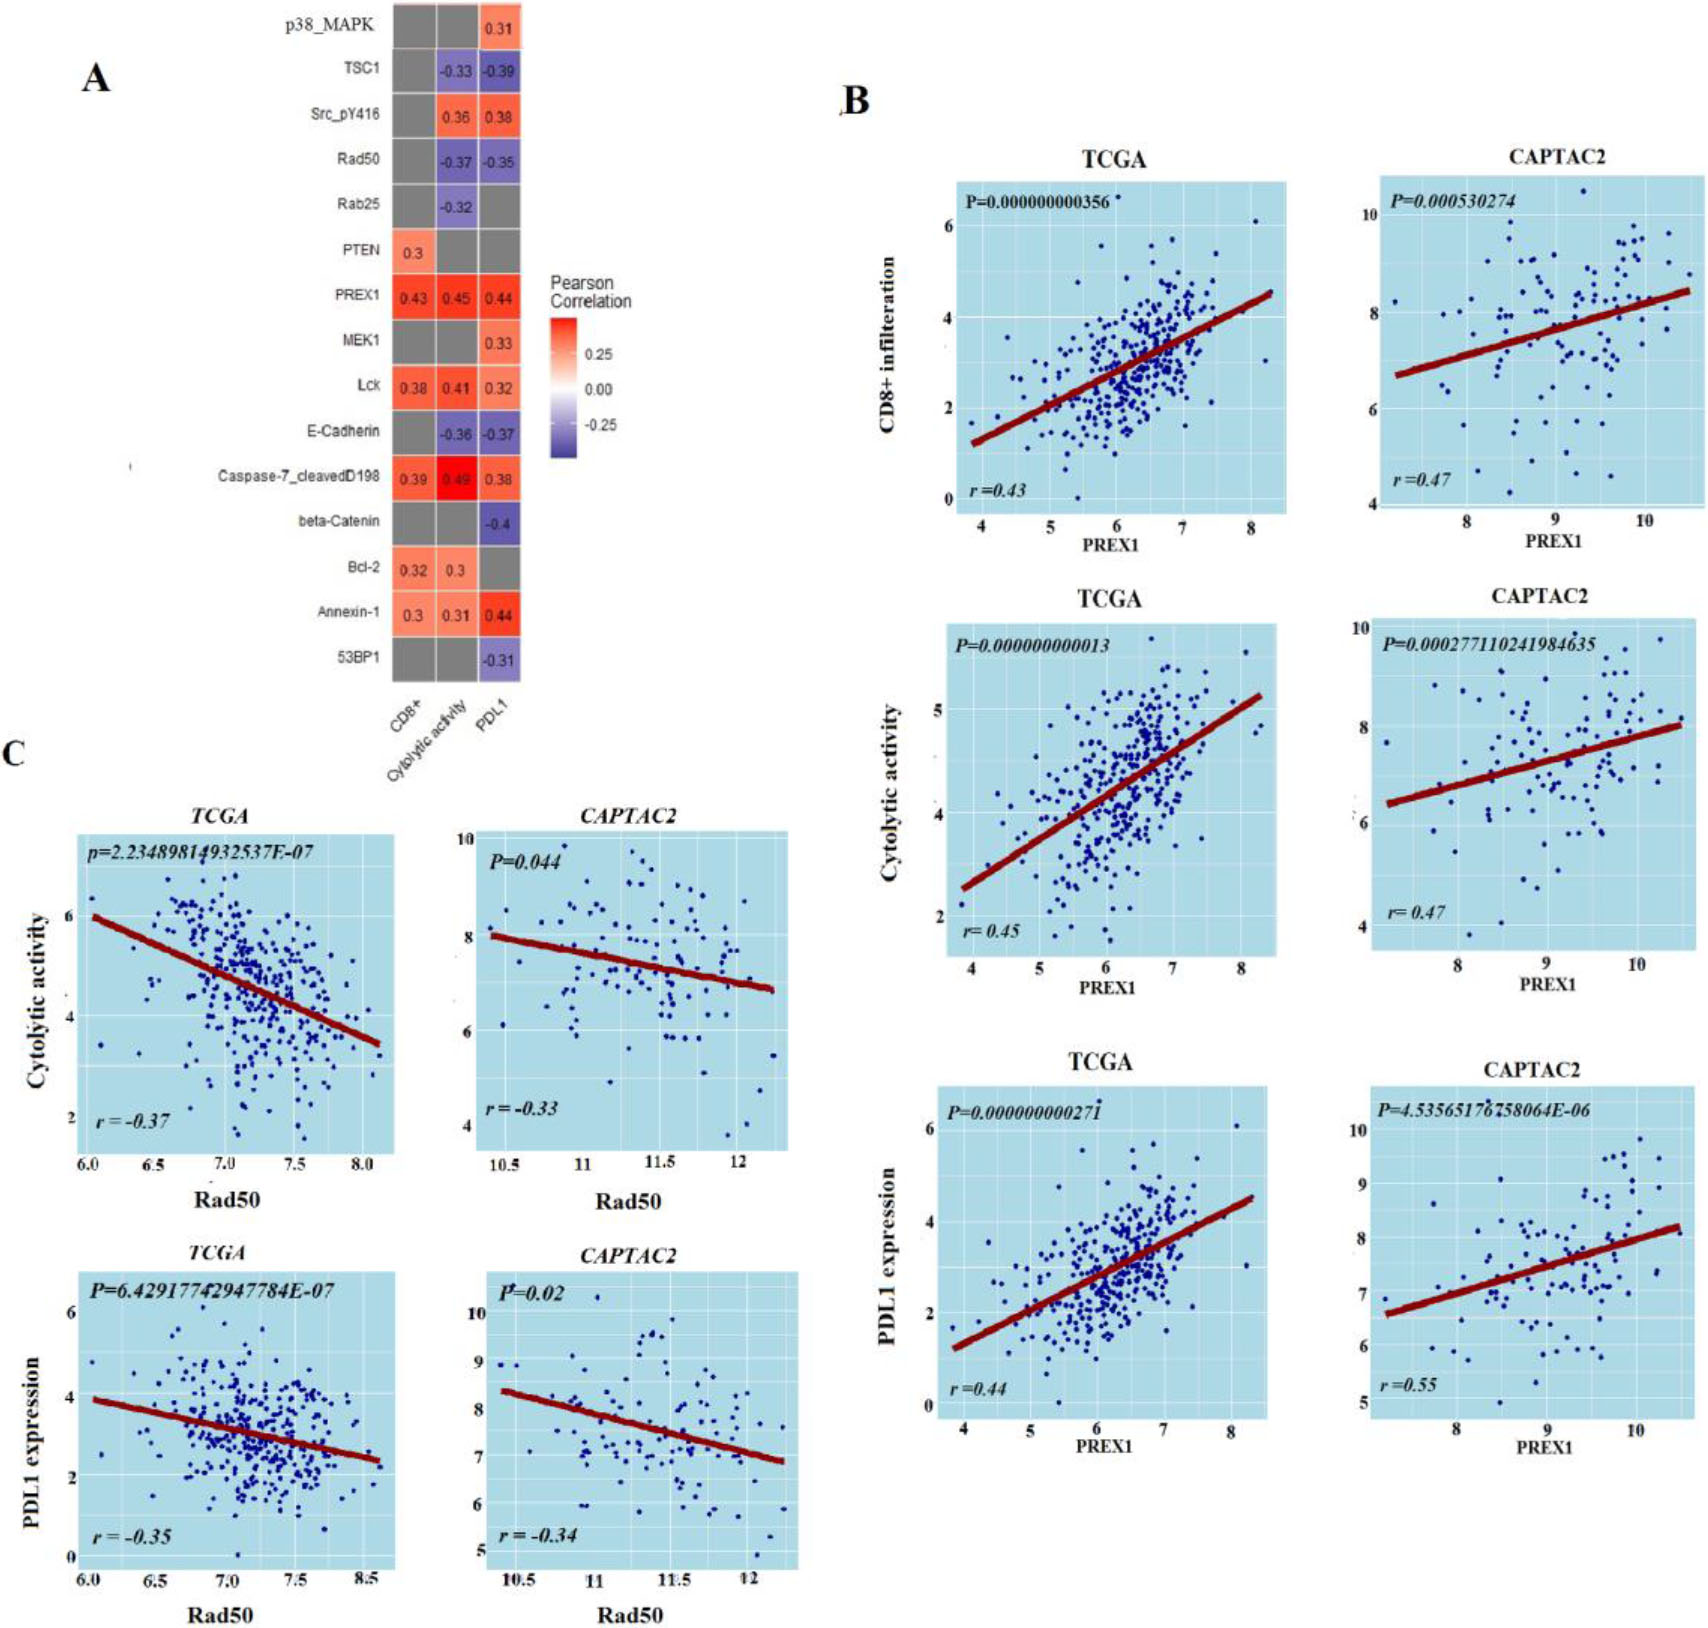
Figure 3.
Protein expression levels’ association with antitumor immune response. A. Proteins expression levels associated with antitumor immune response in TCGA-COAD, B. Correlation of PREX1 protein expression levels with antitumor immune responses in TCGA-COAD and CAPTAC2 datasets, C. Correlation of RAD50 protein expression levels with antitumor immune responses in TCGA-COAD and CAPTAC2 datasets. Correlation of PREX1 and RAD50 proteins expression levels with CD8
3.2Genes with expression levels associated with antitumor immune response in COAD
In the TCGA-COAD analysis, we found 152 genes with expression exhibiting a strong positive correlation with CD8
The TCGA-COAD gene expression data analysis produced 161 highly positively correlated genes (Pearson correlation coefficient
Similarly, the TCGA-COAD analysis reported a strong positive correlation of 111 genes’ expression levels with PD-L1 expression levels (Pearson correlation coefficient
We aimed to explore the potential of the genes we identified to have expression levels significantly correlated with ISELs in predicting tumor immune status. To do so, we filtered the genes having expression significantly correlated with the three immune signatures from the previous analysis (82 genes) (Supplementary Table S6). We used these 82 genes to perform cluster analysis using the TCGA samples for analysis and CAPTAC2 samples for validation (Fig. 2). The genes successfully clustered the samples of each dataset into four major classes with distinct immune profiles which we labeled, according to the three immune signatures’ enrichment levels in each class, “immune-high”, “immune-low”, “immune-intermediate(higher)”, and “immune-intermediate (lower)” classes. It is of note that the 82 gene clustering demonstrated greater sensitivity in identifying tumor immune phenotype compared to MSI status (Fig. 2).
3.3Proteins with expression levels associated with antitumor immune response in COAD
From TCGA-COAD we identified five proteins (PREX1, Caspase-7_cleavedD198, Lck, Bcl-2, PTEN, and Annexin-1) with expression levels significantly positively correlated with the enrichment levels of CD8
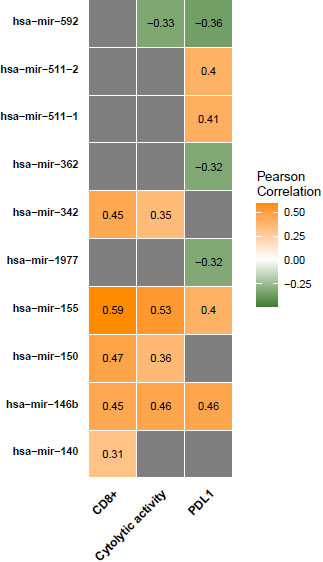
3.4miRNAs expression levels associated with antitumor immune response in COAD
We found that the expression of 12 miRNAs (hsa-mir-155, hsa-mir-150, hsa-mir-146b, hsa-mir-142, hsa-mir-342, hsa-mir-511-2, hsa-mir-511-1, hsa-mir-29c, hsa-mir-132, hsa-mir-140, hsa-mir-202, and hsa-mir-138-2) was significantly positively correlated with CD8
Figure 4.
miRNAs expression levels associated with antitumor immune responses in COAD. Correlation of miRNAs expression levels with CD8
3.5Identification of cancer-associated pathways whose activity is associated with antitumor immune response in CAOD
We applied ssGSEA analysis to calculate TCGA-COAD samples ssGSEA scores using oncogenic pathways gene sets. Based on these scores we investigated the correlation of the top 50 enriched oncogenic pathways in TCGA-COAD samples with ISELs. We found one pathway (CYCLIN_D1_UP.V1_DN) is positively correlated with CD8
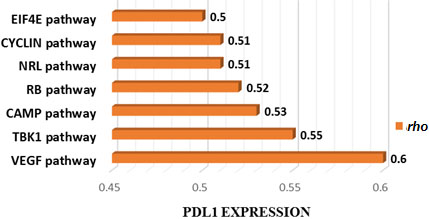
Figure 5.
Cancer-associated pathways whose activity is associated with PDL1 expression in TCGA CAOD. Seven cancer-associated pathways whose activity is positively associated with PDL1 expression in TCGA-COAD cohort (Spearman correlation coefficient (
4.Discussion
We have explored the association of gene mutations, gene expression, protein, and miRNA, from three comprehensive datasets with colon cancer anti-tumor immunity. We identified a significant number of gene mutations that are positively associated with antitumor immunity. However, the relatively limited number of the significantly correlated gene mutations replicated by the validation datasets indicated that only a limited number of these results were consistent enough to constitute a reliable marker of antitumor immune status. We filtered these validated gene mutations to further investigate association with colon cancer immunotherapy outcomes. We found two genes, TERT and ERBB4, which have mutations associated with poor survival in immunotherapy-untreated COAD patients and better survival with immunotherapy treatment. The association of these gene mutations with ICA and better prognosis when receiving immunotherapy highlights their potential as markers. The first gene, telomerase reverse transcriptase (TERT), is a known oncogene in which gain of function-mutations contribute to cell immortalization and cancer development [31]. TERT is an expressed tumor antigen in more than 80% of cancers and is recognized by both CD8
Moreover, we identified genes whose expression levels were significantly associated with antitumor immunity in COAD cohorts. We utilized the 82 genes validated by the two datasets as significantly correlated with the three antitumor immune signatures to conduct hierarchical clustering. Each dataset clustered into four clusters with differing immune profiles. The first cluster was characterized by high CD8
Protein expression data analysis, on the other hand, produced a limited number of proteins that are significantly associated with anti-tumor immunity. PREX1, previously reported as essential for TCR signaling and cytokine secretion was found positively correlated with the three antitumor immune signatures in our analysis [41]. DNA repair protein RAD50 which was already recognized as a marker of COAD poor survival and poor response to radiotherapy showed a negative correlation with the three ISELs [42]. DNA repair genes, including RAD50, have been highlighted in a previous cohort study as predictors of response to immune check-point therapy of cancer [43]. Using Bioinformatics analysis, our results validate this conclusion with RAD50. Similarly, miRNA analysis validated Six miRNAs as positively associated and four as negatively associated with antitumor immunity. Most of these miRNAs have well-described roles in processes including: fine-tuning tumor immune responses, tumor promotion, or tumor suppression [44, 45]. Hence, we suggest that the expression of the two proteins and the ten miRNAs can provide insights into the colon cancer immune status. However, additional research is necessary to verify their significance as biomarkers and/or targets for immune-modulating colon cancer therapy.
Finally, we identified few oncogenic pathways with activities significantly associated with antitumor immunity in COAD. These pathways are mainly involved in cell cycle control and tumor suppression, cell growth, cell migration, cell signaling, and immune responses [46, 47, 48, 49].
5.Conclusion
In conclusion, the association of the OMICs data features with COAD antitumor immune responses suggests the potential of such features in predicting the COAD patients’ prognosis and response to immunotherapy. We highlighted OMICs data features including: TERT, and ERBB4 gene mutations, an 82 gene expression signature, proteins expression of PREX1, and RAD50, and expression of 10 miRNAs, as potential markers of colon cancer immune status. Further pre-clinical and clinical studies are recommended to validate their potential as targets and/or markers of colon cancer immunotherapy.
5.1Data availability
The supporting data (tables and figures) of this study are included within the supplementary information files.
Funding
This work was supported by the Jiangsu Province Graduate Research and Innovation Program Project (grant number KYCX21_0664 to Qiushi Feng).
Declaration of competing interest
None declared.
Author contributions
Inas Elsayed: Conception, interpretation & analysis of data, preparation of the manuscript.
Nazik Elsayed: Analysis of data.
Qiushi Feng: Analysis of data.
Kiern Sheahan: Revision for important intellectual content.
Bruce Moran: Revision for important intellectual content.
Xiaosheng Wang: Conception, revision for important intellectual content, supervision.
Supplementary data
The supplementary files are available to download from http://dx.doi.org/10.3233/CBM-210222.
References
[1] | F. Bray et al., Global cancer statistics 2018: GLOBOCAN estimates of incidence and mortality worldwide for 36 cancers in 185 countries, CA Cancer J Clin 68: ((2018) ), 394–424. |
[2] | M. Arnold et al., Global patterns and trends in colorectal cancer incidence and mortality, Gut 66: ((2017) ), 683–691. |
[3] | S. Ahmed et al., Advances in the management of colorectal cancer: From biology to treatment, Int J Colorectal Dis 29: ((2014) ), 1031–1042. |
[4] | Ö. Türeci et al., Targeting the heterogeneity of cancer with individualized neoepitope vaccines, Clin Cancer Res 22: ((2016) ), 1885–1896. |
[5] | D.T. Le et al., PD-1 blockade in tumors with mismatch-repair deficiency, N Engl J Med 372: ((2015) ), 2509–2520. |
[6] | D.T. Le et al., Phase II open-label study of pembrolizumab in treatment-refractory, microsatellite instability-high/mismatch repair-deficient metastatic colorectal cancer: KEYNOTE-164, J Clin Oncol 38: ((2020) ), 11–19. |
[7] | M.J. Overman et al., Durable clinical benefit with nivolumab plus ipilimumab in DNA mismatch repair-deficient/microsatellite instability-high metastatic colorectal cancer, J Clin Oncol 36: ((2018) ), 773–779. |
[8] | E. Ryan et al., The current value of determining the mismatch repair status of colorectal cancer: A rationale for routine testing, Crit Rev Oncol Hematol 116: ((2017) ), 38–57. |
[9] | T. André et al., Analysis of tumor PD-L1 expression and biomarkers in relation to clinical activity in patients (pts) with deficient DNA mismatch repair (dMMR)/high microsatellite instability (MSI-H) metastatic colorectal cancer (mCRC) treated with nivolumab (NIVO)+ipilimumab (IPI): CheckMate 142, Ann Oncol 28: ((2017) ), v163. |
[10] | D.T. Le et al., A blueprint to advance colorectal cancer immunotherapies, Cancer Immunol Res 5: ((2017) ), 942–949. |
[11] | M.J. Overman et al., Where we stand with immunotherapy in colorectal cancer? Toxicity management, Am Soc Clin Oncol Educ Book 23: ((2019) ), 239–247. |
[12] | J. Guinney et al., The consensus molecular subtypes of colorectal cancer, Nat Med 21: ((2015) ), 1350–1356. |
[13] | J.N. Kather et al., Genomics and emerging biomarkers for immunotherapy of colorectal cancer, Semin Cancer Biol 52: ((2018) ), 189–197. |
[14] | B. Mlecnik et al., Integrative analyses of colorectal cancer show immunoscore is a stronger predictor of patient survival than microsatellite instability, Immunity 44: ((2016) ), 698–711. |
[15] | K.C.G. Berg et al., Multi-omics of 34 colorectal cancer cell lines – a resource for biomedical studies, Mol Cancer 16: ((2017) ), 1–16. |
[16] | S. Ghaffari et al., An integrated multi-omics approach to identify regulatory mechanisms in cancer metastatic processes, Genome Biol 22: ((2021) ), 1–28. |
[17] | N. Dalal et al., Omics technologies for improved diagnosis and treatment of colorectal cancer: Technical advancement and major perspectives, Biomed Pharmacother 131: ((2020) ), 110648. |
[18] | Y. Gan et al., Proteomic analysis reveals novel proteins associated with progression and differentiation of colorectal carcinoma, J Cancer Res Ther 10: ((2014) ), 89–96. |
[19] | S. Wang et al., Transcriptome analysis in primary colorectal cancer tissues from patients with and without liver metastases using next-generation sequencing, Cancer Med 6: ((2017) ), 1976–1987. |
[20] | X. Xu et al., Multi-omics analysis to identify driving factors in colorectal cancer, Epigenomics 12: ((2020) ), 1633–1650. |
[21] | Z. Yin et al., Detecting prognosis risk biomarkers for colon cancer through multi-omics-based prognostic analysis and target regulation simulation modeling, Front Genet 11: ((2020) ), 1–16. |
[22] | M. Kosinski and P. Biecek, RTCGA: The Cancer Genome Atlas Data Integration ((2020) ), available from: https://www.bioconductor.org/packages/release/bioc/html/RTCGA.html. |
[23] | D.M. Muzny et al., Comprehensive molecular characterization of human colon and rectal cancer, Nature 487: ((2012) ), 330–337. |
[24] | S. Vasaikar et al., Proteogenomic analysis of human colon cancer reveals new therapeutic opportunities, Cell 177: ((2019) ), 1035–1049. |
[25] | R.M. Samstein et al., Tumor mutational load predicts survival after immunotherapy across multiple cancer types, Nat Genet 51: ((2019) ), 202–206. |
[26] | M. Goto and S. Kanehisa, KEGG: Kyoto encyclopedia of genes and genomes, Nucleic Acids Res 28: ((2000) ), 27–30. |
[27] | Y. He and X. Wang, Identification of molecular features correlating with tumor immunity in gastric cancer by multi-omics data analysis, Ann Transl Med 8: ((2020) ), 1050. |
[28] | S. Hänzelmann et al., GSVA: Gene set variation analysis for microarray and RNA-Seq data, BMC Bioinformatics 14: ((2013) ). |
[29] | Y. Benjamini and Y. Hochberg, Controlling the false discovery rate: A practical and powerful approach to multiple testing, J R Stat Soc Ser B 57: ((1995) ), 289–300. |
[30] | A. Subramanian et al., Gene set enrichment analysis: A knowledge-based approach for interpreting genome-wide expression profiles, PNAS 102: ((2005) ), 15545–15550. |
[31] | M. Dratwa et al., TERT – Regulation and roles in cancer formation, Front Immunol 11: ((2020) ), 1–16. |
[32] | M. Zanetti, A second chance for telomerase reverse transcriptase in anticancer immunotherapy, Nat Rev Clin Oncol 14: ((2017) ), 115–128. |
[33] | H. Li, J. Li et al., TERT mutations correlate with higher TMB value and unique tumor microenvironment and may be a potential biomarker for anti-CTLA4 treatment, Cancer Med 9: ((2020) ), 7151–7160. |
[34] | C.S. Williams et al., ERBB4 is over-expressed in human colon cancer and enhances cellular transformation, Carcinogenesis 36: ((2015) ), 710–718. |
[35] | M.A. Schumacher et al., ErbB4 signaling stimulates pro-inflammatory macrophage apoptosis and limits colonic inflammation, Cell Death Dis 8: ((2017) ), e2622-12. |
[36] | Q. Wang et al., Distinct prognostic value of mRNA expression of guanylate-binding protein genes in skin cutaneous melanoma, Oncol Lett 15: ((2018) ), 7914–7922. |
[37] | Y. Cui et al., A new prognostic factor of breast cancer: High carboxyl ester lipase expression related to poor survival, Cancer Genet 239: ((2019) ), 54–61. |
[38] | L. Zhai et al., IDO1 in cancer: A Gemini of immune checkpoints, Cell Mol Immunol 15: ((2018) ), 447–457. |
[39] | Y.A. Lyons et al., Immune cell profiling in cancer: Molecular approaches to cell-specific identification, npj Precis Oncol 1: ((2017) ), 1–8. |
[40] | X. Zhu et al., A tumor microenvironment-specific gene expression signature predicts chemotherapy resistance in colorectal cancer patients, npj Precis Oncol 5: ((2021) ). |
[41] | K.N. Kremer et al., TCR-CXCR4 signaling stabilizes cytokine mRNA transcripts via a PREX1-Rac1 pathway: Implications for CTCL, Blood 130: ((2017) ), 982–994. |
[42] | V. Ho, L. Chung et al., MRE11 and ATM expression levels predict rectal cancer survival and their association with radiotherapy response, PLoS One 11: ((2016) ), 1–15. |
[43] | D. Hsiehchen et al., DNA repair gene mutations as predictors of immune checkpoint inhibitor response beyond tumor mutation burden, Cell Reports Med 1: ((2020) ), 100034. |
[44] | U. Testa et al., miR-146and miR-155: Two key modulators of immune response and tumor development, Non-coding RNA 3: (3) ((2017) ), 22. |
[45] | L. Jia et al., miR-142-5p regulates tumor cell PD-L1 expression and enhances anti-tumor immunity, Biochem Biophys Res Commun 488: ((2017) ), 425–431. |
[46] | J. Zhang et al., Cyclin D-CDK4 kinase destabilizes PD-L1 via cullin 3-SPOP to control cancer immune surveillance, Nature 553: ((2018) ), 91–95. |
[47] | V.L. Wehbi and K. Taskén, Molecular mechanisms for cAMP-mediated immunoregulation in T cells – role of anchored protein kinase a signaling units, Front Immunol 7: ((2016) ), 1–19. doi: 10.3389/fimmu.2016.00222. |
[48] | M.J. Waldner et al., VEGF receptor signaling links inflammation and tumorigenesis in colitis-associated cancer, J Exp Med 207: ((2010) ), 2855–2868. |
[49] | Y. Chien et al., RalB GTPase-Mediated Activation of the IκB Family Kinase TBK1 Couples Innate Immune Signaling to Tumor Cell Survival, Cell 127: ((2006) ), 157–170. |


