
Targeted proteomics for cancer biomarker verification and validation
Abstract
Targeted proteomics is a method that measures the amount of target proteins via liquid chromatography-tandem mass spectrometry and is used to verify and validate the candidate cancer biomarker proteins. Compared with antibody-based quantification methods such as ELISA, targeted proteomics enables rapid method development, simultaneous measurement of multiple proteins, and high-specificity detection of modifications. Moreover, by spiking the internal standard peptide, targeted proteomics detects the absolute amounts of marker proteins, which is essential for determining the cut-off values for diagnosis and thus for multi-institutional validation. With these unique features, targeted proteomics can seamlessly transfer cancer biomarker candidate proteins from the discovery phase to the verification and validation phases, thereby resulting in an accelerated cancer biomarker pipeline. Furthermore, understanding the basic principles, advantages, and disadvantages is necessary to effectively utilize targeted proteomics in cancer biomarker pipelines. This review aimed to introduce the technical principles of targeted proteomics for cancer biomarker verification and validation.
1.Introduction
Figure 1.
Acceleration of verification and validation phases by targeted proteomics. A. Without targeted proteomics, the candidate proteins identified by proteomic studies need to be quantified by antibody-based measurements, such as ELISA or western blot, in the verification phase. The proteins, for which antibodies are not available, are dropped out from the pipeline. The proteins approved during verification move on to the validation phase. Specific antibodies can be used in some proteins for western blot, but not for ELISA. In such cases, the proteins are eliminated from the pipeline. B. By utilizing targeted proteomics, the candidate proteins can be quantified simultaneously. The proteins qualified in the verification phase can also be measured by targeted proteomics in the validation phase. ELISA, enzyme-linked immunosorbent assay; WB, western blot.
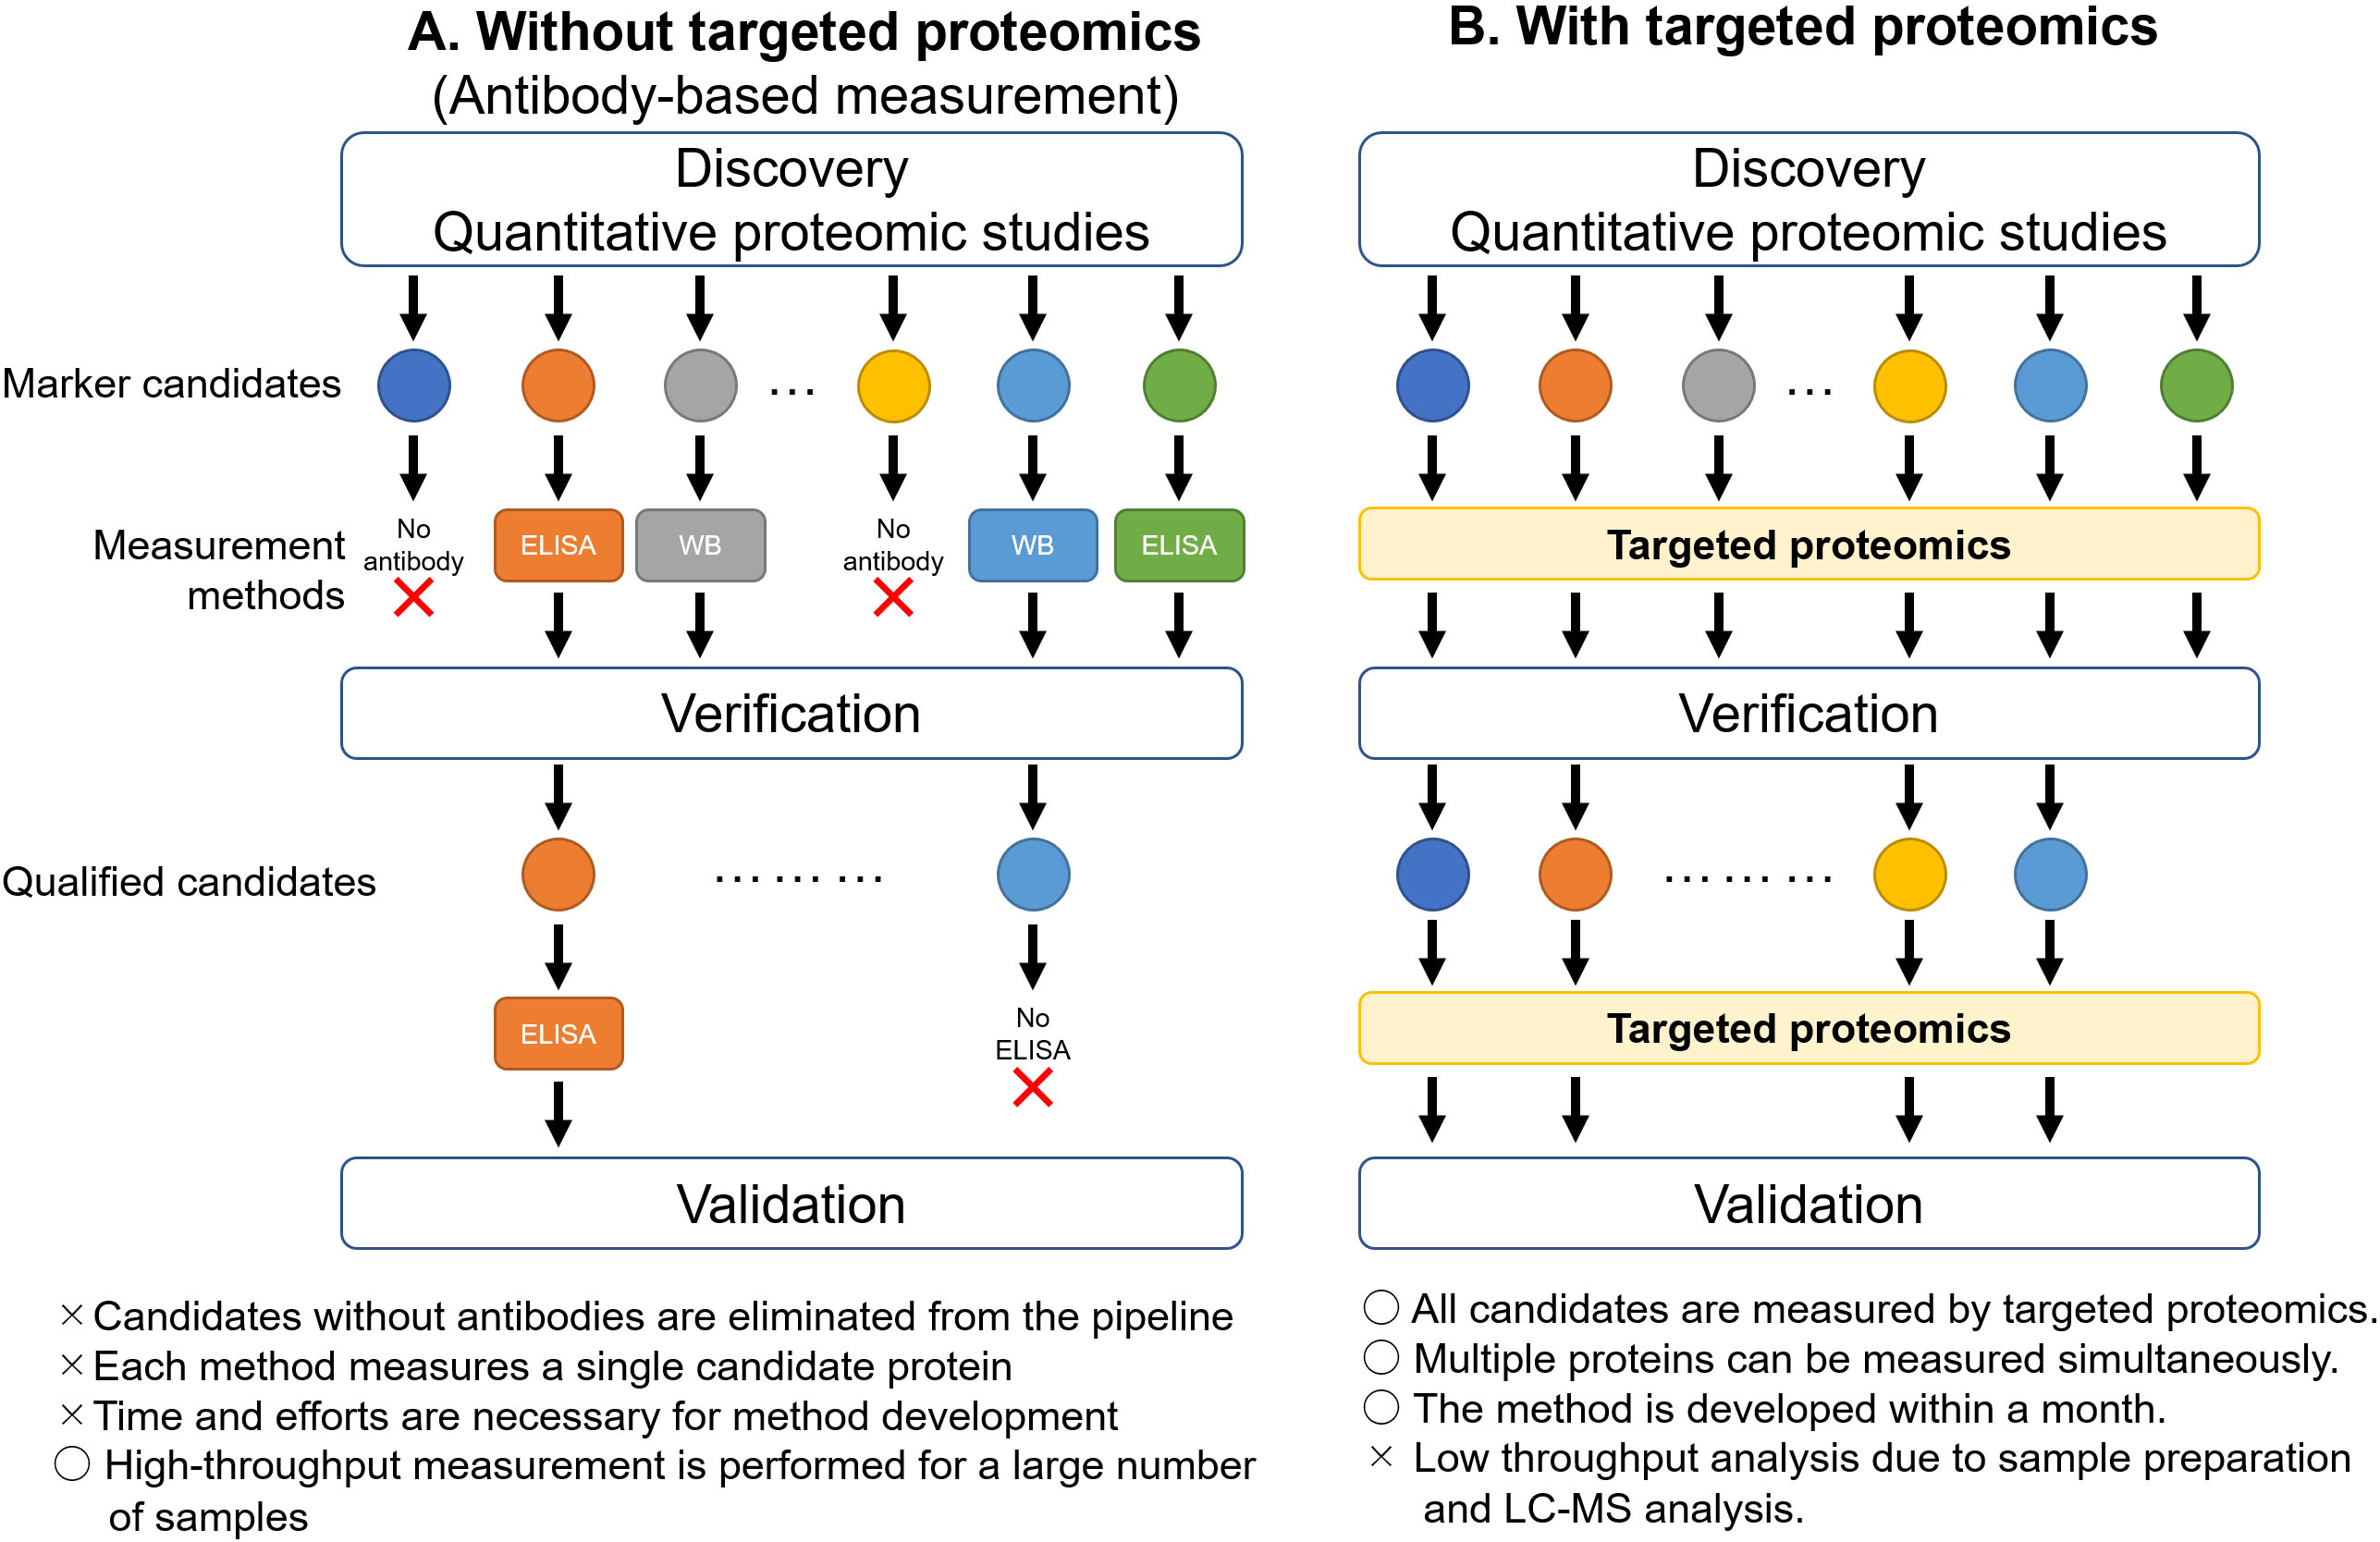
Proteomics is the large-scale study of proteins that provide comprehensive and quantitative information on proteins in biological samples, and is an essential methodology in cancer biomarker research [1, 2]. Biomarker pipelines comprise multiple phases, such as discovery, verification, and validation [3]. Proteomic analysis can detect tens to hundreds of biomarker candidate proteins via unbiased quantitative proteome comparison between healthy tissues and cancerous tissues in the discovery phase. Despite its superior ability in biomarker discovery, proteomics has faced challenges in the verification and validation phases (Fig. 1). In the verification phase, the candidate proteins are measured in an increasing number of clinical samples, and potent marker candidates are selected from the first candidate list. In the validation phase, the potent candidates are measured in a larger cohort, preferably from multiple institutes. As the biomarker pipeline proceeds to the next phase, the number of measured proteins decreases, whereas the number of samples increases. Hence, the method of measuring protein levels differs depending on the demands of each phase. Proteomics is a suitable methodology for marker discovery, but not for verification and validation, owing to its low throughput and accuracy in protein quantification. Antibody-based protein quantification, such as enzyme-linked immunosorbent assay (ELISA), is a suitable and widely applied method for verification and validation as it can measure multiple clinical samples in a single experiment [3]; however, ELISA requires the use of antibodies for each target candidate protein and limits the quantification of multiple proteins. These limitations interfere with several marker candidates discovered by proteomics during the transition to the verification phase (Fig. 1A). Hence, a new proteomics-based protein quantification method is necessary to improve the biomarker pipeline.
Presently, proteomics has two different methodological directions: quantitative proteomics and targeted proteomics [4]. Quantitative proteomics is a standard proteomic method that allows the comprehensive comparison of protein expressions and is used in biomarker discovery. Targeted proteomics is used to quantify only target proteins using liquid chromatography-tandem mass spectrometry (LC-MS/MS), and was selected as the Method of the Year in 2012 by the Nature Methods journal [5]. Targeted proteomics can measure several hundred target proteins in a single run by spiking stable isotope-labeled internal standard peptides. Previous studies have reported that approximately 250 proteins were quantified in human plasma per single run by targeted proteomics [6, 7]. Furthermore, the development of targeted proteomics is completed within a month. Due to these advantages, targeted proteomics seamlessly brings the candidate proteins into the verification and validation phases from the discovery phase (Fig. 1B). This review aimed to introduce the technical principles of targeted proteomics for cancer biomarker verification and validation.
Figure 2.
Peptide detection by MRM/SRM mode with targeted proteomics. The scheme depicts peptide detection, which comprises the amino acid sequence PEPTIDEK, by triple quadrupole MS. The first mass filter (Q1) isolates PEPTIDEK from a peptide mixture with an isolation window of 464.7. In the collision cell (Q2), various fragments are produced from PEPTIDEK; one of the fragments, IDEK, was isolated from the fragments produced in Q3 with an isolation window of 504.3. The number of fragments was enumerated using a detector.
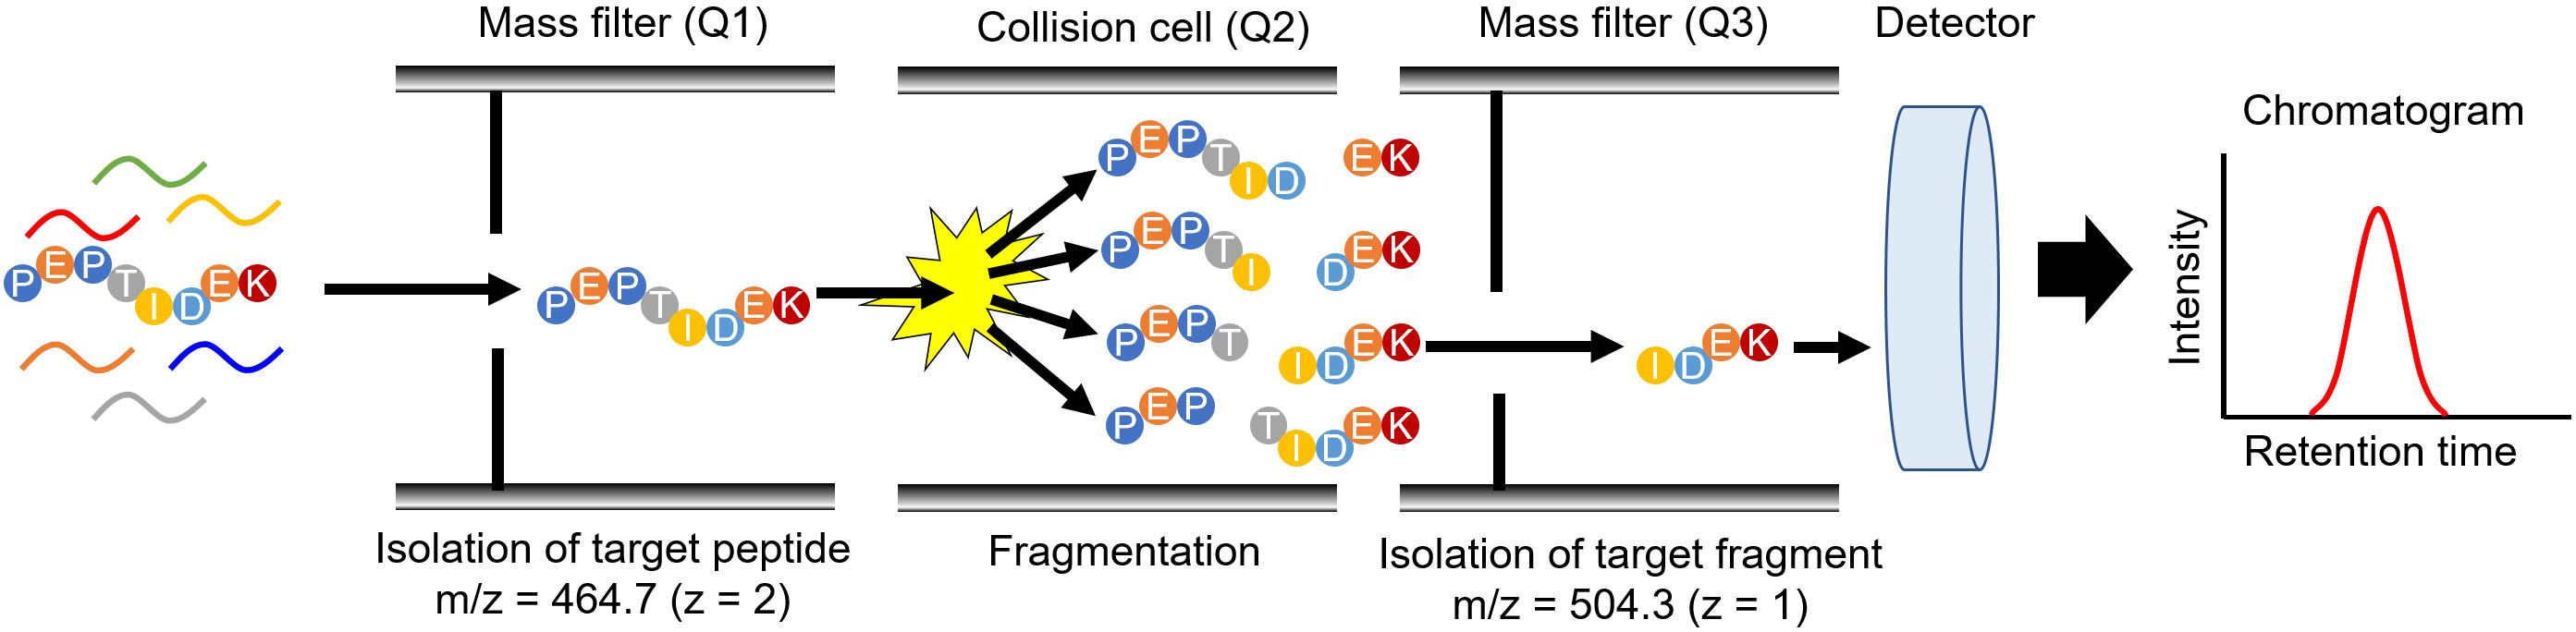
Figure 3.
Precise quantification of peptides with internal standard in targeted proteomics. A. Peptide quantification without internal standard. Low- and high-complex samples contain the same amount of target peptide. Due to the ion suppression effect, the amount of target peptide in high-complex sample is underestimated when the amount was determined based on the peak area. B. Peptide quantification using internal standard. In high-complex samples, ion suppression occurs at same degree on target peptide and internal standard peptide. Therefore, the peak area ratio of target peptide to internal standard peptide in a high-complex sample is same as that in a low-complex sample.
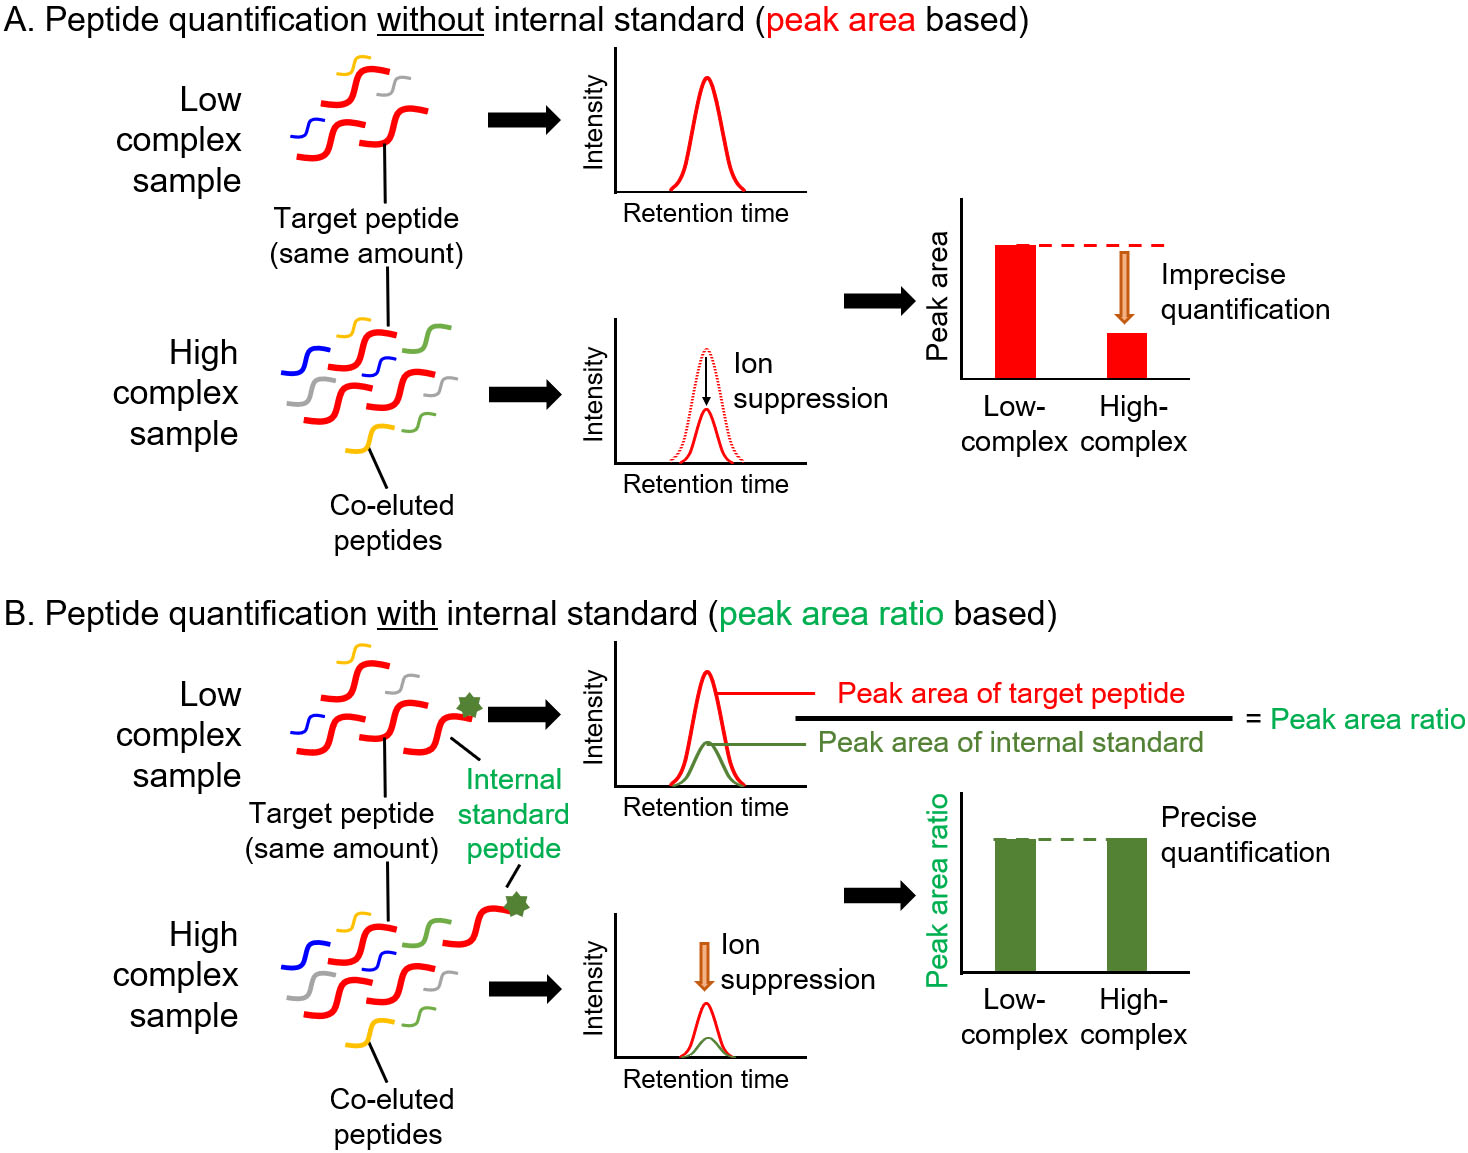
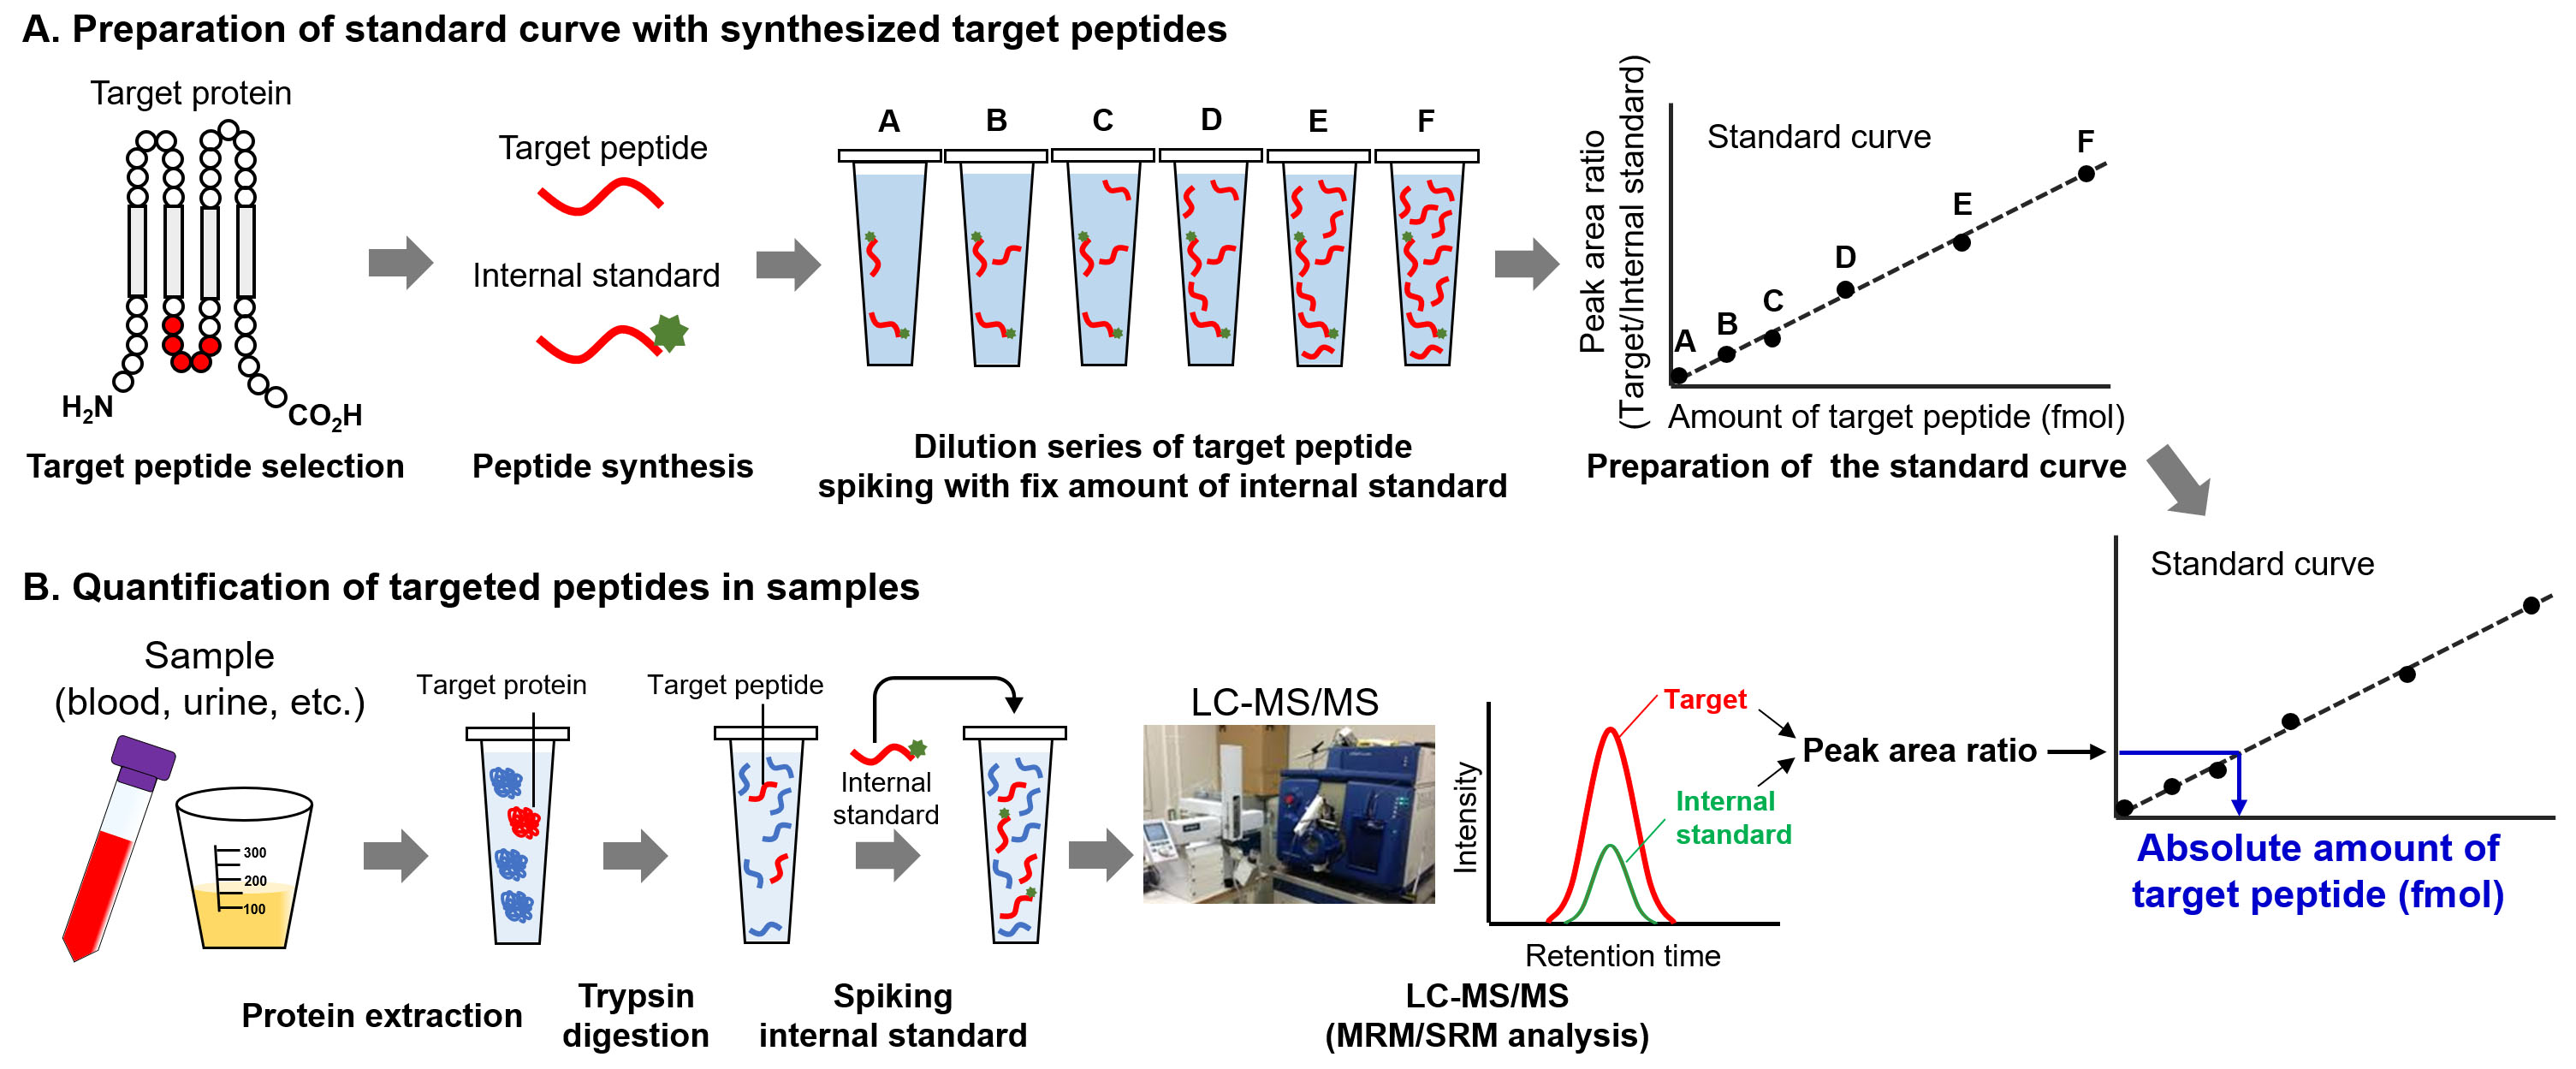
Figure 4.
Procedure of absolute quantification of proteins by targeted proteomics. A. Preparation of standard curve. After selecting the target peptide, the unlabeled- and stable isotope-labeled peptides are synthesized. The dilution series of target peptides are prepared, and fixed amount of internal standard is spiked in each standard peptide sample. Using LC-MS/MS, the standard curve of target peptide amounts against peak area ratio is produced. B. Quantification of target peptide. After trypsin digestion, the internal standard peptide at fixed amount is spiked in the digested samples. After LC-MS/MS analysis, the amount of target peptide was determined from peak area ratio using a standard curve.
2.Principles of targeted proteomics
Targeted proteomics measures peptides produced from the parental target protein by protease digestion [8, 9]. The biological samples were digested with a protease, typically trypsin, and the digested samples were subjected to LC-MS/MS. Thereafter, the peptides were separated by LC, and eluted peptides were directly introduced into a mass spectrometer. Triple quadrupole MS is a technique used for performing targeted proteomics (Fig. 2) and for quantifying small molecules, such as drugs. In targeted proteomics, MS quantifies the digested peptide using the same principle as that for quantifying small molecules [8]. The MS data acquisition method is known as multiple reaction monitoring (MRM) or selected reaction monitoring (SRM), which is utilized to isolate target peptides from the peptide mixture using two mass filters (Q1 and Q3) and to enumerate the peptide count passing through these filters. The combination of Q1 and Q3 was specific to each target peptide. In Fig. 2, Q1 and Q3 are set as 464.7 and 504.3 to detect the peptide with amino acid sequence of PEPTIDEK, and these setting values can be calculated based on the amino acid sequence. As the mass filters with Q1 and Q3 can be changed every 10–100 ms, the MRM/SRM analysis can measure multiple peptides simultaneously. Advanced data acquisition methods have been developed to enhance the specificity and comprehensiveness as parallel reaction monitoring (PRM) and data-independent acquisition (DIA). The details of these advanced methods are described in other review articles [10, 11].
The unique procedures involved in targeted proteomics are the spiking of internal standard peptides in the digested samples and simultaneous measurement of target and internal standard peptides for quantification [8, 9, 12]. For MS-based quantification, the abundance of the target peptide was calculated from the area counts of the target peak on the MS chromatogram. Notably, the peak area counts are affected not only by target peptide abundance but also by coeluted peptides, which is referred to as the ion suppression or matrix effect (Fig. 3A) [13]. The internal standard peptide has the same amino acid sequence as the target peptide, and the C-terminal amino acid (lysine or arginine) is usually labeled with stable isotopes. Therefore, the internal standard peptide has the same physicochemical properties as the target peptide except for molecular weight, which allows the similar separation on the liquid chromatograph and provides the same degree of ion suppression effect between the internal standard and target peptides. For this reason, targeted proteomics can calculate the peptide abundance based on the peak area ratio of target peptide to internal standard peptide for accurate quantification (Fig. 3B). An additional advantage of targeted proteomics using internal standard peptides is that it allows absolute quantification. The absolute quantification of biomarkers is important for verification and validation because absolute values are considered as cut-off values for diagnosis. The absolute values of the target peptide were determined using a standard curve prepared with a dilution series of synthesized unlabeled target peptides and a fixed amount of labeled internal standard peptides (Fig. 4). The absolute amounts of the synthesized peptides were determined by amino acid analysis. The target peptides and internal standard peptides were added to the digested peptide sample, whose content is similar to that of the sample to be measured. When the blank sample was difficult to prepare, we used a trypsin-digested sample of an Escherichia coli lysate [14]. The concentration range for quantification was determined based on the linearity and percentage of accuracy. The lowest point of the standard curve (lower limit of quantification) should provide a signal-to-noise ratio of greater than 10, and the signal-to-noise ratio of the lower limit of detection was 3.
In addition to the aforementioned features, the absolute quantification of multiple proteins by targeted proteomics was beneficial for method development, which can be completed through the following procedures: peptide selection, peptide synthesis, and method optimization, as described in the next section [8, 9]. Even for multiple proteins, this method can be developed within a month.
3.Development of quantification method for targeted proteomics
The protein quantification method for targeted proteomics was developed using the following procedures: target peptide selection, target peptide synthesis, and method optimization (Fig. 5) [9, 15, 16]. Target peptide selection is a key step in determining the specificity and sensitivity of the method. The target peptide should be unique to the target protein and should have a high signal intensity for MS analysis [9]. In general, the proteome data were obtained from the same samples via LC-MS/MS for marker discovery. A high-sensitivity peptide can be found in the proteome data based on the intensity information. The uniqueness of the peptide can be evaluated by performing a similarity search in a protein database, such as a BLAST search in the UniProt database (https://www.uniprot.org/blast/). The peptide with the highest intensity is not always selected as the target peptide, and peptides containing amino acids that affect quantification should be avoided [9]. A peptide comprising methionine is not preferred as the target peptide because of its oxidation properties. MS distinguishes peptides with and without oxidation, as they differ in their mass weights. When the peptide containing methionine is selected, the synthesized peptide and digested samples need to be oxidized by H
Figure 5.
Outline of method development and quantification with targeted proteomics.
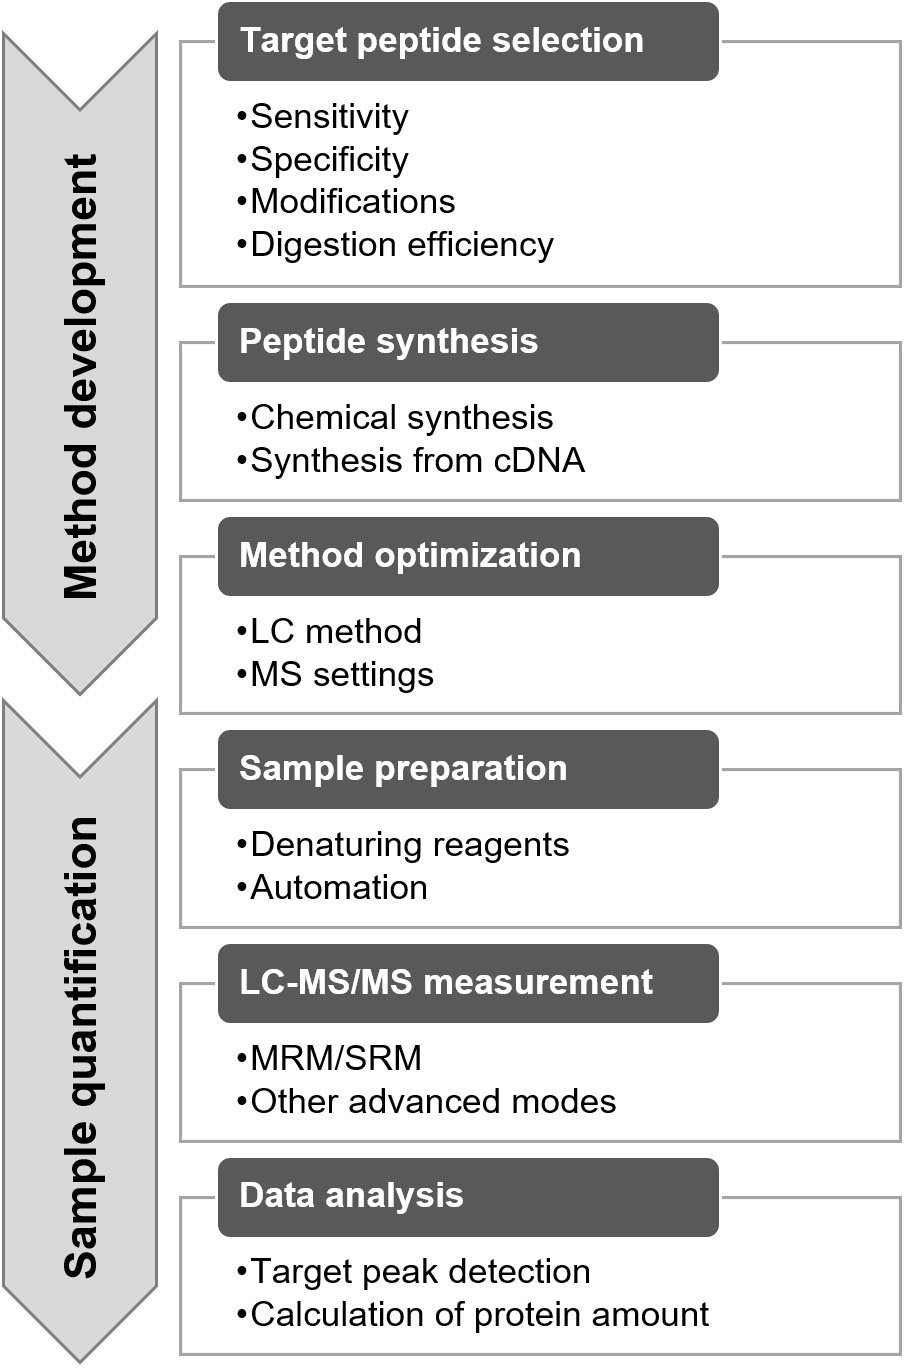
Furthermore, the factors affecting trypsin digestion need to be considered. When a peptide with low digestion efficiency was selected, the quantification value was underestimated. Digestion efficiency varies depending on the peptide and digestion method used. This efficiency can be validated by assessing the digestion-time dependency of the quantified values [18]. In general, the tandem cleavage sites, such as KK, KR, RK, and RR; the cleavage site before proline, such as KP and RP; and the transmembrane domain showed lower trypsin digestion efficiency. Detailed information on target peptide selection has been reported in previous studies [9, 19].
After selection, the target peptides were synthesized (Fig. 5). Stable isotope-labeled peptides were used as the internal standard, whereas unlabeled peptides were used to generate a standard curve (Fig. 4A). Two synthetic methods are used for performing targeted proteomics. One is chemical synthesis, and the other involves the synthesis of an artificial protein that concatenates the target peptides from cDNA, the so-called QconCAT [20, 21]. Commercial services are provided by several companies for chemical peptide synthesis with quantitative information via amino acid analysis, termed as the AQUA peptide [22]. Recently, a new and easy approach has been used for the quantification of synthesized peptides [23]. The peptide was synthesized using a trypsin-cleavable quantification tag (Q-tag). The amount of peptide was determined based on the ultraviolet absorbance of the Q-tag; then, the Q-tag was cleaved by trypsin digestion and was used as a standard.
QconCAT is an artificial protein that exhibits the concatenation of target peptides (Fig. 6) [24]. The labeled QconCAT is synthesized by E. coli or a cell-free system in the presence of stable isotope-labeled lysine and arginine. After purification, trypsin digestion of QconCAT produces internal standard peptides. The advantage of the QconCAT strategy is its cost-effectiveness when numerous internal standard peptides are prepared; however, QconCAT is not suitable for absolute quantification because the concentrations of synthesized target peptides cannot be accurately determined compared with chemically synthesized peptides. The QconCAT strategy is suitable for developing relative quantification methods for numerous candidate marker proteins during the verification phase. Chemically synthesized peptides are appropriate for developing absolute quantification methods for a limited number of marker proteins in the validation phase.
Figure 6.
Synthesis of stable isotope-labeled internal standard peptide by QconCAT.
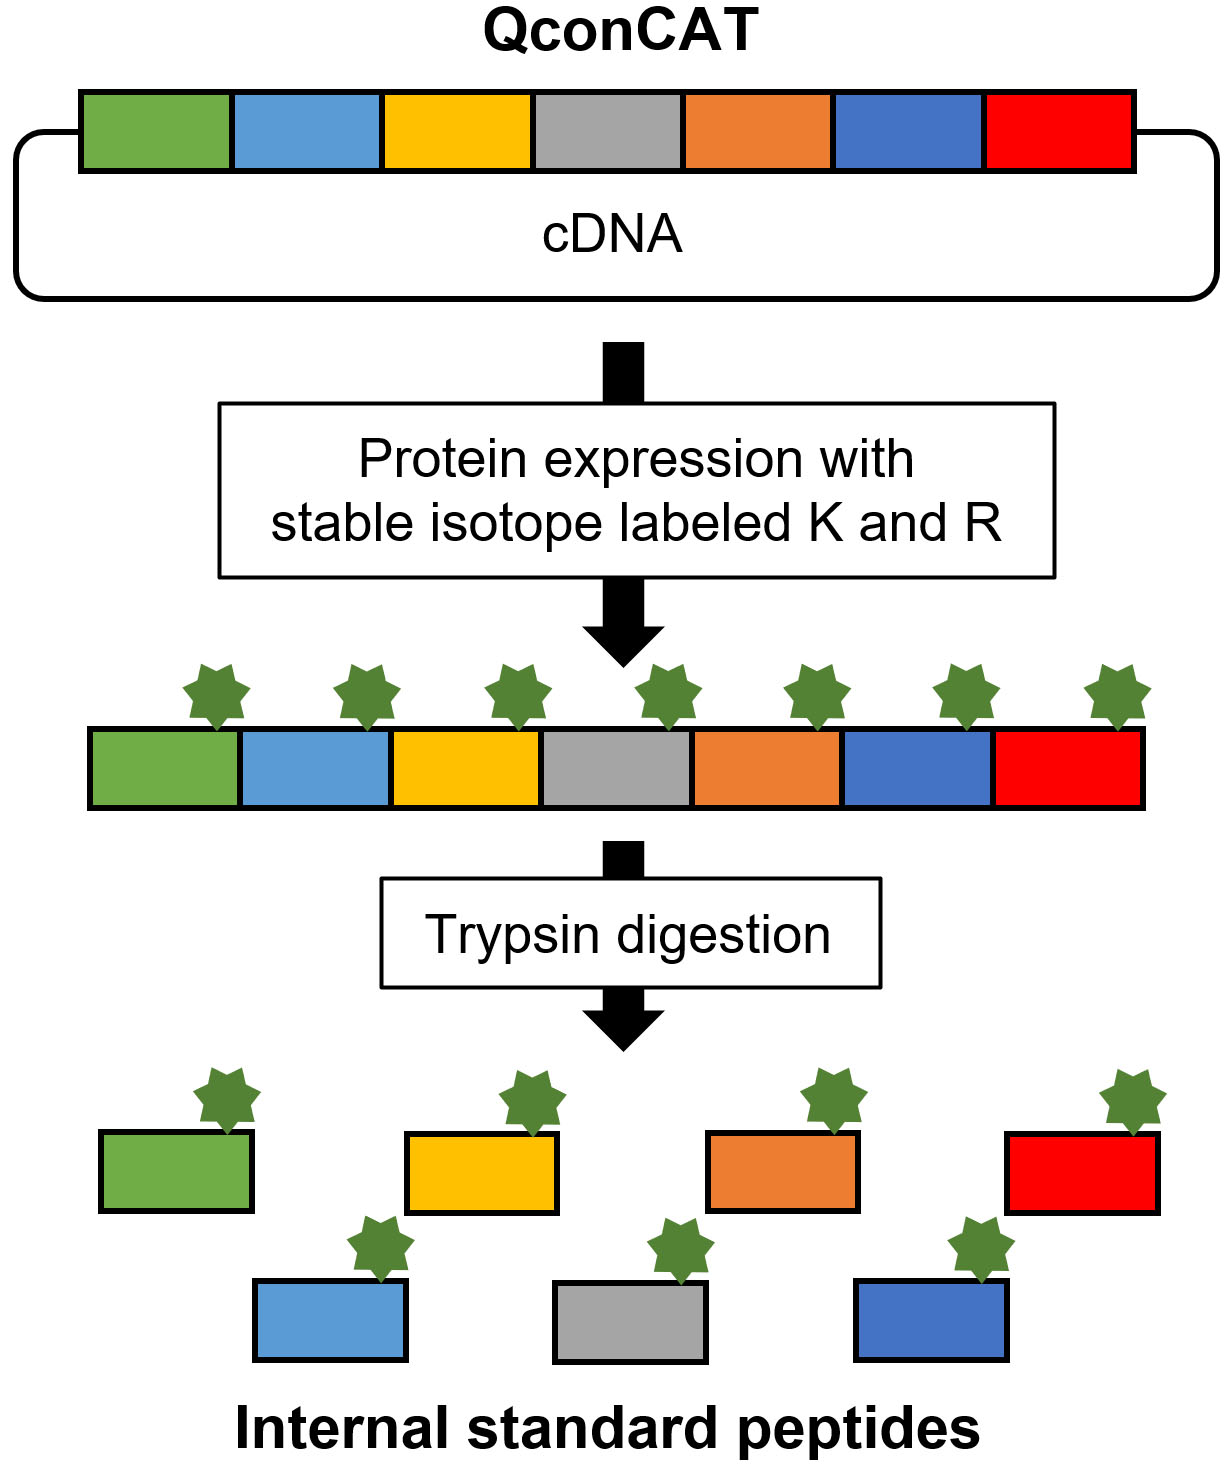
Figure 7.
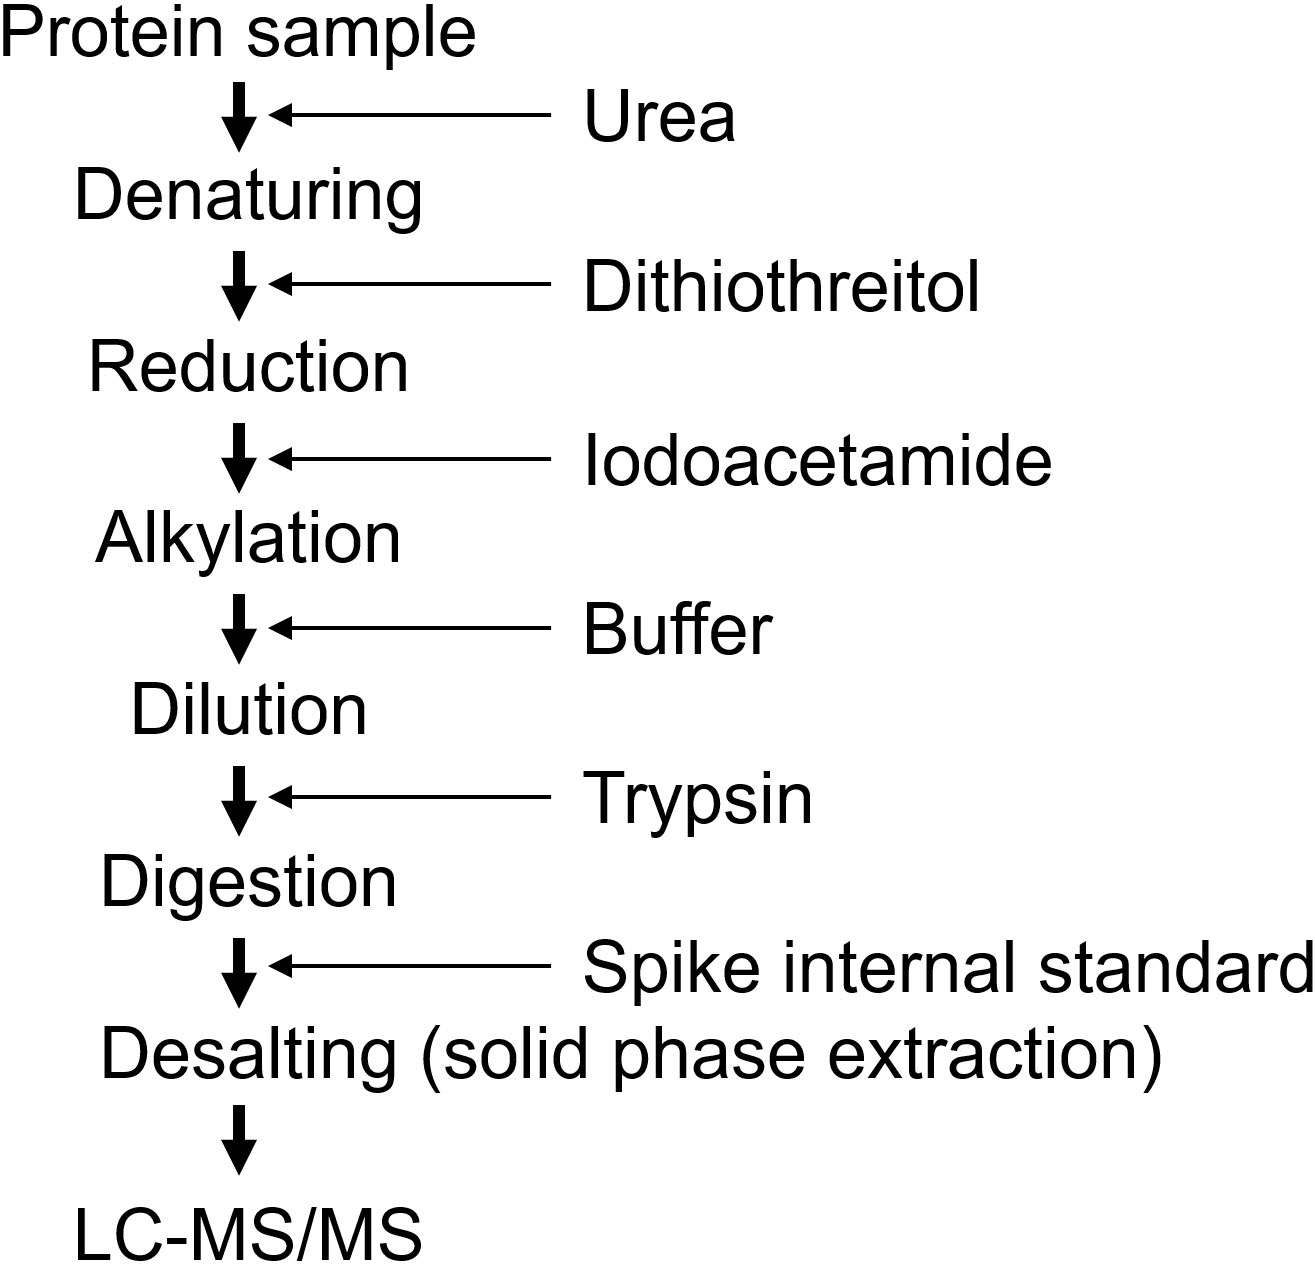
Sample preparation procedure using urea.
After synthesis, peptide detection by MS must be optimized (Fig. 5) [9, 25]. One of the important optimization methods is the selection of appropriate mass filters (Q1 and Q3). The candidate values of Q1 and Q3 can be calculated based on the amino acid sequence, and all settings can be tested using single or several measurements. Based on the data, three to four sets of Q1 and Q3 were selected in the order of sensitivity. By completing the optimization, the method was readied for sample measurement. The peptide selection, synthesis, and optimization took 1 d, 1 month, and 1 d, respectively.
4.Sample preparations for targeted proteomics
Targeted proteomics measures digested peptides instead of intact proteins, and the digestion efficiency is a crucial step for accurate quantification [9, 15, 16]. A lower digestion efficiency results in underestimation and higher variance during quantification. The sample preparation undergoes three processes (Fig. 7). The first process involves solubilizing and denaturing proteins, the second process is digestion, and the third process is desalting. Protease digests solubilized proteins, and the solid protein structure inhibits digestion. Therefore, the protein samples were denatured in the presence of surfactant(s). Furthermore, disulfide bonds are broken by reduction, and oxidation is prevented by alkylation. Thereafter, the samples were digested with a protease, typically trypsin. Because denaturing reagents inhibit the protease activity, it is necessary to remove or dilute the denaturing reagents before digestion. For urea, the protein samples were denatured by incubation with 8 M urea, and the samples were diluted to 1 M urea before digestion. Various preparation methods with different detergents have been reported, and the methods are selected based on the sample used [26, 27]. Biomarkers are usually measured in biofluids, such as serum, plasma, and urine. In these cases, the sample is generally prepared in urea during the validation phase, although the denaturing efficiency of urea is weaker than that of detergents such as sodium dodecyl sulfate (SDS) [28]. Sample preparation using urea is conducted by adding reagents sequentially (Fig. 7) and can be applied to large-scale samples by automated preparation [29]. To measure proteins in the tissues, a strong detergent should be used for preparation, such as the Phase Transfer Surfactant (PTS) method with sodium deoxycholate and the Filter Aided Sample Preparation (FASP) method with SDS [30, 31, 32].
Trypsin is digested at the C-terminus of lysin and arginine and is generally used as a protease for proteomics. Moreover, to enhance digestion, lysyl endopeptidase (Lys-C) is used in combination with trypsin [9]. The samples were partially digested with Lys-C and then sequentially digested with trypsin. Alternatively, the samples were simultaneously digested with trypsin and Lys-C. The digestion period of trypsin for the general proteome analysis was 16 h; however, via optimization of target proteins, a shorter period is sufficient for digestion. The internal standard peptides at fixed amounts were spiked into the sample after digestion to normalize the recovery of the desalting process (Fig. 7). Desalting removes salts and peptides that are not separated by LC, such as hydrophilic peptides that are not retained in the column and hydrophobic peptides that are not eluted from the column. This cleaning is necessary to maintain the sensitivity of the MS and the separability of the LC. As the amount of protein is relatively small (10–50
5.LC-MS/MS analysis and data processing for targeted proteomics
The prepared samples were analyzed individually, and multiple target peptides were simultaneously measured in a single run. Each run lasted 10–60 minutes. The shorter run provides higher throughput and decreases sensitivity owing to the enhancement of the ion suppression effect. Increasing the number of measuring peptides attenuates the quantification accuracy by decreasing the measuring time of each peptide and the number of measuring points of each peak. Therefore, the running time and number of peptides for each run should be optimized for each experiment [34, 35].
Each peptide was measured with a specific set of Q1 and Q3, termed transitions. For peak identification and accurate quantification, usually 3–4 transitions are used for each target peptide, and the same transition sets are used for each corresponding internal standard [9]. The amounts of peptides were calculated based on the peak area ratios of MS chromatograms from transitions, and Skyline software was used for peak identification and peptide quantification in targeted proteomics [36].
The target peptide peak was identified from the peak of the internal standard peptide. First, the internal standard peak was identified by the overlap of the peaks of all transitions in the same retention time. Thereafter, the target peak was observed in the same retention time as the internal standard peak. Peptide quantification is performed from multiple transitions using several different methods of peak area ratio handling, such as the ratio of the summed area from all transitions or the ratio of representative transitions. In this review, we introduced the different calculation methods to maximize the quantification reliability [9]. The peptide amounts were calculated based on the peak area ratios of each transition. When the peptide was measured with four sets of transitions for the target and internal standard peptides, four quantification values were calculated. In principle, the values from the transitions for the same peptide are the same; however, certain variances were observed due to system noise and/or the overlapping signals of other peptides. The amount of peptide was calculated as the average of the values from transitions, and the reliability was assessed by applying the coefficient of variation, with a value below 20%–50% depending on the purpose [9, 14]. The disadvantage of this calculation is that the sensitivity of the peptide is set to the transition with the lowest sensitivity.
6.Application of targeted proteomics: Pancreatic cancer biomarkers
This review introduced our reports on biomarkers for detecting pancreatic cancer as an application of targeted proteomics [17, 29]. We performed biomarker discovery using a plasma microarray with an antibody. A total of 362 microarray spotted plasma samples from healthy controls and patients with various cancers, including pancreatic ductal adenocarcinoma (PDAC), were reacted with antibodies against 130 proteins, of which genes were upregulated in PDAC [37]. As a result, 23 proteins were identified as candidate biomarkers for PDAC detection. By adding five proteins related to the identified candidates, we developed quantification methods for 28 proteins using targeted proteomics for verification and validation. The plasma samples for verification were obtained from 38 patients with stage I and II PDAC and 65 healthy controls. Validation was performed in 491 plasma samples from 101 PDAC patients, 38 healthy controls, 50 patients with pancreatic diseases, and 302 other cancer patients. To analyze a large number of samples, sample preparations were conducted using an automated sample handling machine (Hamilton Starlet), and the run time for LC-MS/MS analysis was 10 min in the validation phase. The levels of 28 proteins were quantified in the verification set, and two proteins, IGFBP2 and IGFBP3, were identified as potent biomarker candidates for distinguishing patients with resectable PDAC from healthy controls. CA19-9 is a commonly used biomarker for detecting PDAC. The combination of CA19-9, IGFBP2, and IGFBP3 resulted in a higher AUC than that of CA19-9 alone in both the verification and validation sets.
The advantage of targeted proteomics against ELISA is its specificity. Targeted proteomics can specifically quantify modifications and mutations based on the molecular weight differences [8]. We verified hydroxylated
Blood samples were used in the clinical sampling of cancer biomarkers in the aforementioned studies. The preanalytical conditions for preparing plasma and serum were presumed to affect the protein levels in the samples. The biomarkers must be stable during the preanalytical preparation. Using quantitative proteomics, we evaluated the stability of 176 plasma proteins under storage conditions at room temperature for 0–30 min or at 0–5
7.Future perspectives for targeted proteomics in cancer biomarker research
Targeted proteomics presents unique features to accelerate biomarker verification and validation phases, and its applications have gained immense interest in marker research. After the validation phase, the biomarker proteins were moved to the clinical evaluation phase. Handling numerous samples during clinical evaluation remains a challenge in the area of targeted proteomics, and antibody-based quantification is still carried out in this phase. The throughput of sample preparation and LC-MS/MS measurement should be improved in to apply targeted proteomics for clinical evaluation. Trypsin digestion takes the longest period during sample preparation, and rapid digestion can improve the throughput. Digestion under high temperature or high pressure has been reported to improve the digestion efficiency [40]. Immobilized trypsin is also utilized for rapid digestion [41]. The kits used for rapid digestion were commercially available. Because targeted proteomics only measures the amount of target proteins, full digestion is required only for the target protein, and not for all proteins. Therefore, despite the use of standard digestion protocols, the digestion period can be shortened by monitoring the digestion efficiency of the target proteins. Furthermore, automation is necessary for sample preparation to handle numerous clinical samples. Automated sample preparation systems are commercially available using liquid handlers [42].
Even when abundant samples are prepared, the throughput of LC-MS/MS remains a bottleneck. LC-MS/MS was used for the individual measurements of the digested samples. Therefore, shortening the run time improves the measurement throughput. The method without an LC column can also shorten the run time. We reported the target peptide quantification using matrix-assisted laser desorption/ionization (MALDI)-MS, which takes less than 1 min per sample [43]. Shortening the run time usually decreases the quantification sensitivity and accuracy owing to the reduced separation. Therefore, the development of an LC method that balances the throughput and sensitivity is essential for optimization.
The quantification values determined by targeted proteomics sometimes may not be reproduced by ELISA [44]. This is due to the differences in the detected protein region (target peptides and epitopes), specificity of antibodies, insufficient sensitivity of methods, and others. Researchers should consider these points during validation using targeted proteomics. To accelerate the whole phase of biomarker research, a targeted proteomics system for clinical applications should be developed. Despite the aforementioned limitations, targeted proteomics remains an indispensable method for biomarker development in the omics era and will be an important method for multiprotein marker diagnosis.
Acknowledgments
This review article includes studies supported in part by CREST (19gm0710013) and P-CREATE (20cm0106403, 20cm0106463) from the Japan Agency for Medical Research and Development.
References
[1] | N.L. Anderson and N.G. Anderson, Proteome and proteomics: New technologies, new concepts, and new words, Electrophoresis 19: ((1998) ), 1853–1861. |
[2] | A. Srivastava and D.J. Creek, Discovery and validation of clinical biomarkers of cancer: A review combining metabolomics and proteomics, Proteomics 19: ((2019) ), e1700448. |
[3] | N. Rifai, M.A. Gillette and S.A. Carr, Protein biomarker discovery and validation: The long and uncertain path to clinical utility, Nat Biotechnol 24: ((2006) ), 971–983. |
[4] | T. Masuda, A. Mori, S. Ito and S. Ohtsuki, Quantitative and targeted proteomics-based identification and validation of drug efficacy biomarkers, Drug Metab Pharmacokinet 36: ((2021) ), 100361. |
[5] | V. Marx, Targeted proteomics, Nat Methods 10: ((2013) ), 19–22. |
[6] | C. Gaither, R. Popp, Y. Mohammed and C.H. Borchers, Determination of the concentration range for 267 proteins from 21 lots of commercial human plasma using highly multiplexed multiple reaction monitoring mass spectrometry, Analyst 145: ((2020) ), 3634–3644. |
[7] | S. Gallien, S.Y. Kim and B. Domon, Large-scale targeted proteomics using internal standard triggered-parallel reaction monitoring (IS-PRM), Mol Cell Proteomics 14: ((2015) ), 1630–1644. |
[8] | S. Ohtsuki, Y. Uchida, Y. Kubo and T. Terasaki, Quantitative targeted absolute proteomics-based ADME research as a new path to drug discovery and development: Methodology, advantages, strategy, and prospects, J Pharm Sci 100: ((2011) ), 3547–3559. |
[9] | Y. Uchida, M. Tachikawa, W. Obuchi, Y. Hoshi, Y. Tomioka, S. Ohtsuki and T. Terasaki, A study protocol for quantitative targeted absolute proteomics (QTAP) by LC-MS/MS: Application for inter-strain differences in protein expression levels of transporters, receptors, claudin-5, and marker proteins at the blood-brain barrier in ddY, FVB, and C57BL/6J mice, Fluids Barriers CNS 10: ((2013) ), 21. |
[10] | J.G. Meyer and B. Schilling, Clinical applications of quantitative proteomics using targeted and untargeted data-independent acquisition techniques, Expert Rev Proteomics 14: ((2017) ), 419–429. |
[11] | V. Vidova and Z. Spacil, A review on mass spectrometry-based quantitative proteomics: Targeted and data independent acquisition, Anal Chim Acta 964: ((2017) ), 7–23. |
[12] | F. Calderon-Celis, J.R. Encinar and A. Sanz-Medel, Standardization approaches in absolute quantitative proteomics with mass spectrometry, Mass Spectrom Rev 37: ((2018) ), 715–737. |
[13] | P.J. Taylor, Matrix effects: The Achilles heel of quantitative high-performance liquid chromatography-electrospray-tandem mass spectrometry, Clin Biochem 38: ((2005) ), 328–334. |
[14] | K. Nakamura, M. Hirayama-Kurogi, S. Ito, T. Kuno, T. Yoneyama, W. Obuchi, T. Terasaki and S. Ohtsuki, Large-scale multiplex absolute protein quantification of drug-metabolizing enzymes and transporters in human intestine, liver, and kidney microsomes by SWATH-MS: Comparison with MRM/SRM and HR-MRM/PRM, Proteomics 16: ((2016) ), 2106–2117. |
[15] | B. Prasad, B. Achour, P. Artursson, C. Hop, Y. Lai, P.C. Smith, J. Barber, J.R. Wisniewski, D. Spellman, Y. Uchida, M.A. Zientek, J.D. Unadkat and A. Rostami-Hodjegan, Toward a consensus on applying quantitative liquid chromatography-tandem mass spectrometry proteomics in translational pharmacology research: A white paper, Clin Pharmacol Ther 106: ((2019) ), 525–543. |
[16] | B. Prasad and J.D. Unadkat, Optimized approaches for quantification of drug transporters in tissues and cells by MRM proteomics, AAPS J 16: ((2014) ), 634–648. |
[17] | T. Yoneyama, S. Ohtsuki, M. Ono, K. Ohmine, Y. Uchida, T. Yamada, M. Tachikawa and T. Terasaki, Quantitative targeted absolute proteomics-based large-scale quantification of proline-hydroxylated alpha-fibrinogen in plasma for pancreatic cancer diagnosis, J Proteome Res 12: ((2013) ), 753–762. |
[18] | J.K. Fallon, H. Neubert, R. Hyland, T.C. Goosen and P.C. Smith, Targeted quantitative proteomics for the analysis of 14 UGT1As and -2Bs in human liver using NanoUPLC-MS/MS with selected reaction monitoring, J Proteome Res 12: ((2013) ), 4402–4413. |
[19] | J. Kamiie, S. Ohtsuki, R. Iwase, K. Ohmine, Y. Katsukura, K. Yanai, Y. Sekine, Y. Uchida, S. Ito, and T. Terasaki, Quantitative atlas of membrane transporter proteins: Development and application of a highly sensitive simultaneous LC/MS/MS method combined with novel in-silico peptide selection criteria, Pharm Res 25: ((2008) ), 1469–1483. |
[20] | H. Mirzaei, J.K. McBee, J. Watts and R. Aebersold, Comparative evaluation of current peptide production platforms used in absolute quantification in proteomics, Mol Cell Proteomics 7: ((2008) ), 813–823. |
[21] | K.B. Scott, I.V. Turko and K.W. Phinney, QconCAT: Internal standard for protein quantification, Methods Enzymol 566: ((2016) ), 289–303. |
[22] | S.A. Gerber, J. Rush, O. Stemman, M.W. Kirschner and S.P. Gygi, Absolute quantification of proteins and phosphoproteins from cell lysates by tandem MS, Proc Natl Acad Sci U S A 100: ((2003) ), 6940–6945. |
[23] | K. Schnatbaum, V. Solis-Mezarino, D. Pokrovsky, F. Schafer, D. Nagl, L. Hornberger, J. Zerweck, T. Knaute, J. Avramova-Nehmer, M. Schutkowski, V. Hornung, H. Wenschuh, M.C. Volker-Albert, A. Imhof and U. Reimer, New approaches for absolute quantification of stable-isotope-labeled peptide standards for targeted proteomics based on a UV active tag, Proteomics 20: ((2020) ), e2000007. |
[24] | D.M. Simpson and R.J. Beynon, QconCATs: Design and expression of concatenated protein standards for multiplexed protein quantification, Anal Bioanal Chem 404: ((2012) ), 977–989. |
[25] | C.M. Colangelo, L. Chung, C. Bruce and K.H. Cheung, Review of software tools for design and analysis of large scale MRM proteomic datasets, Methods 61: ((2013) ), 287–298. |
[26] | E.I. Chen, D. Cociorva, J.L. Norris and J.R. Yates, 3rd, Optimization of mass spectrometry-compatible surfactants for shotgun proteomics, J Proteome Res 6: ((2007) ), 2529–2538. |
[27] | F. Wu, D. Sun, N. Wang, Y. Gong and L. Li, Comparison of surfactant-assisted shotgun methods using acid-labile surfactants and sodium dodecyl sulfate for membrane proteome analysis, Anal Chim Acta 698: ((2011) ), 36–43. |
[28] | J.L. Proc, M.A. Kuzyk, D.B. Hardie, J. Yang, D.S. Smith, A.M. Jackson, C.E. Parker and C.H. Borchers, A quantitative study of the effects of chaotropic agents, surfactants, and solvents on the digestion efficiency of human plasma proteins by trypsin, J Proteome Res 9: ((2010) ), 5422–5437. |
[29] | T. Yoneyama, S. Ohtsuki, K. Honda, M. Kobayashi, M. Iwasaki, Y. Uchida, T. Okusaka, S. Nakamori, M. Shimahara, T. Ueno, A. Tsuchida, N. Sata, T. Ioka, Y. Yasunami, T. Kosuge, T. Kaneda, T. Kato, K. Yagihara, S. Fujita, W. Huang, T. Yamada, M. Tachikawa and T. Terasaki, Identification of IGFBP2 and IGFBP3 as compensatory biomarkers for CA19-9 in early-stage pancreatic cancer using a combination of antibody-based and LC-MS/MS-based proteomics, PLoS One 11: ((2016) ), e0161009. |
[30] | M. Howard, B. Achour, Z. Al-Majdoub, A. Rostami-Hodjegan and J. Barber, GASP and FASP are complementary for LC-MS/MS proteomic analysis of drug-metabolizing enzymes and transporters in pig liver, Proteomics 18: ((2018) ), e1800200. |
[31] | T. Masuda, N. Saito, M. Tomita and Y. Ishihama, Unbiased quantitation of Escherichia coli membrane proteome using phase transfer surfactants, Mol Cell Proteomics 8: ((2009) ), 2770–2777. |
[32] | T. Masuda, M. Tomita and Y. Ishihama, Phase transfer surfactant-aided trypsin digestion for membrane proteome analysis, J Proteome Res 7: ((2008) ), 731–740. |
[33] | J. Rappsilber, Y. Ishihama and M. Mann, Stop and go extraction tips for matrix-assisted laser desorption/ionization, nanoelectrospray, and LC/MS sample pretreatment in proteomics, Anal Chem 75: ((2003) ), 663–670. |
[34] | S. Oswald, C. Groer, M. Drozdzik and W. Siegmund, Mass spectrometry-based targeted proteomics as a tool to elucidate the expression and function of intestinal drug transporters, AAPS J 15: ((2013) ), 1128–1140. |
[35] | U. Koesukwiwat, S.J. Lehotay and N. Leepipatpiboon, Fast, low-pressure gas chromatography triple quadrupole tandem mass spectrometry for analysis of 150 pesticide residues in fruits and vegetables, J Chromatogr A 1218: ((2011) ), 7039–7050. |
[36] | L.K. Pino, B.C. Searle, J.G. Bollinger, B. Nunn, B. MacLean and M.J. MacCoss, The Skyline ecosystem: Informatics for quantitative mass spectrometry proteomics, Mass Spectrom Rev 39: ((2020) ), 229–244. |
[37] | T. Nakamura, Y. Furukawa, H. Nakagawa, T. Tsunoda, H. Ohigashi, K. Murata, O. Ishikawa, K. Ohgaki, N. Kashimura, M. Miyamoto, S. Hirano, S. Kondo, H. Katoh, Y. Nakamura and T. Katagiri, Genome-wide cDNA microarray analysis of gene expression profiles in pancreatic cancers using populations of tumor cells and normal ductal epithelial cells selected for purity by laser microdissection, Oncogene 23: ((2004) ), 2385–2400. |
[38] | M. Ono, J. Matsubara, K. Honda, T. Sakuma, T. Hashiguchi, H. Nose, S. Nakamori, T. Okusaka, T. Kosuge, N. Sata, H. Nagai, T. Ioka, S. Tanaka, A. Tsuchida, T. Aoki, M. Shimahara, Y. Yasunami, T. Itoi, F. Moriyasu, A. Negishi, H. Kuwabara, A. Shoji, S. Hirohashi and T. Yamada, Prolyl 4-hydroxylation of alpha-fibrinogen: a novel protein modification revealed by plasma proteomics, J Biol Chem 284: ((2009) ), 29041–29049. |
[39] | M. Nambu, S. Nishiumi, T. Kobayashi, T. Masuda, S. Ito, M. Yoshida and S. Ohtsuki, Effects of differences in pre-analytical processing on blood protein profiles determined with SWATH-MS, J Proteomics 223: ((2020) ), 103824. |
[40] | P.P. Olszowy, A. Burns and P.S. Ciborowski, Pressure-assisted sample preparation for proteomic analysis, Anal Biochem 438: ((2013) ), 67–72. |
[41] | J.R. Freije, P.P. Mulder, W. Werkman, L. Rieux, H.A. Niederlander, E. Verpoorte and R. Bischoff, Chemically modified, immobilized trypsin reactor with improved digestion efficiency, J Proteome Res 4: ((2005) ), 1805–1813. |
[42] | Q. Fu, M.P. Kowalski, M. Mastali, S.J. Parker, K. Sobhani, I. van den Broek, C.L. Hunter and J.E. Van Eyk, Highly reproducible automated proteomics sample preparation workflow for quantitative mass spectrometry, J Proteome Res 17: ((2018) ), 420–428. |
[43] | T. Yoneyama, S. Ohtsuki, M. Tachikawa, Y. Uchida and T. Terasaki, Scrambled internal standard method for high-throughput protein quantification by matrix-assisted laser desorption ionization tandem mass spectrometry, J Proteome Res 16: ((2017) ), 1556–1565. |
[44] | D. Lin, W.E. Alborn, R.J. Slebos and D.C. Liebler, Comparison of protein immunoprecipitation-multiple reaction monitoring with ELISA for assay of biomarker candidates in plasma, J Proteome Res 12: ((2013) ), 5996–6003. |


