
Radiomics model of 18F-FDG PET/CT imaging for predicting disease-free survival of early-stage uterine cervical squamous cancer
Abstract
BACKGROUND:
To explore an effective predictive model based on PET/CT radiomics for the prognosis of early-stage uterine cervical squamous cancer.
METHODS:
Preoperative PET/CT data were collected from 201 uterine cervical squamous cancer patients with stage IB-IIA disease (FIGO 2009) who underwent radical surgery between 2010 and 2015. The tumor regions were manually segmented, and 1318 radiomic features were extracted. First, model-based univariate analysis was performed to exclude features with small correlations. Then, the redundant features were further removed by feature collinearity. Finally, the random survival forest (RSF) was used to assess feature importance for multivariate analysis. The prognostic models were established based on RSF, and their predictive performances were measured by the C-index and the time-dependent cumulative/dynamics AUC (C/D AUC).
RESULTS:
In total, 6 radiomic features (5 for CT and 1 for PET) and 6 clinicopathologic features were selected. The radiomic, clinicopathologic and combination prognostic models yielded C-indexes of 0.9338, 0.9019 and 0.9527, and the mean values of the C/D AUC (mC/D AUC) were 0.9146, 0.8645 and 0.9199, respectively.
CONCLUSIONS:
PET/CT radiomics could achieve approval power in predicting DFS in early-stage uterine cervical squamous cancer.
1.Introduction
Uterine cervical cancer is one of the leading causes of death among females [1]. In early-stage cervical cancer, radical surgery with/without individualized adjuvant chemoradiotherapy is a guideline-recommended option for treatment, whereas recurrences still occur in approximately 25% of cases [2, 3]. Some postoperative pathologic risk factors, such as large tumor diameter, deep stromal invasion, lymphovascular space invasion (LVSI), parametrial involvement, positive surgery margin, and lymph node metastasis, could increase the incidence of recurrence [4, 5]. However, in the clinic, patients without risk factors or patients who underwent adjuvant chemoradiotherapy due to pathologic risks could still have poor survival. Thus, these factors cannot always predict patient survival. Therefore, it is necessary to develop an accurate and comprehensive tool for prognostic prediction that could supplement the existing guidelines.
Radiomics is an emerging field where features are extracted from quantitative medical imaging using various techniques. Radiomic features can quantify tumor intensity, shape and heterogeneity and have been applied to oncologic detection, diagnosis, therapeutic response and prognosis [11, 12, 13, 14, 15, 16]. Lucia et al. successfully reported a radiomic model based on PET/CT and MR for predicting recurrence in advanced uterine cervical cancer, and further external validation was performed. The predictive accuracy was as high as 90% in this radiomic model compared to 56–60% using standard clinical variables [15, 16]. Most likely due to the shorter follow-up time, few prognostic studies have been attempted in early-stage uterine cervical cancer using PET/CT radiomic features.
Moreover, since the most common pathological type of cervical cancer is squamous cell carcinoma, our study was performed in this homologous group of patients with the same histology, which increases the generalizability of our findings. Thus, we intended to develop a PET/CT radiomic model to predict prognosis accurately in early-stage uterine cervical squamous cancer patients.
2.Material and methods
2.1Patient
This study was approved by the ethics committee of Fudan University Shanghai Cancer Center. We retrospectively enrolled 201 uterine cervical squamous cancer patients who underwent PET/CT scans 1 week prior to radical surgery between January 2010 and June 2015. Patients were excluded if they received neoadjuvant chemo- or radiotherapy or had other malignancies or other histologic types of uterine cervical cancer. All patients were diagnosed with IB-IIA stage (FIGO 2009). Postoperative adjuvant radiochemotherapy was determined by pathologic risk factors according to NCCN and FIGO guidelines [4, 5].
Postoperative pathologic features included tumor size, histologic type, stromal invasion depth, LVSI, parametria involvement, positive surgery margin, and lymph node metastasis in our study. According to guidelines [4, 5], parametrial involvement, positive surgery margin, or pelvic lymph node metastasis mentioned by postoperative pathology were high-risk factors. Cervical tumor diameter
Table 1
Clinicopathologic characteristics
| Variables | Training cohort ( | Testing cohort ( | |
|---|---|---|---|
| Age (year), median (range) | 47 (19–73) | 48 (25–74) | 0.641 |
| 2009 FIGO stage | 0.668 | ||
| IB1-IB2 | 57 (40.7%) | 27 (44.3%) | |
| IIA1IIA2 | 83 (59.3%) | 34 (55.7%) | |
| SCCA (ng/ml), median (range) | 2.2 (0.3–70.0) | 3.4 (0.3–70.0) | 0.648 |
| Ki67, median (range) | 75% (20%–95%) | 80% (20%–95%) | 0.742 |
| Tumor diameter, median(range) | 3.5 (0.2–10.0) | 4.0 (0.6–9.0) | 0.238 |
| | 77 (55.7%) | 23 (37.7%) | |
| | 62 (44.3%) | 38 (62.3%) | |
| Stromal invasion depth | 0.788 | ||
| | 35 (25%) | 14 (23.0%) | |
| | 102 (72.9%) | 45 (73.8%) | |
| NA | 3 (2.1%) | 2 (3.3%) | |
| LVSI | 0.595 | ||
| No | 81 (57.9%) | 38 (62.3%) | |
| Yes | 58 (41.4%) | 23 (37.7%) | |
| NA | 1 (0.7%) | – | |
| Parametria invasion | 0.504 | ||
| No | 133 (95.0%) | 57 (93.4%) | |
| Yes | 6 (4.3%) | 4 (6.6%) | |
| NA | 1 (0.7%) | – | |
| Surgery margin | 0.915 | ||
| Negative | 137 (97.9%) | 60 (98.4%) | |
| Positive | 2 (1.4%) | 1 (1.6%) | |
| NA | 1 (0.7%) | – | |
| Lymph node metastasis | 0.669 | ||
| No | 93 (66.4%) | 42 (68.9%) | |
| Yes | 46 (32.9%) | 18 (29.5%) | |
| NA | 1 (0.7%) | 1 (1.6%) | |
| Postoperative adjuvant therapy | 0.434 | ||
| No | 54 (38.6%) | 20 (32.8%) | |
| Yes | 86 (61.4%) | 41 (67.2%) | |
| Recurrence/Metastasis | 0.934 | ||
| No | 96 (68.6%) | 42 (68.9%) | |
| Yes | 19 (13.6%) | 8 (13.1%) | |
| NA | 25 (17.9%) | 11 (18.0%) | |
| DFS (month), median(range) | 56 (1–111) | 52 (3–113) | 0.634 |
| SUVmax, median(range) | 12.58 (2.65–37.41) | 12.82 (2.50–71.84) | 0.598 |
| SUVmean, median(range) | 5.17 (2.57–12.77) | 5.38 (2.72–20.56) | 0.176 |
| MTV, median(range) | 26.43 (0.41–235.56) | 37.00 (0.28–263.37) | 0.233 |
| TLG, median(range) | 143.70 (1.05–1806.75) | 230.27 (0.76–2183.34) | 0.233 |
Abbreviation: SCCCA, squamous cell carcinoma associated antigen; SUVmax, maximum of standardized uptake value; MTV, metabolic tumor volume; TLG, total lesion glycolysis LVSI, lymphovascular space invasion; NA, not available.
The surveillance is based on the patient’s risk for recurrence and personal preferences by the recommendation of NCCN guidelines: clinicoradiological and physical examinations were routinely recommended every 3–6 months for the first 2 years, every 6–12 months for another 3 to 5 years, and then annually. Patients with pathologic high-risk disease can be assessed more frequently (for example, every 3 months for the first 2 years) than patients with low-risk disease (e.g., every 6 months). All patients were followed up until June 30, 2019. Disease-free survival (DFS) was defined as the time interval from the date of surgery to the date of recurrence or metastasis.
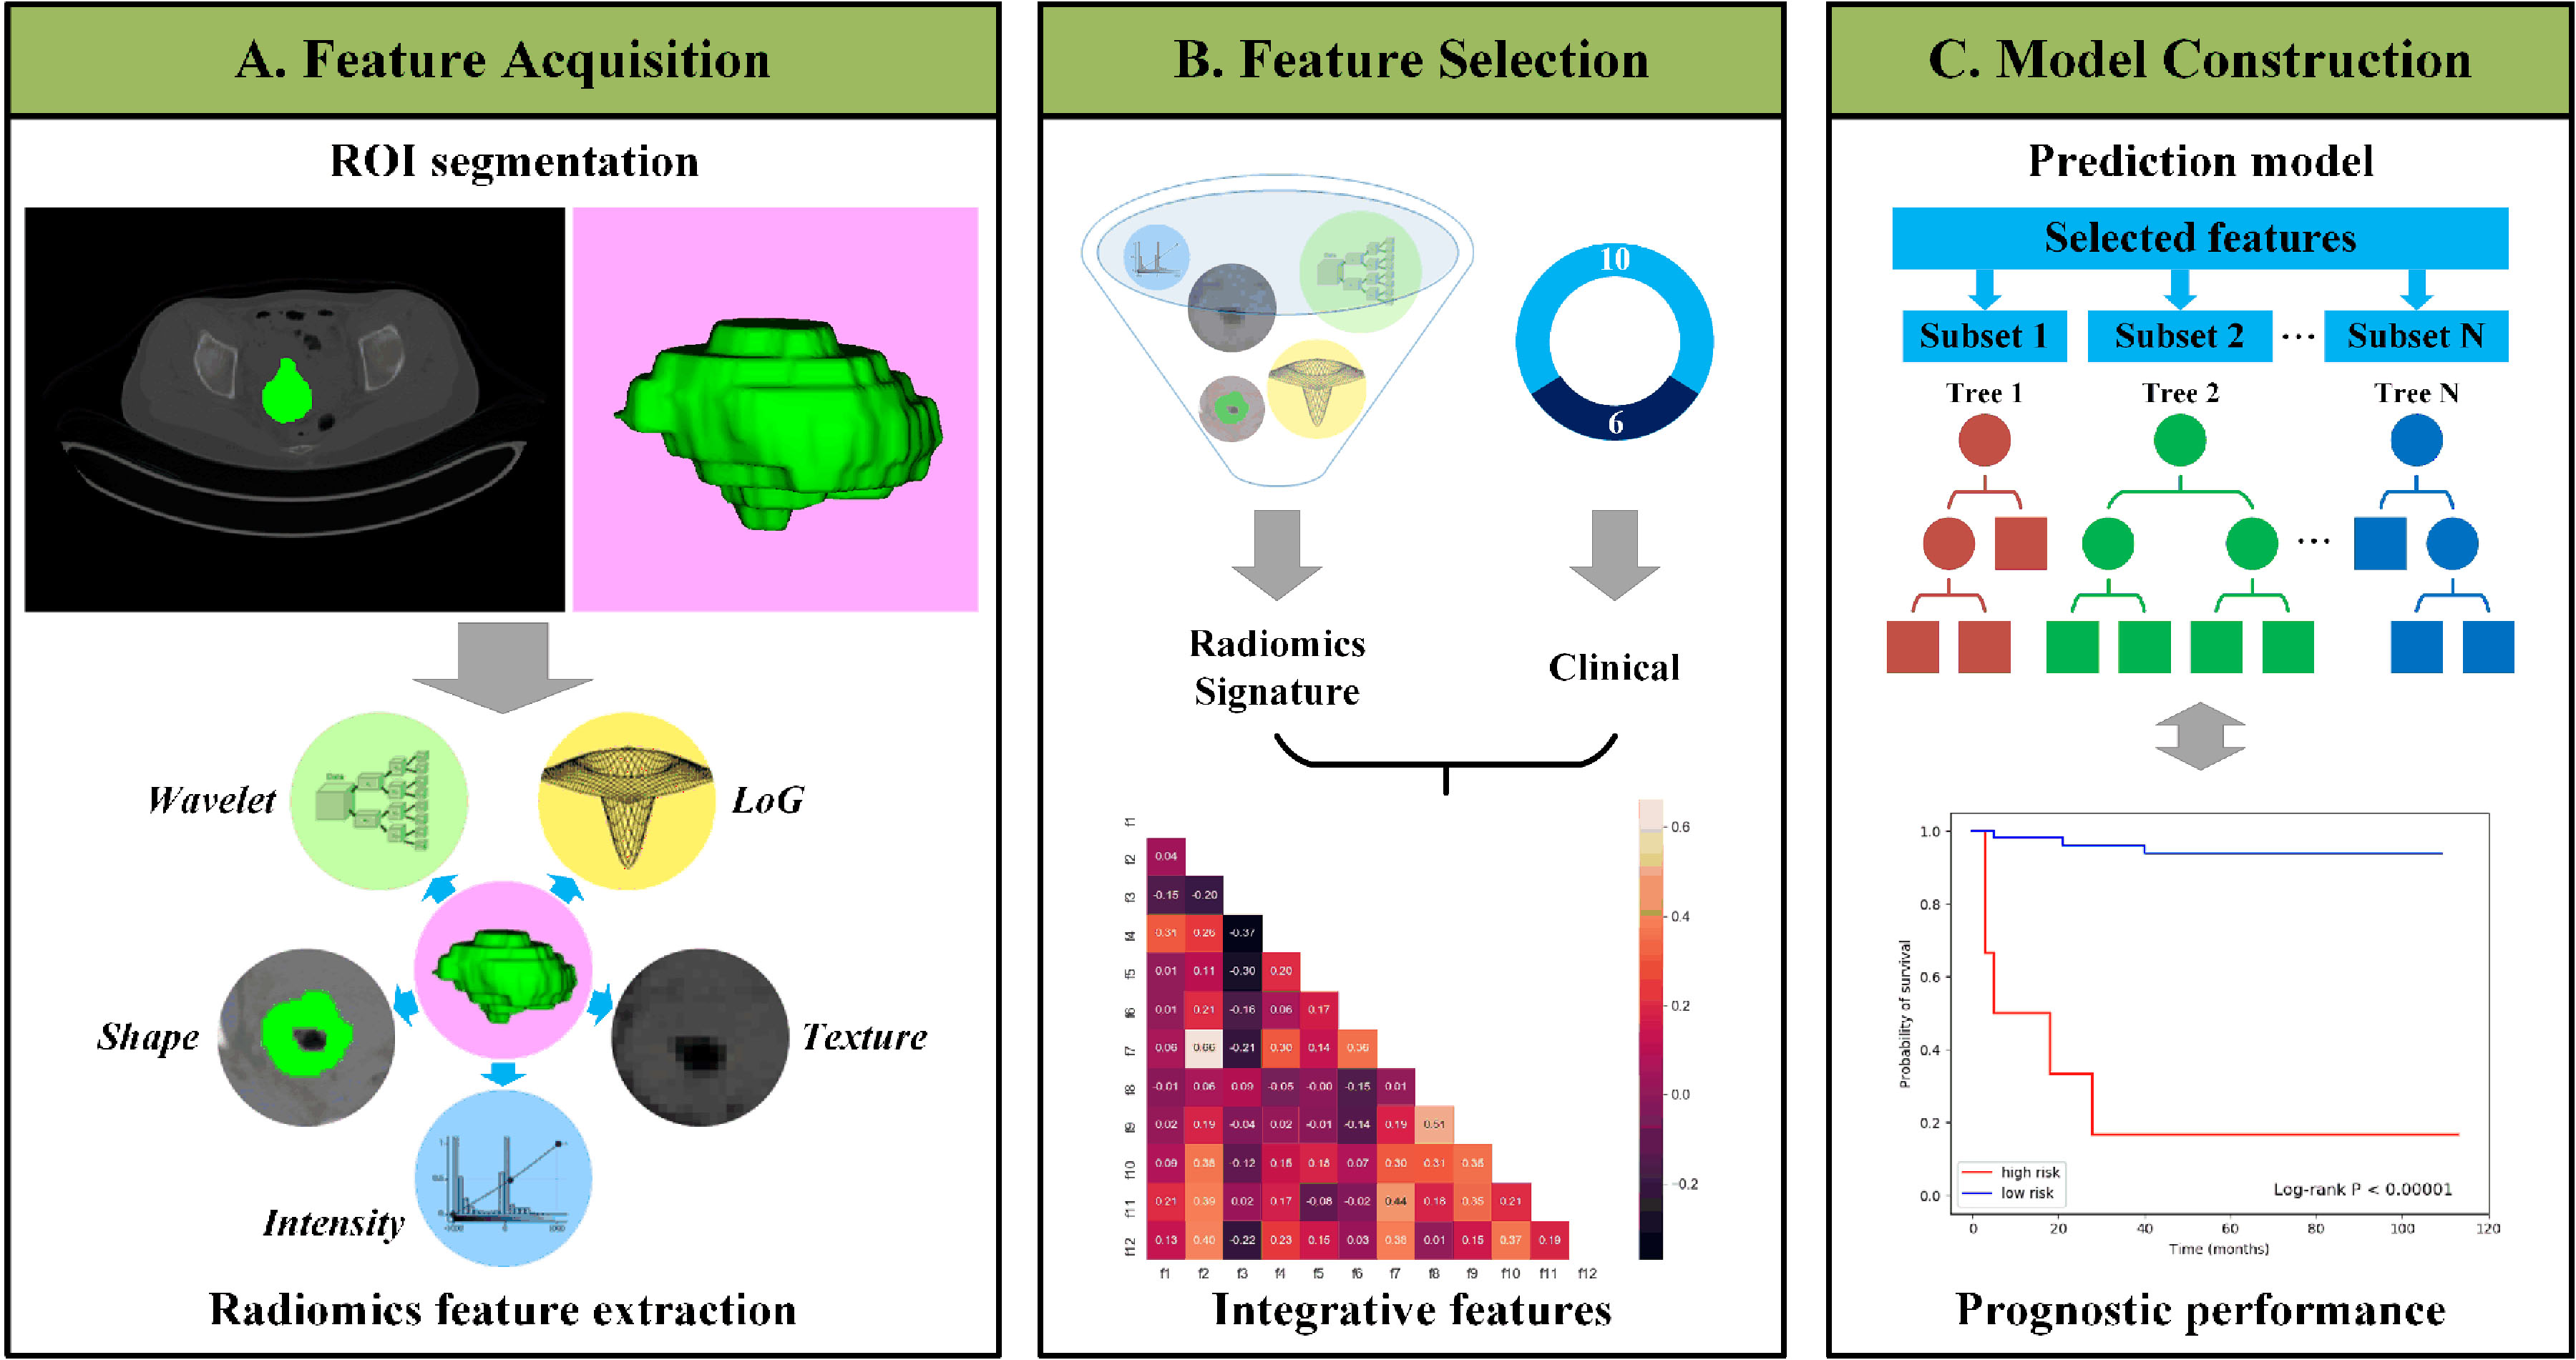
Figure 1.
Outline of the workflow from data input, feature extraction, selection, and model construction.
Squamous cell carcinoma antigen (SCCA) is a very specific tumor marker that exists in the cytoplasm of cancer, such as uterine, cervix, lung, head and neck squamous cell carcinoma. SCCA is not only an early indicator of response during cervical squamous cancer therapy but also a prognostic biomarker after therapy. High pretreatment SCCA is associated with recurrence [18, 19, 20]. Ki67 is a nuclear protein, and its expression level is strongly associated with tumor cell proliferation and growth and is widely used in routine pathological investigations as a proliferation marker. Clinically, Ki67 expression is significantly higher in malignant tissues with poorly differentiated tumor cells than in normal tissue [21, 22]. In cervical cancer, the expression of Ki67 is closely related to the occurrence and development of cervical carcinoma [22]. Therefore, the expression of SCCA and Ki67 levels were evaluated in our study for prognostic research. Finally, 16 clinicopathological data types, including age, preoperative SCCA level, FIGO stage, Ki67 level, above pathologic features, recurrence/metastasis status, DFS, and conventional PET/CT parameters, were collected from medical records, cancer registries, and pathology reports. In total, 201 patients were included in the study and were randomly divided into a training cohort
2.218
2-Deoxy-2-(
All PET/CT images were evaluated by two experienced nuclear medicine physicians independently. Consensus was reached in case of discrepancy. A multimodality computer platform (Syngo; Siemens) was used to analyze the
2.3PET/CT image segmentation and feature extraction
The workflow is illustrated in Fig. 1. The ROI of images was delineated independently by two experienced nuclear medicine physicians using ITK-SNAP software (Version 3.6, United States). After manual segmentation, the PyRadiomics package [23] was adopted to automatically calculate the radiomic features from tumor ROIs, including shape, intensity and texture [24]. Shape features could reflect the geometric properties of tumors and were only calculated on original images. Intensity features, which describe the voxel intensity distribution, were calculated using first-order statistics. Texture features were calculated based on different texture matrixes to quantify tumor heterogeneity.
For CT images, in addition to the original images, a wavelet filter and a Laplacian of Gaussian (LoG) filter were applied to obtain derived images for richer feature extraction [25]. The wavelet features were extracted based on wavelet decomposition and reflected multiscale information of intensity and texture. LoG filters were used to enhance edge information and emphasize tumor textures of different coarseness levels. In total, 1218 radiomic features were extracted from CT images.
For PET images, feature calculation was only performed based on original images considering the low-resolution characteristics of PET images, and the personal dose and weight were used for normalization. A total of 100 PET features were extracted.
Table 2
Description of selected radiomics feature in predictive model
| Index | Feature name | Description |
|---|---|---|
| f1 | CT_wavelet-HLH_gldm_SmallDependenceHighGrayLevelEmphasis | A Measure of the joint distribution of small dependence with higher gray-level values |
| f2 | CT_log-sigma-4-0-mm-3D_glrlm_RunVariance | A measure of the variance in runs for the run lengths |
| f3 | CT_log-sigma-4-0-mm-3D_gldm_LowGrayLevelEmphasis | A measure of the distribution of low gray-level values |
| f4 | CT_log-sigma-5-0-mm-3D_glrlm_LongRunHighGrayLevelEmphasis | A measure of the joint distribution of long run lengths with higher gray-level values |
| f5 | CT_log-sigma-5-0-mm-3D_gldm_DependenceNonUniformity | A measure of the similarity of dependence throughout the image |
| f6 | PET_original_glcm_SumSquares | A measure in the distribution of neigboring intensity level pairs about the mean intensity level in the GLCM |
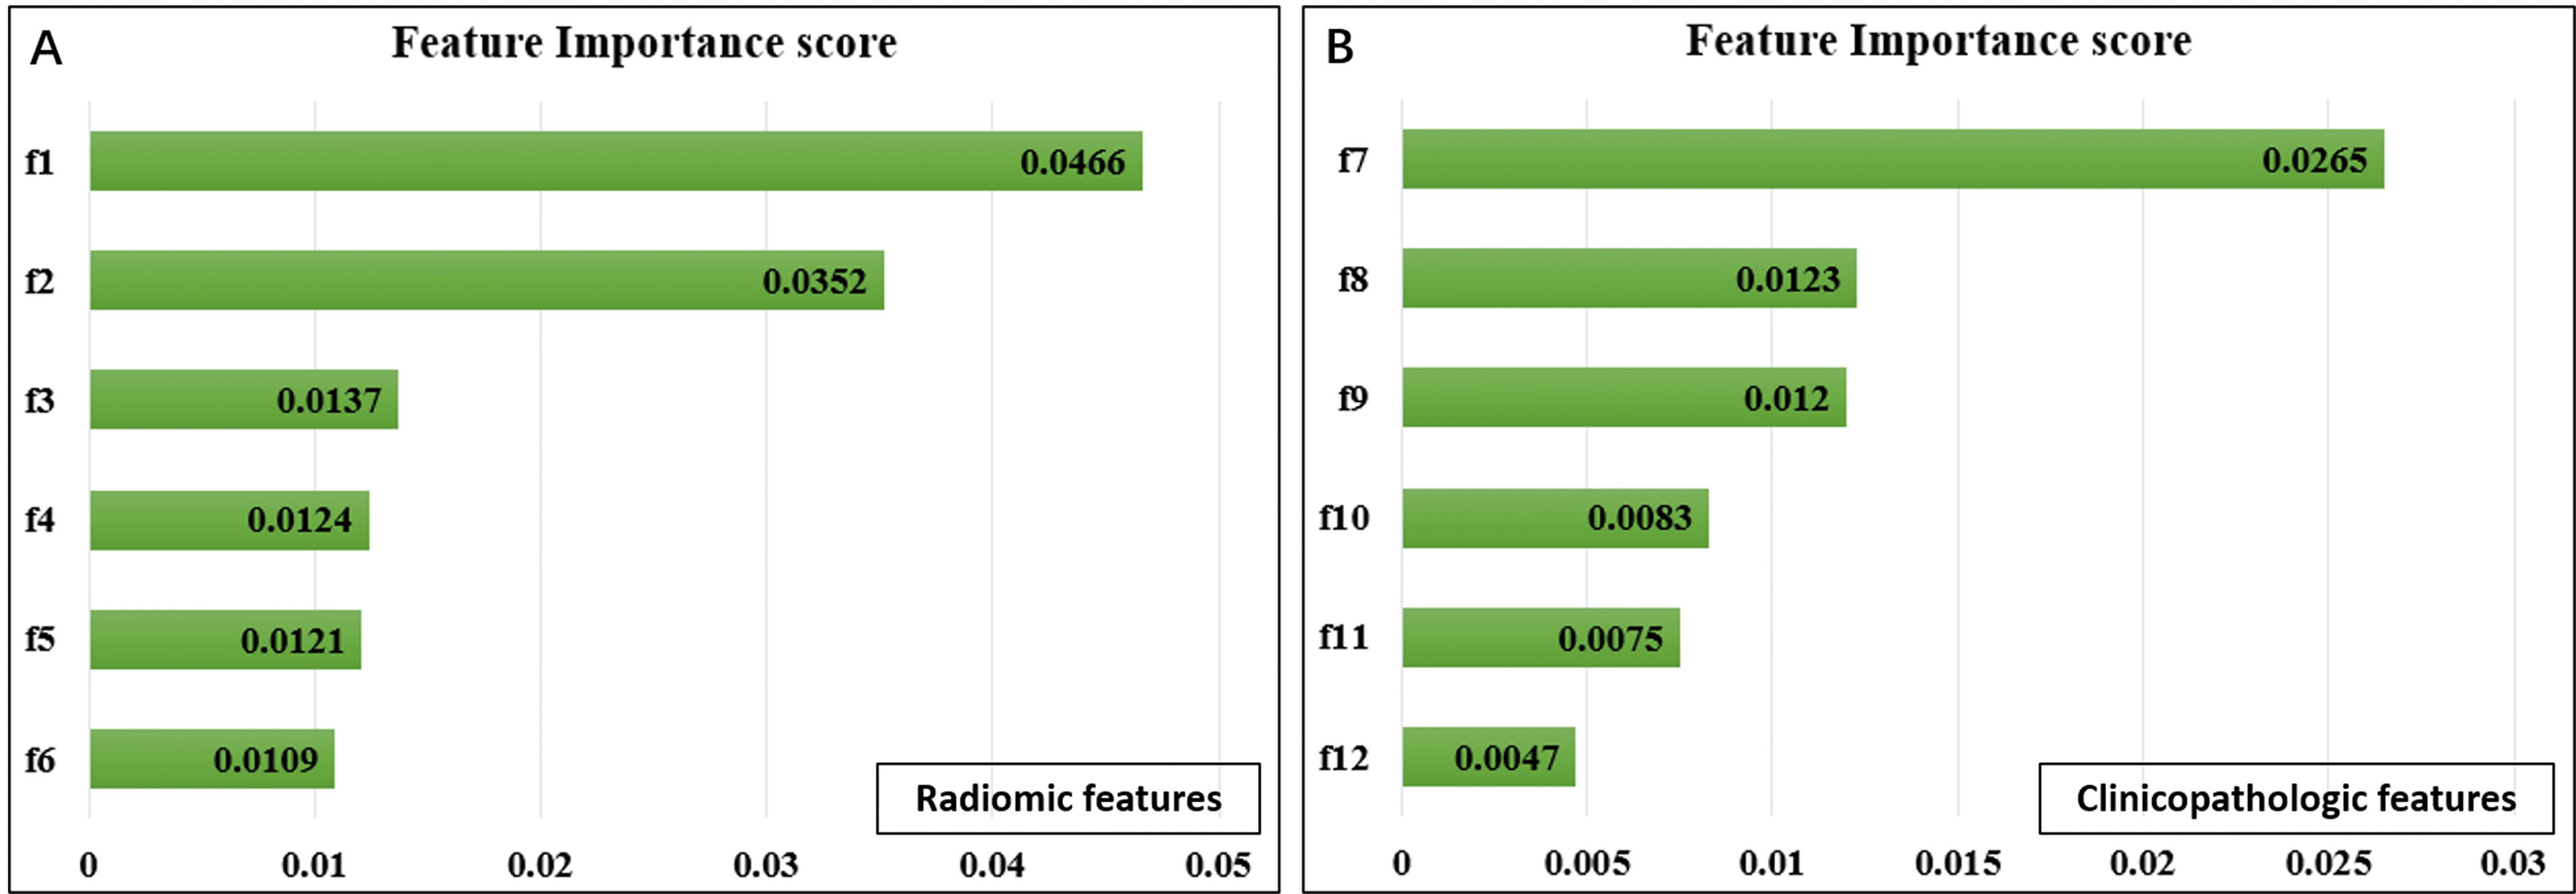
Figure 2.
Selected radiomic features in predicting DFS. Feature importance of radiomic (A) and clinicopathologic features (B). f1, CT_wavelet-HLH_gldm_SmallDependenceHighGrayLevelEmphasis; f2, CT_log-sigma-4-0-mm-3D_glrlm_RunVariance; f3, CT_log-sigma-4-0-mm-3D_gldm_LowGrayLevelEmphasis; f4, CT_log-sigma-5-0-mm-3D_glrlm_LongRunHighGrayLevelEmphasis; f5, CT_log-sigma-5-0-mm-3D_gldm_DependenceNonUniformity; f6, PET_original_glcm_SumSquares; f7, TLG; f8, LVSI; f9, lymph node metastasis; f10, deep stromal invasion; f11, preoperative SCCA level; f12, FIGO stage.
Finally, we obtained a total of 1318 radiomic features from CT and PET images.
2.4Feature selection
Radiomic feature selection was performed in the training set in the following three steps. First, the concordance index (C-index) was used to evaluate the univariate prognostic ability of each feature, and a low C-index indicated poor predictive ability for prognosis. Features with a low C-index were removed. Second, the variance inflation factor (VIF) was applied to quantify the collinearity between features and remove redundancy from high-dimensional features [26]. In each iteration, the feature with the highest VIF value was removed. This procedure was performed iteratively until the VIF values of all remaining features were below a certain threshold. Third, the random survival forest (RSF) [27] model was used for multivariate analysis. RSF is an ensemble of tree-based learners that can evaluate the importance of input features. For each feature, an importance score was calculated by RSF based on evaluations of relevance and prognosis between all features. Then, features with important scores below a preset threshold were removed, and the radiomic signature was generated using the remaining features. For a total of 16 clinicopathologic features, considering the small number of features, only the last two steps were performed. The model parameters and thresholds were determined by grid search, and all procedures were implemented using stats-models [28], scikit-learn [29] and scikit-survival packages [30, 31, 32].
2.5Prognostic model establishment
Based on the selected features, the popular ensemble RSF method was used to build the prognostic model. The radiomic signature and clinicopathologic features were first enrolled in the RSF model independently and then fused into a comprehensive model. For all of the above models, 4-fold cross-validation was performed in the training set to determine the model parameters.
2.6Statistical analysis
Continuous variables were described as medians with ranges, and categorical variables were described as frequencies with percentages. Training and testing set characteristics were compared using the descriptive statistical analysis method for continuous variables and
3.Results
3.1Clinicopathologic characteristics
As shown in Table 1, the clinicopathologic characteristics of the training and testing cohorts were similar. A total of 201 patients were divided into two groups: a training cohort with a median age (range) of 47 (19–73) years and a testing cohort with a median age (range) of 48 (25–74) years. The FIGO stage ranged from IB1-IIA2.
In the training cohort, the median (range) DFS was 56 (1–111) months. A total of 19 (13.6%) patients relapsed or metastasized during the follow-up period. The median (range) preoperative SCCA was 2.2 (0.3–70.0) ng/ml. Over half of the patients had postoperative pathologic risks, including 62 (44.3%) with tumor size
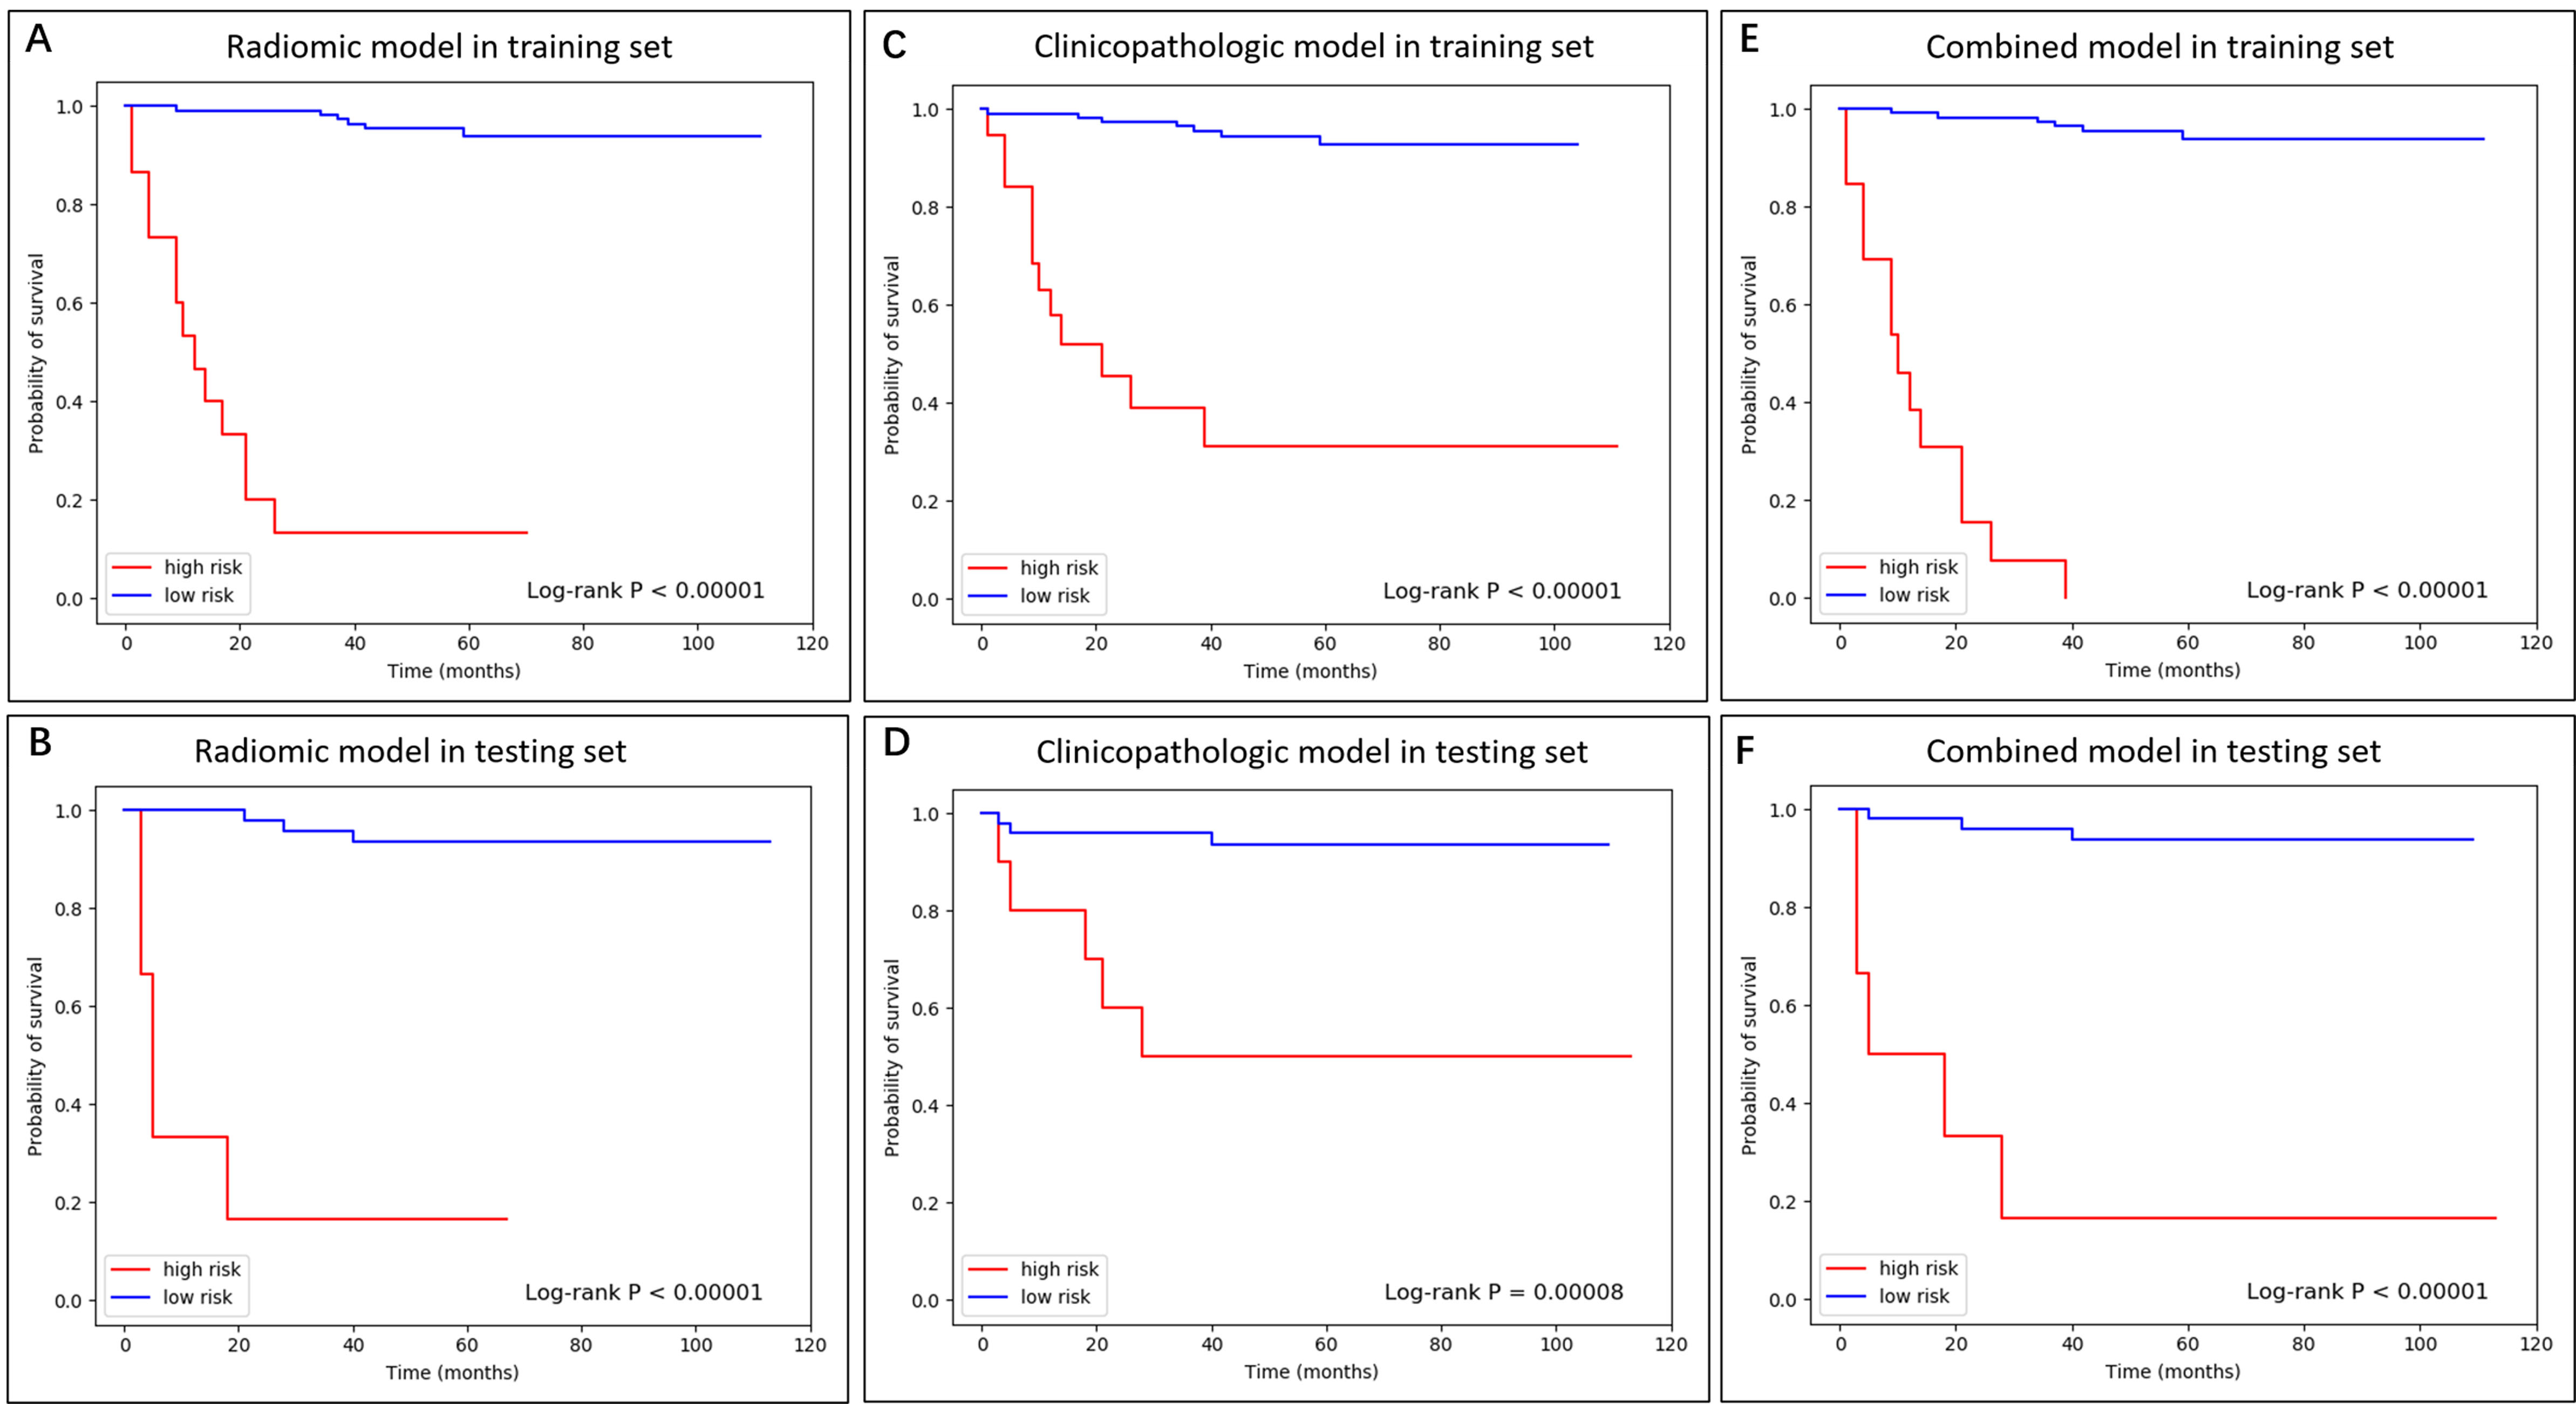
Figure 3.
The K-M curve of radiomic, clinicopathologic, and combined model in training and testing dataset.
In the testing cohort of 61 patients, 8 (13.1%) patients relapsed or metastasized with a median DFS of 52 months (range 3–113 months). The median (range) SCCA level and Ki67 value were 3.4 (0.3–70.0) ng/ml and 80% (20%–95%), respectively. The tumor size was larger than 4 cm in 38 (62.3%) patients. In total, 45 (73.8%) patients were pathologically proven to have a stromal invasion depth
3.2Feature selection
The important radiomic features were selected from a total of 1318 radiomic features, including 1218 CT features and 100 PET features. First, univariate analysis was performed, and the results showed that 178 CT features and 22 PET features were considered to be predictive and were selected. Then, the collinearities of the remaining features were analyzed. Twenty-five independent features (21 CT features and 4 PET features) were selected when the redundant features with VIF values larger than 10 were removed. Finally, with the multivariate analysis based on RSF, 6 important radiomic features were selected, including 5 CT features and 1 PET feature. As shown in Fig. 2A, CT-wavelet-HLH_gldm_ SmallDependence HighGrayLevelEmphasis and CT-log-sigma-4-0-mm-3D_glrlm_RunVariance were the most important features compared with others. The definitions of 6 selected radiomic features are presented in Table 2, which were in compliance with the Imaging Biomarker Standardization Initiative (IBSI) [36].
For 16 clinicopathologic features, 5 redundant features were first removed by VIF. Then, the features with a nonpositive important score in RSF-based multivariate analysis were further removed, resulting in 6 prognostic clinicopathologic features (Fig. 2B), including TLG, LVSI, lymph node metastasis, deep stromal invasion, preoperative SCCA level, and FIGO stage.
3.3Performance of the prognostic model
After feature selection, the RSF model was established to predict the risk scores for each patient. For each model, patients in the training and testing sets were stratified into high- and low-risk groups by the optimal cutoff value obtained from the log-rank test on the training set. The cutoff values of the radiomic, clinicopathologic and combined models were 4.9, 3.9 and 4.0, respectively. The Kaplan-Meier curves of DFS revealed a significant difference between the high- and low-risk groups (Fig. 3).
The overall performances of the models were evaluated with the C-index value. As illustrated in Table 3, the PET/CT radiomic model yielded robust discrimination, with C-index values of 0.9557 for the training set and 0.9338 for the testing set, which was better than the clinicopathologic model (0.9125 for the training set and 0.9019 for the testing set). By merging the radiomic and clinicopathologic features, a comprehensive model was further built and achieved C-index values of 0.9717 and 0.9527 for the training and testing sets, respectively.
Table 3
The performance of the predictive model
| Models | Dataset | C-index | mC/D AUC | C/D AUC |
|---|---|---|---|---|
| Radiomic model | Training | 0.9557 | ||
| Testing | 0.9338 | 0.9146 | 0.8923 | |
| Clinicopathologic model | Training | 0.9125 | ||
| Testing | 0.9019 | 0.8645 | 0.9248 | |
| Combined mode | Training | 0.9717 | ||
| Testing | 0.9527 | 0.9199 | 0.9703 |
Abbreviation: mC/D AUC, the mean value of cumulative/dynamics area under the curve. C/D AUC
Figure 4.
The C/D AUC curve of the radiomic, clinicopathologic, and combined models in the testing dataset. As an indicator to measure the preoperative predictive efficiency of the model in addition to the C-index, the mC/D AUC was further calculated over all time ranges. The curve showed that the combined model achieved the best performance during the research period, and the mC/D AUCs of the radiomic, clinicopathologic and combined models were 0.9146, 0.8645, and 0.9199, respectively. At 60 months after surgery, the preoperative combined model showed a higher predictive value with a C/D AUC
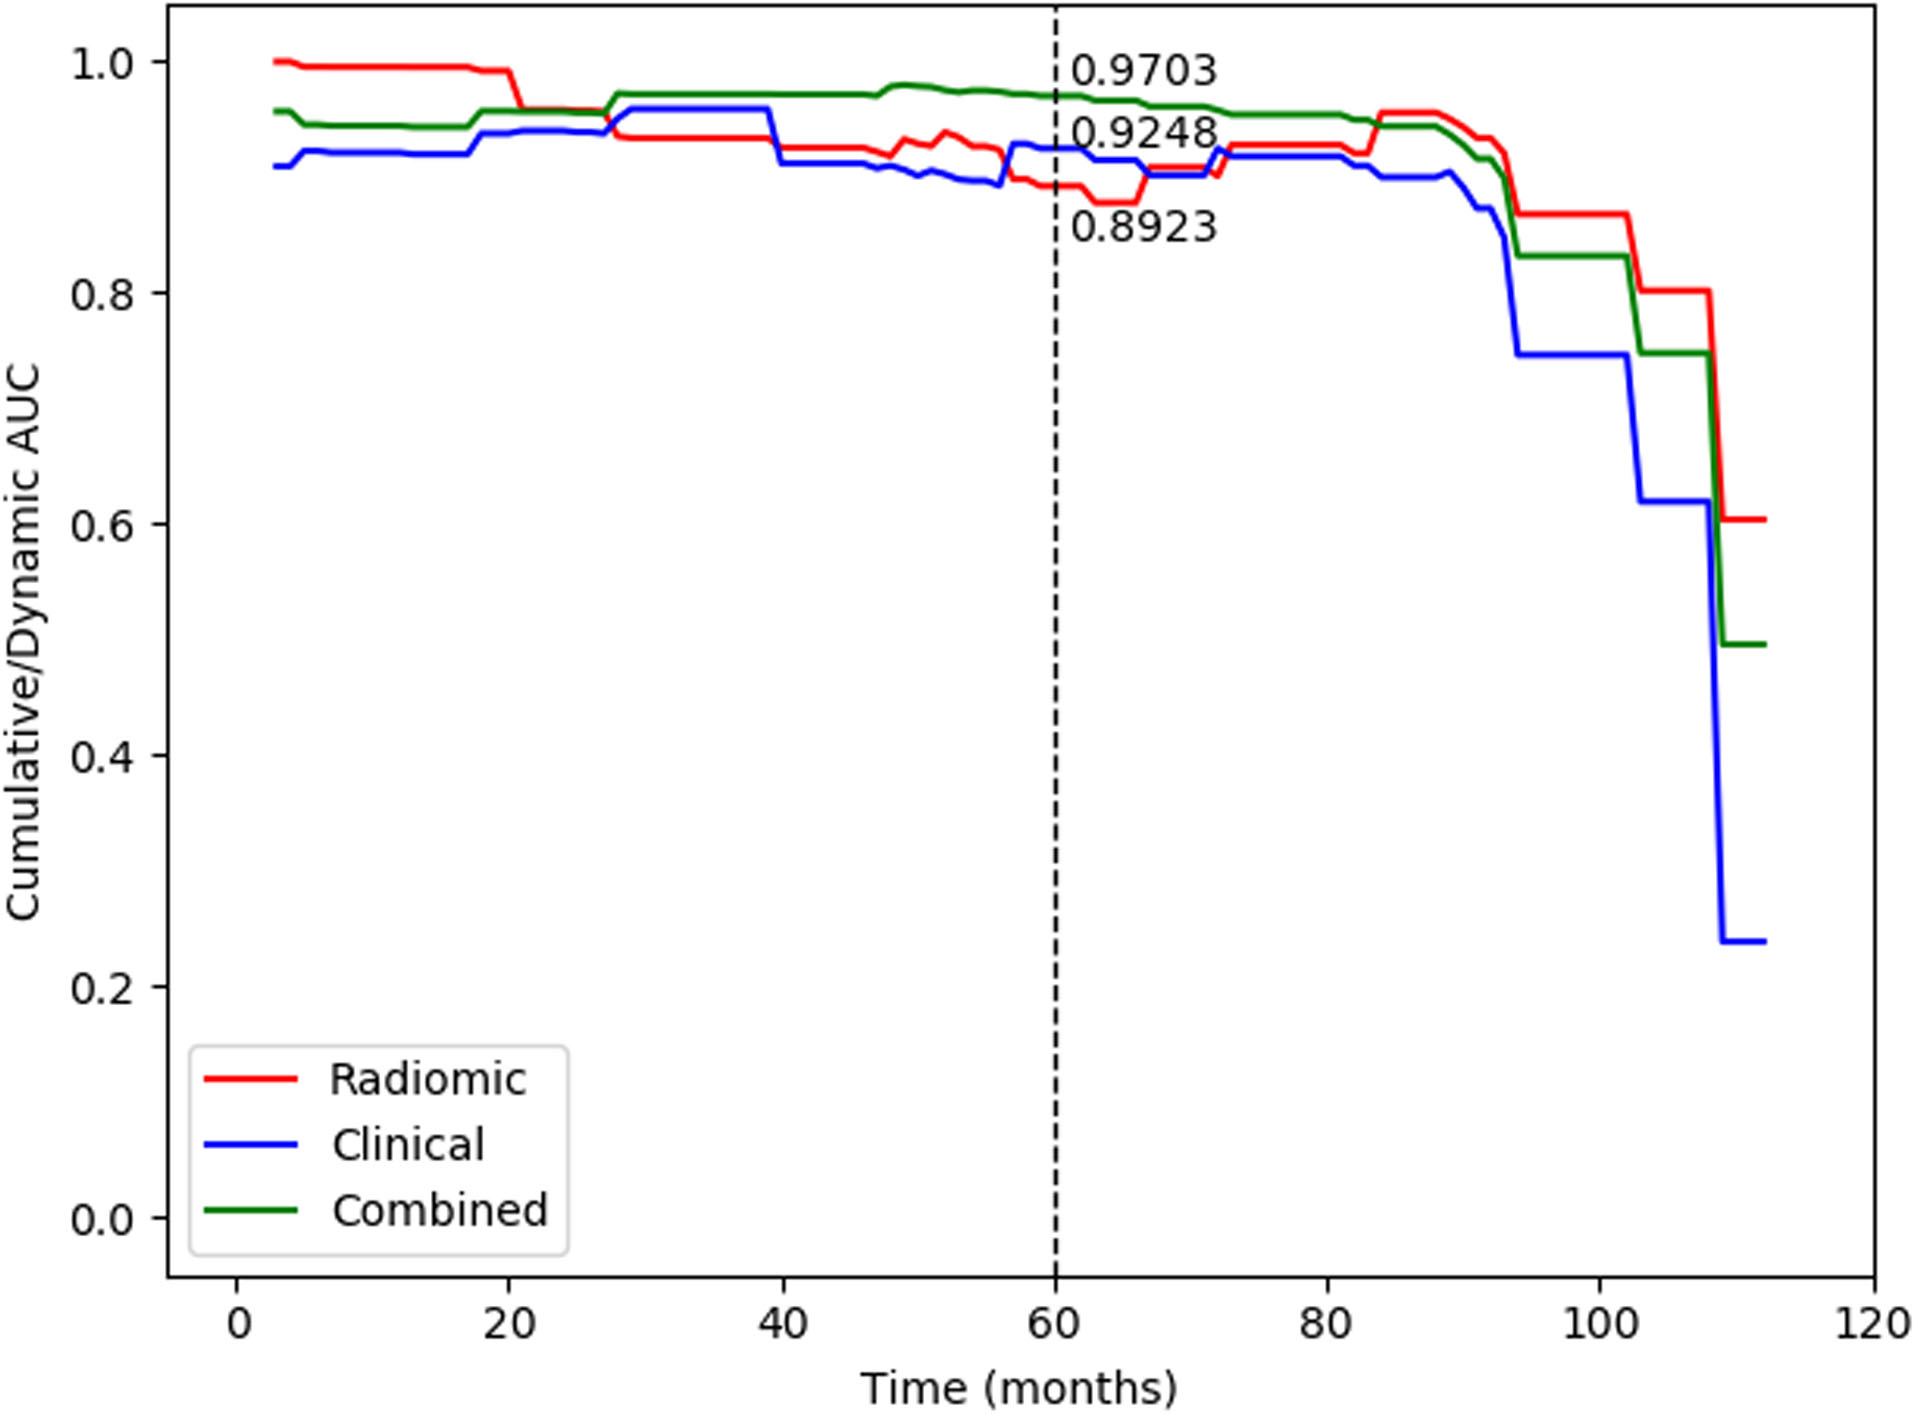
The cumulative/dynamic AUC (C/D AUC) curve was used to evaluate the model performance in a specific time range. The curve showed that the combined model achieved the most robust performance during the research period (Fig. 4). The mC/D AUC, which is likely to be the C-index, was calculated to measure the predictive efficiency of the model over all time ranges in Table 3. Compared to single PET/CT radiomic (mC/D AUC
4.Discussion
Radiomics of PET/CT combined with clinicopathologic features was successfully developed using the RSF method for predicting DFS in early-stage uterine cervical squamous cancer. This predictive model incorporated 6 radiomic (5 for CT and 1 for PET) and 6 clinicopathologic features, which showed better performance and more accurate prediction in the training and testing sets.
Recently, radiomics has emerged as an interdisciplinary medical engineering platform that exhibits potential clinical application prospects and has been applied to oncologic detection, diagnosis, therapeutic response and prognosis [11, 12, 13, 14, 15, 16]. Its essence is to extract high-throughput, quantitative medical imaging to describe the characteristics of tumors to improve the accuracy of diagnosis [37]. Compared to other carcinomas, radiomics analysis applied to the prognosis of uterine cervical cancer was less common, and most were advantageous for cervical cancer. Lucia et al. successfully developed a combined radiomic model based on PET/CT and MR for predicting recurrence in advanced uterine cervical cancer, and the predictive accuracy was as high as 90% using this radiomic model compared to 56–60% using standard clinical variables in external validation [15, 16]. Most likely due to the shorter follow-up time, few prognostic studies have attempted to compare early-stage uterine cervical cancer using PET/CT radiomic features. Our study intended to cover the shortage of the prognostic application of PET/CT to early-stage uterine cervical cancer.
Many studies have shown that radiomics combined with clinicopathologic features could enhance the predictive efficiency in prognosis and the therapeutic effect of malignances [38, 39, 40, 41], which was consistent with our results. We successfully extracted 6 radiomic features, including 5 for CT and 1 for PET, and established a model using the popular ensemble RSF method. The radiomic model achieved better predictive performance for the training and testing datasets than the 6 selected clinicopathologic models, which consisted of TLG, SCCA level, FIGO stage, LVSI, lymph node metastasis, and deep stromal invasion. In combination with these above clinicopathologic features, the compound radiomic predictors performed better than the single radiomic model. It is worth noting that the number of selected radiomic features derived from PET images was less than that derived from CT images in our study. The reason may be that features from PET images were more likely to be affected by the scanning protocols and reconstruction parameters than CT features [14].
There are some advantages in our study. Cox regression analysis, the most commonly used method for tumor prognosis in the clinic, reflects the linear relationships between variables and targets. However, not all conformed with linear correlations. Therefore, we used a machine learning approach for survival analysis based on the decision-tree ensemble RSF method for multivariate analysis, which has demonstrated robustness to censored data and noisy variables. It is able to detect not only a shift in nonlinear relationships (between variables and predicted target values) but also variable interactions. Moreover, RSF is suitable for high-dimensional and multimodal input data and naturally avoids overfitting [27, 42, 43]. Zhou et al. [42] showed that survival forest leads to better predictions than Cox regression, particularly for cases dealing simultaneously with a small sample size and a high number of variables. Furthermore, we used an extension of the ROC curve in survival analysis – the C/D AUC curve – to further evaluate the predictive performance of the model. It could evaluate prognostic efficiency in a specific time range and appears more clinically relevant and intuitive than the common ROC curve [33, 34, 35]. In our study, we found that the preoperative combined model showed the best overall performance during the follow-up period and had a high predictive efficiency with a C/D AUC of 0.9703 at 5 years since radical surgery. However, the predictive ability was obviously decreased after 100 months. A large number of patients lost during the long follow-up time might mainly contribute to this situation. Moreover, cervical cancer is a group of heterogeneous tumors based on distinctive histopathologic features. Because the majority pathological type of cervical cancer is squamous cell carcinoma, our study was performed in this homologous group of patients with the same histology to increase the generalizability of our findings.
Of course, our study had some limitations. This was a retrospective study with potential recall bias. In addition, although this model was well fitted in training and testing cohorts, prospective studies are still needed to confirm the predictive value of this model in external validation.
5.Conclusions
In conclusion, we successfully developed a compound radiomic model based on preoperative PET/CT images combined with clinicopathologic features, which achieved approval power in predicting DFS in early-stage uterine cervical squamous cancer patients. This individual model could provide more accurate relapse/metastasis-related information and could be helpful in individual decision-making.
References
[1] | F. Bray, J. Ferlay, I. Soerjomataram, R.L. Siegel, L.A. Torre and A. Jemal, Global cancer statistics 2018: GLOBOCAN estimates of incidence and mortality worldwide for 36 cancers in 185 countries, CA: A Cancer Journal for Clinicians 68: (6) ((2018) ), 394–424. |
[2] | F. Landoni, A. Maneo, A. Colombo, F. Placa, R. Milani, P. Perego et al., Randomised study of radical surgery versus radiotherapy for stage Ib-IIa cervical cancer, The Lancet 350: (9077) ((1997) ), 535–540. |
[3] | S.E. Waggoner, Cervical cancer, The Lancet 361: (9376) ((2003) ), 2217–2225. |
[4] | N. Bhatla, D. Aoki, D.N. Sharma and R. Sankaranarayanan Cancer of the cervix uteri, International Journal of Gynaecology and Obstetrics 143: ((2018) ), 22–36. |
[5] | W.J. Koh, N.R. Abu-Rustum, S. Bean, K. Bradley, S.M. Campos, K.R. Cho et al., Cervical Cancer, Version 3.2019, NCCN Clinical Practice Guidelines in Oncology, Journal of the National Comprehensive Cancer Network 17: (1) ((2019) ), 64–84. |
[6] | N. Gandy, M.A. Arshad, W.E. Park, A.G. Rockall and T.D. Barwick, FDG-PET Imaging in Cervical Cancer, Seminars in Nuclear Medicine 49: (6) ((2019) ), 461–470. |
[7] | L. Zhang, H. Sun, S. Du, W. Xu, J. Xin and Q. Guo, Evaluation of 18F-FDG PET/CT parameters for reflection of aggressiveness and prediction of prognosis in early-stage cervical cancer, Nuclear Medicine Communications 39: (11) ((2018) ), 1045–1052. |
[8] | C. Crivellaro, M. Signorelli, L. Guerra, E. De Ponti, A. Buda, C. Dolci et al., 18F-FDG PET/CT can predict nodal metastases but not recurrence in early stage uterine cervical cancer, Gynecologic Oncology 127: (1) ((2012) ), 131–135. |
[9] | H.H. Chung, S.Y. Kang et al., Prognostic value of preoperative intratumoral FDG uptake heterogeneity in early stage uterine cervical cancer, Gynecologic Oncology 27: (2) ((2016) ), e15. |
[10] | M.S. Yun, S.J. Kim, K. Pak, C.H. Lee, Additional Prognostic Value of SUVmax Measured by F-18 FDG PET/CT over Biological Marker Expressions in Surgically Resected Cervical Cancer Patients, Oncology Research and Treatment 38: (9) ((2015) ), 413–416. |
[11] | P. Lambin, E. Rios-Velazquez, R. Leijenaar, S. Carvalho, R.G. van Stiphout, P. Granton et al., Radiomics: extracting more information from medical images using advanced feature analysis, European Journal of Cancer 48: (4) ((2012) ), 441–446. |
[12] | T. Tsujikawa, T. Rahman, M. Yamamoto, S. Yamada, H. Tsuyoshi, Y. Kiyono et al., 18F-FDG PET radiomics approaches: comparing and clustering features in cervical cancer, Annals of Nuclear Medicine 31: (9) ((2017) ), 678–685. |
[13] | K. Li, H. Sun, Z. Lu, J. Xin, L. Zhang, Y. Guo et al., Value of [18F] FDG PET radiomic features and VEGF expression in predicting pelvic lymphatic metastasis and their potential relationship in early-stage cervical squamous cell carcinoma, European Journal of Radiology 106: ((2018) ), 160–166. |
[14] | M. Kirienko, L. Cozzi, L. Antunovic, L. Lozza, A. Fogliata, E. Voulaz et al., Prediction of disease-free survival by the PET/CT radiomic signature in non-small cell lung cancer patients undergoing surgery, European Journal of Nuclear Medicine and Molecular Imaging 45: (2) ((2018) ), 207–217. |
[15] | F. Lucia, D. Visvikis, M.C. Desseroit, O. Miranda, J.P. Malhaire, P. Robin et al., Prediction of outcome using pretreatment 18 F-FDG PET/CT and MRI radiomics in locally advanced cervical cancer treated with chemoradiotherapy, European Journal of Nuclear Medicine and Molecular Imaging 45: (5) ((2018) ), 768–786. |
[16] | F. Lucia, D. Visvikis, M. Vallières, M.C. Desseroit, O. Miranda, P. Robin et al., External validation of a combined PET and MRI radiomics model for prediction of recurrence in cervical cancer patients treated with chemoradiotherapy, European Journal of Nuclear Medicine and Molecular Imaging 46: (4) ((2019) ), 864–877. |
[17] | N. Singh and C.B. Gilks, The changing landscape of gynaecological pathology: WHO 2020 and beyond, (2020) , pp. 2–5. |
[18] | H. Kato and T. Torigoe, Radioimmunoassay for tumor antigen of human cervical squamous cell carcinoma, Cancer 40: (4) ((1977) ), 1621–1628. |
[19] | J.R. Olsen, F. Dehdashti, B.A. Siegel, I. Zighelboim, P.W. Grigsby and J.K. Schwarz, Prognostic utility of squamous cell carcinoma antigen in carcinoma of the cervix: association with pre- and posttreatment FDG-PET, International Journal of Radiation Oncology, Biology, Physics 81: (3) ((2011) ), 772–777. |
[20] | S. Markovina, S. Wang, L.E. Henke, C.J. Luke, S.C. Pak, T. DeWees et al., Serum squamous cell carcinoma antigen as an early indicator of response during therapy of cervical cancer, British Journal of Cancer 118: (1) ((2018) ), 72–78. |
[21] | L.T. Li, G. Jiang, Q. Chen, J.N. Zheng, Ki67 is a promising molecular target in the diagnosis of cancer, Molecular Medicine Reports 11: (3) ((2015) ), 1566–1572. |
[22] | S.N. Liang, Y.J. Huang, L.L. Liu and X. Liu, Study on the correlation between the expression of Ki67 and FasL and prognosis of cervical carcinoma, Genetics and Molecular Research 14: (3) ((2015) ), 8634–9. |
[23] | J.J.M. van Griethuysen, A. Fedorov, C. Parmar, A. Hosny, N. Aucoin, V. Narayan et al., Computational Radiomics System to Decode the Radiographic Phenotype, Cancer Research 77: (21) ((2017) ), e104–e107. |
[24] | H.J. Aerts, E.R. Velazquez, R.T. Leijenaar, C. Parmar, P. Grossmann, S. Carvalho et al., Decoding tumour phenotype by noninvasive imaging using a quantitative radiomics approach, Nature Communications 5: (1) ((2014) ), 1–9. |
[25] | Q. Liu, D. Sun, N. Li, J. Kim, D. Feng, G. Huang, et al, Predicting EGFR mutation subtypes in lung adenocarcinoma using (18)F-FDG PET/CT radiomic features, Translational Lung Cancer Research 9: (3) ((2020) ), 549. |
[26] | R.M. O’brien, A Caution Regarding Rules of Thumb for Variance Inflation Factors, Quality & Quantity 41: (5) ((2007) ), 673–690. |
[27] | H. Ishwaran, U.B. Kogalur, E.H. Blackstone, M.S. Lauer, Random survival forests, The Annals of Applied Statistics 2: (3) ((2008) ), 841–860. |
[28] | S. Seabold and J. Perktold, Econometric and statistical modeling with python, Proceedings of the 9th Python in Science Conference 57: ((2010) ), 61. |
[29] | F. Pedregosa, G. Varoquaux, A. Gramfort, V. Michel, B. Thirion, O. Grisel et al., Scikit-learn: Machine learning in Python, The Journal of Machine Learning Research 12: ((2011) ), 2825–2830. |
[30] | S. Pölsterl, P. Gupta, L. Wang, S. Conjeti, A. Katouzian and N. Navab, Heterogeneous ensembles for predicting survival of metastatic, castrate-resistant prostate cancer patients, F1000Research 5: ((2016) ), 2676. |
[31] | S. Pölsterl, N. Navab and A. Katouzian, Fast training of support vector machines for survival analysis, Joint European Conference on Machine Learning and Knowledge Discovery in Databases Springer, Cham. (2015) , pp. 243–259. |
[32] | S. Pölsterl, N. Navab and A. Katouzian, An efficient training algorithm for kernel survival support vector machines, arXiv preprint arXiv:161107054. (2016) . |
[33] | P.J. Heagerty, T. Lumley and M.S. Pepe, Time-dependent ROC curves for censored survival data and a diagnostic marker, Biometrics 56: (2) ((2000) ), 337–344. |
[34] | P.J. Heagerty and Y. Zheng, Survival model predictive accuracy and ROC curves, Biometrics 61: (1) ((2005) ), 92–105. |
[35] | J. Lambert and S. Chevret, Summary measure of discrimination in survival models based on cumulative/dynamic time-dependent ROC curves, Statistical Methods in Medical Research 25: (5) ((2016) ), 2088–2102. |
[36] | A. Zwanenburg, M. Vallières et al, The Image Biomarker Standardization Initiative: Standardized Quantitative Radiomics for High-Throughput Image-based Phenotyping, Radiology 295: (2) ((2020) ), 328–338. |
[37] | P. Lambin, R.T.H. Leijenaar, T.M. Deist, J. Peerlings, E.E.C. de Jong, J. van Timmeren et al., Radiomics: the bridge between medical imaging and personalized medicine, Nature reviews Clinical oncology 14: (12) ((2017) ), 749–762. |
[38] | K.H. Lue, Y.F. Wu, S.H. Liu, T.C. Hsieh, K.S. Chuang, H.H. Lin et al, Prognostic Value of Pretreatment Radiomic Features of 18F-FDG PET in Patients With Hodgkin Lymphoma, Clinical Nuclear Medicine 44: (10) ((2019) ), e559–e565. |
[39] | Y.H. Chen, K.H. Lue, S.C. Chu, B.S. Chang, L.Y. Wang, D.W. Liu et al., Combining the radiomic features and traditional parameters of 18 F-FDG PET with clinical profiles to improve prognostic stratification in patients with esophageal squamous cell carcinoma treated with neoadjuvant chemoradiotherapy and surgery, Annals of Nuclear Medicine 33: (9) ((2019) ), 657–670. |
[40] | W. Lv, Q. Yuan, Q. Wang, J. Ma, Q. Feng, W. Chen et al., Radiomics Analysis of PET and CT Components of PET/CT Imaging Integrated with Clinical Parameters: Application to Prognosis for Nasopharyngeal Carcinoma, Molecular Imaging and Biology 21: (5) ((2019) ), 954–964. |
[41] | P. Li, X. Wang, C. Xu, C. Liu, C. Zheng, M.J. Fulham et al., 18 F-FDG PET/CT radiomic predictors of pathologic complete response (pCR) to neoadjuvant chemotherapy in breast cancer patients, European Journal of Nuclear Medicine and Molecular Imaging 47: (5) ((2020) ), 1116–1126. |
[42] | Y. Zhou and J.J. McArdle, Rationale and Applications of Survival Tree and Survival Ensemble Methods, Psychometrika 80: (3) ((2015) ), 811–833. |
[43] | L. Morvan, T. Carlier, B. Jamet, C. Bailly, C. Bodet-Milin, P. Moreau et al., Leveraging RSF and PET images for prognosis of multiple myeloma at diagnosis, International Journal of Computer Assisted Radiology and Surgery 15: (1) ((2020) ), 129–139. |


