
Overexpression of HSP10 correlates with HSP60 and Mcl-1 levels and predicts poor prognosis in non-small cell lung cancer patients
Abstract
BACKGROUND:
HSP60 and its partner HSP10 are members of heat shock proteins (HSPs) family, which help mitochondrial protein to fold correctly. Mcl-1, a member of the Bcl-2 family, plays a crucial role in regulation of cell apoptosis. Aberrant expression of HSP10, HSP60 and Mcl-1 is involved in the development of many tumors.
OBJECTIVE:
To examine the association between expression of HSP10, HSP60 and Mcl-1 and clinicopathological features of non-small cell lung cancer (NSCLC).
METHODS:
Tissue microarrays including 53 non-cancerous lung tissues (Non-CLT) and 354 surgically resected NSCLC were stained with anti-HSP10, anti-HSP60 and anti-Mcl-1 antibodies respectively by immunohistochemistry.
RESULTS:
Higher expression of HSP10, HSP60 and Mcl-1 was found in NSCLC compared with Non-CLT. Both individual and combined HSP10 and HSP60 expression in patients with clinical stage III was higher than that in stage I
CONCLUSIONS:
High expression of HSP10, HSP60 and Mcl-1 might act as novel biomarker of poor prognosis for NSCLC patients.
1.Introduction
Lung cancer, particularly non-small cell lung cancer (NSCLC) is the most frequently diagnosed cancer and the leading cause of cancer-related death worldwide [1]. Approximately 80%–85% of diagnosed lung cancer patients are NSCLC, among which adenocarcinoma (ADC) and squamous cell carcinoma (SCC) are the most two common histological subtypes [2]. Early detection of NSCLC is of critical importance for a favorable outcome after surgical resection, since the five-year survival rate of patients with stage IB could reach 68% [3]. Unfortunately, most of the patients are in advanced stages at the time of diagnosis [4]. Although recent years have seen great progress in treatment for patients with late stage lung cancer, the survival rate is still very low [3, 4]. Therefore, it is of great necessity and urgency to discover and identify new biomarker(s) for the prediction, diagnosis, prognosis judgment and targeted therapy of NSCLC, in turn to lead more effective treatment and reduction of mortality.
Heat shock proteins (HSPs), also known as stress proteins, are highly conserved and maintain cellular homeostasis under various stress conditions, such as hyperthermia and hypoxia [5]. The 10 kDa heat shock protein (HSP10), predominantly located in mitochondria, is a co-chaperone protein of the 60 kDa heat shock protein (HSP60). They interact to fold and transport proteins to the mitochondria, in order to maintain the stability of the mitochondrial protein [6]. Aberrant expression of HSP10 and HSP60 is involved in the progression of several major kinds of tumors, including colorectal adenocarcinoma and glioblastoma [7, 8, 9]. In addition, HSP10 and HSP60 are also involved in cell apoptosis. It is well known that the activation of Bak/Bax is considered to be the most critical step of mitochondrial pathway which leads to cell apoptosis [10]. Low expression of HSP10 can promote testosterone-induced apoptosis in mouse ovarian granulosa cells by upregulating pro-apoptotic factor Bax [11]. HSP60 can also form complexes with Bax and Bak to play an anti-apoptotic function [12, 13].
Myeloid Cell Leukemia 1 (Mcl-1) is known as a member of B-cell Lymphoma 2 (Bcl-2) family that strictly controls the intrinsic apoptotic pathways [14]. Accumulating evidences suggest that Mcl-1 plays crucial roles in suppressing mitochondria-dependent apoptosis [15] through regulation of the balance between the long and short variants of the Mcl-1 gene to regulate mitochondrial fusion and fission machinery [16]. Moreover, elevated Mcl-1 has also been found in different types of cancer, such as breast cancer, acute myeloid leukemia, hepatocellular carcinoma and lung cancer [17, 18, 19, 20].
It still remains unclear whether the expression of HSP10, HSP60 and Mcl-1 is related to clinicopathological features of NSCLC patients. In this study, we carried out the present retrospective study by using NSCLC tissue microarrays (TMAs) and immunohistochemistry (IHC) to evaluate the potential correlation between HSP10, HSP60 and Mcl-1, and to investigate whether there is a relationship between their expression, clinicopathological parameters and the prognostic impact in NSCLC.
2.Materials and methods
2.1Ethical statement
All protocols related to the research were approved by the Institutional Human Experiment and Ethics Committee of the Second Xiangya Hospital of Central South University (approval No. S039/2011). Informed consent was obtained from all subjects before surgery.
2.2Clinical data
A total of 53 non-cancerous lung tissues (Non-CLT) and 354 NSCLC tissues resected from 2003 to 2013 in the Thoracic Surgery Department of the Second Xiangya Hospital were obtained from the Department of pathology, the Second Xiangya Hospital of Central South University. No one received radiation therapy or chemotherapy. All patients obtained the exact histological diagnosis which was confirmed by well-experienced pathologists. The clinical stage of each case was confirmed according to the Eighth Edition Lung Cancer Stage Classification [21]. Clinicopathological data (Supplemental Table 1) were extracted from the clinical record. In this study, we constructed NSCLC TMAs by using the TMA technology as previously described [22, 23].
2.3Antibody selections
Staining was done using primary antibodies as follows: HSP10 (Catalog: SC-376313; Santa Cruz Biotechnology, CA; 1:1000 dilution); HSP60 (Catalog: #12165, Cell Signaling Technology; 1:1500 dilution); Mcl-1 (Catalog: #94296, Cell Signaling Technology; 1:300 dilution).
2.4Immunohistochemistry and scores
The staining for HSP10, HSP60 and Mcl-1 in TMAs of NSCLC and non-CLT was carried out as described previously and the staining conditions of each antibody was adjusted in the light of previous laboratory experience [24, 25].
Immunostaining was scored independently by QW and SF. The score was based on intensity and distribution of staining described as follows: the total score is percentage score plus intensity score. Specifically, the intensity of staining signal was scored as 0 (negative), 1 (mild expression), 2 (moderate expression) and 3 (strong expression). According to the percentage of positive cells, the percentage score included 0 (0%), 1 (1–25%), 2 (26–50%), 3 (51–75%) and 4 (76–100%). The total score ranges from 0 to 7. According to NSCLC patients’ overall survival (OS) using the log-rank test, the best cutoff levels for the three proteins are 5, 4 and 4, respectively. The total scores more than 5, 4 and 4 were considered to be high expression of these three proteins, others were considered low expression, respectively. Agreement between the two pathologists is 95%, and borderline and equivocal cases are solved through remained and discussion.
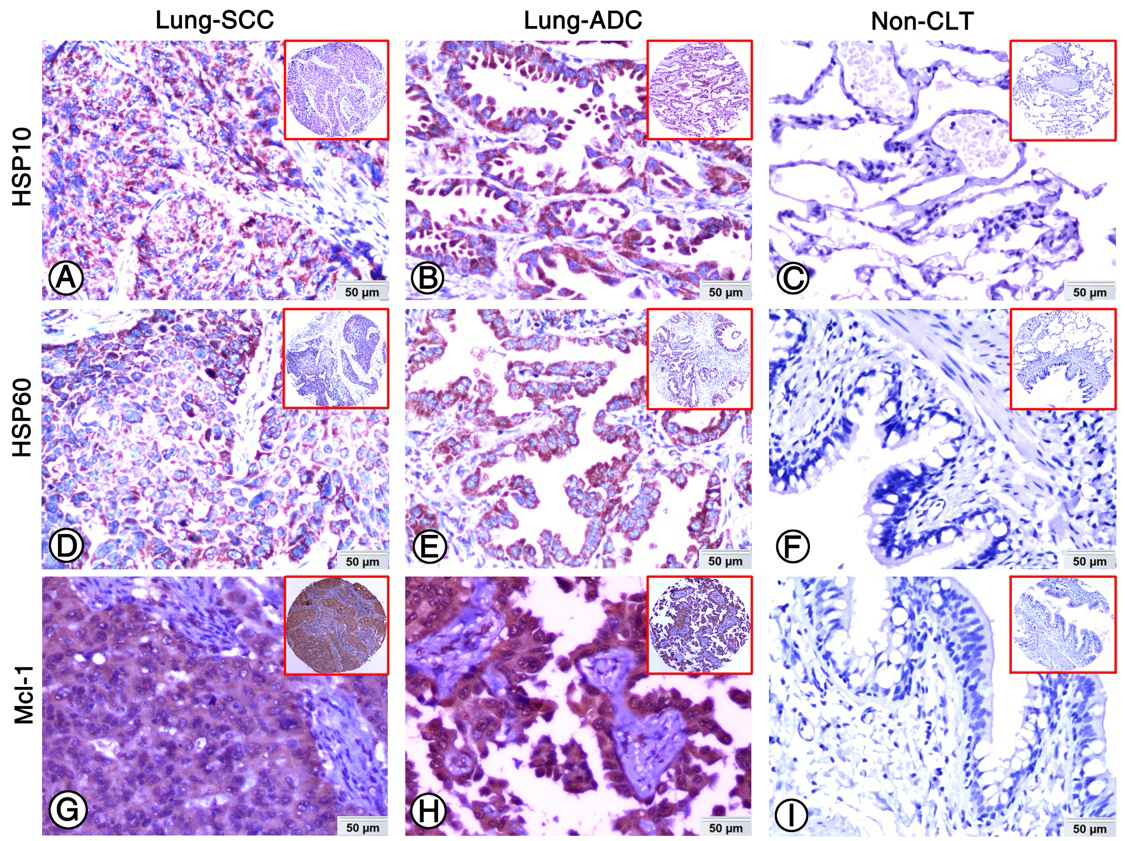
Figure 1.
Expression of HSP10, HSP60 and Mcl-1 in lung ADC, lung SCC and Non-CLT were detected by IHC. Strong positive staining of HSP10 (A), HSP60 (D) and Mcl-1 (G) was found in cell cytoplasm of lung SCC cells. Strong positive staining of HSP10 (B), HSP60 (E) and Mcl-1 (H) was also showed in cell cytoplasm of lung ADC cells. Negative staining of HSP10 (C), HSP60 (F) and Mcl-1 proteins was found in Non-CLT (200
2.5Statistical analysis
Statistical analysis was performed by using SPSS 24.0 software. The difference expression of proteins between NSCLC and Non-CLT was analyzed by Chi square test, which was also used for analyzing the relationship between HSP10, HSP60 and Mcl-1 and the clinicopathological features of NSCLC. Spearman’s rank correlation coefficient was performed on the correlation between HSP10, HSP60 and Mcl-1. Kaplan-Meier analysis was performed for survival rate, and comparisons of survival rate curve were analyzed by log-rank test. Cox proportional hazards regression model was carried out to assess independent prognostic factors. Statistical significance was set at
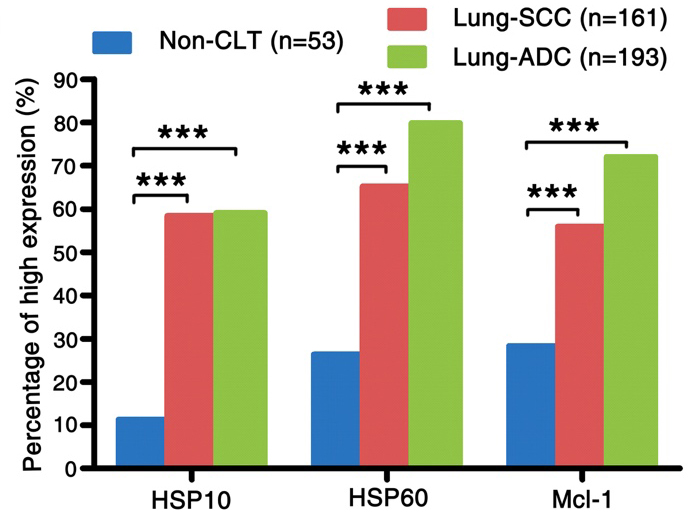
Figure 2.
The comparison of expression of HSP10, HSP60 and Mcl-1 in lung SCC and lung ADC compared to the Non-CLT. The expression of HSP10, HSP60 and Mcl-1 in lung SCC and lung ADC was significantly higher than those in Non-CLT (all
3.Results
3.1Expression of HSP10, HSP60 and Mcl-1 increased significantly in NSCLC
The expression and subcellular localization of HSP10, HSP60 and Mcl-1 was detected in NSCLC and Non-CLT tissues by IHC. These three proteins were stained in cytoplasm of lung SCC and ADC cells (Fig. 1A, B, D, E, G and H), but were absent from Non-CLT (Fig. 1C, F and I). The high expression percentage of HSP10 and HSP60 was 58.4% (94/161) and 65.2% (105/161) in lung SCC, 59.1% (114/193) and 79.8% (154/193) in lung ADC, and 11.3% (6/53) and 26.4% (14/53) in Non-CLT, respectively. For Mcl-1, the
Table 1
Analysis of the association between expression of HSP10, HSP60 and Mcl-1 proteins and clinicopathological features of NSCLC (
| Clinicopathological features ( | HSP10 | HSP60 | Mcl-1 | HSP10/HSP60 | HSP10/HSP60/Mcl-1 | ||||||||||
|---|---|---|---|---|---|---|---|---|---|---|---|---|---|---|---|
| High (%) | Low (%) | High (%) | Low (%) | High (%) | Low (%) | P | N | P | N | ||||||
| Age (years) | |||||||||||||||
| | 60 (61.9) | 37 (38.1) | 68 (70.1) | 29 (29.9) | 63 (64.9) | 34 (35.1) | 50 (51.5) | 47 (48.5) | 37 (38.1) | 60 (61.9) | |||||
| | 149 (57.6) | 109 (42.4) | 0.545 | 191 (74.3) | 66 (25.7) | 0.423 | 166 (64.6) | 91 (35.4) | 1.000 | 133 (51.8) | 124 (48.2) | 1.000 | 95 (37.0) | 162 (63.0) | 0.902 |
| Gender | |||||||||||||||
| Male ( | 158 (58.3) | 113 (41.7) | 198 (73.1) | 73 (26.9) | 176 (64.9) | 95 (35.1) | 139 (51.3) | 132 (48.7) | 101 (37.3) | 170 (62.7) | |||||
| Female ( | 50 (60.2) | 33 (39.8) | 0.800 | 61 (73.5) | 22 (26.5) | 1.000 | 53 (63.9) | 30 (36.1) | 0.896 | 44 (53.0) | 39 (47.0) | 0.803 | 31 (37.3) | 52 (62.7) | 1.000 |
| Clinical stages | |||||||||||||||
| Stage I–II ( | 78 (51.7) | 73 (48.3) | 101 (66.9) | 50 (33.1) | 90 (59.6) | 61 (40.4) | 67 (44.4) | 84 (55.6) | 47 (31.1) | 104 (68.9) | |||||
| Stage III ( | 130 (64.0) | 73 (36.0) | 0.022 | 158 (77.8) | 45 (22.2) | 0.029 | 139 (68.5) | 64 (31.5) | 0.092 | 116 (57.1) | 87 (42.9) | 0.018 | 85 (41.9) | 118 (58.1) | 0.045 |
| LN status | |||||||||||||||
| LNM ( | 133 (62.4) | 80 (37.6) | 166 (77.9) | 47 (22.1) | 140 (65.7) | 73 (34.3) | 118 (55.4) | 95 (44.6) | 83 (39.0) | 130 (61.0) | |||||
| No LNM ( | 75 (53.2) | 66 (46.8) | 0.098 | 93 (66.0) | 48 (34.0) | 0.014 | 89 (63.1) | 52 (36.9) | 0.650 | 65 (46.1) | 76 (53.9) | 0.103 | 49 (34.8) | 92 (65.2) | 0.434 |
| Histological type | |||||||||||||||
| SCC ( | 94 (58.4) | 67 (41.6) | 105 (65.2) | 56 (34.8) | 90 (55.9) | 71 (44.1) | 76 (47.2) | 85 (52.8) | 51 (31.7) | 110 (68.3) | |||||
| ADC ( | 114 (59.1) | 79 (40.9) | 0.914 | 154 (79.8) | 39 (20.2) | 0.003 | 139 (72.0) | 54 (28.0) | 0.002 | 107 (55.4) | 86 (44.6) | 0.135 | 81 (42.0) | 112 (58.0) | 0.048 |
| Pathological grade | |||||||||||||||
| Well ( | 2 (33.3) | 4 (66.7) | 2 (33.3) | 4 (66.7) | 6 (100.0) | 0 (0.0) | 1 (16.7) | 5 (83.3) | 1 (16.7) | 5 (83.3) | |||||
| Moderate ( | 84 (57.5) | 62 (42.5) | 105 (71.9) | 41 (28.1) | 94 (64.4) | 52 (35.6) | 71 (48.6) | 75 (51.4) | 50 (34.2) | 96 (65.8) | |||||
| Poor ( | 122 (60.4) | 80 (39.6) | 0.384 | 152 (75.2) | 50 (24.8) | 0.067 | 129 (63.9) | 73 (36.1) | 0.188 | 111 (55.0) | 91 (45.0) | 0.113 | 81 (40.1) | 121 (59.9) | 0.309 |
| Survival status | |||||||||||||||
| Alive ( | 99 (51.0) | 95 (49.0) | 131 (67.5) | 63 (32.5) | 110 (56.7) | 84 (43.3) | 84 (43.3) | 110 (56.7) | 53 (27.3) | 141 (72.7) | |||||
| Dead ( | 109 (68.1) | 51 (31.9) | 0.001 | 128 (80.0) | 32 (20.0) | 0.011 | 119 (74.4) | 41 (25.6) | 0.001 | 99 (61.9) | 61 (47.9) | 0.001 | 79 (49.4) | 81 (50.6) | 0.000 |
percentage of high expression was 55.9% (90/161), 72.0% (139/193) and 28.3% (15/53) in lung SCC, ADC and Non-CLT. As shown in Fig. 2, the level of HSP10, HSP60 and Mcl-1 expression in lung SCC and ADC was remarkably increased (all
Table 2
The pairwise association between expression of HSP10, HSP60 and Mcl-1 in 354 cases of NSCLC
| HSP10 | HSP60 | Mcl-1 | |
|---|---|---|---|
| HSP10 | |||
| Spearman’s correlation coefficient | 1 | 0.399 | 0.137 |
| Sig. (2-tailed) | 0.000 | 0.010 | |
| HSP60 | |||
| Spearman’s correlation coefficient | 0.399 | 1 | 0.219 |
| Sig. (2-tailed) | 0.000 | 0.000 | |
| Mcl-1 | |||
| Spearman’s correlation coefficient | 0.137 | 0.219 | 1 |
| Sig. (2-tailed) | 0.010 | 0.000 |
3.2Association between expression of proteins and clinicopathological features of NSCLC
We further analyzed the association between elevated expression of HSP10, HSP60 and Mcl-1 and clinicopathological features. The data in Table 1 shows that the percentage of overexpression of HSP10 and HSP60 in patients with clinical stage III was higher than that in clinical stage I
3.3Correlation between HSP10, HSP60 and Mcl-1 expression in NSCLC
We analyzed the correlation between HSP10, HSP60 and Mcl-1 expression in NSCLC. As data shown in Table 2, the overexpression of HSP10 was positively correlated with expression of HSP60 and Mcl-1 in NSCLC (
3.4Status of expression of HSP10, HSP60 and Mcl-1 on patients’ prognosis
Moreover, we used Kaplan-Meier analysis to estimate the association between expression of the three proteins and patients’ survival rate with lung SCC and ADC alone or in different combination. As shown in Fig. 3, the survival rates of lung SCC patients with low HSP10 expression (
Figure 3.
Kaplan-Meier curves for overall survival of lung SCC and ADC patients with expression of HSP10, HSP60 and Mcl-1. (A) Lung SCC patients with high expression of HSP10 showed worse overall survival rates compared to patients with low HSP10 expression (
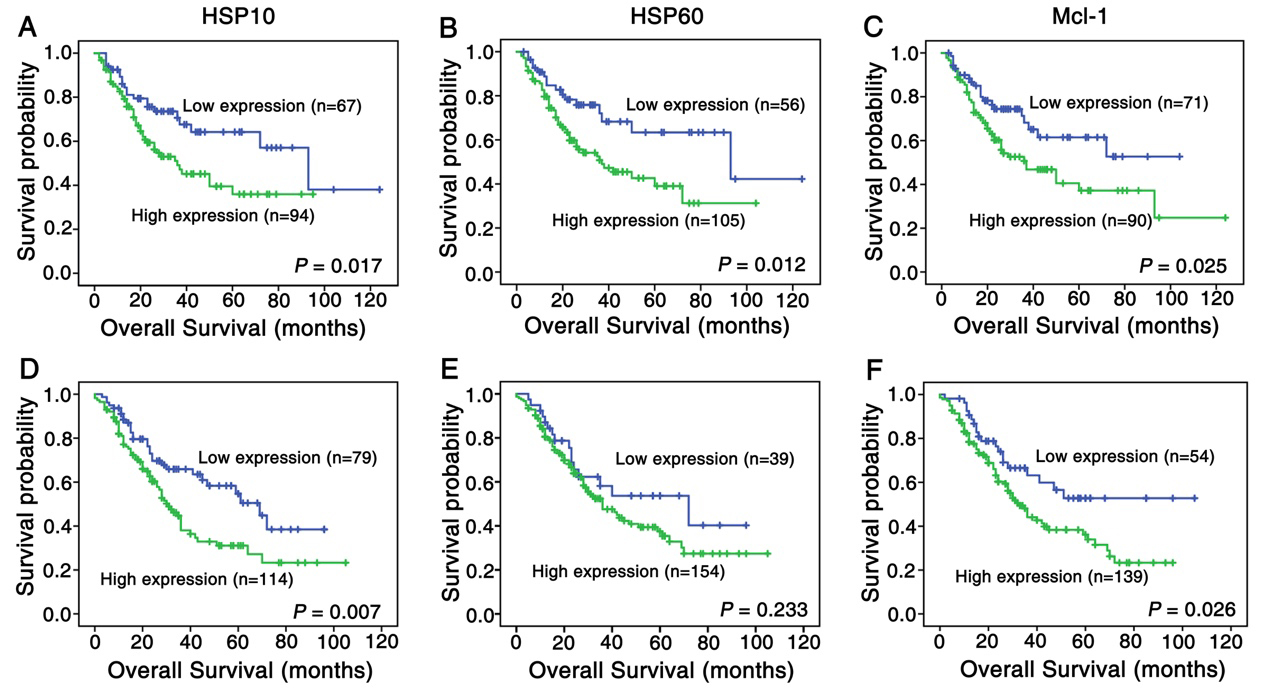
Figure 4.
Kaplan-Meier curves for overall survival of lung SCC and ADC patients with combined expression of HSP10/HSP60 and HSP10/HSP60/Mcl-1. (A) Kaplan-Meier curves showed lung SCC patients with combined high expression of HSP60 and HSP10 had worse overall survival rates than these with others (
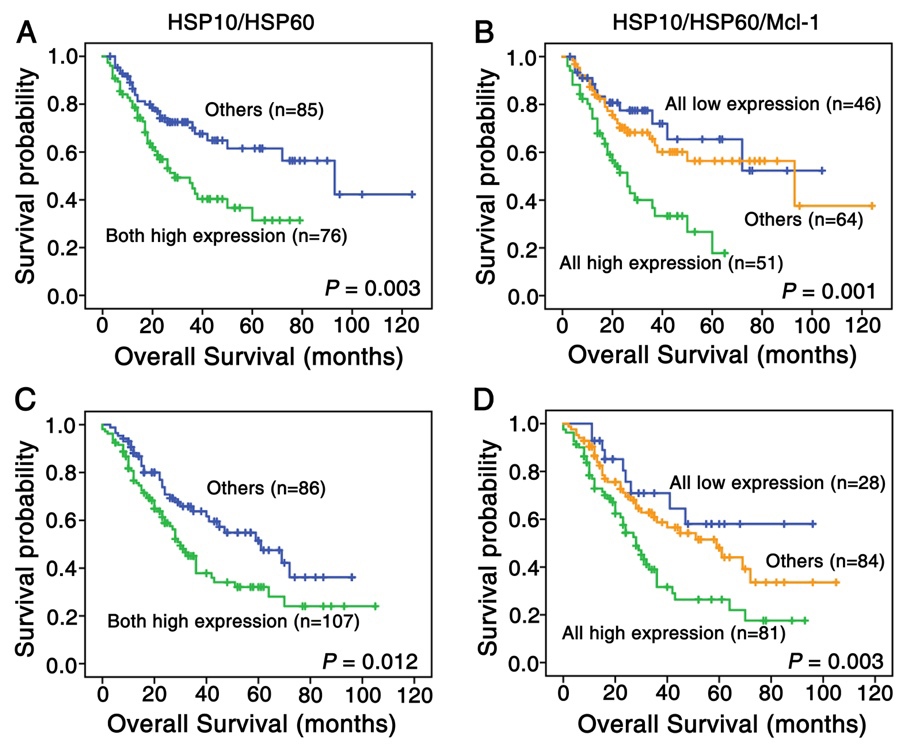
Table 3
Summary of univariate/multivariate analysis for overall survival in patients with lung SCC (
| Variables | Univariate analysis | Multivariate analysis | ||||
|---|---|---|---|---|---|---|
| Average survival time (SE) | 95% CI | Exp (B) | 95.0% CI | |||
| HSP10 | ||||||
| High expression | 48.766 (4.511) | 39.925–57.607 | 0.017 | 1.463 | 0.840–2.550 | 0.179 |
| Low expression | 77.114 (8.269) | 60.905–93.322 | ||||
| HSP60 | ||||||
| High expression | 51.516 (4.992) | 41.733–61.300 | 0.012 | 1.609 | 0.873–2.976 | 0.128 |
| Low expression | 80.509 (8.967) | 62.934–98.087 | ||||
| Mcl-1 | ||||||
| High expression | 56.467 (6.553) | 43.623–69.310 | 0.025 | 1.333 | 0.784–2.256 | 0.290 |
| Low expression | 69.234 (6.155) | 57.197–81.306 | ||||
| Clinical stages | ||||||
| Stage I–II | 77.678 (5.901) | 66.111–89.244 | 0.000 | 1.895 | 1.004–3.578 | 0.049 |
| Stage III | 53.732 (5.906) | 42.157–65.307 | ||||
| LN status | ||||||
| LNM | 46.512 (4.476) | 37.739–55.258 | 0.005 | 1.709 | 0.958–3.051 | 0.070 |
| No LNM | 80.439 (8.389) | 63.996–96.881 | ||||
| Pathological grade | ||||||
| Well/moderated | 68.856 (5.510) | 58.763–78.950 | 0.004 | 1.970 | 1.152–3.372 | 0.013 |
| Poor | 56.314 (6.201) | 44.160–68.469 | ||||
| Age | ||||||
| | 51.443 (5.738) | 40.196–62.690 | 0.776 | 1.005 | 0.575–1.756 | 0.986 |
| | 65.619 (6.273) | 53.324–77.913 | ||||
| Gender | ||||||
| Female | 64.358 (6.912) | 50.836–77.159 | 0.063 | 0.318 | 0.075–1.342 | 0.119 |
| Male | 62.314 (5.533) | 51.470–73.159 | ||||
Abbreviations: CI, confidence interval; Exp(B), odds ratio; SE, standard error; LNM, lymph node metastasis; SCC, squamous cell carcinoma.
Table 4
Summary of univariate/multivariate analysis for overall survival in patients with lung ADC (
| Variables | Univariate analysis | Multivariate analysis | ||||
|---|---|---|---|---|---|---|
| Average survival time (SE) | 95% CI | Exp (B) | 95.0% CI | |||
| HSP10 | ||||||
| High expression | 44.716 (4.333) | 36.224–53.208 | 0.007 | 1.763 | 1.086–2.862 | 0.022 |
| Low expression | 59.130 (4.821) | 49.680–68.580 | ||||
| HSP60 | ||||||
| High expression | 49.987 (3.847) | 42.447–57.526 | 0.233 | 0.795 | 0.433–1.457 | 0.457 |
| Low expression | 57.787 (6.878) | 44.306–71.268 | ||||
| Mcl-1 | ||||||
| High expression | 45.140 (3.484) | 38.311–51.970 | 0.026 | 1.845 | 1.109–2.256 | 0.018 |
| Low expression | 67.201 (6.419) | 54.619–79.782 | ||||
| Clinical stages | ||||||
| Stage I–II | 59.815 (4.579) | 50.839–68.790 | 0.000 | 1.547 | 0.933–2.567 | 0.091 |
| Stage III | 43.371 (4.264) | 35.013–51.728 | ||||
| LN status | ||||||
| LNM | 45.793 (4.258) | 37.447–54.139 | 0.002 | 1.741 | 1.016–2.984 | 0.044 |
| No LNM | 59.878 (4.831) | 50.408–69.348 | ||||
| Pathological grade | ||||||
| Well/moderated | 53.915 (4.572) | 44.954–62.876 | 0.113 | 1.199 | 0.804–1.790 | 0.374 |
| Poor | 48.897 (4.585) | 39.910–57.883 | ||||
| Age | ||||||
| | 41.866 (4.407) | 33.229–50.502 | 0.510 | 1.073 | 0.674–1.709 | 0.766 |
| | 53.961 (4.113) | 45.900–62.021 | ||||
| Gender | ||||||
| Female | 52.183 (4.935) | 42.510–61.855 | 0.457 | 0.864 | 0.555–1.344 | 0.516 |
| Male | 50.635 (4.274) | 42.257–59.012 | ||||
Abbreviations: CI, confidence interval; Exp(B), odds ratio; SE, standard error; LNM, lymph node metastasis; ADC, adenocarcinoma.
Furthermore, we analyzed the correlation between survival rate and clinicopathological features. As the data shown in Tables 3 and 4, for lung SCC and ADC patients, the survival rate of patients in clinical stage III was lower than that of patients in clinical stage I
We further investigated whether the high HSP10, HSP60 and/or Mcl-1 expression could act as independent prognostic marker for NSCLC patients via Cox proportional risk regression analysis. Table 3 showed that pathological grade (
4.Discussion
HSP10 is a co-chaperone protein of HSP60 in mitochondria where it is involved in folding and transporting proteins into mitochondria, and maintaining the stability of mitochondrial proteins [6]. In addition, HSP10 plays a crucial role in cancer progression and development [26], as indicated by its increased expression in many kinds of malignant tumors, including astrocytoma, colorectal cancer, and liver cancer [7, 27, 28]. It has suggested that HSP10 might be an independent prognostic factor for poor prognosis of nasopharyngeal carcinoma and invasive ductal breast carcinoma [29, 30]. In this study, we found higher HSP10, HSP60 and Mcl-1 expression in NSCLC compared with Non-CLT. Patients in clinical stage III had higher HSP10 and/or HSP60 than that in stage I
Our results indicated that the expression of HSP10 was significantly increased in NSCLC, which is consistent with the previous discoveries. In addition, increased expression of HSP10 in patients with advanced clinical stage provides further evidence for its role in tumorigenesis and progression of NSCLC. The synergistic effects of HSP10 and HSP60 may occur not only in maintaining the stability of mitochondrial protein, but also in the process of carcinogenesis. Indeed, we found that both HSP10 and HSP60 were highly expressed in NSCLC compared with Non-CLT, and the percentage of patients with the combined high expression of HSP10 and HSP60 in clinical stage III was significantly higher than that in clinical stage I
Our data showed that both HSP10 and HSP60 expression were positively correlated with Mcl-1 expression. Patients with combined overexpression of HSP10, HSP60 and Mcl-1 owned lower OS rate than those with other phenotypes. All these results strongly indicate that HSP10 and HSP60 might be involved in the anti-apoptosis pathway of Mcl-1 protein. A plausible explanation is that the expression of HSP10, HSP60 and Mcl-1 could be regulated by same transcription regulator, such as signal transducer and activator of transcription 3 (STAT3), which expresses highly in NSCLC and plays an inhibitory role in the process of tumor cell apoptosis [35, 36]. Previous studies found that the inactivation of STAT3 can downregulate the transcriptional level of MCL-1 gene [36, 37]. Since the bidirectional promoter between HSP10 and HSP60 contains STAT3-responsive element, STAT3 can also associate with this binding site to induce the up-regulation of HSP10 and HSP60 levels [38]. Another likely explanation is that both HSP60 and Mcl-1 are involved in the same signal pathway. On one hand, as a highly unstable protein, Mcl-1 is very sensitive to activity of mechanistic target of rapamycin complex 1 (mTORC1)-dependent translation [39, 40]. On the other hand, HSP60 gene knockdown can activate AMPK which inhibit mTORC1 and its downstream targets, thereby reducing protein synthesis [9, 41]. As mentioned above, it indicates that HSP60 might affect Mcl-1 expression level through mTORC1 pathway. The regulatory network of Mcl-1 is very complicated and the underlying mechanisms of relationship between HSP10, HSP60 and Mcl-1 still need further study in the future.
In summary, the expression of HSP10, HSP60 and Mcl-1 in NSCLC patients increased significantly. HSP10 and HSP60 may play a synergistic role in the development of NSCLC and participate in the anti-apoptosis pathway of mitochondria in NSCLC. HSP10 and HSP60 might be regarded as novel biomarkers of poor prognosis for NSCLC patients.
Acknowledgments
The work was supported by National Natural Science Foundation of China (grant No. 81703009, 81773218 and 81972838) and Natural Science Foundation of Hunan Province (grant No. 2017JJ3457).
Conflict of interest
The authors have no conflicts of interest to declare.
References
[1] | F. Bray, J. Ferlay, I. Soerjomataram, R.L. Siegel, L.A. Torre and A. Jemal, Global cancer statistics 2018: GLOBOCAN estimates of incidence and mortality worldwide for 36 cancers in 185 countries, CA: A Cancer Journal for Clinicians 68: ((2018) ), 394–424. |
[2] | N. Duma, R. Santana-Davila and J.R. Molina, Non-small cell lung cancer: Epidemiology, screening, diagnosis, and treatment, Mayo Clinic Proceedings 94: ((2019) ), 1623–1640. |
[3] | V.W. Rusch, K. Chansky, H.L. Kindler, A.K. Nowak, H.I. Pass, D.C. Rice, L. Shemanski, F. Galateau-Salle, B.C. McCaughan, T. Nakano, E. Ruffini, J.P. van Meerbeeck, M. Yoshimura, I. Staging, a.b. Prognostic Factors Committee and I. Participating, The IASLC mesothelioma staging project: Proposals for the M descriptors and for revision of the TNM stage groupings in the forthcoming (Eighth) edition of the TNM classification for mesothelioma, Journal of Thoracic Oncology 11: ((2016) ), 2112–2119. |
[4] | S. Walters, C. Maringe, M.P. Coleman, M.D. Peake, J. Butler, N. Young, S. Bergstrom, L. Hanna, E. Jakobsen, K. Kolbeck, S. Sundstrom, G. Engholm, A. Gavin, M.L. Gjerstorff, J. Hatcher, T.B. Johannesen, K.M. Linklater, C.E. McGahan, J. Steward, E. Tracey, D. Turner, M.A. Richards, B. Rachet and I.M.W. Group, Lung cancer survival and stage at diagnosis in Australia, Canada, Denmark, Norway, Sweden and the UK: A population-based study, 2004–2007, Thorax 68: ((2013) ), 551–564. |
[5] | C.W. Yun, H.J. Kim, J.H. Lim and S.H. Lee, Heat shock proteins: Agents of cancer development and therapeutic targets in anti-cancer therapy, Cells 9: ((2019) ), 60. |
[6] | A. Hoter, S. Rizk and H.Y. Naim, The multiple roles and therapeutic potential of molecular chaperones in prostate cancer, Cancers 11: ((2019) ), 1194. |
[7] | W. Fan, S.S. Fan, J. Feng, D. Xiao, S. Fan and J. Luo, Elevated expression of HSP10 protein inhibits apoptosis and associates with poor prognosis of astrocytoma, PloS One 12: ((2017) ), e0185563. |
[8] | F. Rappa, A. Pitruzzella, A. Marino Gammazza, R. Barone, E. Mocciaro, G. Tomasello, F. Carini, F. Farina, G. Zummo, E. Conway de Macario, A.J. Macario and F. Cappello, Quantitative patterns of Hsps in tubular adenoma compared with normal and tumor tissues reveal the value of Hsp10 and Hsp60 in early diagnosis of large bowel cancer, Cell Stress and Chaperones 21: ((2016) ), 927–933. |
[9] | H. Tang, J. Li, X. Liu, G. Wang, M. Luo and H. Deng, Down-regulation of HSP60 suppresses the proliferation of glioblastoma cells via the ROS/AMPK/mTOR pathway, Scientific Reports 6: ((2016) ), 28388. |
[10] | M.C. Wei, W.X. Zong, E.H. Cheng, T. Lindsten, V. Panoutsakopoulou, A.J. Ross, K.A. Roth, G.R. MacGregor, C.B. Thompson and S.J. Korsmeyer, Proapoptotic BAX and BAK: A requisite gateway to mitochondrial dysfunction and death, Science 292: ((2001) ), 727–730. |
[11] | K.K. Zhao, Y.G. Cui, Y.Q. Jiang, J. Wang, M. Li, Y. Zhang, X. Ma, F.Y. Diao and J.Y. Liu, Effect of HSP10 on apoptosis induced by testosterone in cultured mouse ovarian granulosa cells, European Journal of Obstetrics, Gynecology, and Reproductive Biology 171: ((2013) ), 301–306. |
[12] | S.R. Kirchhoff, S. Gupta and A.A. Knowlton, Cytosolic heat shock protein 60, apoptosis, and myocardial injury, Circulation 105: ((2002) ), 2899–2904. |
[13] | Y.X. Shan, T.J. Liu, H.F. Su, A. Samsamshariat, R. Mestril and P.H. Wang, Hsp10 and Hsp60 modulate Bcl-2 family and mitochondria apoptosis signaling induced by doxorubicin in cardiac muscle cells, Journal of Molecular and Cellular Cardiology 35: ((2003) ), 1135–1143. |
[14] | R. Yamaguchi, L. Lartigue and G. Perkins, Targeting Mcl-1 and other Bcl-2 family member proteins in cancer therapy, Pharmacology and Therapeutics 195: ((2019) ), 13–20. |
[15] | G. Morciano, G. Pedriali, L. Sbano, T. Iannitti, C. Giorgi and P. Pinton, Intersection of mitochondrial fission and fusion machinery with apoptotic pathways: Role of Mcl-1, Biologie Cellulaire 108: ((2016) ), 279–293. |
[16] | G. Morciano, C. Giorgi, D. Balestra, S. Marchi, D. Perrone, M. Pinotti and P. Pinton, Mcl-1 involvement in mitochondrial dynamics is associated with apoptotic cell death, Molecular Biology of the Cell 27: ((2016) ), 20–34. |
[17] | K.J. Campbell, S. Dhayade, N. Ferrari, A.H. Sims, E. Johnson, S.M. Mason, A. Dickson, K.M. Ryan, G. Kalna, J. Edwards, S.W.G. Tait and K. Blyth, MCL-1 is a prognostic indicator and drug target in breast cancer, Cell Death & Disease 9: ((2018) ), 19. |
[18] | X.X. Li, J.D. Zhou, X.M. Wen, T.J. Zhang, D.H. Wu, Z.Q. Deng, Z.H. Zhang, X.Y. Lian, P.F. He, X.Y. Yao, J. Lin and J. Qian, Increased MCL-1 expression predicts poor prognosis and disease recurrence in acute myeloid leukemia, OncoTargets and Therapy 12: ((2019) ), 3295–3304. |
[19] | W. Sieghart, D. Losert, S. Strommer, D. Cejka, K. Schmid, S. Rasoul-Rockenschaub, M. Bodingbauer, R. Crevenna, B.P. Monia, M. Peck-Radosavljevic and V. Wacheck, Mcl-1 overexpression in hepatocellular carcinoma: A potential target for antisense therapy, Journal of Hepatology 44: ((2006) ), 151–157. |
[20] | Q. Wen, Y. Zhan, H. Zheng, H. Zang, J. Luo, Y. Zhang, W. Wang, J. Feng, J. Lu, L. Chen and S. Fan, Elevated expression of mcl-1 inhibits apoptosis and predicts poor prognosis in patients with surgically resected non-small cell lung cancer, Diagnostic Pathology 14: ((2019) ), 108. |
[21] | F.C. Detterbeck, D.J. Boffa, A.W. Kim and L.T. Tanoue, The eighth edition lung cancer stage classification, Chest 151: ((2017) ), 193–203. |
[22] | Q. Wen, W. Wang, S. Chu, J. Luo, L. Chen, G. Xie, L. Xu, M. Li and S. Fan, Flot-2 expression correlates with EGFR levels and poor prognosis in surgically resected non-small cell lung cancer, PloS One 10: ((2015) ), e0132190. |
[23] | Q. Wen, J. Li, W. Wang, G. Xie, L. Xu, J. Luo, S. Chu, L. She, D. Li, D. Huang and S. Fan, Increased expression of flotillin-2 protein as a novel biomarker for lymph node metastasis in nasopharyngeal carcinoma, PloS One 9: ((2014) ), e101676. |
[24] | Q. Wen, W. Wang, J. Luo, S. Chu, L. Chen, L. Xu, H. Zang, M.M. Alnemah, J. Ma and S. Fan, CGP57380 enhances efficacy of RAD001 in non-small cell lung cancer through abrogating mTOR inhibition-induced phosphorylation of eIF4E and activating mitochondrial apoptotic pathway, OncoTarget 7: ((2016) ), 27787–27801. |
[25] | H. Zheng, Y. Zhan, Y. Zhang, S. Liu, J. Lu, Y. Yang, Q. Wen and S. Fan, Elevated expression of G3BP1 associates with YB1 and p-AKT and predicts poor prognosis in nonsmall cell lung cancer patients after surgical resection, Cancer Med 8: ((2019) ), 6894–6903. |
[26] | H. Jia, A.I. Halilou, L. Hu, W. Cai, J. Liu and B. Huang, Heat shock protein 10 (Hsp10) in immune-related diseases: one coin, two sides, International Journal of Biochemistry and Molecular Biology 2: ((2011) ), 47–57. |
[27] | F. Rappa, C. Sciume, M. Lo Bello, C.C. Bavisotto, A. Marino Gammazza, R. Barone, C. Campanella, S. David, F. Carini, F. Zarcone, S. Rizzuto, A. Lena, G. Tomasello, M.L. Uzzo, G.F. Spatola, G. Bonaventura, A. Leone, A. Gerbino, F. Cappello, F. Bucchieri, G. Zummo and F. Farina, Comparative analysis of Hsp10 and Hsp90 expression in healthy mucosa and adenocarcinoma of the large bowel, Anticancer Research 34: ((2014) ), 4153–4159. |
[28] | Y. Ye, A. Huang, C. Huang, J. Liu, B. Wang, K. Lin, Q. Chen, Y. Zeng, H. Chen, X. Tao, G. Wei and Y. Wu, Comparative mitochondrial proteomic analysis of hepatocellular carcinoma from patients, Proteomics: Clinical Applications 7: ((2013) ), 403–415. |
[29] | S. Chu, Q. Wen, Z. Qing, J. Luo, W. Wang, L. Chen, J. Feng, L. Xu, H. Zang and S. Fan, High expression of heat shock protein 10 correlates negatively with estrogen/progesterone receptor status and predicts poor prognosis in invasive ductal breast carcinoma, Human Pathology 61: ((2017) ), 173–180. |
[30] | J. Feng, Y. Zhan, Y. Zhang, H. Zheng, W. Wang and S. Fan, Increased expression of heat shock protein (HSP) 10 and HSP70 correlates with poor prognosis of nasopharyngeal carcinoma, Cancer Management and Research 11: ((2019) ), 8219–8227. |
[31] | J.J. Hansen, P. Bross, M. Westergaard, M.N. Nielsen, H. Eiberg, A.D. Borglum, J. Mogensen, K. Kristiansen, L. Bolund and N. Gregersen, Genomic structure of the human mitochondrial chaperonin genes: HSP60 and HSP10 are localised head to head on chromosome 2 separated by a bidirectional promoter, Human Genetics 112: ((2003) ), 71–77. |
[32] | K.M. Lin, B. Lin, I.Y. Lian, R. Mestril, I.E. Scheffler and W.H. Dillmann, Combined and individual mitochondrial HSP60 and HSP10 expression in cardiac myocytes protects mitochondrial function and prevents apoptotic cell deaths induced by simulated ischemia-reoxygenation, Circulation 103: ((2001) ), 1787–1792. |
[33] | K.M. Lin, J.M. Hollander, V.Y. Kao, B. Lin, L. Macpherson and W.H. Dillmann, Myocyte protection by 10 kD heat shock protein (Hsp10) involves the mobile loop and attenuation of the Ras GTP-ase pathway, FASEB Journal 18: ((2004) ), 1004–1006. |
[34] | A. Samali, J. Cai, B. Zhivotovsky, D.P. Jones and S. Orrenius, Presence of a pre-apoptotic complex of pro-caspase-3, Hsp60 and Hsp10 in the mitochondrial fraction of jurkat cells, EMBO Journal 18: ((1999) ), 2040–2048. |
[35] | N. Fathi, G. Rashidi, A. Khodadadi, S. Shahi and S. Sharifi, STAT3 and apoptosis challenges in cancer, International Journal of Biological Macromolecules 117: ((2018) ), 993–1001. |
[36] | X. Yan, P. Li, Y. Zhan, M. Qi, J. Liu, Z. An, W. Yang, H. Xiao, H. Wu, Y. Qi and H. Shao, Dihydroartemisinin suppresses STAT3 signaling and Mcl-1 and survivin expression to potentiate ABT-263-induced apoptosis in non-small cell lung cancer cells harboring EGFR or RAS mutation, Biochemical Pharmacology 150: ((2018) ), 72–85. |
[37] | S. Wang, S. Long, S. Xiao, W. Wu and S.S. Hann, Decoction of chinese herbal medicine fuzheng kang-ai induces lung cancer cell apoptosis via STAT3/Bcl-2/Caspase-3 pathway, Evidence-Based Complementary and Alternative Medicine 2018: ((2018) ), 8567905. |
[38] | S.W. Kim, J.B. Kim, J.H. Kim and J.K. Lee, Interferon-gamma-induced expressions of heat shock protein 60 and heat shock protein 10 in C6 astroglioma cells: identification of the signal transducers and activators of transcription 3-binding site in bidirectional promoter, Neuroreport 18: ((2007) ), 385–389. |
[39] | J.R. Mills, Y. Hippo, F. Robert, S.M. Chen, A. Malina, C.J. Lin, U. Trojahn, H.G. Wendel, A. Charest, R.T. Bronson, S.C. Kogan, R. Nadon, D.E. Housman, S.W. Lowe and J. Pelletier, mTORC1 promotes survival through translational control of Mcl-1, Proceedings of the National Academy of Sciences of the United States of America 105: ((2008) ), 10853–10858. |
[40] | V.V. Senichkin, A.Y. Streletskaia, A.S. Gorbunova, B. Zhivotovsky and G.S. Kopeina, Saga of Mcl-1: Regulation from transcription to degradation, Cell Death and Differentiation 27: ((2020) ), 405–419. |
[41] | J. Guo, X. Li, W. Zhang, Y. Chen, S. Zhu, L. Chen, R. Xu, Y. Lv, D. Wu, M. Guo, X. Liu, W. Lu and H. Deng, HSP60-regulated mitochondrial proteostasis and protein translation promote tumor growth of ovarian cancer, Scientific Reports 9: ((2019) ), 12628. |
Appendices
Supplementary data
Supplementary Table 1
Clinicopathological features of patients with NSCLC and non-cancerous control lung tissues
| Patients characteristics | No. of patients (%) |
|---|---|
| NSCLC | |
| Age (years) | |
| | 97 (27.4) |
| | 257 (72.6) |
| Gender | |
| Male | 271 (76.6) |
| Female | 83 (23.4) |
| Clinical stages | |
| Stage I | 76 (21.5) |
| Stage II | 75 (21.2) |
| Stage III | 203 (57.3) |
| Lymph node status | |
| N0 | 141 (39.8) |
| N1/N2/N3 | 213 (60.2) |
| Histological type | |
| SCC | 161 (45.5) |
| ADC | 193 (54.5) |
| Pathological grade | |
| Well | 6 (1.7) |
| Moderate | 146 (41.2) |
| Poor | 202 (57.1) |
| Non-cancerous control lung tissues | |
| Age (years) | |
| | 22 (41.5) |
| | 31 (58.5) |
| Gender | |
| Male | 27 (50.9) |
| Female | 26 (49.1) |


