A fourteen-lncRNA risk score system for prognostic prediction of patients with non-small cell lung cancer
Abstract
Growing evidence has underscored long non-coding RNAs (lncRNAs) serving as potential biomarkers for cancer prognosis. However, systematic tracking of a lncRNA signature for prognosis prediction in non-small cell lung cancer (NSCLC) has not been accomplished yet. Here, comprehensive analysis with differential gene expression analysis, univariate and multivariate Cox regression analysis based on The Cancer Genome Atlas (TCGA) database was performed to identify the lncRNA signature for prediction of the overall survival of NSCLC patients. A risk-score model based on a 14-lncRNA signature was identified, which could classify patients into high-risk and low-risk groups and show poor and improved outcomes, respectively. The receiver operating characteristic (ROC) curve revealed that the risk-score model has good performance with high AUC value. Multivariate Cox’s regression model and stratified analysis indicated that the risk-score was independent of other clinicopathological prognostic factors. Furthermore, the risk-score model was competent for the prediction of metastasis-free survival in NSCLC patients. Moreover, the risk-score model was applicable for prediction of the overall survival in the other 30 caner types of TCGA. Our study highlighted the significant implications of lncRNAs as prognostic predictors in NSCLC. We hope the lncRNA signature could contribute to personalized therapy decisions in the future.
1.Background
Lung cancer is the most common malignant neoplasm and the leading cause of cancer death worldwide, resulting in approximately 2.5 million morbidities and more than one million mortalities annually [1]. Over the past two decades, the mortality for lung cancer is considerably declined. However, in contrast to the advances in survival for most cancer types, lung cancer presents a relatively poor prognosis, with a five-year survival rate of 18% [2]. Non-small cell lung cancer (NSCLC) is the most common type of lung cancer, accounting for about 85% of all lung cancers [3]. In NSCLC, the major prognostic factors include the stage of the tumor, performance status, and histology [4, 5]. However, these clinicopathological factors are insufficient to predict individual clinical outcomes of treatment and survival accurately [6]. Thus, new molecular prognostic factors are urgently needed to supplement conventional prognostic factors to assess the prognosis of patients with NSCLC.
Recent studies have focused increasing attention on the potential of long non-coding RNAs (lncRNAs) in cancer etiology [7, 8, 9]. LncRNAs are defined as non-coding transcripts with greater than 200 nucleotides in length [10] and have been well recognized as versatile regulators in multiple biological processes, such as cell growth, differentiation, and disease progression [11]. Significantly, it has been suggested that aberrant expression of lncRNAs is implicated in the development and progression of lung cancer [12, 13]. Currently, the evidence is accumulating that lncRNAs promote tumor metastasis by inducing epithelial to mesenchymal transition in NSCLC [14]. Schmidt et al. [15] indicated that high expression of MALAT-1 was correlated with tumor metastasis and a poor prognosis, in patients with NSCLC. It has also been observed that HOTAIR is distinctly upregulated in tumor tissues and is required to tumor metastasis in NSCLC [16]. Although a variety of lncRNAs have been identified, there are still some controversies about the prognostic role of lncRNAs in NSCLC due to the limitation of sample size [17]. A better understanding of lncRNA alterations in NSCLC requires a larger cohort study.
Therefore, this study purposed to identify a robust prognostic lncRNA signature using RNA-seq data of patients with NSCLC from The Cancer Genome Atlas (TCGA, https://portal.gdc.cancer.gov/). In the present study, a risk-score model based on a 14-lncRNA signature with a reliable prognostic and predictive value was identified in NSCLC, which could be anticipated to complement the traditional clinicopathological prognostic factors.
2.Materials and methods
2.1Clinical cohorts and RNA-Seq data
RNA-seq counts data and clinical data were obtained from the TCGA data portal (March 2018). For RNA-seq data, a total of 1037 NSCLC samples were available, including 535 lung adenocarcinoma (LUAD) and 502 lung squamous cell carcinoma (LUSC), and 730 normal data were composed of the adjacent normal tissue samples of other cancer types in TCGA. After removing NSCLC patients with incomplete clinical data, a total of 983 individuals with NSCLC, including 493 LUAD and 490 LUSC, were enrolled for lncRNA signature generation and validation. These NSCLC patients were randomly partitioned into training and validating groups, resulting in a 491-sample training cohort and a 492-sample validating cohort. The training cohort was used to identify the lncRNA signature, and the validating and entire cohorts were applied for validation.
2.2Differential lncRNAs expression analysis
The differential expression lncRNA levels between the NSCLC group (1037 samples) and the control group (730 samples from normal tissues of other cancer types) were analyzed using the generalized linear model algorithm [18] in the EdgeR package (version 3.20.9) [19]. LncRNAs with
2.3LncRNA-based prognostic signature generation
In the training cohort, a univariate Cox regression analysis was used to evaluate the association between lncRNA expression levels and overall survival. From the univariate analysis, the lncRNAs with Cox
Where
Table 1
General information of the 14 non-coding RNAs for construction of the prognostic 14-lncRNA signature
| Gene stable ID | Gene name | Transcript type | Chromosome | Gene start (bp) | Gene end (bp) | Tumor vs normal |
|---|---|---|---|---|---|---|
| ENSG00000176659 | C20orf197 | LincRNA | 20 | 60055925 | 60072953 | Down-regulated |
| ENSG00000188660 | LINC00319 | LincRNA | 21 | 43446601 | 43453893 | Up-regulated |
| ENSG00000196893 | AC090286.1 | Antisense | 17 | 18951625 | 18954149 | Up-regulated |
| ENSG00000228944 | AC004485.1 | Antisense | 7 | 24196662 | 24255719 | Down-regulated |
| ENSG00000232774 | AL355916.1 | LincRNA | 14 | 61570540 | 61658696 | Up-regulated |
| ENSG00000235884 | LINC00941 | LincRNA | 12 | 30795681 | 30802711 | Up-regulated |
| ENSG00000249916 | AC119150.1 | Antisense | 5 | 122369762 | 122383568 | Down-regulated |
| ENSG00000250748 | AC025419.1 | LincRNA | 12 | 65466820 | 65642372 | Up-regulated |
| ENSG00000251281 | AC034223.2 | LincRNA | 5 | 33011322 | 33017607 | Up-regulated |
| ENSG00000255565 | AC073651.1 | LincRNA | 12 | 15780068 | 15782120 | Down-regulated |
| ENSG00000256577 | AC007406.4 | Antisense | 12 | 203642 | 205094 | Down-regulated |
| ENSG00000258404 | LINC02320 | LincRNA | 14 | 101634454 | 101731108 | Up-regulated |
| ENSG00000272632 | AC097504.2 | LincRNA | 4 | 141430831 | 141431284 | Up-regulated |
| ENSG00000275216 | AL161431.1 | LincRNA | 13 | 109269634 | 109273838 | Up-regulated |
Chr: Chromosome.
Figure 1.
Hierarchical clustering shows that differentially expressed lncRNAs clearly separate tumor tissues from normal tissues.
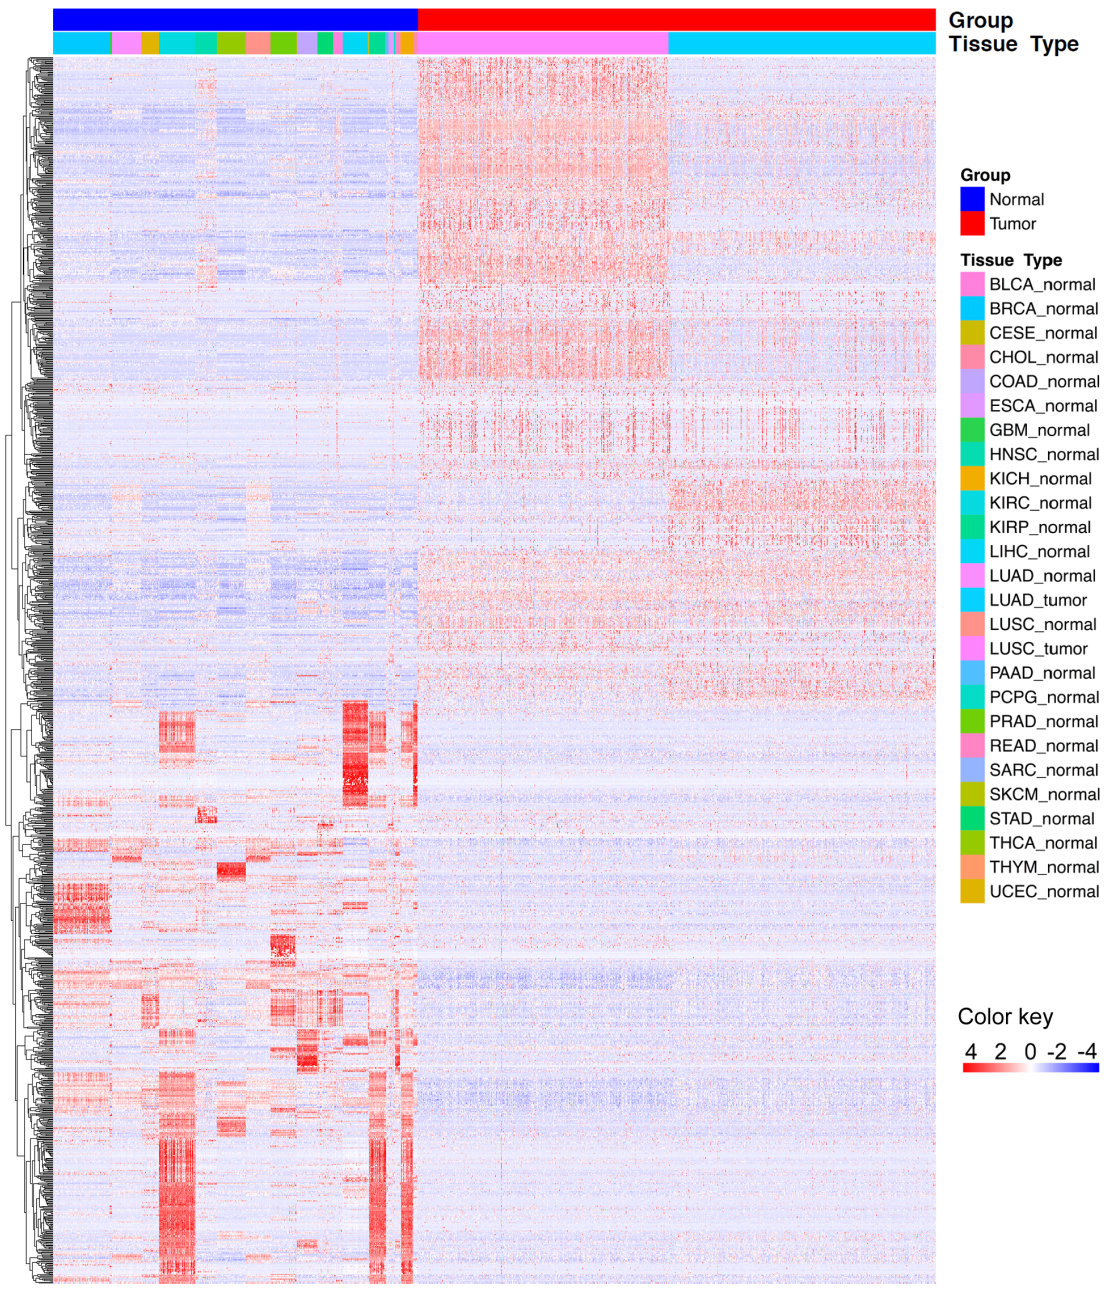
Figure 2.
Correlation between the 14-lncRNA signature and overall survival of patients in the training cohort. A: The distribution of risk scores. The black dotted line represents the median risk score cutoff dividing patients into low-risk and high-risk groups. B: The expression heatmap of the 14 prognostic lncRNAs. C: Kaplan-Meier curves of overall survival between low-risk and high-risk groups. D: ROC curve for survival prediction by 14-lncRNA signature showing an AUC of 0.785.
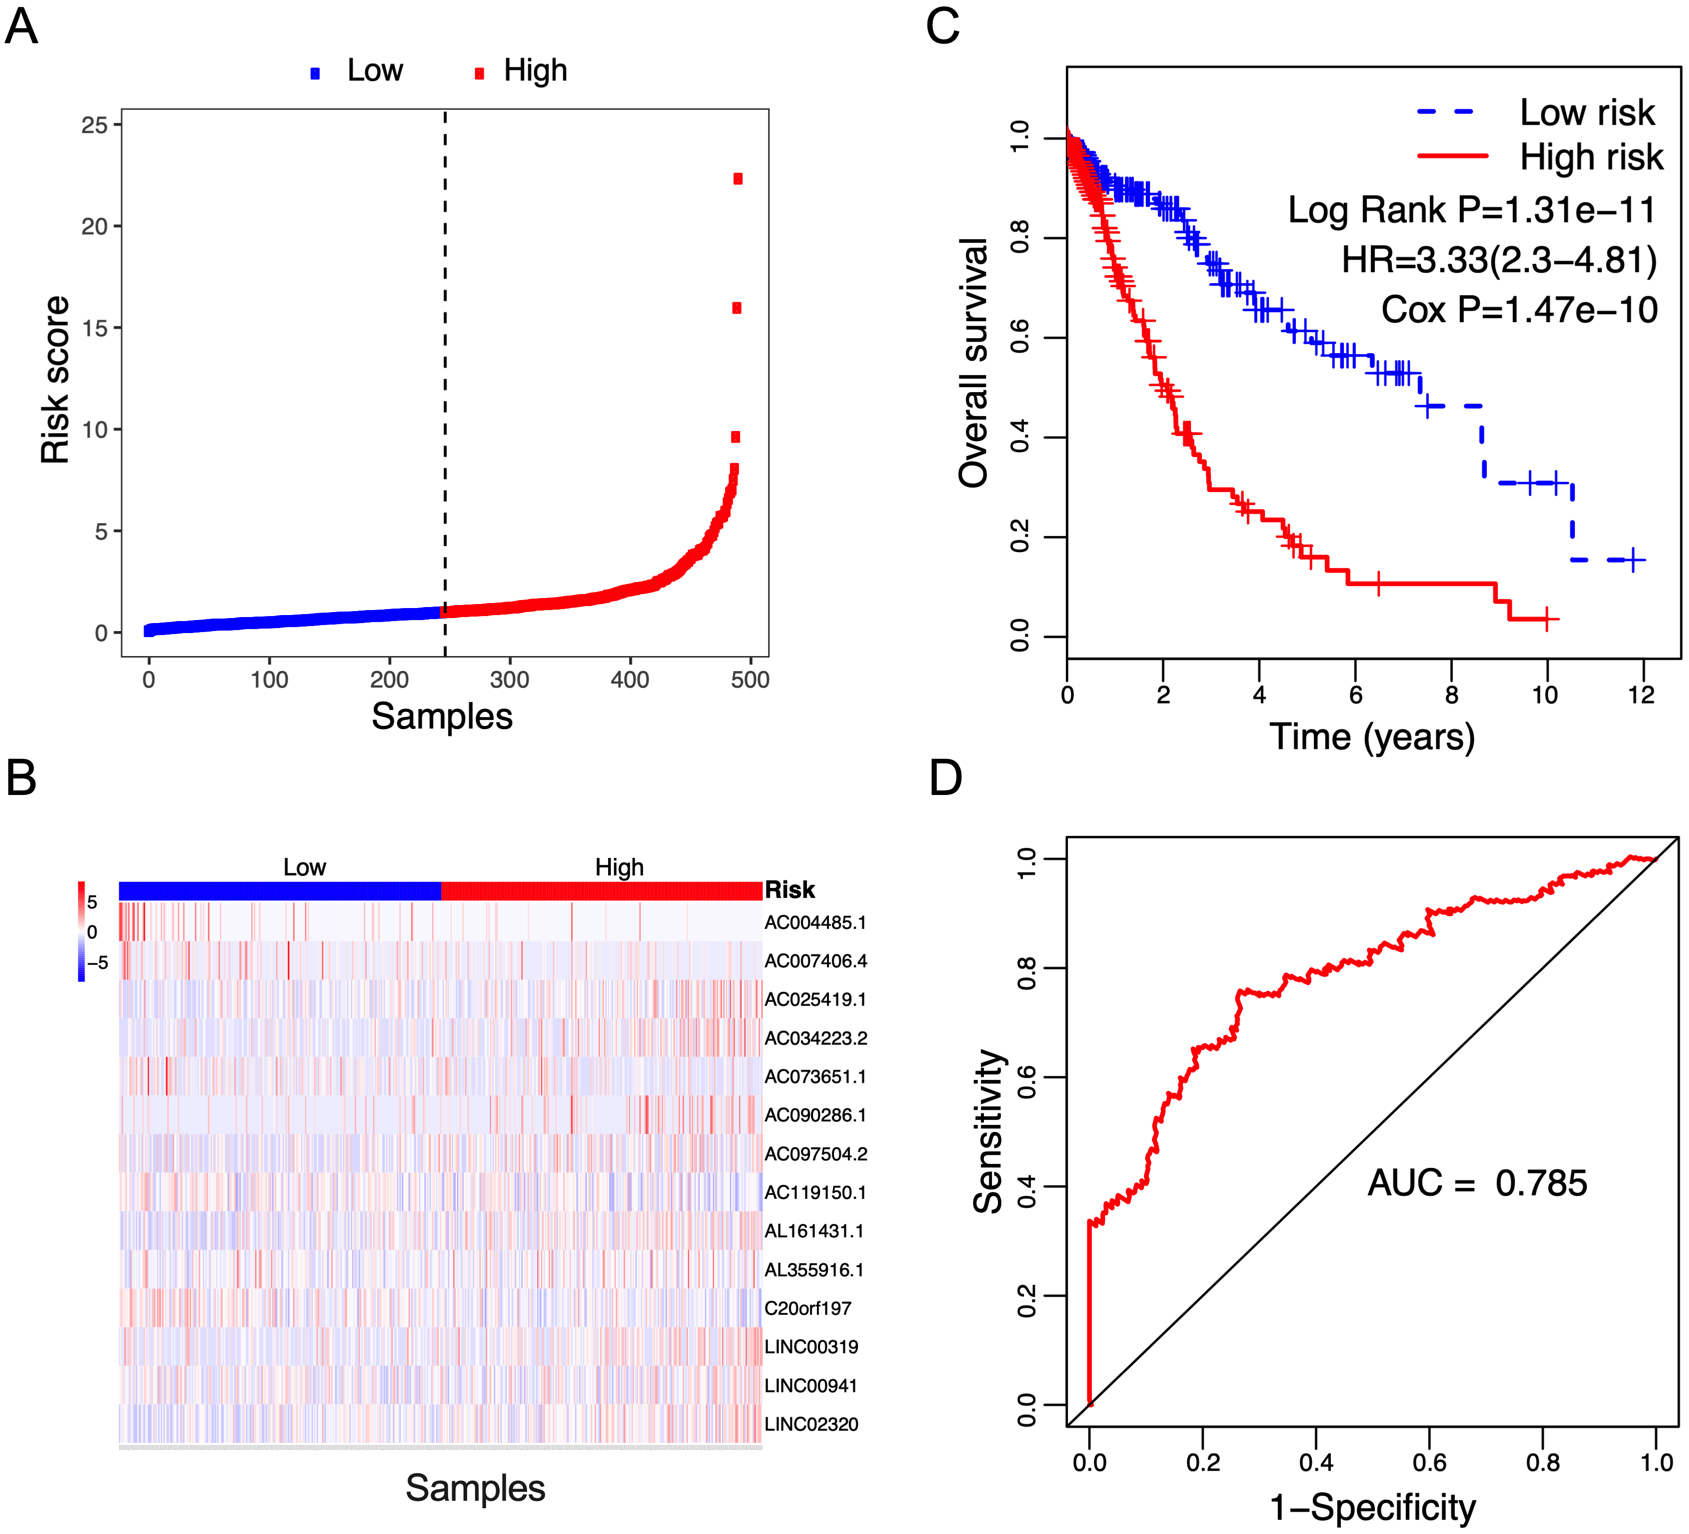
Figure 3.
Correlation between the 14-lncRNA signature and overall survival of patients in the validation cohort. A: The distribution of risk scores. The black dotted line represents the median risk score cutoff dividing patients into low-risk and high-risk groups. B: The expression heatmap of the 14 prognostic lncRNAs. C: Kaplan-Meier curves of overall survival between low-risk and high-risk groups. D: ROC curve for survival prediction by 14-lncRNA signature showing an AUC of 0.701.
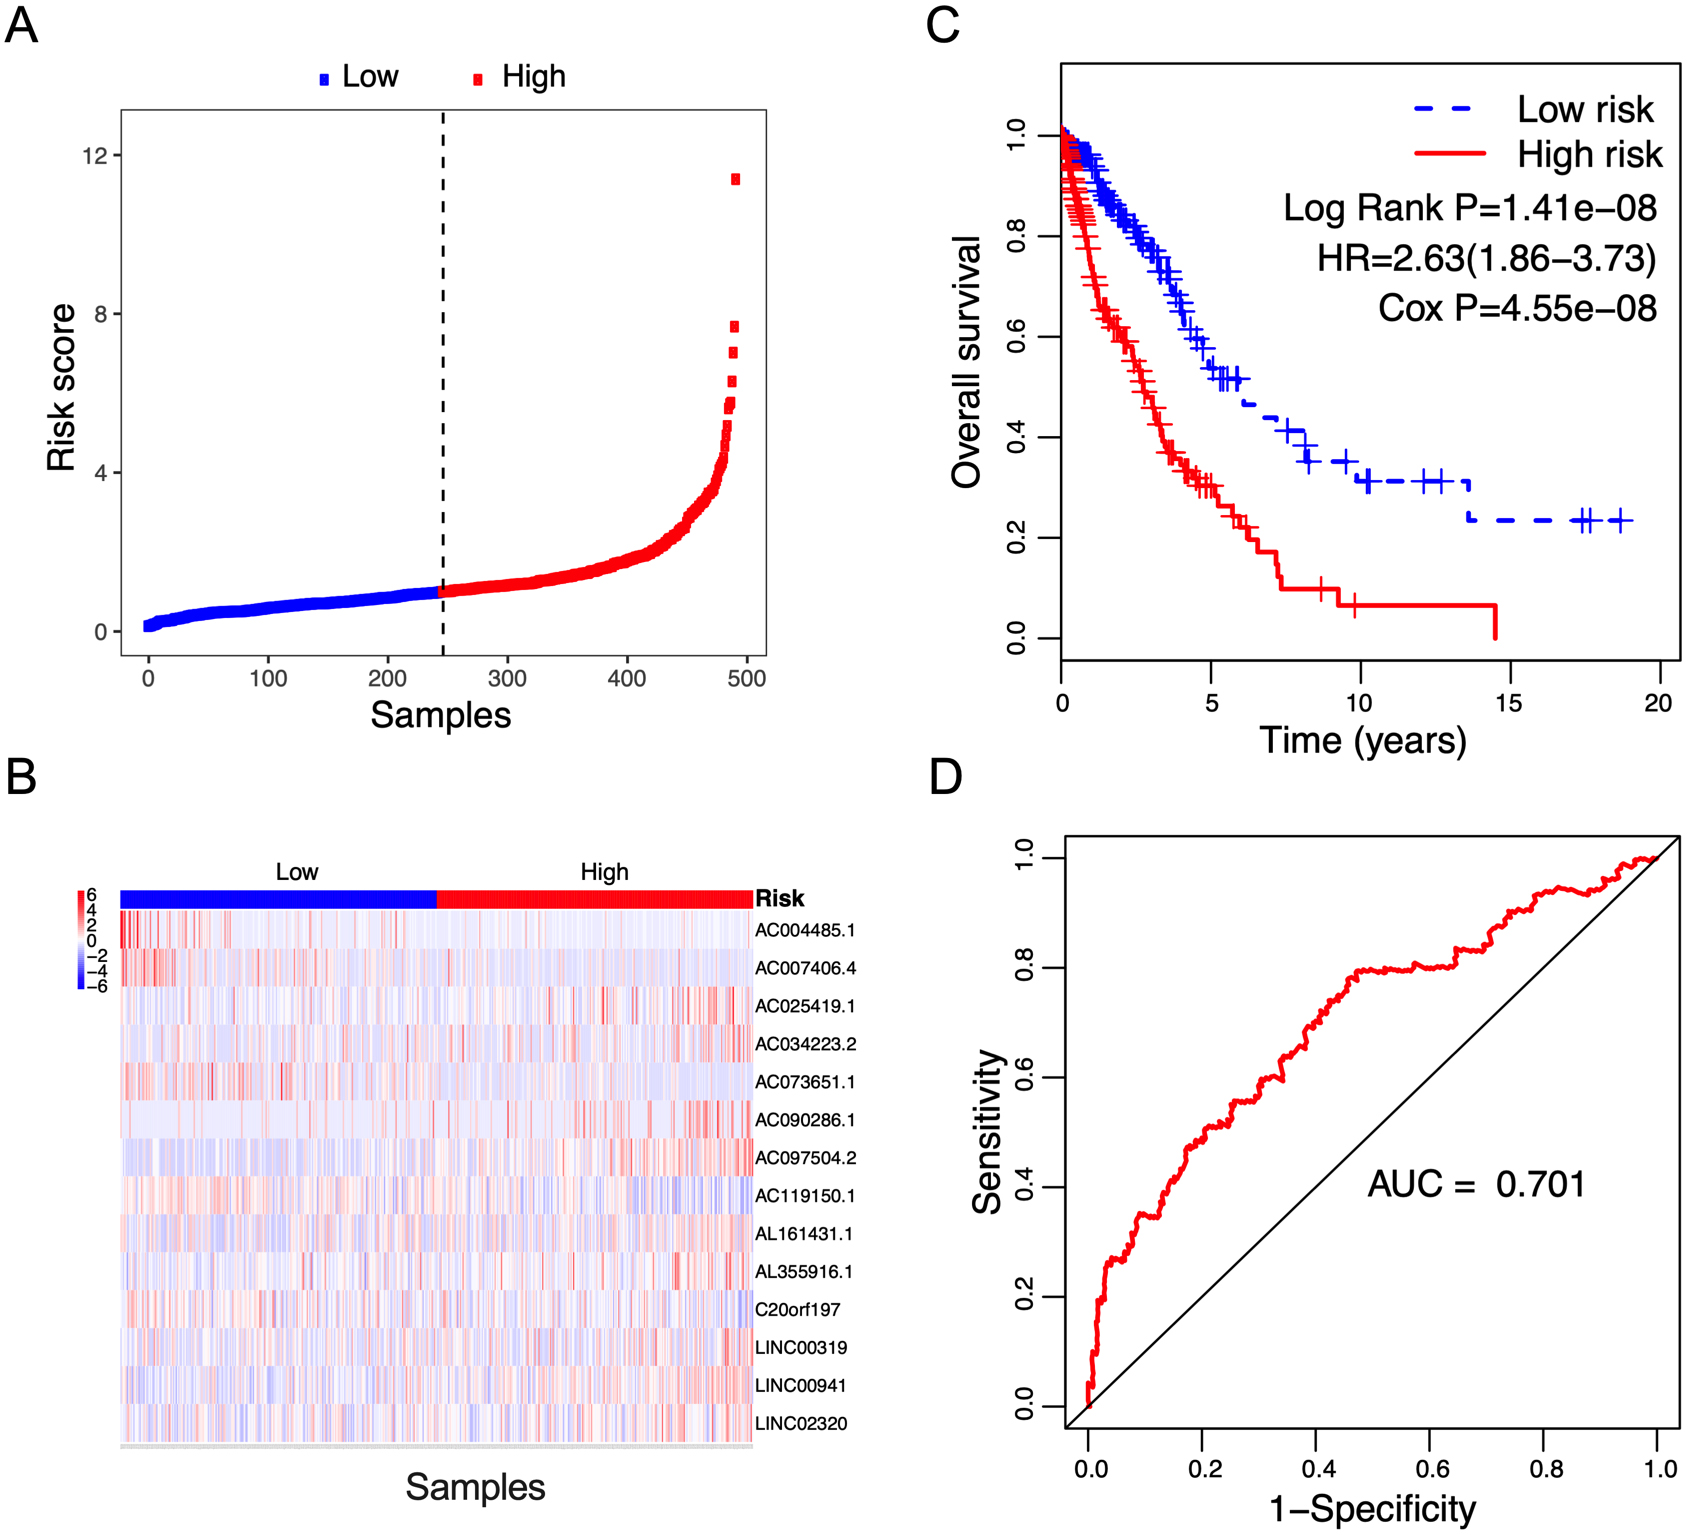
Figure 4.
Correlation between the 14-lncRNA signature and overall survival of patients in the entire cohort. A: The distribution of risk scores. The black dotted line represents the median risk score cutoff dividing patients into low-risk and high-risk groups. B: The expression heatmap of the 14 prognostic lncRNAs. C: Kaplan-Meier curves of overall survival between low-risk and high-risk groups. D: ROC curve for survival prediction by 14-lncRNA signature showing an AUC of 0.705.
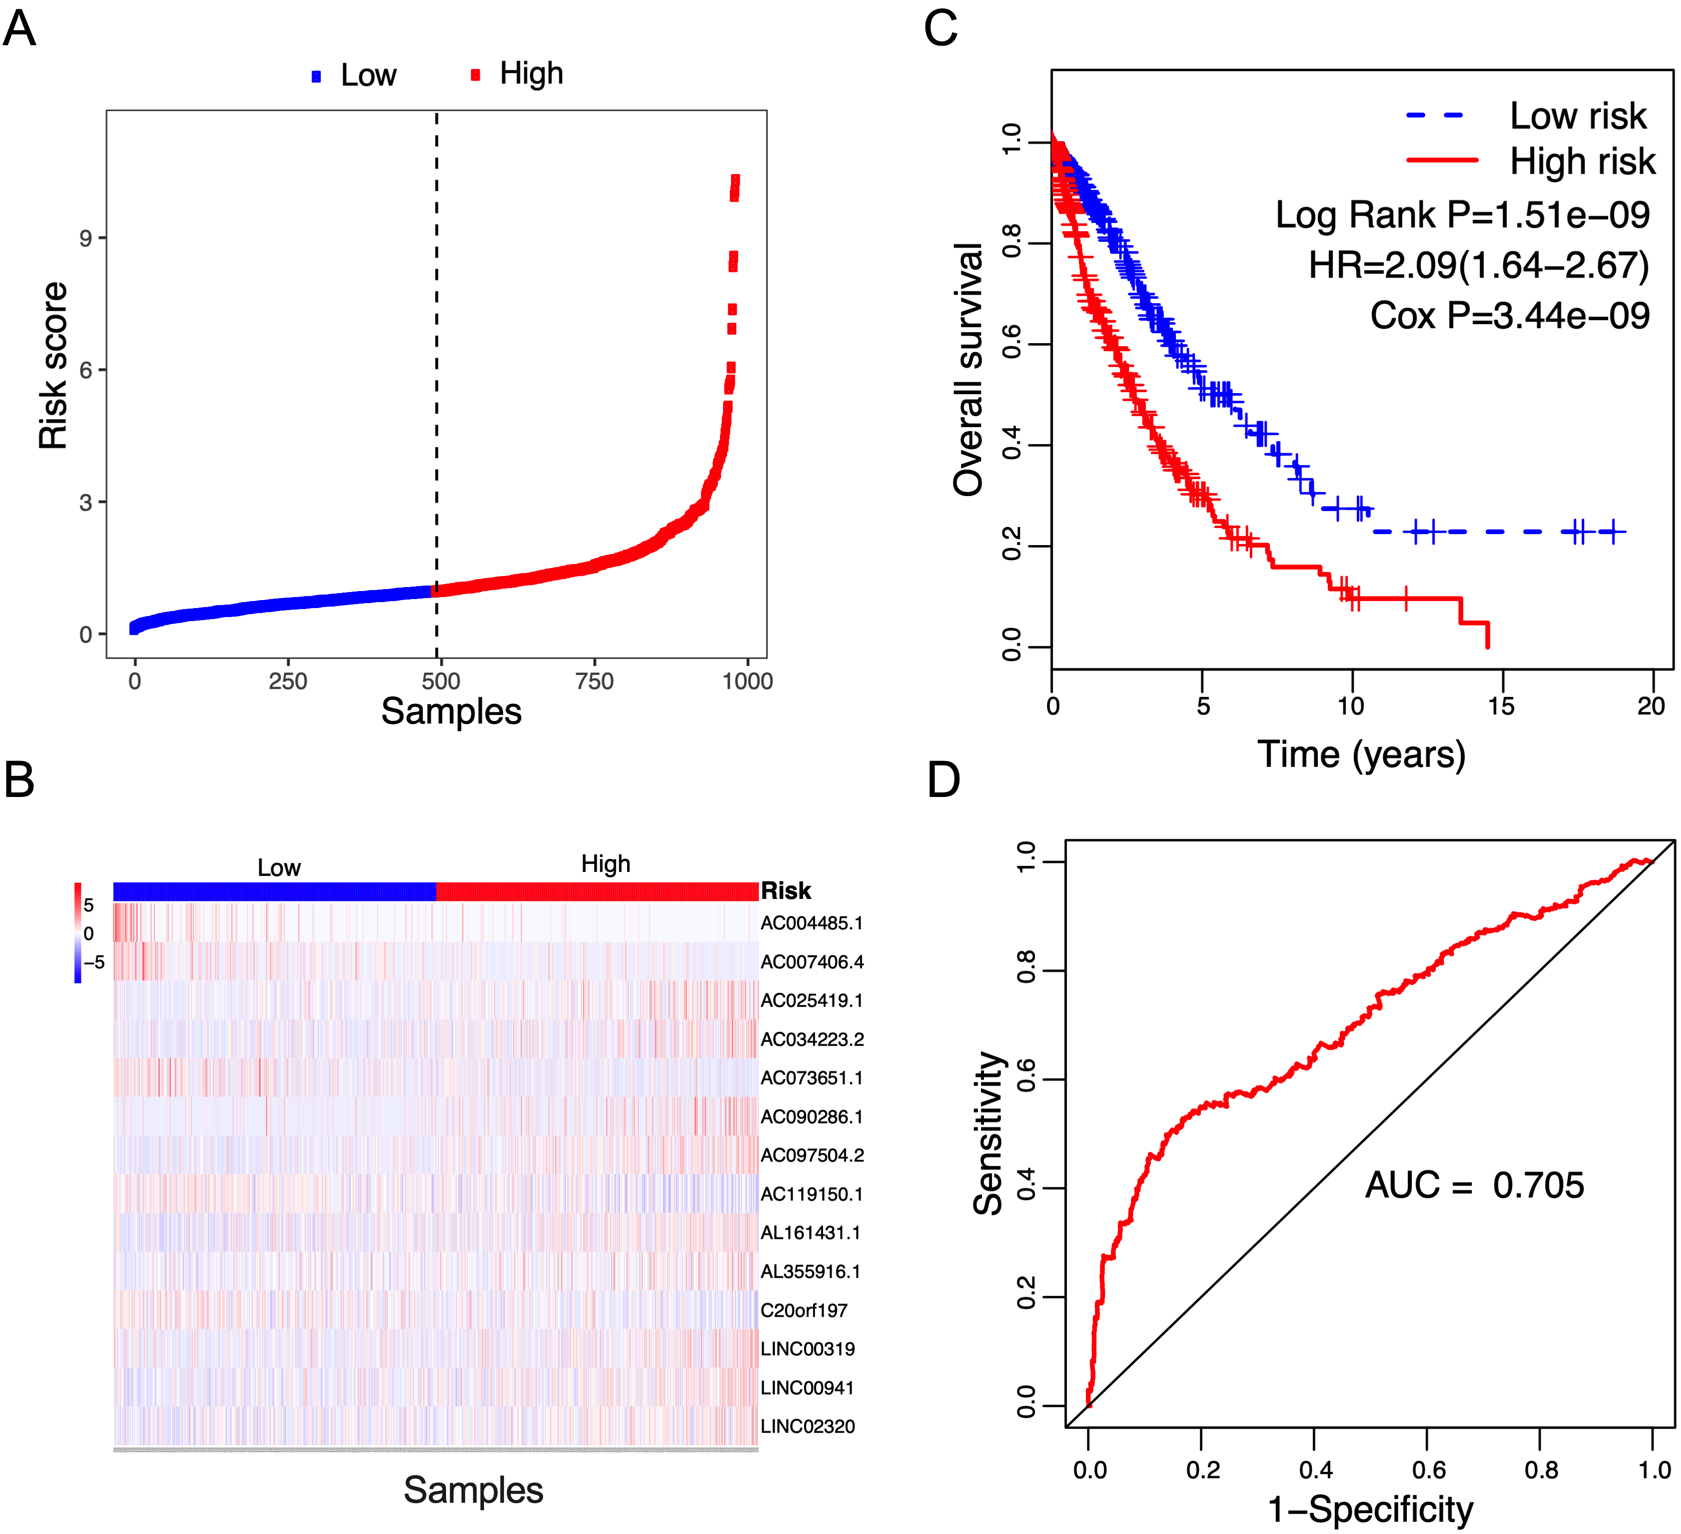
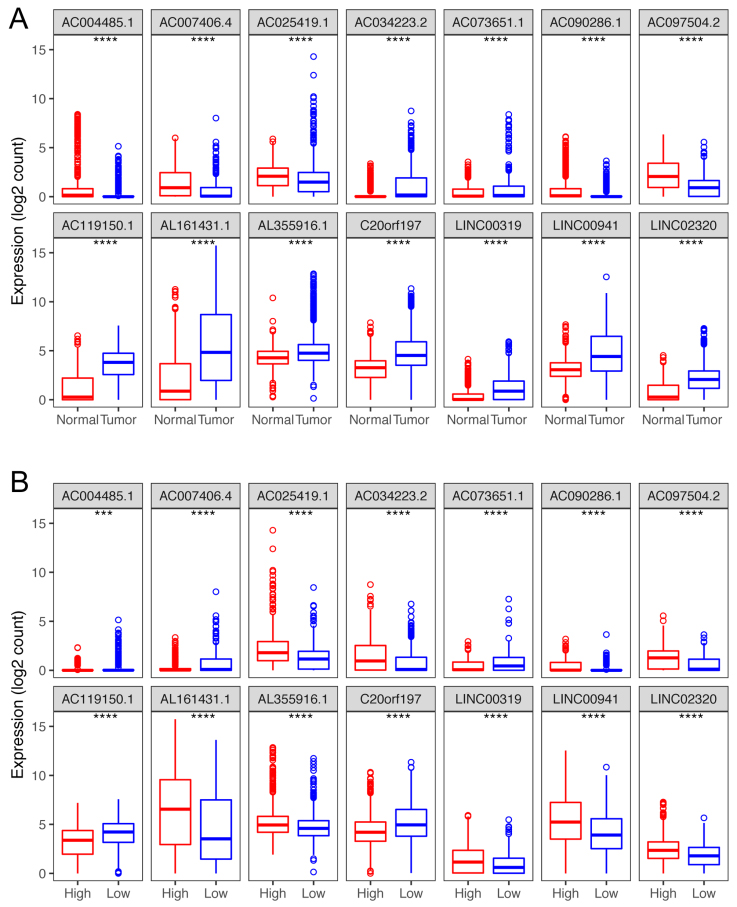
Figure 5.
Box plots visualize the expression levels of the 14-lncRNA signature in (A) tumor vs normal tissues; and (B) low-risk vs high-risk groups.
According to the median risk score value from the training cohort, patients were classified into low-risk and high-risk groups. Subsequently, Kaplan-Meier plotting was performed to assess overall survival between the low-risk group and the high-risk group, and a log-rank test was used to determine survival differences. The hazard ratio was also calculated. The receiver operating characteristic (ROC) curve was used to evaluate the sensitivity and specificity of the risk score. The area under the curve (AUC) value was calculated from the ROC curve. The validating cohort and the entire cohort were used to validate the risk score. The survival prediction value of the risk score based on the 14-lncRNA signature was further investigated in other 30 tumor types of TCGA database. Moreover, the potential role of the risk score on predicting metastasis-free survival was also analyzed.
2.4Independent prognosis analysis
To further investigate the independent correlation between risk score and overall survival, univariate and multivariate Cox’s proportional hazards regressions were applied for prognostic prediction of clinical parameters, such as age, gender, stage, histology type, and risk score. Hazard ratio (HR) and 95% confidence intervals (CI) were assessed by Cox’s proportional hazards regression model. Kaplan-Meier survival curves with log-rank tests for differences were performed to estimate the association between each variable and overall survival. ROC curve was performed to assess the predictive accuracy of prognostic factors. A
2.5Stratification analysis and statistical analysis
Stratification analysis of clinical parameters was further performed to validate the results. For each clinical parameter, patients were stratified into two subgroups based on the corresponding attributes, such as age
3.Results
3.1Differential lncRNAs
Using RNA-seq data of NSCLC and combined normal samples, we identified the differentially expressed lncRNAs. Under the cut-off values of
3.2The risk score based on the 14-lncRNA signature showed a prediction value for the overall survival of NSCLC patients
To identify survival-associated lncRNAs, univariate Cox’s regression analysis was performed. Under the cut-off threshold of Cox
Table 2
Univariate and multivariate analysis of the predictive values of the clinico-pathological factors and the risk score for overall survival
| Variables | Patients ( | Univariate analysis | Multivariate analysis | ||
|---|---|---|---|---|---|
| HR (95% CI) |
| HR (95% CI) |
| ||
| Age | |||||
| | 427 | 1.311 (1.025–1.677) | 0.031 | 1.470 (1.139–1.897) | 0.003 |
| | 555 | ||||
| Gender | |||||
| Female | 394 | 0.995 (0.780–1.270) | 0.970 | 0.946 (0.731–1.225) | 0.674 |
| Male | 589 | ||||
| Pathologic stage | |||||
| I–II | 775 | 1.983 (1.533–2.566) | 1.92e-07 | 1.427 (1.000–2.038) | 0.050 |
| III–IV | 196 | ||||
| Stage M | |||||
| M0 | 726 | 1.049 (0.774–1.420) | 0.759 | 1.158 (0.843–1.592) | 0.366 |
| MX | 249 | ||||
| Stage N | |||||
| N0 | 630 | 1.728 (1.362–2.192) | 0.000 | 1.523 (1.150–2.016) | 0.003 |
| NX | 353 | ||||
| Stage T | |||||
| T1–T2 | 823 | 1.753 (1.303–2.358) | 2.10e-04 | 1.364 (0.942–1.977) | 0.100 |
| T3–T4 | 160 | ||||
| Histology type | |||||
| LUAD | 493 | 1.023 (0.805–1.299) | 0.852 | 0.914 (0.705–1.184) | 0.495 |
| LUSC | 490 | ||||
| Risk score | |||||
| Low | 492 | 2.093 (1.638–2.674) | 3.44e-09 | 2.161 (1.684–2.774) | 1.44e-09 |
| High | 491 | ||||
The risk score for each patient was calculated based on the expression values and regression coefficients of 14 lncRNAs. In the training cohort, 491 NSCLC patients were classified into low-risk and high-risk groups according to the median risk score value. Figure 2A and B showed the distribution of risk scores, and lncRNA expression of NSCLC patients ranked according to the risk score values. The survival differences were determined by the log-rank test. Kaplan-Meier curves indicated that patients in high-risk group had a poorer prognosis, relative to low-risk group (Fig. 2C, Log Rank P
To validate the prognostic value of the risk score, survival analysis was further performed in the validation cohort and the entire cohort. Using the median risk score value in the training cohort, patients in the validation cohort and the entire cohort were classified into low-risk and high-risk groups, respectively. The risk score distribution and the lncRNA expression of NSCLC patients in the validation cohort and the entire cohort were shown in Figs 3A and B and 4A and B respectively. The survival status of NSCLC patients in the training cohort, the validation cohort, and the entire cohort were shown in Fig. S1. Patients in high-risk group showed a poorer prognosis compared with those in low-risk group in both validating cohort (Fig. 3C, Log Rank P
3.3LncRNA signature expression
Compared with normal tissues, of these 14 lncRNAs, nine (AC034223.2, AC073651.1, AC119150.1, AL161431.1, AL355916.1, C20orf197, LINC00319, LINC00941 and LINC02320) were up-regulated in tumor tissues, and the other 5 (AC090286.1, AC004485.1, AC025419.1, AC007406.4 and AC097504.2,) showed a lower expression in tumor tissues (
Table 3
Clinical characteristics of the Risk score
| Variables | Risk score | Risk score |
|
|
|---|---|---|---|---|
| Age | ||||
| | 217 (50.82) | 210 (49.18) | 0.149 | 0.699 |
| | 274 (49.37) | 281 (50.63) | ||
| Gender | ||||
| Female | 216 (54.82) | 178 (45.18) | 5.674 | 0.017 |
| Male | 276 (46.86) | 313 (53.14) | ||
| Pathologic stage | ||||
| I–II | 398 (51.35) | 377 (48.65) | 1.981 | 0.159 |
| III–IV | 89 (45.41) | 107 (54.59) | ||
| Stage T | ||||
| T1–T2 | 419 (50.91) | 404 (49.09) | 1.293 | 0.255 |
| T3–T4 | 73 (45.63) | 87 (54.38) | ||
| Stage N | ||||
| N0 | 332 (52.7) | 298 (47.3) | 4.628 | 0.031 |
| NX | 160 (45.33) | 193 (54.67) | ||
| Stage M | ||||
| M0 | 354 (48.76) | 372 (51.24) | 1.698 | 0.193 |
| MX | 134 (53.82) | 115 (46.18) | ||
| Histology type | ||||
| LUAD | 276 (55.98) | 217 (44.02) | 13.453 | |
| LUSC | 216 (44.08) | 274 (55.92) | ||
| Survival status | ||||
| Alive | 390 (55.16) | 317 (44.84) | 25.596 | |
| Dead | 102 (36.96) | 174 (63.04) | ||
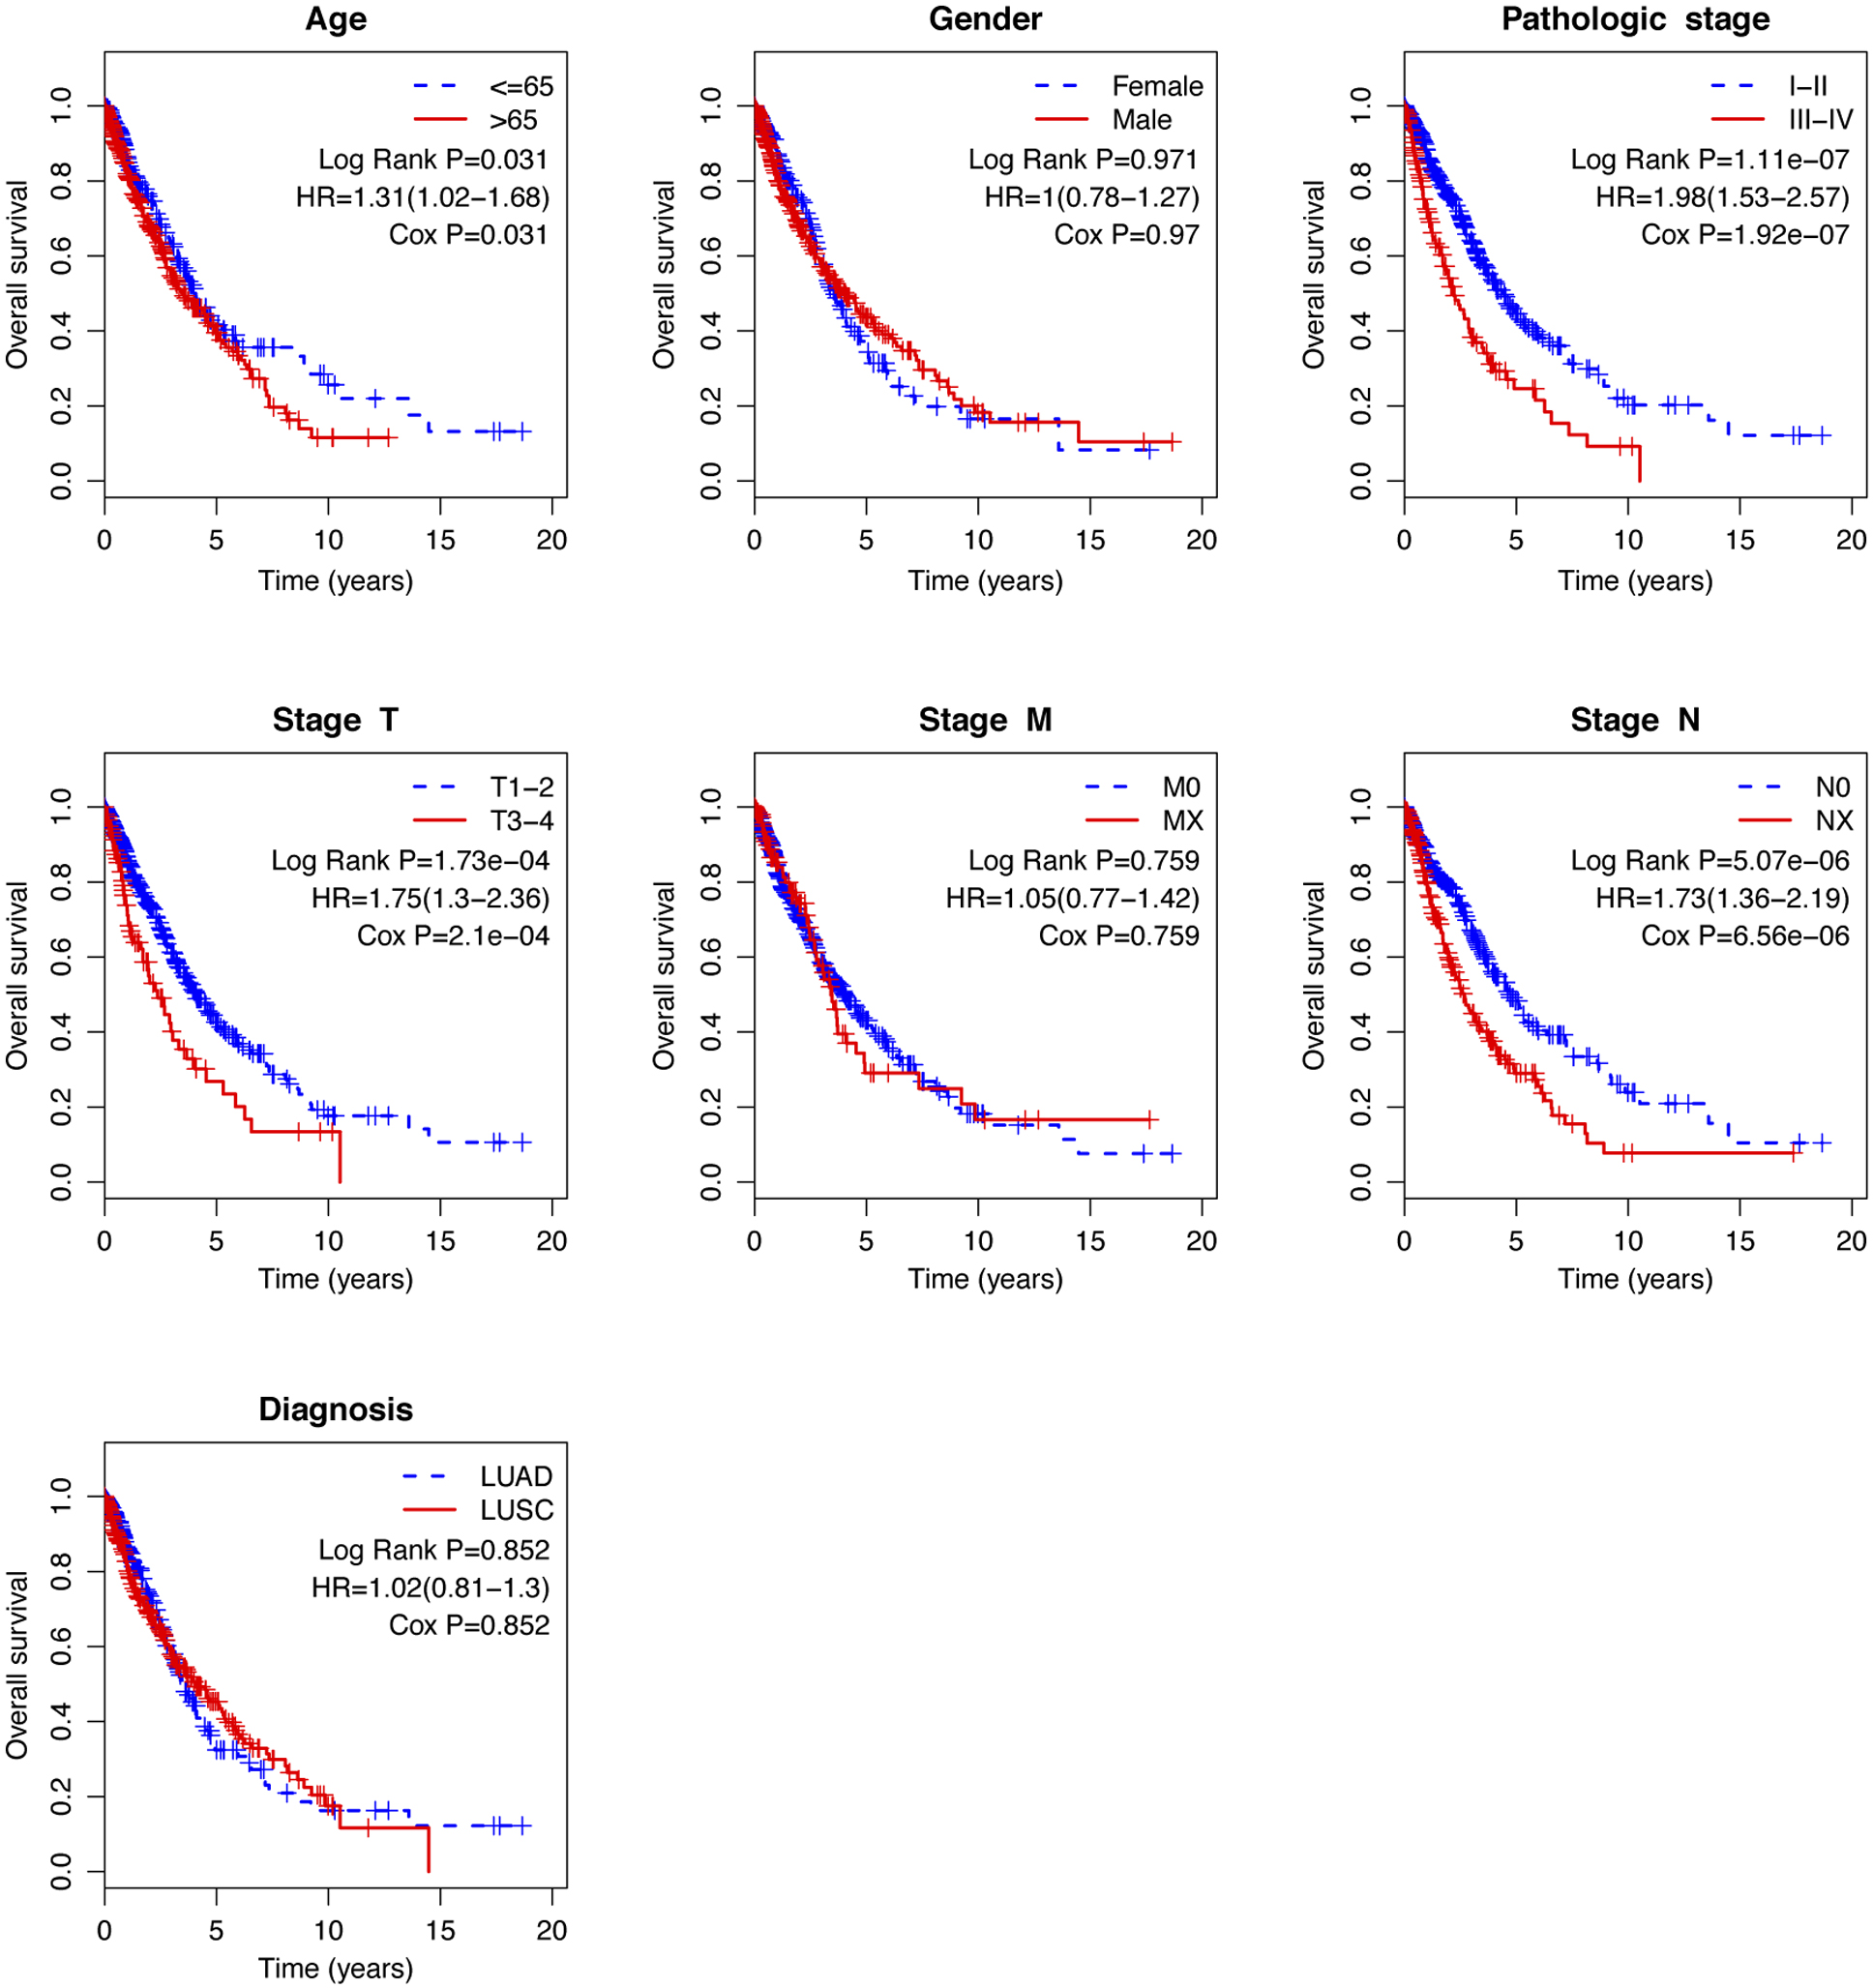
Figure 6.
Kaplan-Meier analysis of overall survival in TCGA-NSCLC patients stratified by different clinical characteristics (age, gender, pathologic stage, TNM stage, and histological type).
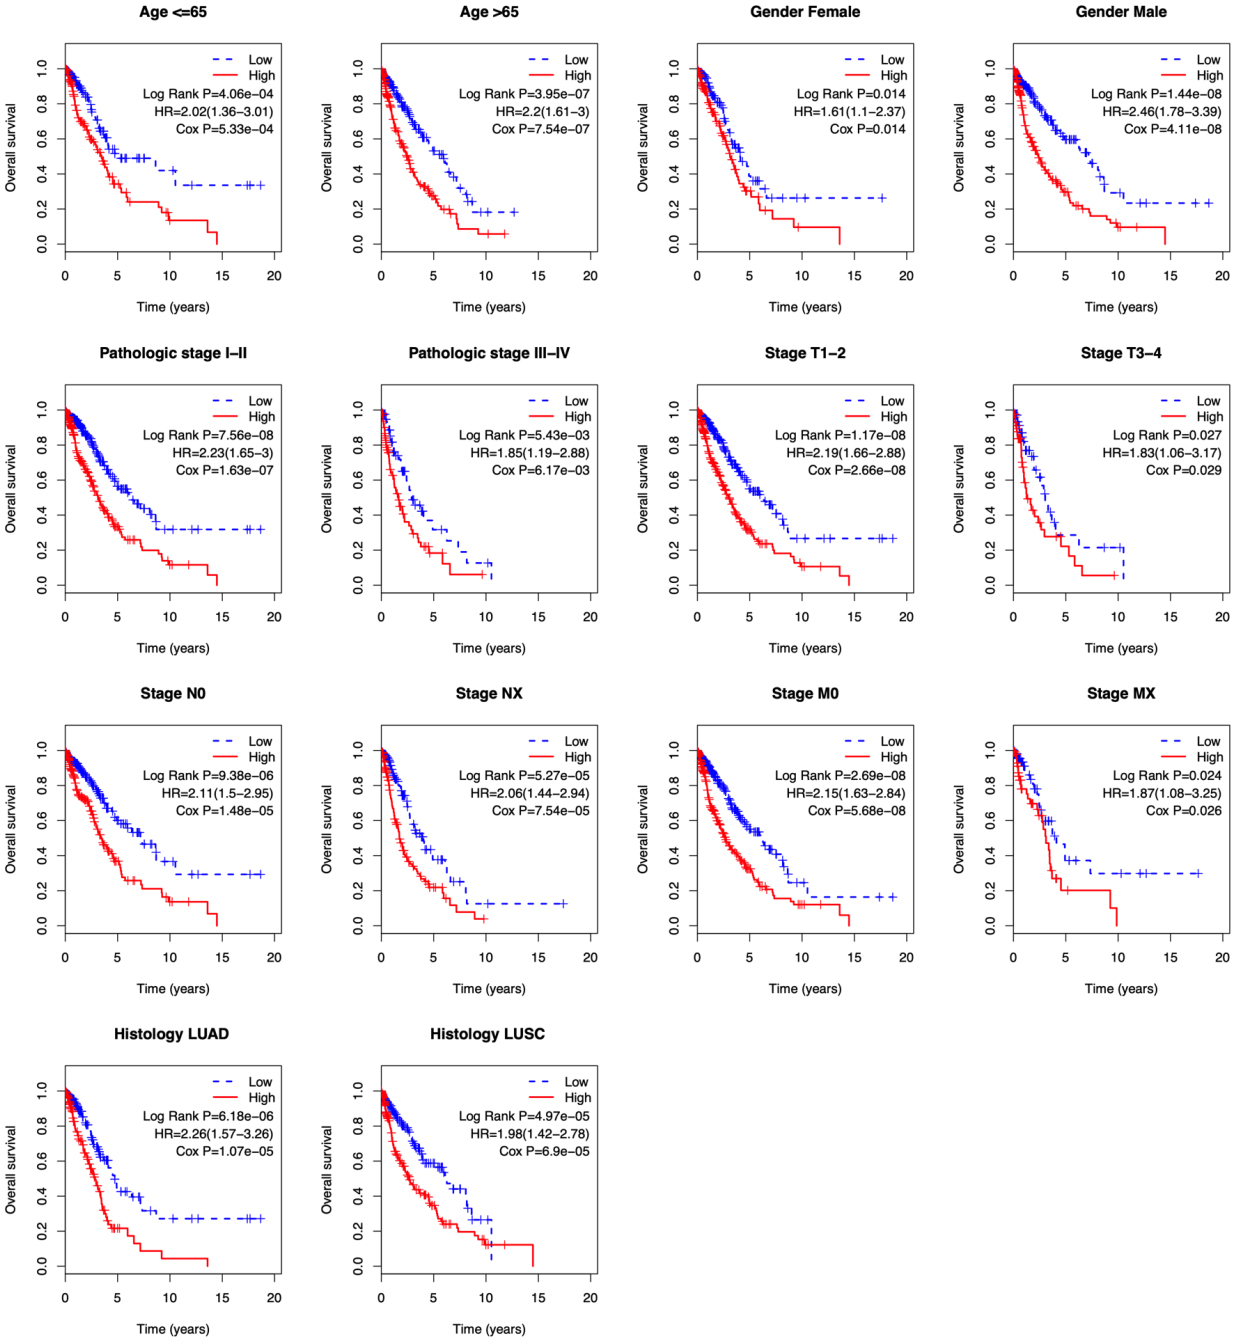
Figure 7.
Correlation between the 14-lncRNA signature and metastasis-free survival of 141 relapsed patients. A: The risk score distribution. The black dotted line suggests the median risk score threshold dividing patients into low-risk and high-risk groups. B: Metastasis status of NSCLC patients. Among the 141 relapsed patients, 53 patients were local recurrences, and the other 88 were metastatic. C: Kaplan-Meier curves of metastasis-free survival between low-risk and high-risk groups. D: ROC curve for metastasis-free survival prediction by 14-lncRNA signature exhibiting an AUC of 0.717.
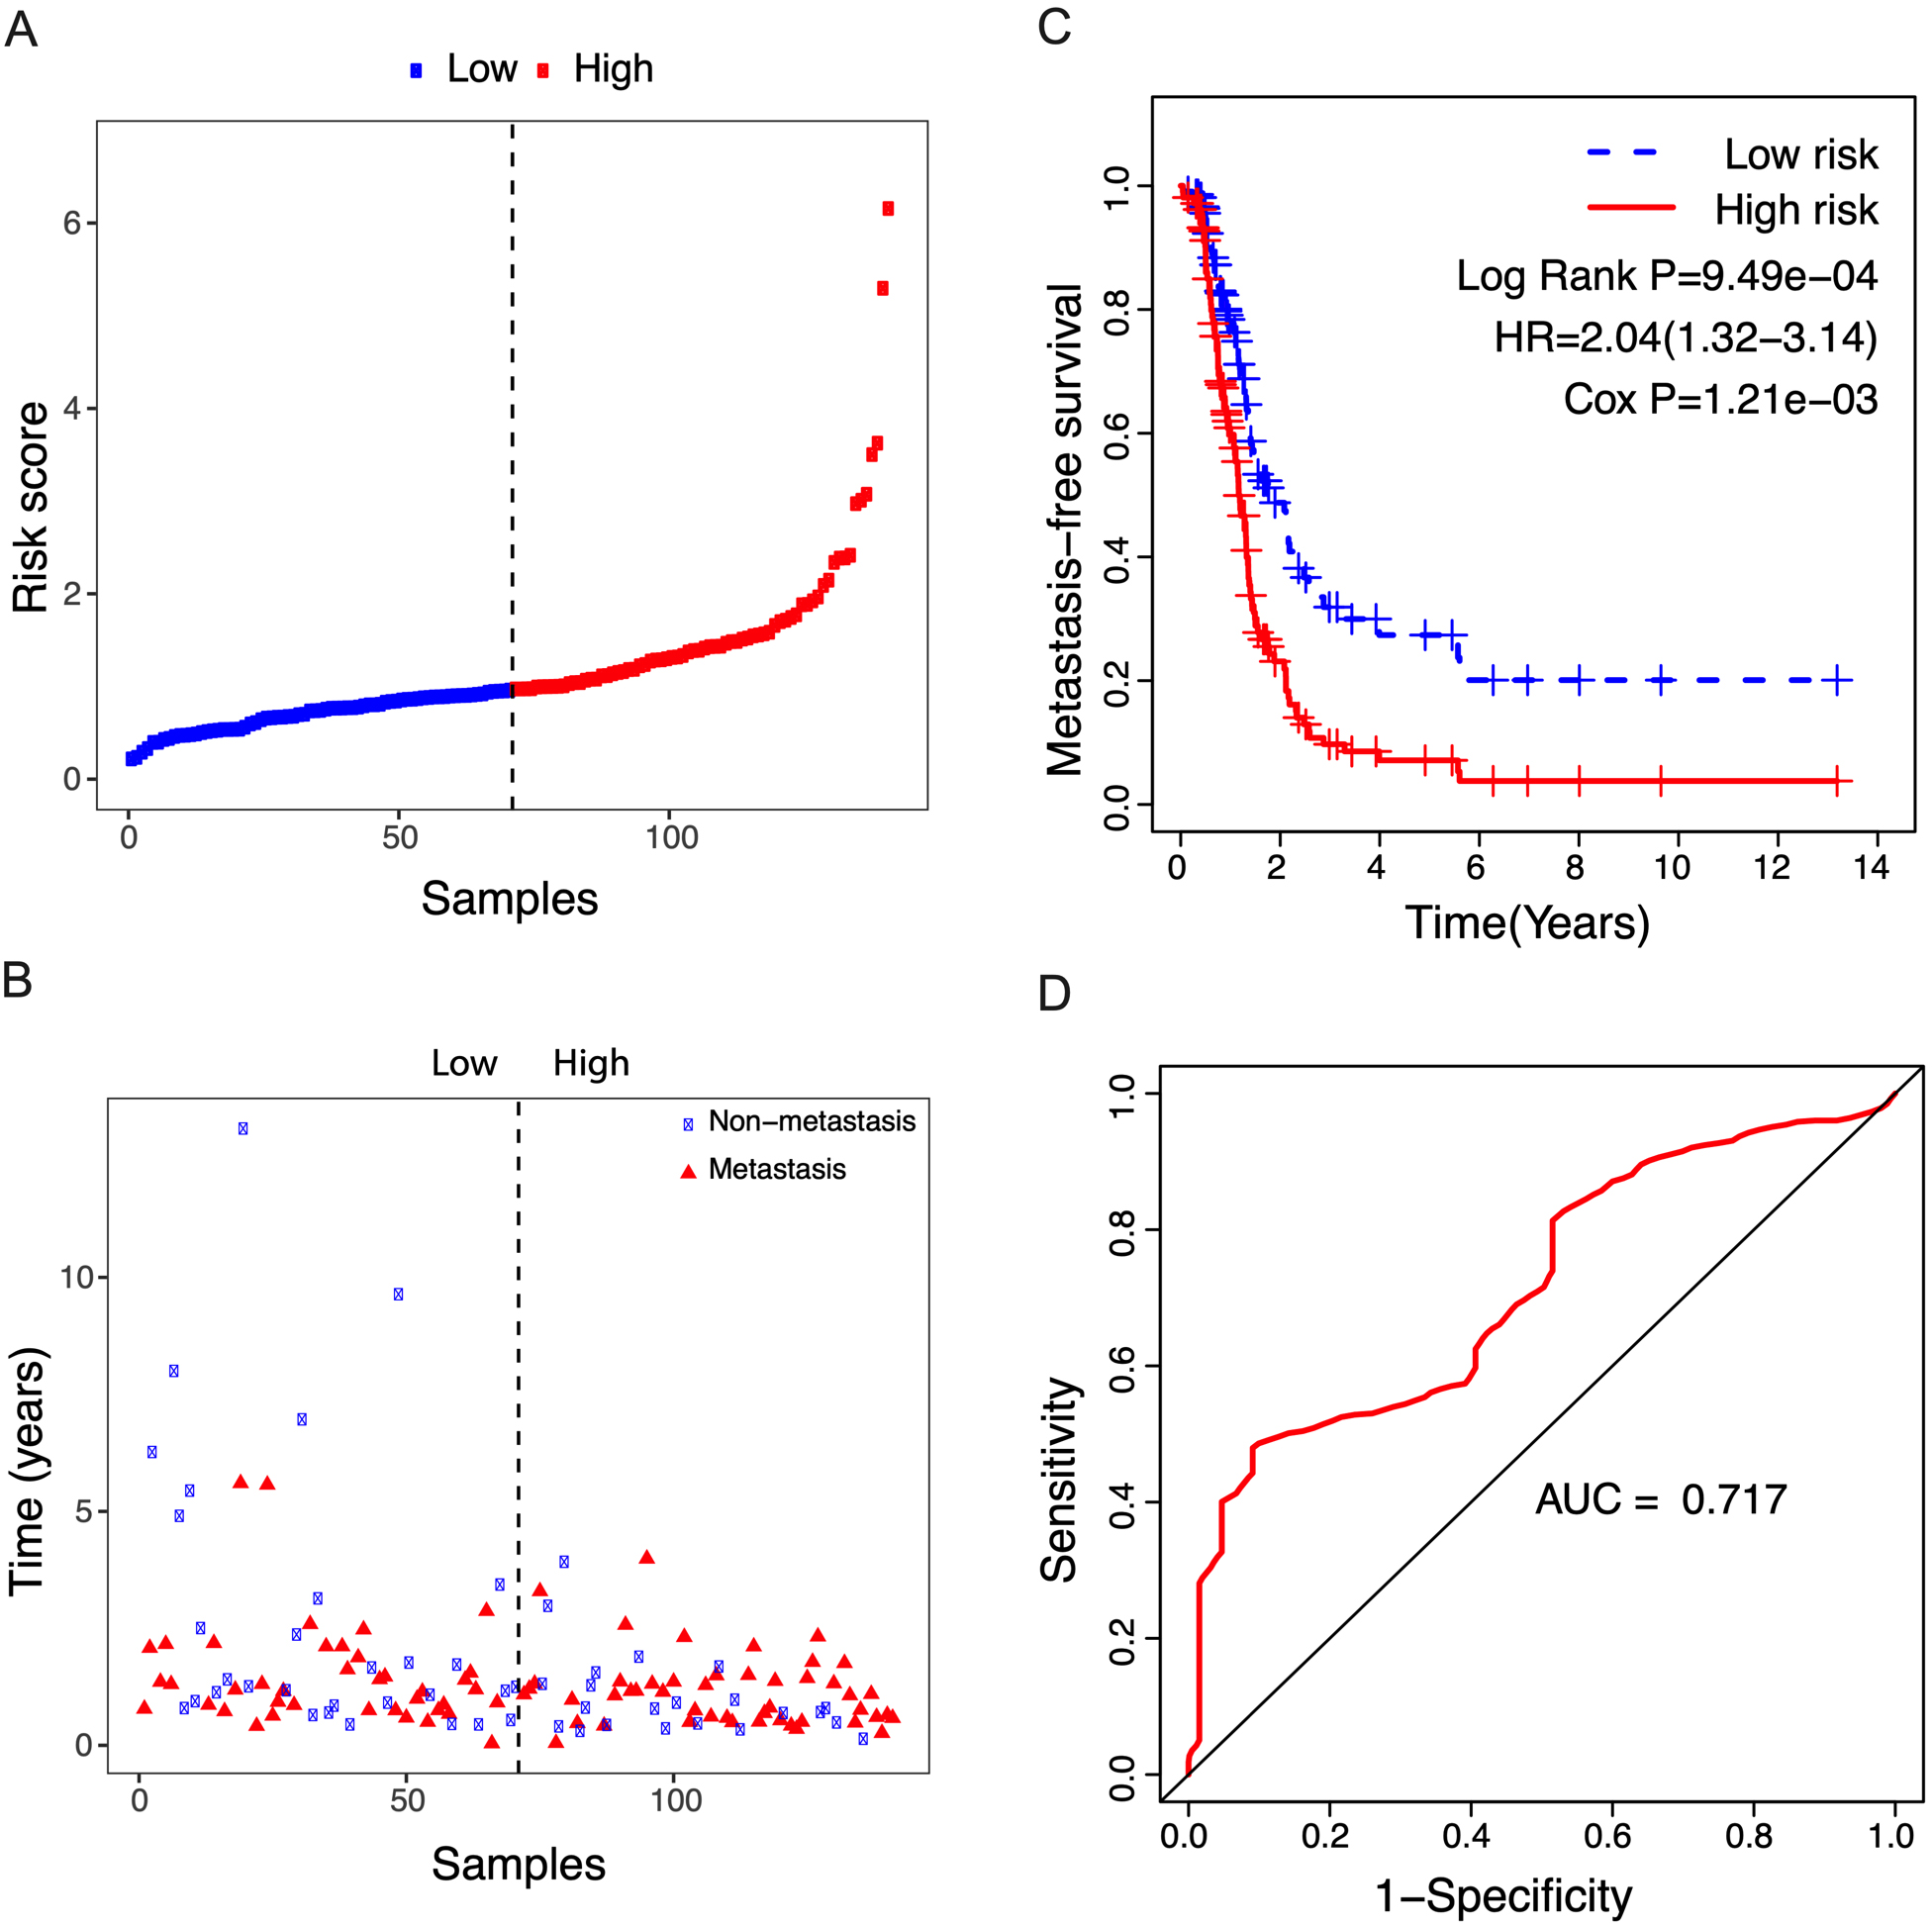
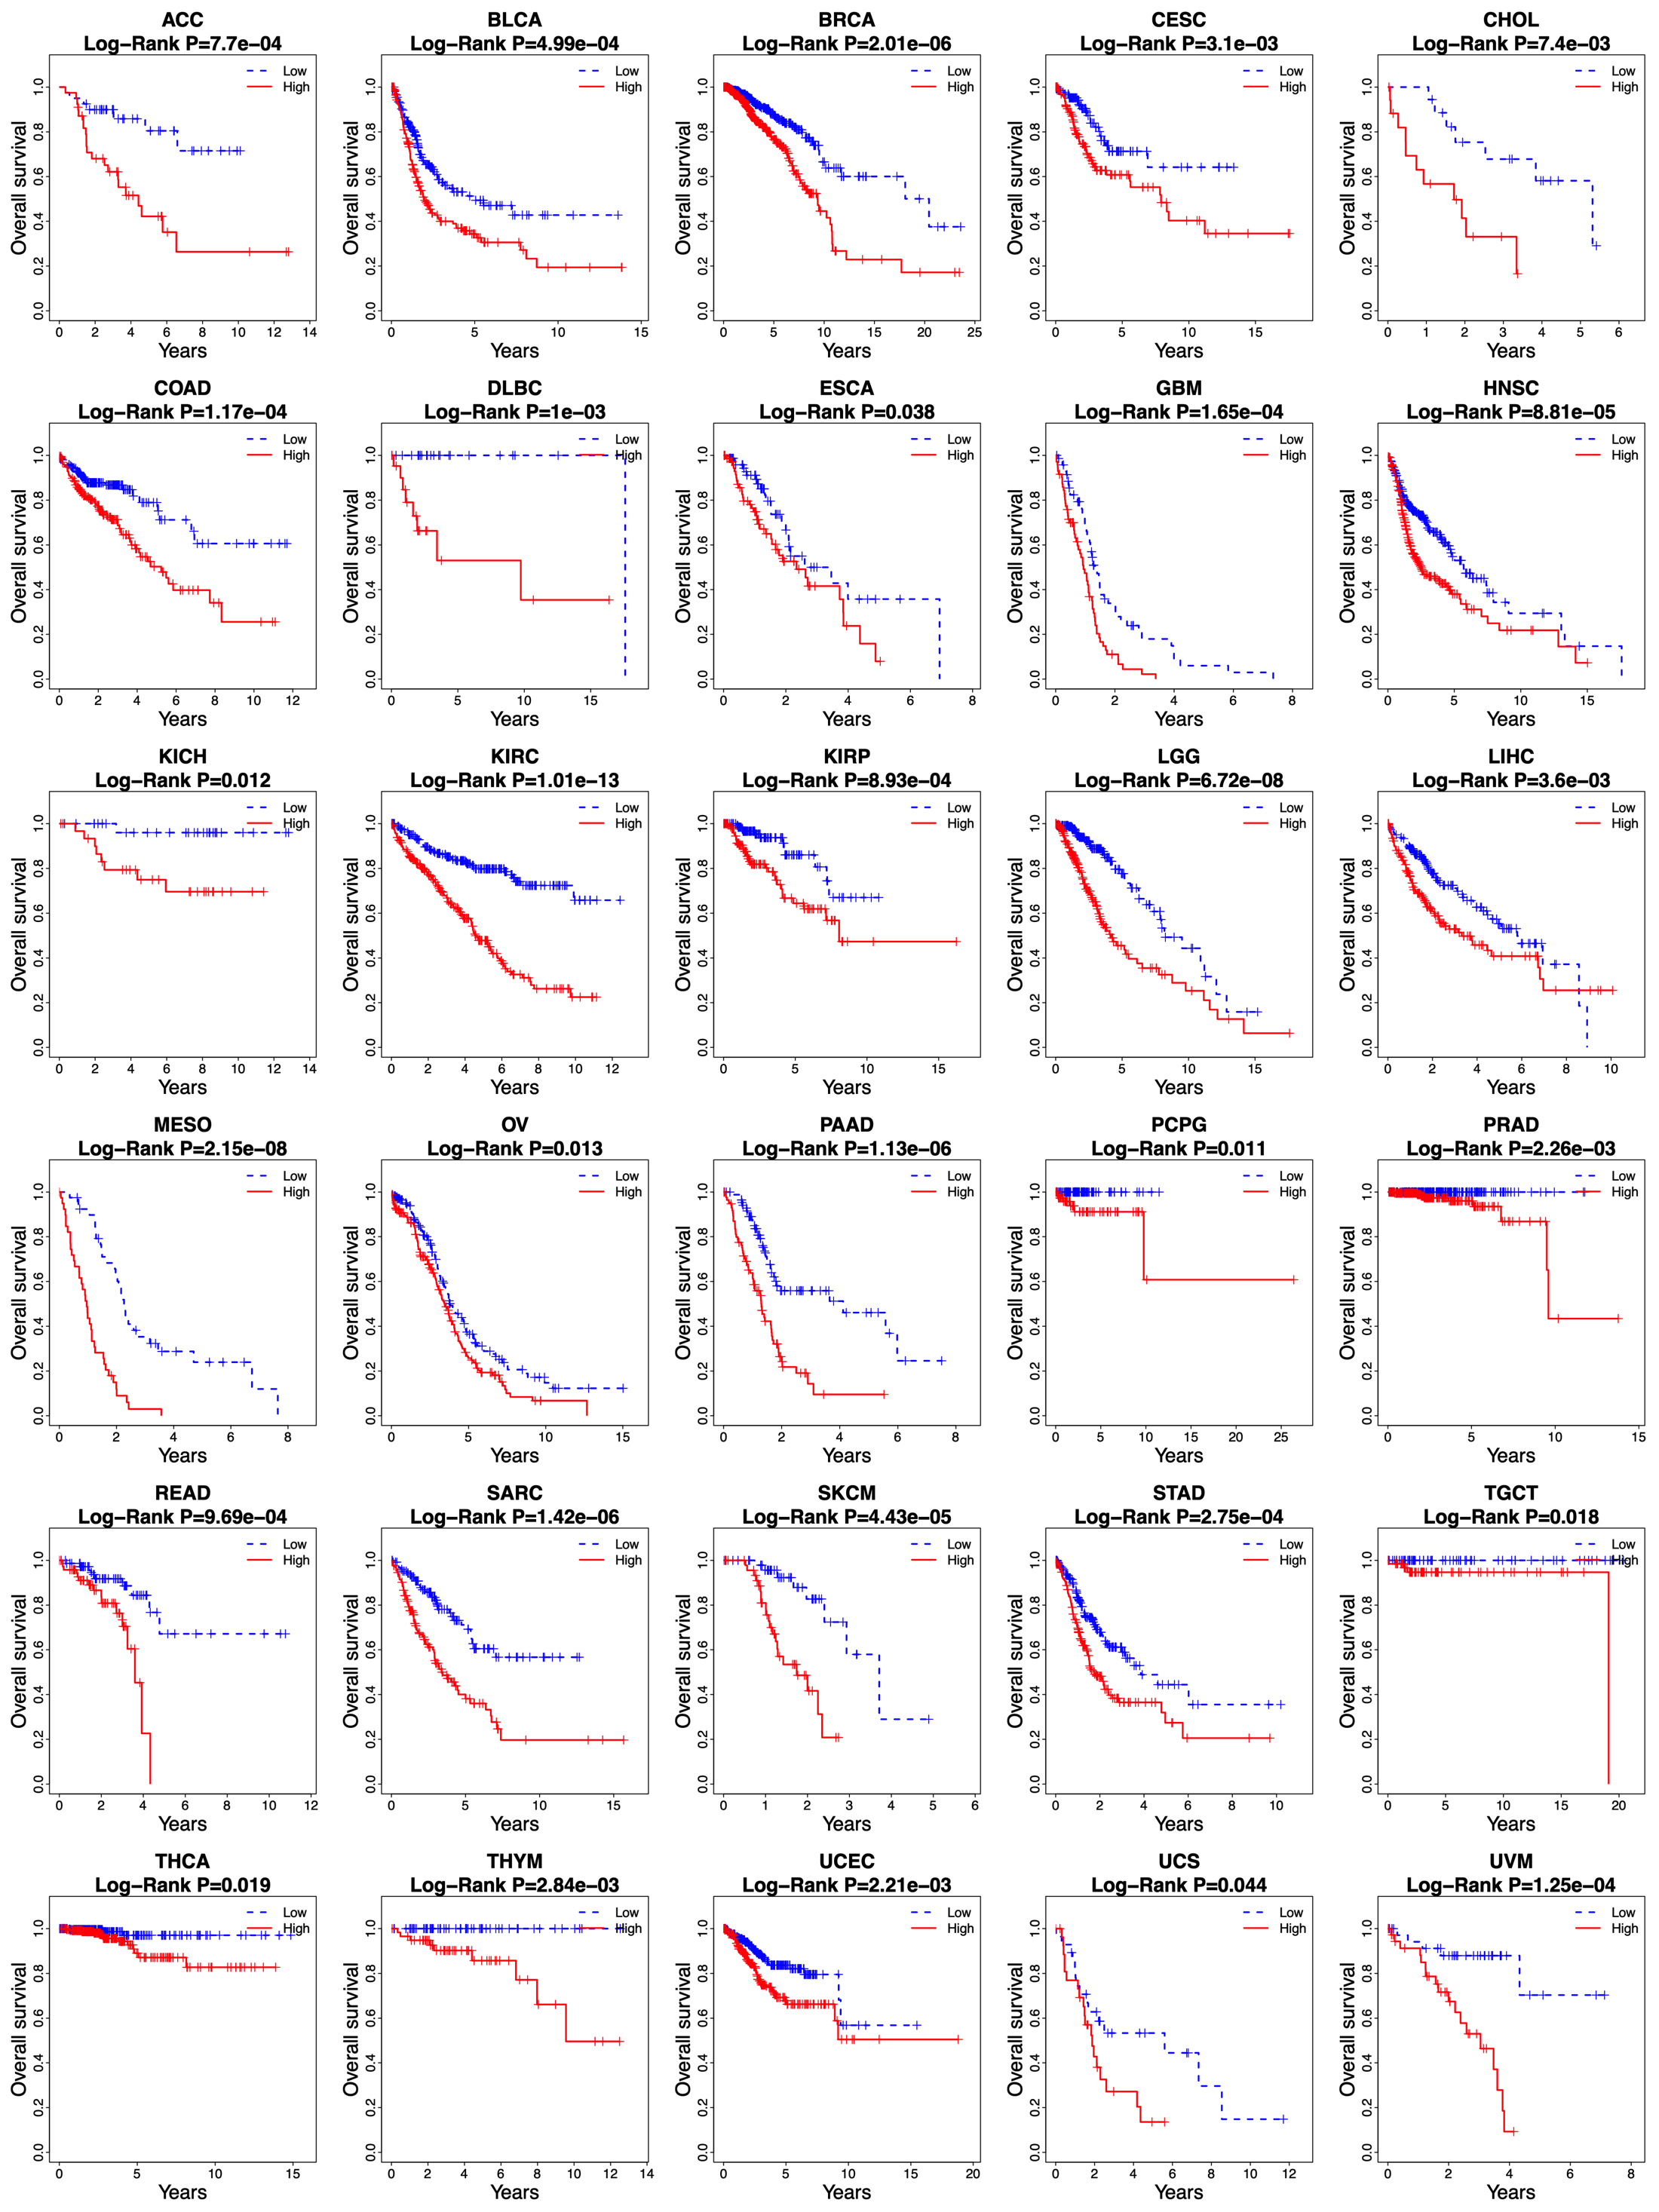
Figure 8.
Kaplan-Meier curves of overall survival between low-risk and high-risk groups in other 30 cancer types in the TCGA database.
3.4The risk score was an independent prognostic factor for NSCLC
To evaluate the independent prognostic value of the risk score, Cox’s regression models were performed in each clinical parameter, such as age, gender, stage, histology type, and risk score. Univariate regression analysis showed that age, pathologic stage, stage N, stage T, and risk score were significantly associated with overall survival (
Because several survival-associated clinical parameters were identified, we further performed a stratification analysis for clinical parameters. Patients in each subgroup were classified into low-risk and high-risk groups according to the median risk score.
3.5The risk score showed a prediction value for the metastasis-free survival of NSCLC patients
Given that some NSCLC patients always develop metastatic disease, we analyzed the potential role of the risk score in predicting metastasis-free survival. As shown in Fig. 7A and B, of the 141 relapsed patients, 53 patients were local recurrences, and the other 88 were metastatic. According to the median risk score, patients were divided into high- and low-risk groups and exhibited unfavorable metastasis-free survival in the high-risk group compared to the low-risk group (Fig. 7C, Log Rank P
3.6The risk score based on 14-lncRNA signature is applicable for predicting the overall survival of other types of cancer
The survival prediction value of the risk score based on the 14-lncRNA signature was further investigated in other 30 cancer types of TCGA database. As shown in Fig. 8, the risk score was able to divide the patients into low-risk and high-risk groups in all the 30 cancer types, and the high-risk group showed an unfavorable overall survival than that of the low-risk group (all
4.Discussion
NSCLC is a global health problem with the leading morbidity and mortality worldwide. Due to the immense heterogeneous features of NSCLC, conventional clinical and pathological criteria such as TNM stage are far from satisfactory for individualized clinical outcome prediction and risk stratification. Therefore, considerable efforts have been made to develop novel molecular prognostic factors that are independent of conventional clinical criteria to promote survival prediction of NSCLC. Evidence from growing reports suggests lncRNAs serving as a biomarker for cancer initiation, diagnosis, prognosis, and metastasis [20, 21, 22, 23, 24], representing a crucial untapped molecular resource for cancer pathogenesis. LncRNA expression profile analyses have reported disrupted expression of lncRNAs in various malignancies, and dysregulated expression of lncRNAs have been involved in physiologic and pathologic processes of lung cancer [25, 26]. Currently, targeting oncogenic lncRNAs has been considered as a novel treatment strategy by inducing the anticancer effect [17]. Moreover, the aberrant expressions of specific lncRNAs could be served as diagnostic markers to distinguish tumors from normal subjects [27]. In accordance with previous studies, our study observed extensive differential expression of lncRNAs in NSCLC compared with normal samples, and these differentially expressed lncRNAs separated patients with NSCLC from normal subjects accurately. However, systematic identification of an expression-based lncRNA signature for prognosis prediction in NSCLC has not been accomplished yet.
When exploring potential lncRNAs as novel signatures formerly, previous efforts of cancer-related lncRNAs often focus on single molecules, which has limitations in the prognostic and predictive power. While multiple factors may function in a cooperative way in cancer development and metastasis. In our study, the lncRNAs were combined into a single diagnostic panel by regression analyses. A risk score based on a 14-lncRNA signature for prognosis prediction of NSCLC was developed by comprehensively analyzing RNAseq and clinical data in a large number of NSCLC patients from the TCGA cohort, and it was validated in the validation cohort and entire cohort, suggesting a competitive performance of the risk score for predicting survival of NSCLC. Univariate regression analysis indicated that age, pathologic stage, stage N, stage T, and the risk score were significant prognostic factors. Therefore, it is important to assess the independence of the 14-lncRNA signature from other clinical features. Multivariable Cox’s regression analysis and stratification analysis, which included other clinicopathological factors as covariables, demonstrated that the prognostic value of the risk score was independent of other clinical variables for survival prediction of patients with NSCLC.
The age at diagnosis exercises a complex influence on the prognosis of patients with lung cancer. Elderly age at diagnosis is an independent negative prognostic factor from several large registry studies [28, 29, 30]. However, Pallis and Gridelli [31] demonstrated that age might be not a negative prognostic factor for advanced/metastatic NSCLC. They also stated that the result might be likely to suffer from selection bias. In the stratified analysis, the risk score showed a prognostic value both in younger and older patients. Currently, the tumor stage has been widely considered as a powerful predictor of survival in NSCLC [32]. In general, stage N0 shows better survival, whereas stage NX is involved in worse survival in a treatment-independent manner. As to be expected, stage N was a significant prognostic factor in our study. Since the study included both LUAD and LUSC patients, we tested whether the risk score was able to predict the prognosis of LUAD and LUSC, respectively. Stratification analysis demonstrated that the risk score was competent for survival prediction in both LUAD and LUSC.
Clinical prognostic factors have critical limitations in survival prediction. The heterogeneity at genetic levels makes patients of the same clinical status having quite different clinical outcomes. Based on its prognostic and predictive power, the lncRNA signature has been shown to be complementary to traditional clinical features [33]. In the stratified analysis, the risk score showed the prognostic value in each subgroup. The risk score can classify patients of the same clinical status into low-risk and high-risk groups with significantly different prognostic value, implying that the risk score can improve the survival prediction power. This finding might help to identify high-risk patients for adjuvant therapy in addition to the standard regimen.
To date, many lncRNAs have been discovered, but only a few of them are well characterized in human cancers. Concerning the biological roles, all the 14 lncRNAs remain uncharacterized for the public so far, but several of them have been preliminarily reported by current literature. A lncRNA-miRNA-mRNA network analysis revealed that C20orf197 was served as a prognosis-related lncRNA for LUAD [34]. Over-expression of LINC00319 is related to poor prognosis of LUAD [35], and it can promote the proliferation and invasion of lung cancer cells by down-regulating the tumor suppressor miR-32 [36]. LncRNA expression profile analysis found that AL355916.1 was up-regulated in patients with hypopharyngeal squamous cell carcinoma [37]. LINC00941 has been observed to be associated with cancer-related biological processes, such as cell cycle, cell migration, cell division, and immune system [38], and also displays prognostic values for LUAD [39, 40]. Cai et al. [41] revealed that AC025419.1 displayed a high diagnostic value for papillary thyroid carcinoma. However, the importance of the other lncRNAs in NSCLC pathogenesis is still either poorly investigated or has not been reported.
In this study, we found that the 14-lncRNA risk score can also predict the overall survival of other types of cancers. This may be caused by the use of NSCLC tumor samples and a variety of adjacent normal samples from other cancer types in performing the differential expression analysis. Although the 14-lncRNA risk score can be used to predict the survival of multiple tumors, we cannot simply assume that this biomarker has the best predictive performance in predicting the prognosis of other tumors. This only suggests that lncRNA can be used to predict the prognosis of other tumors. In the future, more research should explore the development of lncRNA-based signatures in different tumors to predict prognosis.
Knowledge is now rapidly emerging on the association between lncRNAs and the prognosis of NSCLC. In the light of the established molecular aberrations, recent microarray lncRNA expression profiling analyses are inclined to display inconsistent results due to small sample sizes and different platforms and lab protocols [42, 43]. Based on RNAseq data, TCGA has accomplished a comprehensive genetic and epigenetic investigation into a large cohort of NSCLC patients. To our knowledge, the lncRNA expression profiles derived from TCGA are unprecedented in both comprehensiveness and sample size.
5.Conclusions
In this study, we identified a 14-lncRNA signature for prognosis prediction in NSCLC by conducting a comprehensive analysis of lncRNA expression profiles in a large cohort of TCGA patients. The risk score based on the lncRNA signature separated NSCLC patients into high-risk and low-risk groups, implying a poor and good prognosis, respectively. The risk score is an independent prognostic predictor in multivariate and stratified analysis, controlling for other clinical prognostic factors. Our study highlighted significant implications of lncRNAs as prognostic biomarkers for survival prediction in NSCLC and the other cancer types. We hope the lncRNA signature could help us to make personalized therapy decisions in the not-too-distant future.
Conflict of interest
The authors declare that they have no competing interests.
Abbreviations
| lncRNAs | long non-coding RNAs |
| NSCLC | non-small cell lung cancer |
| TCGA | The Cancer Genome Atlas |
| LUAD | lung adenocarcinoma |
| LUSC | lung squamous cell carcinoma |
| ROC | receiver operating characteristic |
| AUC | area under the curve |
| HR | Hazard ratio |
| CI | confidence intervals |
References
[1] | L.A. Torre, F. Bray, R.L. Siegel, J. Ferlay, J. Lortet-Tieulent and A. Jemal, Global cancer statistics, 2012, CA Cancer J Clin 65: ((2015) ), 87–108. |
[2] | R.L. Siegel, K.D. Miller and A. Jemal, Cancer statistics, 2018, CA Cancer J Clin 68: ((2018) ), 7–30. |
[3] | J.R. Molina, P. Yang, S.D. Cassivi, S.E. Schild and A.A. Adjei, Non-small cell lung cancer: Epidemiology, risk factors, treatment, and survivorship, Mayo Clinic Proceedings 83: ((2008) ), 584–594. |
[4] | H. Marijon, A. Bouyon, S. Vignot and B. Besse, Prognostic and predictive factors in lung cancer, Bull Cancer 96: ((2009) ), 391–404. |
[5] | G. Cuyun Carter, A.M. Barrett, J.A. Kaye, A.M. Liepa, K.B. Winfree and W.J. John, A comprehensive review of nongenetic prognostic and predictive factors influencing the heterogeneity of outcomes in advanced non-small-cell lung cancer, Cancer Manag Res 6: ((2014) ), 437–449. |
[6] | M.D. Brundage, D. Davies and W.J. Mackillop, Prognostic factors in non-small cell lung cancer: A decade of progress, Chest 122: ((2002) ), 1037–1057. |
[7] | B. Tasharrofi and S. Ghafouri-Fard, Long non-coding rnas as regulators of the mitogen-activated protein kinase (MAPK) pathway in cancer, Klin Onkol 31: ((2018) ), 95–102. |
[8] | T. Gutschner, G. Richtig, M. Haemmerle and M. Pichler, From biomarkers to therapeutic targets-the promises and perils of long non-coding RNAs in cancer, Cancer Metastasis Rev 37: ((2018) ), 83–105. |
[9] | Z.D. Xiao, L. Zhuang and B. Gan, Long non-coding RNAs in cancer metabolism, Bioessays 38: ((2016) ), 991–996. |
[10] | T.R. Mercer, M.E. Dinger and J.S. Mattick, Long non-coding RNAs: Insights into functions, Nature Reviews Genetics 10: ((2009) ), 155–159. |
[11] | C.A. Brosnan and O. Voinnet, The long and the short of noncoding RNAs, Current Opinion In Cell Biology 21: ((2009) ), 416–425. |
[12] | A. Roth and S. Diederichs, Long noncoding RNAs in lung cancer, Curr Top Microbiol Immunol 394: ((2016) ), 57–110. |
[13] | B. Ricciuti, C. Mencaroni, L. Paglialunga, F. Paciullo, L. Crino, R. Chiari and G. Metro, Long noncoding RNAs: New insights into non-small cell lung cancer biology, diagnosis and therapy, Medical Oncology 33: ((2016) ), 18. |
[14] | Y. Chen, L. Lu, B. Feng, S. Han, S. Cui, X. Chu, L. Chen and R. Wang, Non-coding RNAs as emerging regulators of epithelial to mesenchymal transition in non-small cell lung cancer, Oncotarget 8: ((2017) ), 36787–36799. |
[15] | L.H. Schmidt, T. Spieker, S. Koschmieder, S. Schaffers, J. Humberg, D. Jungen, E. Bulk, A. Hascher, D. Wittmer, A. Marra, L. Hillejan, K. Wiebe, W.E. Berdel, R. Wiewrodt and C. Muller-Tidow, The long noncoding MALAT-1 RNA indicates a poor prognosis in non-small cell lung cancer and induces migration and tumor growth, J Thorac Oncol 6: ((2011) ), 1984–1992. |
[16] | X. Zhou, J. Chen and W. Tang, The molecular mechanism of HOTAIR in tumorigenesis, metastasis, and drug resistance, Acta Biochim Biophys Sin (Shanghai) 46: ((2014) ), 1011–1015. |
[17] | C.H. Li and Y. Chen, Targeting long non-coding RNAs in cancers: Progress and prospects, Int J Biochem Cell Biol 45: ((2013) ), 1895–1910. |
[18] | D.J. McCarthy, Y. Chen and G.K. Smyth, Differential expression analysis of multifactor RNA-Seq experiments with respect to biological variation, Nucleic Acids Research 40: ((2012) ), 4288–4297. |
[19] | M.D. Robinson, D.J. McCarthy and G.K. Smyth, edgeR: a Bioconductor package for differential expression analysis of digital gene expression data, Bioinformatics 26: ((2010) ), 139–140. |
[20] | M.A. Osielska and P.P. Jagodzinski, Long non-coding RNA as potential biomarkers in non-small-cell lung cancer: What do we know so far? Biomedicine & Pharmacotherapy 101: ((2018) ), 322–333. |
[21] | E.M. Reis and S. Verjovski-Almeida, Perspectives of long non-coding RNAs in cancer diagnostics, Front Genet 3: ((2012) ), 32. |
[22] | A.M. Schmitt and H.Y. Chang, Long noncoding RNAs in cancer pathways, Cancer Cell 29: ((2016) ), 452–463. |
[23] | S.W. Cheetham, F. Gruhl, J.S. Mattick and M.E. Dinger, Long noncoding RNAs and the genetics of cancer, Br J Cancer 108: ((2013) ), 2419–2425. |
[24] | E.A. Gibb, E.A. Vucic, K.S. Enfield, G.L. Stewart, K.M. Lonergan, J.Y. Kennett, D.D. Becker-Santos, C.E. MacAulay, S. Lam, C.J. Brown and W.L. Lam, Human cancer long non-coding RNA transcriptomes, PLoS One 6: ((2011) ), e25915. |
[25] | E.J. Whiteside, I. Seim, J.P. Pauli, A.J. O’Keeffe, P.B. Thomas, S.L. Carter, C.M. Walpole, J.N. Fung, P. Josh, A.C. Herington and L.K. Chopin, Identification of a long non-coding RNA gene, growth hormone secretagogue receptor opposite strand, which stimulates cell migration in non-small cell lung cancer cell lines, International Journal of Oncology 43: ((2013) ), 566–574. |
[26] | J. Yang, J. Lin, T. Liu, T. Chen, S. Pan, W. Huang and S. Li, Analysis of lncRNA expression profiles in non-small cell lung cancers (NSCLC) and their clinical subtypes, Lung Cancer 85: ((2014) ), 110–115. |
[27] | R. Fatima, V.S. Akhade, D. Pal and S.M. Rao, Long noncoding RNAs in development and cancer: Potential biomarkers and therapeutic targets, Mol Cell Ther 3: ((2015) ), 5. |
[28] | M.S. Lara, A. Brunson, T. Wun, B. Tomlinson, L. Qi, R. Cress, D.R. Gandara and K. Kelly, Predictors of survival for younger patients less than 50 years of age with non-small cell lung cancer (NSCLC): A california cancer registry analysis, Lung Cancer 85: ((2014) ), 264–269. |
[29] | S. Ramalingam, K. Pawlish, S. Gadgeel, R. Demers and G.P. Kalemkerian, Lung cancer in young patients: analysis of a surveillance, epidemiology, and end results database, Journal Of Clinical Oncology 16: ((1998) ), 651–657. |
[30] | E. Radzikowska, P. Glaz and K. Roszkowski, Lung cancer in women: Age, smoking, histology, performance status, stage, initial treatment and survival, Population-based study of 20 561 cases, Annals of Oncology 13: ((2002) ), 1087–1093. |
[31] | A.G. Pallis and C. Gridelli, Is age a negative prognostic factor for the treatment of advanced/metastatic non-small-cell lung cancer? Cancer Treatment Reviews 36: ((2010) ), 436–441. |
[32] | G.A. Woodard, K.D. Jones and D.M. Jablons, Lung cancer staging and prognosis, Cancer Treat Res 170: ((2016) ), 47–75. |
[33] | H. Yang, Y. Han, L. Wu and C. Wu, Long non-coding RNA expression signature hallmarks promising efficacy in identification of human non-small cell lung cancer: A meta-analysis study, Clin Lab 63: ((2017) ), 1447–1456. |
[34] | J. Zhao, W. Cheng, X. He, Y. Liu, J. Li, J. Sun, F. Wang and Y. Gao, Construction of a specific SVM classifier and identification of molecular markers for lung adenocarcinoma based on lncRNA-miRNA-mRNA network, Onco Targets Ther 11: ((2018) ), 3129–3140. |
[35] | Z.W. Zhang, J.J. Chen, S.H. Xia, H. Zhao, J.B. Yang, H. Zhang, B. He, J. Jiao, B.T. Zhan and C.C. Sun, Long intergenic non-protein coding RNA 319 aggravates lung adenocarcinoma carcinogenesis by modulating miR-450b-5p/EZH2, Gene 650: ((2018) ), 60–67. |
[36] | B. Zhou, W. Yuan and X. Li, Long intergenic noncoding RNA 319 (linc00319) promotes cell proliferation and invasion in lung cancer cells by directly downregulating the tumor suppressor MiR-32, Oncology Research ((2017) ). |
[37] | J. Zhou, W. Li, T. Jin, X. Xiang, M. Li, J. Wang, G. Li, X. Pan and D. Lei, Gene microarray analysis of lncRNA and mRNA expression profiles in patients with hypopharyngeal squamous cell carcinoma, Int J Clin Exp Med 8: ((2015) ), 4862–4882. |
[38] | C. Luo, Y. Tao, Y. Zhang, Y. Zhu, D.N. Minyao, M. Haleem, C. Dong, L. Zhang, X. Zhang, J. Zhao and Q. Liao, Regulatory network analysis of high expressed long non-coding RNA LINC00941 in gastric cancer, Gene 662: ((2018) ), 103–109. |
[39] | X. Zhang, Q. Chi and Z. Zhao, Up-regulation of long non-coding RNA SPRY4-IT1 promotes tumor cell migration and invasion in lung adenocarcinoma, Oncotarget 8: ((2017) ), 51058–51065. |
[40] | I. Akagi, H. Okayama, A.J. Schetter, A.I. Robles, T. Kohno, E.D. Bowman, D. Kazandjian, J.A. Welsh, N. Oue, M. Saito, M. Miyashita, E. Uchida, T. Takizawa, S. Takenoshita, V. Skaug, S. Mollerup, A. Haugen, J. Yokota and C.C. Harris, Combination of protein coding and noncoding gene expression as a robust prognostic classifier in stage I lung adenocarcinoma, Cancer Research 73: ((2013) ), 3821–3832. |
[41] | W.Y. Cai, X. Chen, L.P. Chen, Q. Li, X.J. Du and Y.Y. Zhou, Role of differentially expressed genes and long non-coding RNAs in papillary thyroid carcinoma diagnosis, progression, and prognosis, Journal of Cellular Biochemistry ((2018) ). |
[42] | M. Zhou, M. Guo, D. He, X. Wang, Y. Cui, H. Yang, D. Hao and J. Sun, A potential signature of eight long non-coding RNAs predicts survival in patients with non-small cell lung cancer, J Transl Med 13: ((2015) ), 231. |
[43] | Z. Tu, D. He, X. Deng, M. Xiong, X. Huang, X. Li, L. Hao, Q. Ding and Q. Zhang, An eight-long non-coding RNA signature as a candidate prognostic biomarker for lung cancer, Oncology Reports 36: ((2016) ), 215–222. |
Appendices
Supplementary data
Figure S1.
Scatterplot of patients’ survival status in the training, validation, and entire cohort. The black dotted line represents the median risk score cutoff dividing patients into low-risk and high-risk groups.
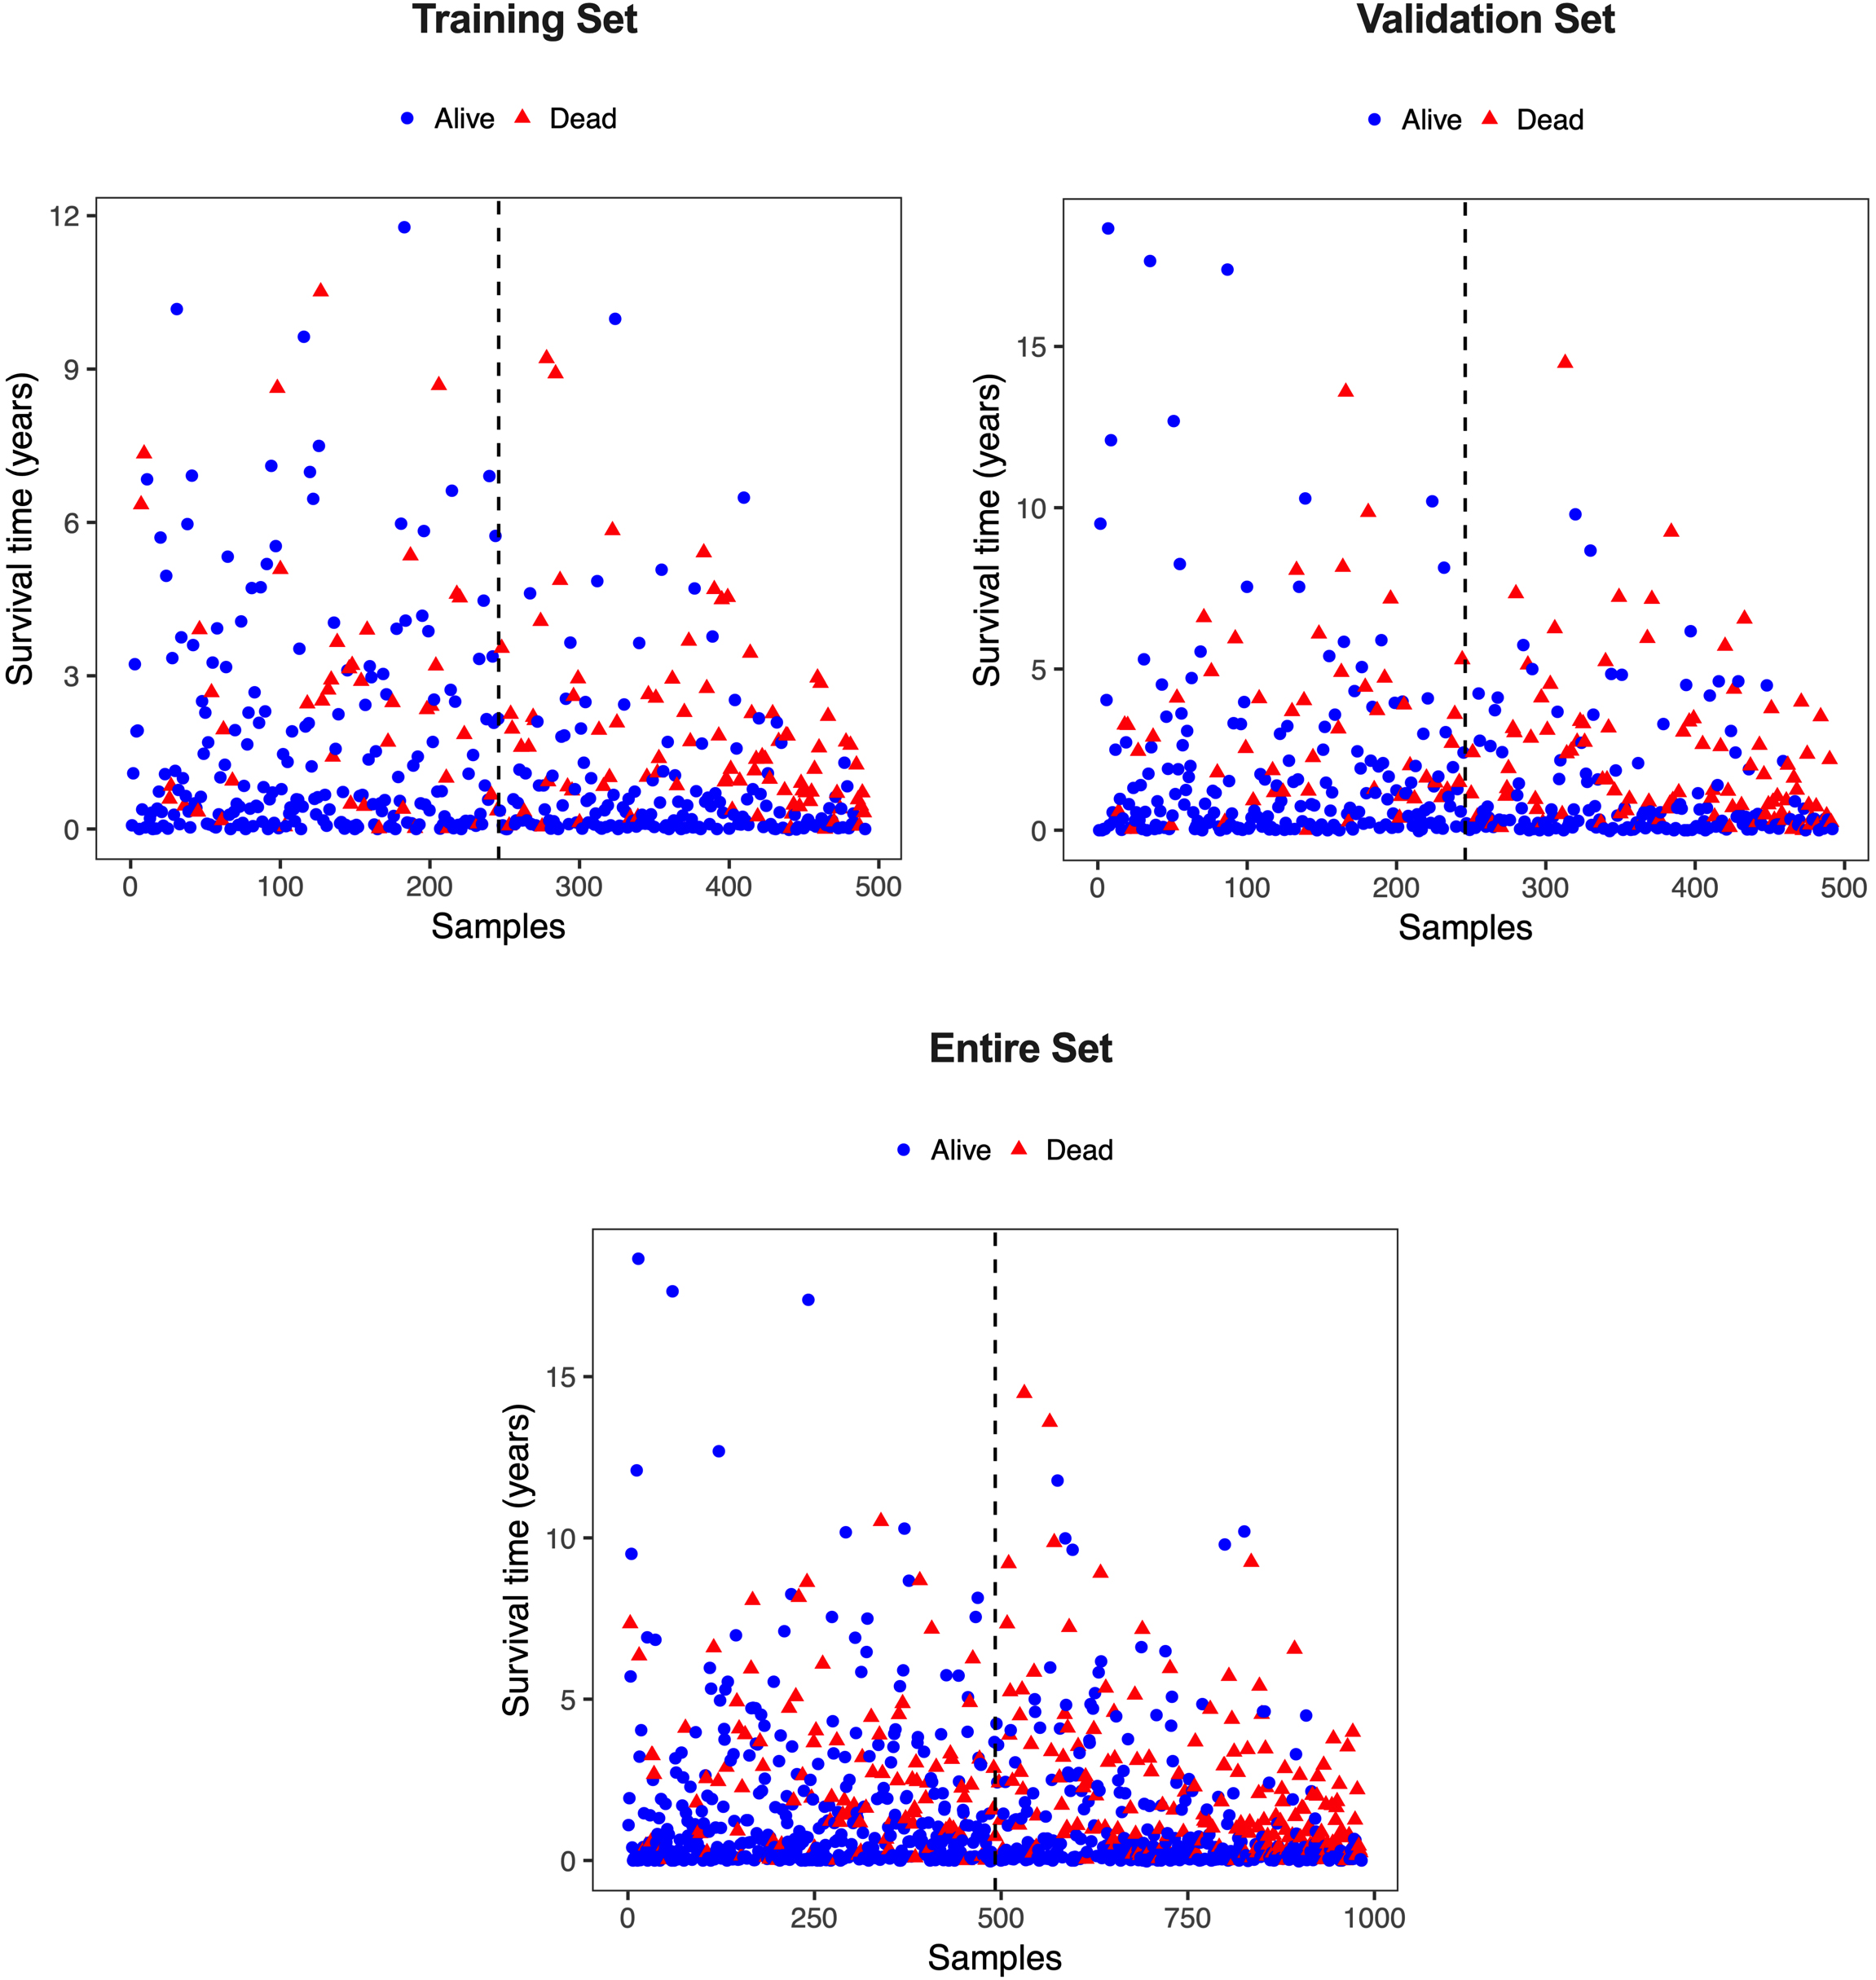
Figure S2.
Kaplan-Meier curves analyzed the difference of overall survival when the patients were stratified by different clinical characteristics (age, gender, pathologic stage, stage T, stage M, stage N, and histological type).