
Identification of genes in hepatocellular carcinoma induced by non-alcoholic fatty liver disease
Abstract
BACKGROUND:
Hepatocellular carcinoma (HCC) is the leading cause of mortality worldwide. In recent years, the incidence of HCC induced by NAFLD is growing rapidly.
OBJECTIVE:
To screen for new pathogenic genes and related pathways both in NAFLD and HCC, and to explore the pathogenesis of progression from NAFLD to HCC.
METHODS:
Gene expression microarrays (GSE74656, GSE62232) were used for identifying differentially expressed genes (DEGs). Functional enrichment and pathway enrichment analyses indicated that these DEGs were related to cell cycle and extracellular exosome, which were closely related to NAFLD and HCC development. We then used the Search Tool for the Retrieval of Interacting Genes (STRING) to establish the protein-protein interaction (PPI) network and visualized them in Cytoscape. And the overall survival (OS) analysis and gene expression validation in TCGA of hub genes was performed.
RESULTS:
Seven hub genes, including CDK1, HSP90AA1, MAD2L1, PRKCD, ITGB3BP, CEP192, and RHOB were identified. Finally, we verified the expression level of ITGB3BP and CEP192 by quantitative real-time PCR in vitro.
CONCLUSIONS:
The present study implied possible DEGs, especially the new gene CEP192, in the progression of NAFLD developing to HCC. Further rigorous experiments are required to verify the above results.
1.Introduction
Hepatocellular carcinoma (HCC), the most common type of liver cancer, is one of the leading causes of tumor death worldwide [1]. Multiple studies have shown that the main risk factors for HCC are chronic hepatitis B virus (HBV) infection, hepatitis C virus (HCV) infection, nonalcoholic fatty liver disease (NAFLD), alcohol abuse, and obesity [2]. In recent years, the incidence of HCC induced by NAFLD has increased rapidly. NAFLD is one of the common chronic liver diseases in the world [3]. It is expected to be the main cause of end-stage liver disease and HCC by 2025. Basic research and clinical research have shown that NAFLD can develop into more severe forms of non-alcoholic steatohepatitis (NASH) and cirrhosis, which is associated with a high risk of HCC [4, 5]. Additionally, owing to the limited effects of radiotherapy and chemotherapy, complete tumor resection is the only option for cure or long-term survival. However, patients with HCC are usually diagnosed at late stages, and therefore they are ineligible for surgical excision. In summary, despite the convincing link between HCC and NAFLD, the underlying molecular mechanisms are still elusive.
In recent decades, the introduction of high-throughput technologies and bioinformatics analysis enabled identifying the pathogenic genes in carcinogenesis and screening potential biomarkers of cancer [6]. Many studies have used microarray-based cDNA expression profiling of HCC to identify potential genes and pathways involved [7]. In addition, gene expression profiles have also been used to identify factors related to the progress of NAFLD [8, 9, 10].
Previous studies have confirmed the genetic polymorphisms of patatin-like phospholipase domain containing 3 (PNPLA3) [11] and transmembrane 6 superfamily member 2 (TM6SF2) [12] are associated with a higher risk of HCC in patients with NAFLD. However, there has been no research analyzing the cDNA microarrays in the progression of NAFLD together with HCC. In this research, we integrated two cDNA microarrays (GSE24807 and GSE62232) and screened the overlapping differentially expressed genes (DEGs). Subsequently, we performed the functional and pathway enrichment analysis, established protein-protein interaction networks, and identified hub genes. Thus, this study can potentially provide new pathogenic genes and related pathways both in NAFLD and HCC, and explore the pathogenesis of progression from NAFLD to HCC.
2.Materials and methods
2.1Microarray data acquisition
The database of the Gene Expression Omnibus (GEO) is the largest fully public repository for high-throughput gene sequencing. Eligible GEO datasets were selected based on the inclusion criteria: 1) All tissues were diagnosed by pathology and 2) normal liver tissues were used as negative controls. In this work, we selected two cDNA profiling microarrays (GSE24807 and GSE62232) from the GEO database. GSE24807 consisted of 17 tissue samples (12 cases of NASH, and 5 cases of the normal liver) [13]. And GSE62232 consisted of 91 tissue samples (81 cases of HCC and 10 cases of the normal liver) [14].
2.2Data processing
GEO2R, an R-based tool in the web of GEO, enables users in screening DEGs from two groups of samples [15]. We then screened DEGs between NASH and normal samples and between HCC and normal samples by applying GEO2R. The Cut-off criteria was set to
2.3Enrichment analysis
An online program, Database for Annotation, Visualization, and Integrated Discovery (DAVID) is an open-access website that provides functional annotation for users to comprehend biological meaning in the context of numerous genes [17]. The overlapping upregulated and downregulated DEGs were subjected to Gene Ontology (GO) and Kyoto Encyclopedia of Genes and Genomes (KEGG) pathway enrichment analysis in DAVID [18]. the cut-off criterion was set to
2.4Protein-protein interaction (PPI) network establishment
The interaction between proteins plays a key role in the development of tumors. In this research, we used the Search Tool for the Retrieval of Interacting Genes (STRING) database to construct the PPI network of DEGs. The Cut-off standard was set to an interaction score
2.5Survival analysis of hub genes
The survival data of hub genes were analyzed by the online website OncoLnc, which linked to the database of the Cancer Genome Atlas (TCGA) [21]. Using the data in TCGA, we divided HCC patients into two groups based on the high and low expression of specific genes and analyzed the overall survival rate using Kaplan-Meier charts. OncoLnc could calculate and display the log-rank P-value.
2.6Gene expression of the hub genes
The TCGA database has provided comprehensive, multidimensional data of the alterations in key genes in various types of cancers. We then downloaded the data of fifty tissue samples (fifty cases of HCC and fifty adjacent normal liver) from the TCGA database to confirm the expression of hub genes.
Figure 1.
Identification of differentially expressed genes in mRNA expression profiling datasets (GSE24807, GSE62232). (A) High expression gens; (B) Low expression genes.
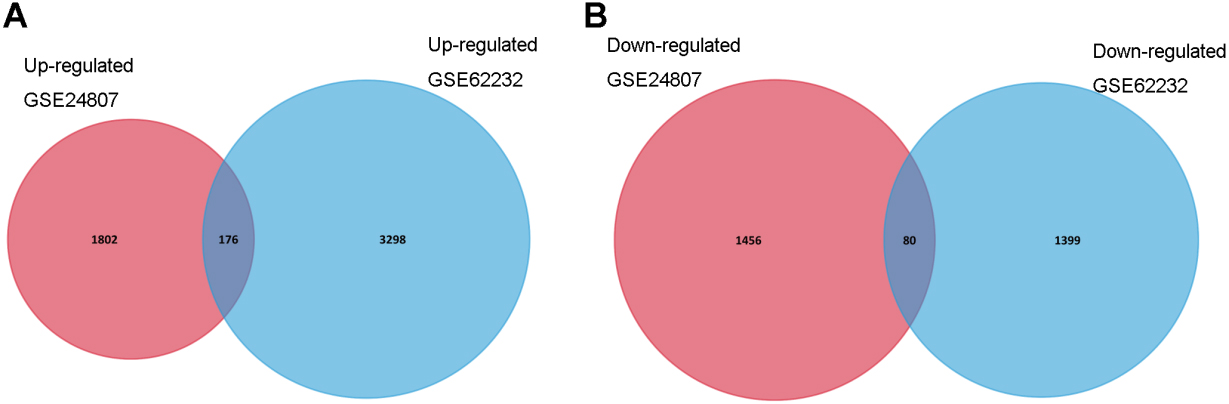
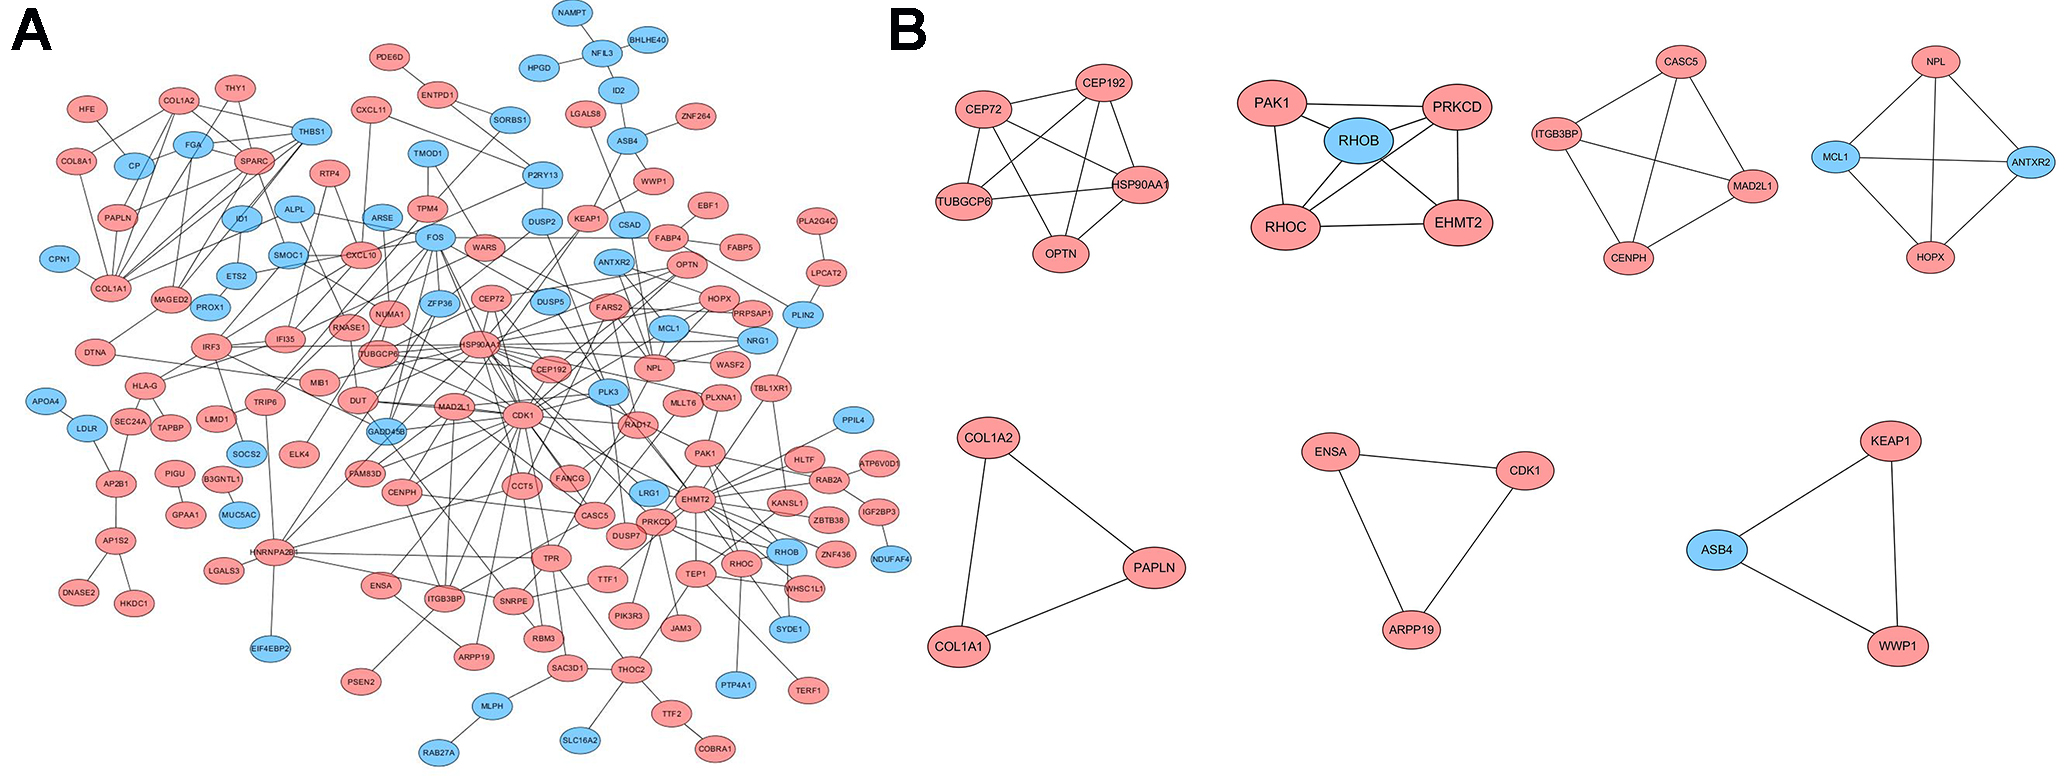
Figure 2.
Protein-protein interaction (PPI) network and core modules of PPI network. (A) High and low expression genes; (B) Core modules. The pink circles represent high expression genes, and the blue circles represent low expression genes.
2.7Cell culture and construction of the cell model
In this study, four human HCC cell lines (LM3, Hep3B, Huh7, and HepG2) compared with two normal hepatic cell lines (L-02 and QSG-7701) were used. LM3, Hep3B, Huh7, and HepG2 were maintained in DMEM (Gibco) supplemented with 1% penicillin-streptomycin as well as 10% fetal bovine serum (FBS; Gibco) in a hominid incubator (5% CO2 with 37
2.8RNA extraction and Quantitative real-time PCR
Based on the manufacturer’s instructions, total RNA from cultured cells was isolated using the TRIzol reagent (Invitrogen), and reverse-transcribed to obtain cDNA utilizing the Takara PrimeScript RT reagent Kit. Quantitative real-time PCR (qRT-PCR) was performed using SYBR Green (Takara) on an Applied Biosystems 7500 real-time PCR System (ABI, USA). Primers used for CEP192, ITGB3BP and GAPDH were as follows: CEP192-F (5’-CAC TTG CTA GGG ATA GAT CCA GC-3’) and CEP192-R (5’-ACC CGG ATG GAA CTG AAA ATC-3’); ITGB3BP-F (5’-AAT CTC CTG TGC ATC ACA TTT CT-3’) and ITGB3BP-R (5’-TTC ATA GCT GTC AAG ATG ACG TG-3’); GAPDH-F (5’-TCA ACG ACC ACT TTG TCA AGC TCA-3’) and GAPDH-R (5’-GCT GGT GGT CCA GGG GTC TTA CT-3’). Human GAPDH was used as an internal standard for calculating the relative expression, using the 2-
2.9Statistical analysis
All Statistical analyses were performed using GraphPad Prism software version 6 (GraphPad Software, San Diego, CA, USA). Values are shown as the mean
3.Results
3.1Screen DEGs in both HCC and NAFLD
We analyzed data of each microarray to screen DEGs by using GEO2R. Amon all DEGs from two gene expression microarrays (GSE24807 and GSE62232), there were 1978 (GSE24807) and 3474 upregulated genes (GSE62232), and 1536 (GSE24807) and 1479 downregulated genes (GSE62232), respectively. Subsequently, 176 overlapping upregulated genes and 80 overlapping downregulated genes were obtained (Fig. 1).
3.2Functional and pathway enrichment analysis
Table 1 showed GO terms of functional enrichment analysis performed by using DAVID. The overlapping highly expressed genes were associated with a variety of biological processes (BP), including mitotic nuclear division, cell division, and G2/M transition of the mitotic cell cycle. And these genes enriched in molecular functions (MF) of protein binding, GPI anchor binding, and protein homodimerization activity. In addition, cell components (CC) enrichment of these genes showed terms of the cytoplasm, extracellular exosome, nucleus, and cytosol and membrane, which indicated that highly expressed genes may be related to the cell cycle.
Table 1
Functional enrichment analysis of DEGs both in non-alcoholic steatohepatitis and hepatocellular carcinoma
| Category GO analysis | Terms | Count | P value |
|---|---|---|---|
| High expression | |||
| GOTERM_BP_DIRECT | Mitotic nuclear division | 10 | 6.0E-4 |
| GOTERM_BP_ DIRECT | Cell division | 10 | 1.9E-3 |
| GOTERM_BP_ DIRECT | G2/M transition of mitotic cell cycle | 7 | 1.9E-3 |
| GOTERM_BP_ DIRECT | Positive regulation of release of sequestered calcium ion into cytosol | 4 | 2.1E-3 |
| GOTERM_BP_ DIRECT | Antigen processing and presentation of peptide antigen via MHC class I | 4 | 2.8E-3 |
| GOTERM_CC_ DIRECT | Cytoplasm | 71 | 4.0E-5 |
| GOTERM_CC_ DIRECT | Extracellular exosome | 41 | 1.2E-3 |
| GOTERM_CC_ DIRECT | Nucleus | 66 | 2.4E-3 |
| GOTERM_CC_ DIRECT | Cytosol | 45 | 2.7E-3 |
| GOTERM_CC_ DIRECT | Membrane | 33 | 3.0E-3 |
| GOTERM_MF_ DIRECT | Protein binding | 118 | 6.2E-8 |
| GOTERM_MF_ DIRECT | GPI anchor binding | 33 | 1.8E-3 |
| GOTERM_MF_ DIRECT | Protein homodimerization activity | 14 | 2.3E-2 |
| GOTERM_MF_ DIRECT | Ubiquitin binding | 4 | 3.9E-2 |
| GOTERM_MF_ DIRECT | CXCR3 chemokine receptor binding | 2 | 4.7E-2 |
| Low expression | |||
| GOTERM_BP_ DIRECT | Endoderm formation | 2 | 3.0E-2 |
| GOTERM_BP_ DIRECT | Positive regulation of angiogenesis | 3 | 6.2E-2 |
| GOTERM_BP_ DIRECT | Positive regulation of exocytosis | 2 | 6.9E-2 |
| GOTERM_BP_ DIRECT | Positive regulation of transforming growth factor beta receptor signaling pathway | 2 | 8.4E-2 |
| GOTERM_BP_ DIRECT | Negative regulation of cell cycle | 2 | 8.8E-2 |
| GOTERM_CC_ DIRECT | External side of plasma membrane | 5 | 5.5E-3 |
| GOTERM_CC_ DIRECT | Fibrinogen complex | 2 | 3.1E-2 |
| GOTERM_CC_ DIRECT | Blood microparticle | 3 | 4.4E-2 |
| GOTERM_CC_ DIRECT | Platelet alpha granule | 2 | 5.2E-2 |
| GOTERM_CC_ DIRECT | Basolateral plasma membrane | 3 | 6.0E-2 |
| GOTERM_MF_ DIRECT | Transcriptional repressor activity, RNA polymerase II core promoter proximal region sequence-specific binding | 4 | 6.9E-3 |
| GOTERM_MF_ DIRECT | Low-density lipoprotein particle binding | 2 | 4.8E-2 |
| GOTERM_MF_ DIRECT | Protein tyrosine phosphatase activity | 3 | 5.0E-2 |
| GOTERM_MF_ DIRECT | MAP kinase tyrosine/serine/threonine phosphatase activity | 2 | 5.2E-2 |
GO: Gene ontology; BP: Biological process; CC: Component content; MF: Molecular function.
For overlapping low expression genes, they were enriched in BP of endoderm formation, positive regulation of angiogenesis, and positive regulation of exocytosis. MF enrichment indicated transcriptional repressor activity, RNA polymerase II core promoter proximal region sequence-specific binding, and low-density lipoprotein particle binding. Furthermore, the enriched CC included the external side of the plasma membrane and the fibrinogen complex.
KEGG pathway analysis (Table 2) of the highly expressed genes enriched in lysosome-related pathways, Epstein-Barr virus infection, and Fc gamma R-mediated phagocytosis, while low expression genes enriched in the TGF-beta signaling pathway.
3.3PPI network establishment and analysis
The PPI network of overlapping DEGs in both NASH and HCC was established in the STRING database and visualized by Cytoscape software (Fig. 2A). In addition, the key gene modules were identified from the PPI network in Cytoscape by using the MCODE plugin (Fig. 2B). There were 16 hub genes:
• cyclin-dependent kinase 1 (CDK1), heat shock protein 90 alpha family class A member 1 (HSP90AA1), euchromatic histone lysine methyltransferase 2 (EHMT2), mitotic arrest deficient 2 like 1 (MAD2L1), collagen type 1 alpha 1 chain (COL1A1), n-acetylneuraminate pyruvate lyase (NPL), protein kinase C delta (PRKCD/PAK1), ras homolog family member C (RHOC), collagen type 1 alpha 2 chain (COL1A2), integrin subunit beta 3 binding protein (ITGB3BP), kinetochore scaffold 1 (KNL1/CASC5), centrosomal protein 192 (CEP192), tubulin gamma complex associated protein 6 (TUBGCP6), ras homolog family member B (RHOB) and MCL1 apoptosis regulator (MCL1).
Table 2
Pathway enrichment analysis of DEGs both in non-alcoholic steatohepatitis and hepatocellular carcinoma
| Pathway ID | Term | Count | |
|---|---|---|---|
| High expression | |||
| hsa04142 | Lysosome | 6 | 7.4E-3 |
| hsa05169 | Epstein-Barr virus infection | 6 | 4.3E-2 |
| hsa04666 | Fc gamma R-mediated phagocytosis | 4 | 5.3E-2 |
| hsa05203 | Viral carcinogenesis | 6 | 5.6E-2 |
| hsa04914 | Progesterone-mediated oocyte maturation | 4 | 5.8E-2 |
| Low expression | |||
| hsa04350 | TGF-beta signaling pathway | 3 | 6.4E-2 |
3.4Survival analysis
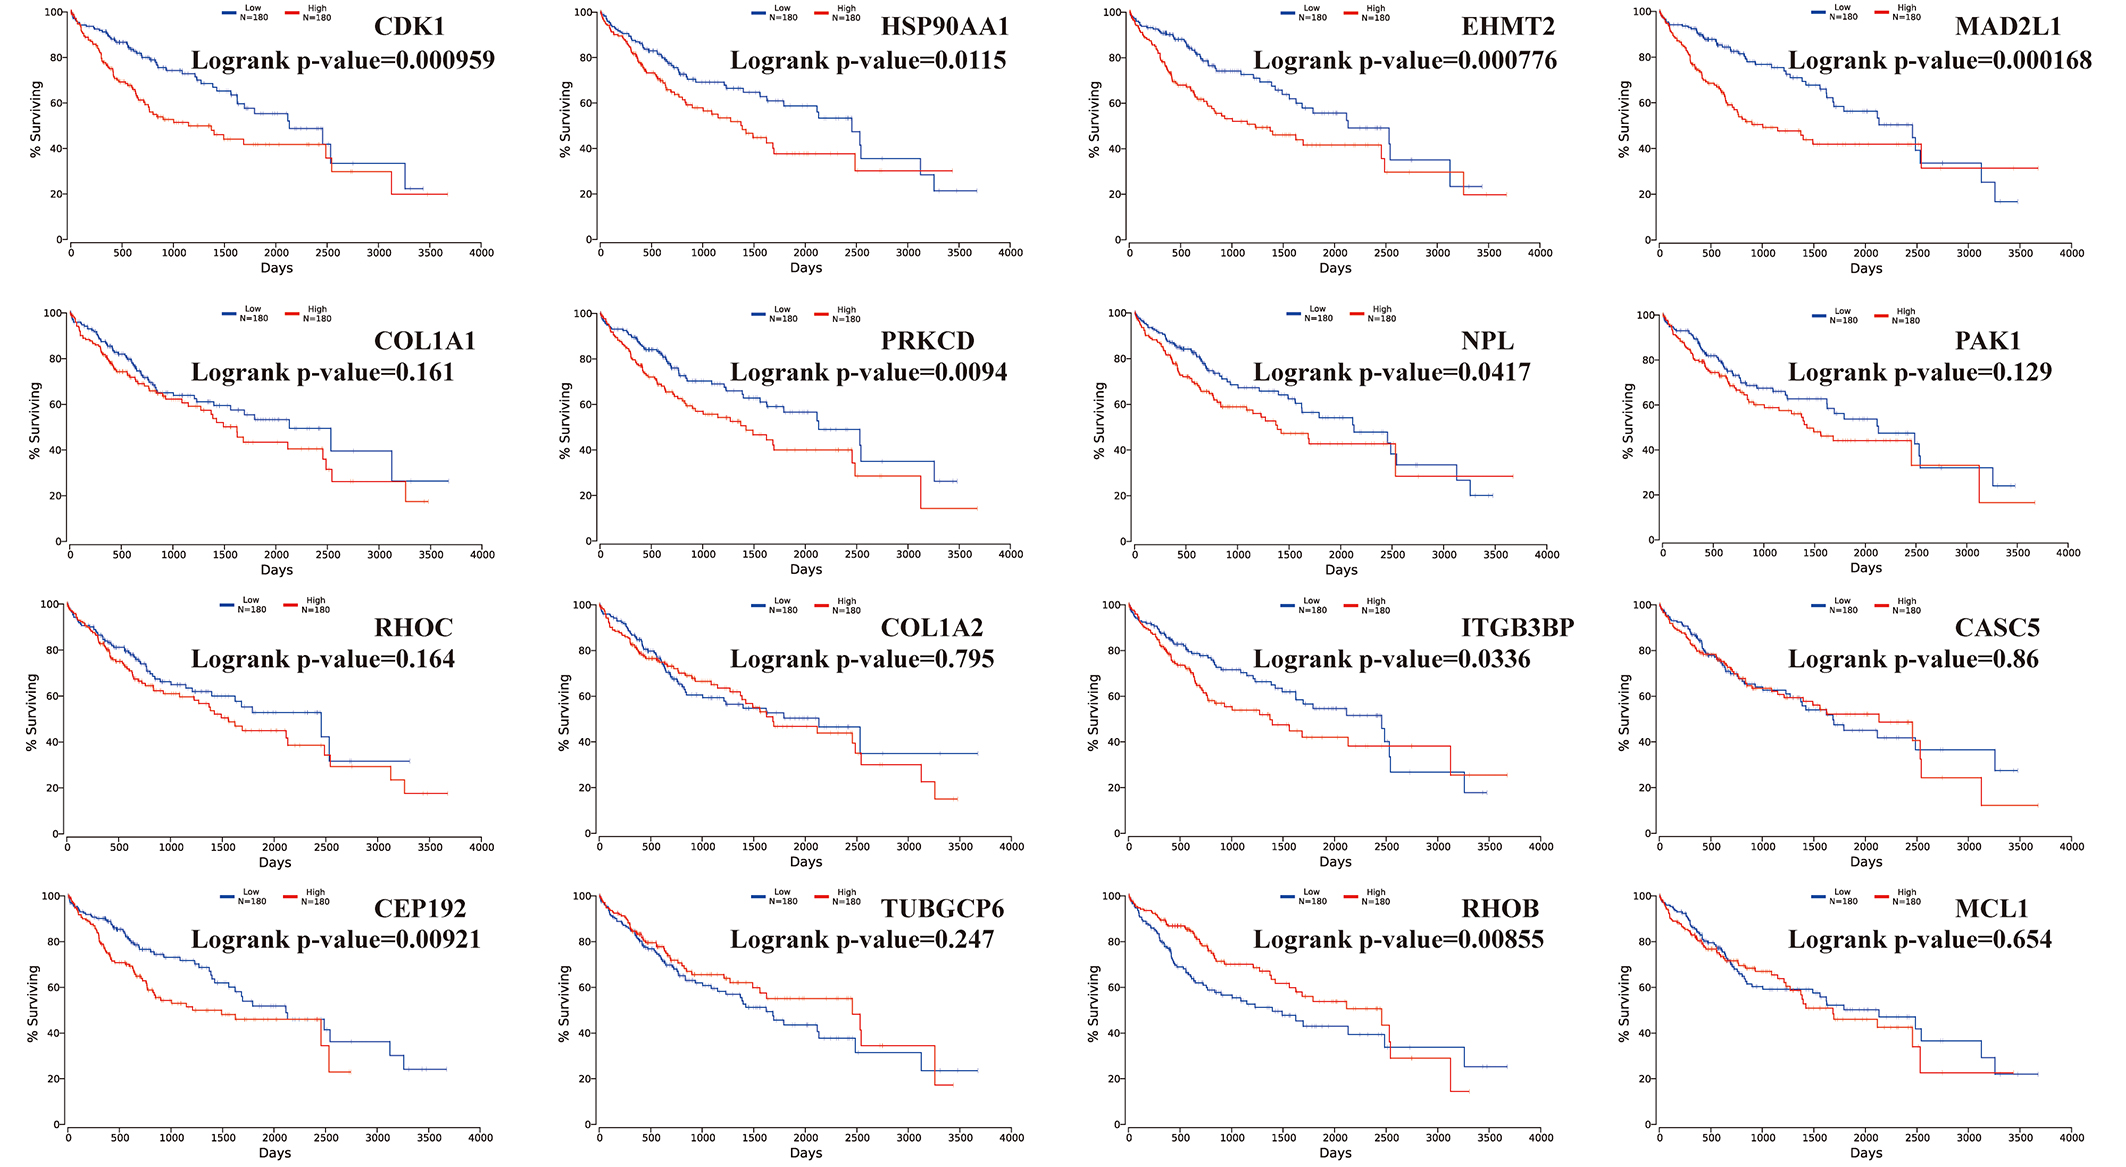
To obtain the prognostic values of 16 hub genes, we drew the Kaplan-Meier plots with P-values by OncoLnc and presented in Fig. 3. Among the 360 HCC patients included in the TCGA database, we divided them into high expression and low expression according to the gene expression. And higher mRNA expression of CDK1 (
Figure 3.
Overall survivals of significant hub genes selected from aberrantly methylated-DEGs. Hub genes included CDK1, HSP90AA1, EHMT2, MAD2L1, COL1A1, PRKCD, NPL, PAK1, RHOC, COL1A2, ITGB3BP, CASC5, CEP192, TUBGCP6, RHOB and MCL1.
3.5Gene expression of the hub genes from the TCGA database
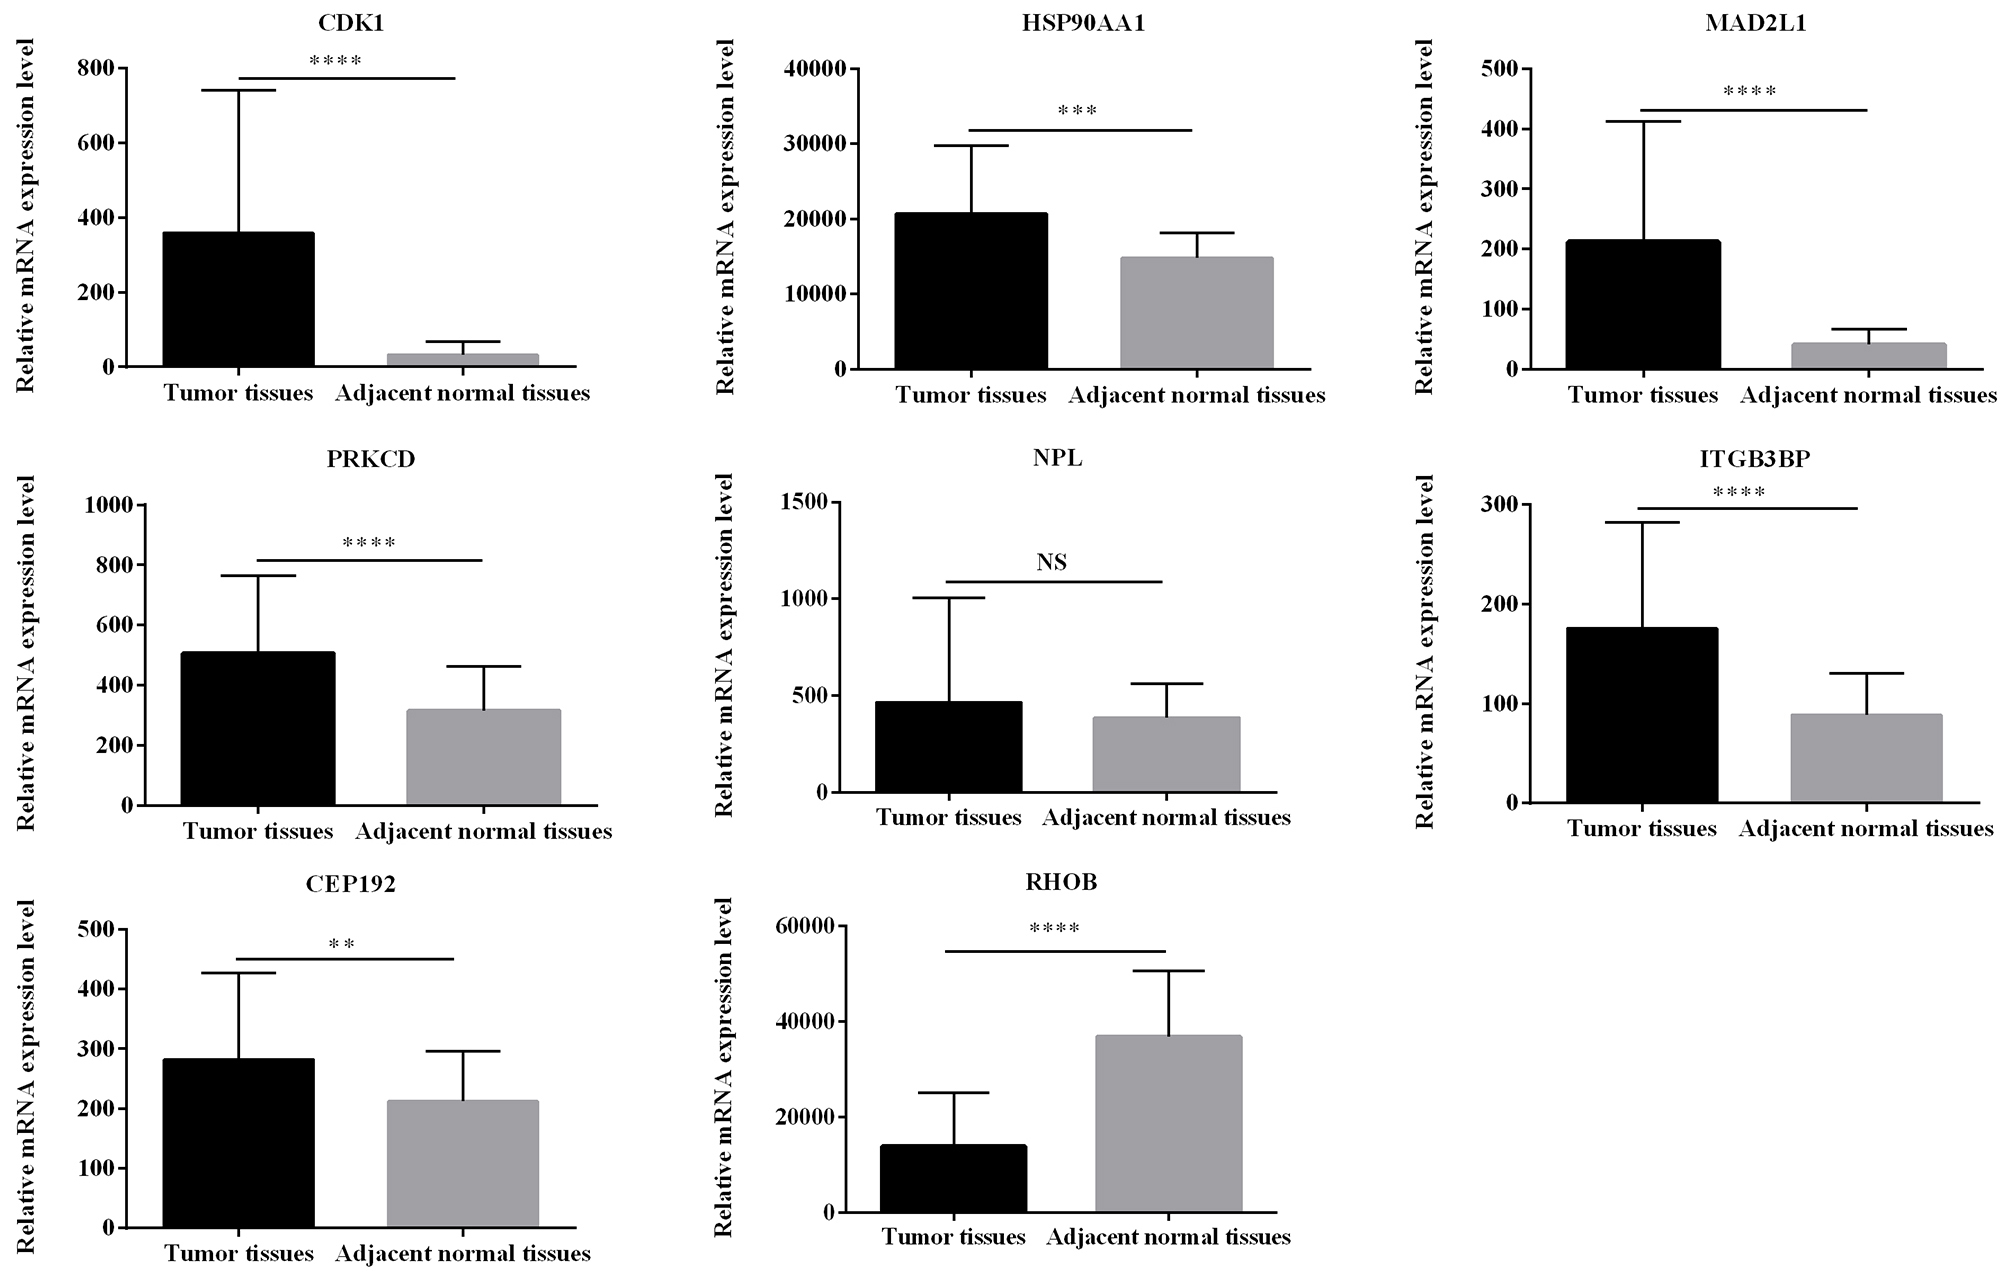
The expression of Eight hub genes that affect the survival of HCC patients was verified using paired fifty HCC samples and fifty HCC adjacent non-tumor tissues from the TCGA database (Fig. 4). And the expression of CDK1, HSP90AA1, MAD2L1, PRKCD, ITGB3BP, CEP192 were significantly higher in HCC samples than non-tumor tissues, while HCC samples expressed lower levels of RHOB than non-tumor tissues. Among them, integrin subunit beta 3 binding protein (ITGB3BP) and centrosomal protein 192 (CEP192) have not yet been described in NAFLD and HCC. Therefore, we further verified the gene expression of ITGB3BP and CEP192 in vitro.
Figure 4.
Gene expression statuses of 8 hub genes were validated in TCGA database. The results are expressed as the mean
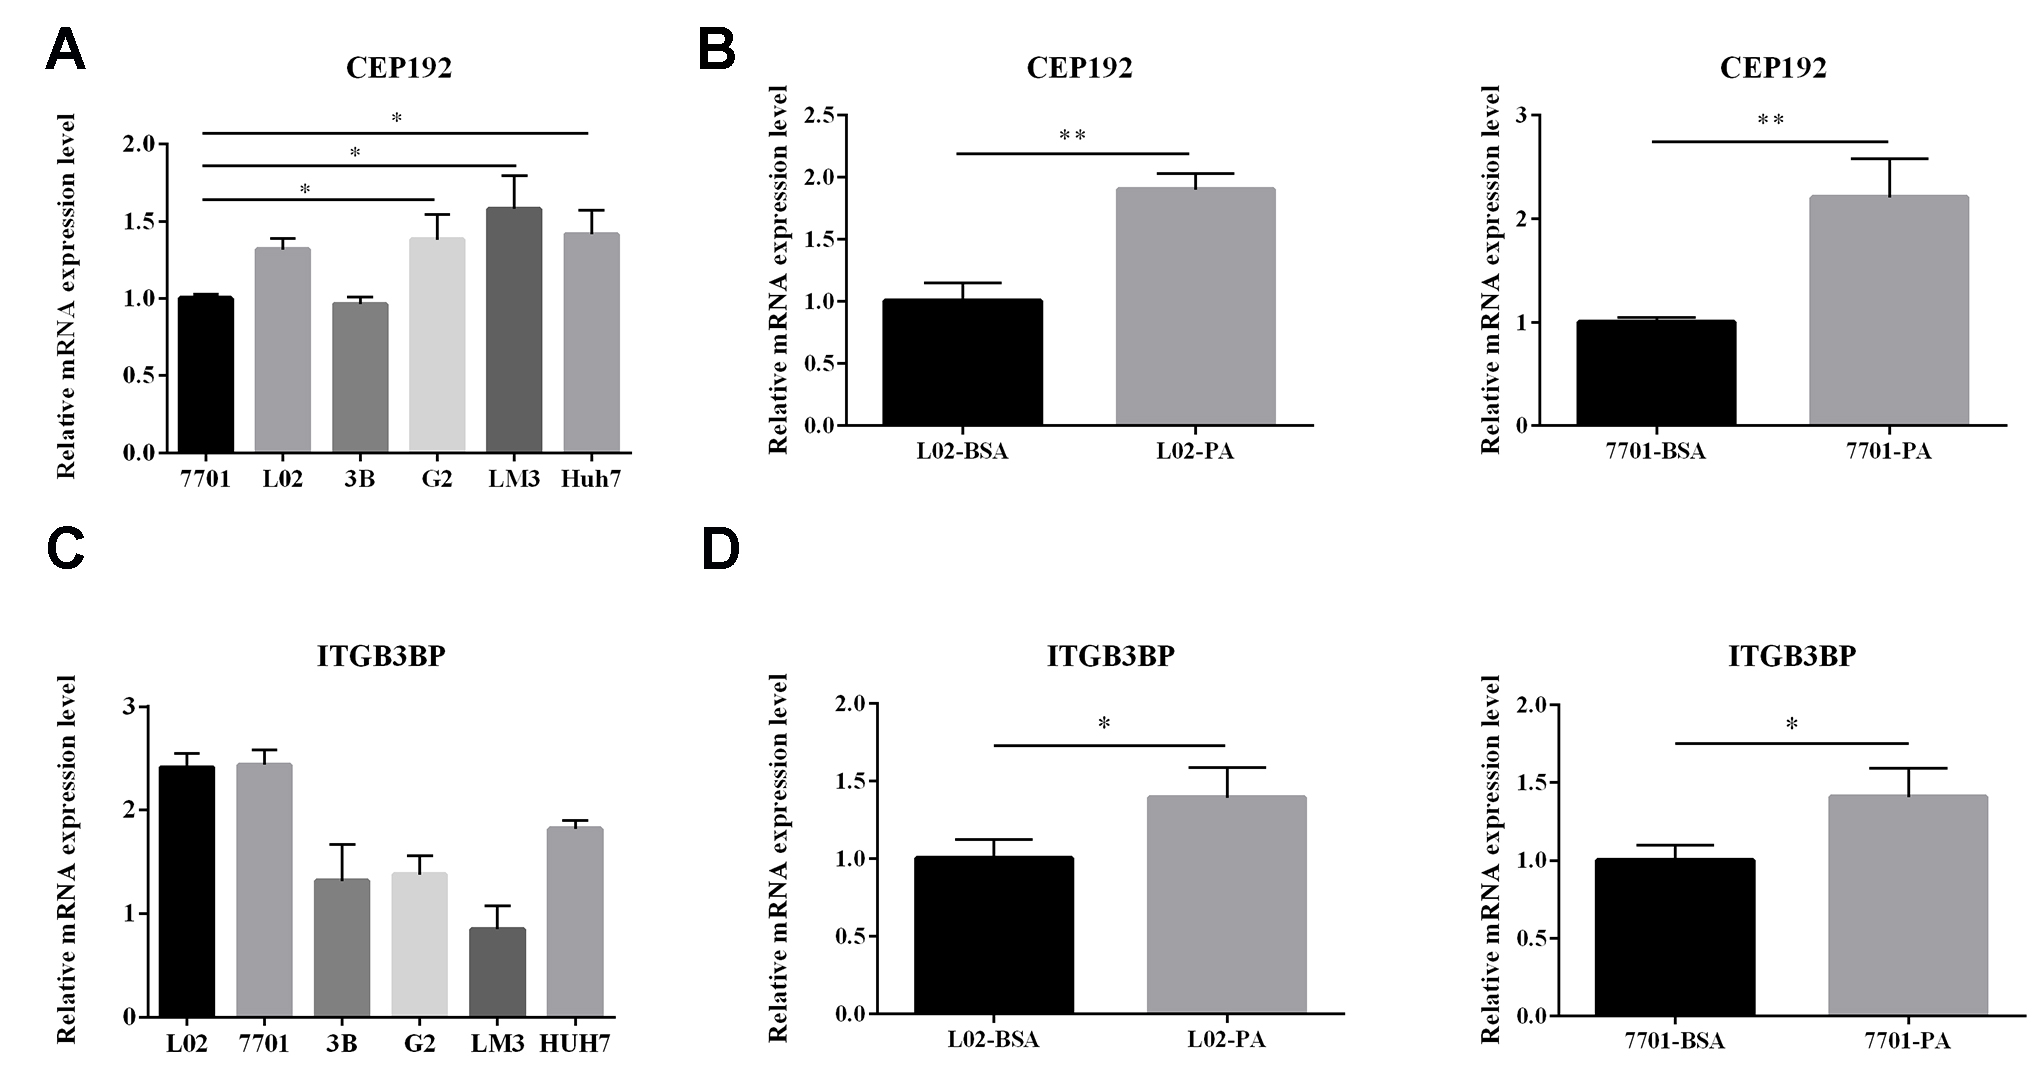
3.6Expression of ITGB3BP and CEP192 verified by qRT-PCR
To compare the expression of ITGB3BP and CEP192 in HCC cell lines with normal hepatic cell lines, we performed qRT-PCR in LM3, Hep3B, Huh7, HepG2, L-02, and QSG-7701 cells. Subsequently, L02 and 7701 cells were treated with PA to model steatotic hepatic cells and harvested for quantification. The results revealed that CEP192 was higher expressed in HCC cells than normal hepatic cells and in PA-treated cells than BSA-treated cells, while ITGB3BP showed results that were inconsistent with the bioinformatics analysis (Fig. 5).
4.Discussion
Despite recent advances in both prevention and treatment, HCC remains the leading cause of tumor mortality in the world [2]. Therefore, exploring the mechanism and biomarkers by which NAFLD progresses to HCC are important for diagnosis, treatment, and prognosis evaluation. In recent years, the introduction and rapid development of microarray technology enabled researchers to identify changes in genetics and epigenetics of NAFLD and HCC.
Figure 5.
Gene expression status of CEP192 and ITGB3BP were validated by qRT-PCR. (A, C) The expression of CEP192 and ITGB3BP in 4 human HCC cells (HepG2, Hep3B, Huh7 and LM3) and 2 normal human hepatic cells (QSG-7701 and L-02); (B, D) The expression of CEP192 and ITGB3BP in PA-treated cells (QSG-7701 and L-02) and normal controls. The results are expressed as the mean
In this research, we obtained 176 upregulated genes and 80 downregulated genes from a NAFLD cDNA microarray (GSE24807) and an HCC cDNA microarray (GSE62232). Subsequent pathways and functional enrichment analyses were conducted in DAVID, which revealed highly expressed genes were associated with BP of mitotic nuclear division, cell division, and G2/M transition of the mitotic cell cycle. Previous studies have shown that cell-cycle dysfunction and chromosomal abnormalities played an essential role in the pathogenesis of cancer [22, 23, 24]. In addition, CC of highly expressed genes mainly enriched in extracellular exosomes. Exosomes are small (30–100 nm diameters) nanoparticles that are generated by the intraluminal budding events on endosomal membranes of the multivesicular bodies (MVBs). Exosomes not only is an important regulator of cellular homeostasis but may also play a vital role in the pathogenesis of the various disease [25]. NASH is the progressive form of NAFLD, characterized by lipids excess accumulation in the liver with hepatocyte death, dysfunction, and macrophage-associated inflammation. Specifically, studies have demonstrated that hepatocytes increase the release of exosomes in response to lipotoxic fatty acids, then stellate cells internalized the exosomes which leads to the activation [26]. And clinical research revealed that natural killer T cells and macrophages in patients with NAFLD significantly increased the release of exosomes [27]. Circulating exosomes also participate in the innate immune response to steatosis, which indicates its role in aggravating tissue damage. In addition, a series of studies have shown that exosomes play a role in the development of liver cancer [28, 29, 30]. Above all, we may conclude that exosomes play a crucial role in NAFLD progression to HCC.
For overlapping low expression genes, GO functional enrichment indicated term of the biological processes of endoderm formation, positive regulation of angiogenesis, and positive regulation of exocytosis, and positive regulation of the transforming growth factor-beta (TGF
The PPI network of overlapping genes displayed functional interactions and enabled the selection of hub genes. Survival analysis of these genes and validation of their gene expression in the TCGA database between HCC samples and normal samples demonstrated that CDK1, HSP90AA1, MAD2L1, PRKCD, ITGB3BP, CEP192, and RHOB were still significantly differentially expressed. A clear link between oxidative stress and pathological polyploidization during NAFLD was found, which resulted from the inactivation of the cyclin B1/CDK1 complex [34]. During HCC progression, upregulation of the chromodomain helicase/ATPase DNA binding protein 1–like gene (CHD1L) decreases CDK1 activity, subsequently accelerating mitotic exit [35]. Additionally, studies have shown that high expression of HSP90AA1 is also related to the occurrence and development of HCC and poor prognosis [36]. And it was concluded that the loss of Mad2l1 in adult tissues can be strongly oncogenic, especially for HCC development [37]. PRKCD was found to be suppressed in HCC cells, and decreased cell viability is mediated by PRKCD activation [38]. Additionally, the RHOB-VEGFA-VEGFR2 angiogenesis pathway was identified as activated and significantly correlated with poor prognosis in HCC [39]. A study revealed that higher ITGB3BP expression was associated with lower survival rates in patients with metastasis-free breast cancer [40]. CEP192 is a centrosomal protein that lies at the top of the hierarchy of protein recruitment during both centriole duplication and centrosome maturation [41]. In the present research, we validated the higher expression of CEP192 in HCC cell lines than normal hepatic cell lines and in PA-treated cells than normal controls by qRT-PCR. Hereby, we made two hypotheses. First, CEP192 was a pathogenic factor both in NAFLD and in HCC development. Second, the gene expression of CEP192 was upregulated in patients with NAFLD, which acted as a carcinogenic factor and resulted in the occurrence of HCC. Most importantly, CEP192 might serve as a biomarker for HCC and a therapeutic target to prevent NAFLD patients from progressing to HCC.
Despite all these results, this study still has some limitations. First, verification experiments were not performed in liver tissue samples, including patients with NAFLD and HCC. Second, we did not obtain the results of further mechanistic studies. Therefore, more rigorous experiments are required to verify the above results.
In conclusion, this research aimed to screen for new pathogenic genes and related pathways both in NAFLD and HCC and to explore the pathogenesis of progression from NAFLD to HCC. Seven hub genes were obtained, of which CEP192 is considered to be involved in the development of NAFLD and HCC simultaneously. Therefore, CEP192 may be a potentially useful biomarker for the prediction and treatment of HCC in patients with NAFLD.
Acknowledgments
This work was supported by the National Natural Science Foundation of China [grant number No. 81700485].
Conflict of interest
The authors have declared that no competing interests exist.
Abbreviations
| HCC: | hepatocellular carcinoma; |
|---|---|
| NAFLD: | non-alcoholic fatty liver disease; |
| NASH: | non-alcoholic steatohepatitis; |
| HBV: | hepatitis B virus; |
| HCV: | hepatitis C virus; |
| DEGs: | differentially expressed genes; |
| GEO: | gene expression omnibus; |
| DAVID: | database for annotation, visualization and integrated discovery; |
| GO: | gene ontology; |
| BP: | biological processes; |
| MF: | molecular functions; |
| CC: | cell components; |
| KEGG: | Kyoto encyclopedia of genes and genomes; |
|---|---|
| TGF | transforming growthfactor-beta; |
| PPI: | protein-protein interaction; |
| STRING: | search tool for the retrieval of interacting genes; |
| MCODE: | molecular complex detection; |
| TCGA: | the cancer genome atlas; |
| qRT-PCR: | quantitative real-time PCR; |
| CDK1: | cyclin-dependent kinase 1; |
| HSP90AA1: | heat shock protein 90 alpha family class A member 1; |
| EHMT2: | euchromatic histone lysine methyltransferase 2; |
| MAD2L1: | mitotic arrest deficient 2 like 1; |
| COL1A1: | collagen type 1 alpha 1 chain; |
| NPL: | n-acetylneuraminate pyruvate lyase; |
|---|---|
| PRKCD/PAK1: | protein kinase C delta; |
| RHOC: | ras homolog family member C; |
| COL1A2: | collagen type 1 alpha 2 chain; |
| ITGB3BP: | integrin subunit beta 3 binding protein; |
| KNL1/CASC5: | kinetochore scaffold 1; |
| CEP192: | centrosomal protein 192; |
| TUBGCP6: | tubulin gamma complex associated protein 6; |
| RHOB: | ras homolog family member B; |
| MCL1: | MCL1 apoptosis regulator |
References
[1] | E. Berger, N. Vega, H. Vidal and A. Geloen, Gene network analysis leads to functional validation of pathways linked to cancer cell growth and survival, Biotechnology Journal 7: ((2012) ), 1395–1404. |
[2] | H.B. El-Serag and K.L. Rudolph, Hepatocellular carcinoma: epidemiology and molecular carcinogenesis, Gastroenterology 132: ((2007) ), 2557–2576. |
[3] | G. Vernon, A. Baranova and Z.M. Younossi, Systematic review: the epidemiology and natural history of non-alcoholic fatty liver disease and non-alcoholic steatohepatitis in adults, Aliment Pharmacol Ther 34: ((2011) ), 274–285. |
[4] | M.R. Charlton, J.M. Burns, R.A. Pedersen, K.D. Watt, J.K. Heimbach and R.A. Dierkhising, Frequency and outcomes of liver transplantation for nonalcoholic steatohepatitis in the United States, Gastroenterology 141: ((2011) ), 1249–1253. |
[5] | E.M. Brunt, D.E. Kleiner, L.A. Wilson, P. Belt and B.A. Neuschwander-Tetri, Nonalcoholic fatty liver disease (NAFLD) activity score and the histopathologic diagnosis in NAFLD: distinct clinicopathologic meanings, Hepatology 53: ((2011) ), 810–820. |
[6] | N. Iizuka, M. Oka, H. Yamada-Okabe, M. Nishida, Y. Maeda, N. Mori, T. Takao, T. Tamesa, A. Tangoku, H. Tabuchi, K. Hamada, H. Nakayama, H. Ishitsuka, T. Miyamoto, A. Hirabayashi, S. Uchimura and Y. Hamamoto, Oligonucleotide microarray for prediction of early intrahepatic recurrence of hepatocellular carcinoma after curative resection, Lancet (London, England) 361: ((2003) ), 923–929. |
[7] | L. Li, Q. Lei, S. Zhang, L. Kong and B. Qin, Screening and identification of key biomarkers in hepatocellular carcinoma: Evidence from bioinformatic analysis, Oncol Rep 38: ((2017) ), 2607–2618. |
[8] | G. Hanin, N. Yayon, Y. Tzur, R. Haviv, E.R. Bennett, S. Udi, Y.R. Krishnamoorthy, E. Kotsiliti, R. Zangen, B. Efron, J. Tam, O. Pappo, E. Shteyer, E. Pikarsky, M. Heikenwalder, D.S. Greenberg and H. Soreq, miRNA-132 induces hepatic steatosis and hyperlipidaemia by synergistic multitarget suppression, Gut 67: ((2018) ), 1124–1134. |
[9] | C.A. Moylan, H. Pang, A. Dellinger, A. Suzuki, M.E. Garrett, C.D. Guy, S.K. Murphy, A.E. Ashley-Koch, S.S. Choi, G.A. Michelotti, D.D. Hampton, Y. Chen, H.L. Tillmann, M.A. Hauser, M.F. Abdelmalek and A.M. Diehl, Hepatic gene expression profiles differentiate presymptomatic patients with mild versus severe nonalcoholic fatty liver disease, Hepatology 59: ((2014) ), 471–482. |
[10] | S.K. Murphy, H. Yang, C.A. Moylan, H. Pang, A. Dellinger, M.F. Abdelmalek, M.E. Garrett, A. Ashley-Koch, A. Suzuki, H.L. Tillmann, M.A. Hauser and A.M. Diehl, Relationship between methylome and transcriptome in patients with nonalcoholic fatty liver disease, Gastroenterology 145: ((2013) ), 1076–1087. |
[11] | Y.L. Liu, G.L. Patman, J.B. Leathart, A.C. Piguet, A.D. Burt, J.F. Dufour, C.P. Day, A.K. Daly, H.L. Reeves and Q.M. Anstee, Carriage of the PNPLA3 rs738409 C > G polymorphism confers an increased risk of non-alcoholic fatty liver disease associated hepatocellular carcinoma, J Hepatol 61: ((2014) ), 75–81. |
[12] | Y.L. Liu, H.L. Reeves, A.D. Burt, D. Tiniakos, S. McPherson, J.B. Leathart, M.E. Allison, G.J. Alexander, A.C. Piguet, R. Anty, P. Donaldson, G.P. Aithal, S. Francque, L. Van Gaal, K. Clement, V. Ratziu, J.F. Dufour, C.P. Day, A.K. Daly and Q.M. Anstee, TM6SF2 rs58542926 influences hepatic fibrosis progression in patients with non-alcoholic fatty liver disease, Nature Communications 5: ((2014) ), 4309. |
[13] | W. Liu, S.S. Baker, R.D. Baker, N.J. Nowak, L. Zhu, Upregulation of hemoglobin expression by oxidative stress in hepatocytes and its implication in nonalcoholic steatohepatitis, PLoS One 6: ((2011) ), e24363. |
[14] | K. Schulze, S. Imbeaud, E. Letouze, L.B. Alexandrov, J. Calderaro, S. Rebouissou, G. Couchy, C. Meiller, J. Shinde, F. Soysouvanh, A.L. Calatayud, R. Pinyol, L. Pelletier, C. Balabaud, A. Laurent, J.F. Blanc, V. Mazzaferro, F. Calvo, A. Villanueva, J.C. Nault, P. Bioulac-Sage, M.R. Stratton, J.M. Llovet and J. Zucman-Rossi, Exome sequencing of hepatocellular carcinomas identifies new mutational signatures and potential therapeutic targets, Nat Genet 47: ((2015) ), 505–511. |
[15] | T. Barrett, S.E. Wilhite, P. Ledoux, C. Evangelista, I.F. Kim, M. Tomashevsky, K.A. Marshall, K.H. Phillippy, P.M. Sherman, M. Holko, A. Yefanov, H. Lee, N. Zhang, C.L. Robertson, N. Serova, S. Davis and A. Soboleva, NCBI GEO: archive for functional genomics data sets-update, Nucleic Acids Research 41: ((2013) ), D991–995. |
[16] | M. Pathan, S. Keerthikumar, C.S. Ang, L. Gangoda, C.Y. Quek, N.A. Williamson, D. Mouradov, O.M. Sieber, R.J. Simpson, A. Salim, A. Bacic, A.F. Hill, D.A. Stroud, M.T. Ryan, J.I. Agbinya, J.M. Mariadason, A.W. Burgess and S. Mathivanan, FunRich: An open access standalone functional enrichment and interaction network analysis tool, Proteomics 15: ((2015) ), 2597–2601. |
[17] | W. Huang da, B.T. Sherman and R.A. Lempicki, Systematic and integrative analysis of large gene lists using DAVID bioinformatics resources, Nat Protoc 4: ((2009) ), 44–57. |
[18] | J. Du, Z. Yuan, Z. Ma, J. Song, X. Xie and Y. Chen, KEGG-PATH: Kyoto encyclopedia of genes and genomes-based pathway analysis using a path analysis model, Mol BioSyst 10: ((2014) ), 2441–2447. |
[19] | P. Shannon, A. Markiel, O. Ozier, N.S. Baliga, J.T. Wang, D. Ramage, N. Amin, B. Schwikowski and T. Ideker, Cytoscape: a software environment for integrated models of biomolecular interaction networks, Genome Research 13: ((2003) ), 2498–2504. |
[20] | M. Li, X. Wu, Y. Pan and J. Wang, hF-measure: A new measurement for evaluating clusters in protein-protein interaction networks, Proteomics 13: ((2013) ), 291–300. |
[21] | J. Anaya, OncoLnc: linking TCGA survival data to mRNAs, miRNAs, and lncRNAs, PeerJ Computer Science 2: ((2016) ), e67. |
[22] | F.P. Marchese, E. Grossi, O. Marin-Bejar, S.K. Bharti, I. Raimondi, J. Gonzalez, D.J. Martinez-Herrera, A. Athie, A. Amadoz, R.M. Brosh, Jr. and M. Huarte, A long noncoding RNA regulates sister chromatid cohesion, Molecular Cell 63: ((2016) ), 397–407. |
[23] | P. Hydbring, Y. Wang, A. Fassl, X. Li, V. Matia, T. Otto, Y.J. Choi, K.E. Sweeney, J.M. Suski, H. Yin, R.L. Bogorad, S. Goel, H. Yuzugullu, K.J. Kauffman, J. Yang, C. Jin, Y. Li, D. Floris, R. Swanson, K. Ng, E. Sicinska, L. Anders, J.J. Zhao, K. Polyak, D.G. Anderson, C. Li and P. Sicinski, Cell-cycle-targeting micrornas as therapeutic tools against refractory cancers, Cancer Cell 31: ((2017) ), 576–590, e578. |
[24] | J. de Lange, A. Faramarz, A.B. Oostra, R.X. de Menezes, I.H. van der Meulen, M.A. Rooimans, D.A. Rockx, R.H. Brakenhoff, V.W. van Beusechem, R.W. King, J.P. de Winter and R.M. Wolthuis, Defective sister chromatid cohesion is synthetically lethal with impaired APC/C function, Nature Communications 6: ((2015) ), 8399. |
[25] | P.B. Devhare and R.B. Ray, Extracellular vesicles: Novel mediator for cell to cell communications in liver pathogenesis, Mol Aspects Med 60: ((2018) ), 115–122. |
[26] | L.A. Ban, N.A. Shackel and S.V. McLennan, Extracellular vesicles: A New frontier in biomarker discovery for non-alcoholic fatty liver disease, International Journal of Molecular Sciences 17: ((2016) ), 376. |
[27] | M. Kornek, M. Lynch, S.H. Mehta, M. Lai, M. Exley, N.H. Afdhal and D. Schuppan, Circulating microparticles as disease-specific biomarkers of severity of inflammation in patients with hepatitis C or nonalcoholic steatohepatitis, Gastroenterology 143: ((2012) ), 448–458. |
[28] | T. Kogure, W.L. Lin, I.K. Yan, C. Braconi and T. Patel, Intercellular nanovesicle-mediated microRNA transfer: a mechanism of environmental modulation of hepatocellular cancer cell growth, Hepatology 54: ((2011) ), 1237–1248. |
[29] | J.X. Wei, L.H. Lv, Y.L. Wan, Y. Cao, G.L. Li, H.M. Lin, R. Zhou, C.Z. Shang, J. Cao, H. He, Q.F. Han, P.Q. Liu, G. Zhou and J. Min, Vps4A functions as a tumor suppressor by regulating the secretion and uptake of exosomal microRNAs in human hepatoma cells, Hepatology 61: ((2015) ), 1284–1294. |
[30] | M. He, H. Qin, T.C. Poon, S.C. Sze, X. Ding, N.N. Co, S.M. Ngai, T.F. Chan and N. Wong, Hepatocellular carcinoma-derived exosomes promote motility of immortalized hepatocyte through transfer of oncogenic proteins and RNAs, Carcinogenesis 36: ((2015) ), 1008–1018. |
[31] | A. Sharabi, M.G. Tsokos, Y. Ding, T.R. Malek, D. Klatzmann and G.C. Tsokos, Regulatory T cells in the treatment of disease, Nature reviews, Drug Discovery ((2018) ). |
[32] | Y. Zhang, D. Zheng, T. Zhou, H. Song, M. Hulsurkar, N. Su, Y. Liu, Z. Wang, L. Shao, M. Ittmann, M. Gleave, H. Han, F. Xu, W. Liao, H. Wang and W. Li, Androgen deprivation promotes neuroendocrine differentiation and angiogenesis through CREB-EZH2-TSP1 pathway in prostate cancers, Nature Communications 9: ((2018) ), 4080. |
[33] | X. Lu, E.J. Jin, X. Cheng, S. Feng, X. Shang, P. Deng, S. Jiang, Q. Chang, S. Rahmy, S. Chaudhary, X. Lu, R. Zhao, Y.A. Wang and R.A. DePinho, Opposing roles of TGFbeta and BMP signaling in prostate cancer development, Genes & Development 31: ((2017) ), 2337–2342. |
[34] | G. Gentric, V. Maillet, V. Paradis, D. Couton, A. L’Hermitte, G. Panasyuk, B. Fromenty, S. Celton-Morizur and C. Desdouets, Oxidative stress promotes pathologic polyploidization in nonalcoholic fatty liver disease, The Journal of Clinical Investigation 125: ((2015) ), 981–992. |
[35] | T.H. Chan, L. Chen, M. Liu, L. Hu, B.J. Zheng, V.K. Poon, P. Huang, Y.F. Yuan, J.D. Huang, J. Yang, G.S. Tsao and X.Y. Guan, Translationally controlled tumor protein induces mitotic defects and chromosome missegregation in hepatocellular carcinoma development, Hepatology 55: ((2012) ), 491–505. |
[36] | C. Ye, R. Tao, Q. Cao, D. Zhu, Y. Wang, J. Wang, J. Lu, E. Chen and L. Li, Whole-genome DNA methylation and hydroxymethylation profiling for HBV-related hepatocellular carcinoma, International Journal of Oncology 49: ((2016) ), 589–602. |
[37] | F. Foijer, L.A. Albacker, B. Bakker, D.C. Spierings, Y. Yue, S.Z. Xie, S. Davis, A. Lutum-Jehle, D. Takemoto, B. Hare, B. Furey, R.T. Bronson, P.M. Lansdorp, A. Bradley and P.K. Sorger, Deletion of the MAD2L1 spindle assembly checkpoint gene is tolerated in mouse models of acute T-cell lymphoma and hepatocellular carcinoma, Elife 6: ((2017) ). |
[38] | S.B. Nambotin, L. Lefrancois, X. Sainsily, P. Berthillon, M. Kim, J.R. Wands, M. Chevallier, P. Jalinot, J.Y. Scoazec, C. Trepo, F. Zoulim and P. Merle, Pharmacological inhibition of Frizzled-7 displays anti-tumor properties in hepatocellular carcinoma, J Hepatol 54: ((2011) ), 288–299. |
[39] | L. Jin, W.R. Liu, M.X. Tian, X.F. Jiang, H. Wang, P.Y. Zhou, Z.B. Ding, Y.F. Peng, Z. Dai, S.J. Qiu, J. Zhou, J. Fan and Y.H. Shi, CCL24 contributes to HCC malignancy via RhoB- VEGFA-VEGFR2 angiogenesis pathway and indicates poor prognosis, Oncotarget 8: ((2017) ), 5135–5148. |
[40] | W. van Roosmalen, S.E. Le Devedec, O. Golani, M. Smid, I. Pulyakhina, A.M. Timmermans, M.P. Look, D. Zi, C. Pont, M. de Graauw, S. Naffar-Abu-Amara, C. Kirsanova, G. Rustici, P.A. Hoen, J.W. Martens, J.A. Foekens, B. Geiger and B. van de Water, Tumor cell migration screen identifies SRPK1 as breast cancer metastasis determinant, The Journal of Clinical Investigation 125: ((2015) ), 1648–1664. |
[41] | V. Joukov, J.C. Walter and A. De Nicolo, The Cep192-organized aurora A-Plk1 cascade is essential for centrosome cycle and bipolar spindle assembly, Molecular Cell 55: ((2014) ), 578–591. |


