
EGFLAM correlates with cell proliferation, migration, invasion and poor prognosis in glioblastoma
Abstract
EGFLAM as a novel gene biomarker has been reported in some cancers but not glioblastoma (GBM) yet. To clarify the functional role of EGFLAM in GBM, we performed this study. Firstly, based on TCGA and Oncomine database, EGFLAM expression and clinical significance in GBM patients was analyzed. Furthermore, the biological effect of EGFLAM in GBM cells was determined by qRT-PCR, CCK-8 assay, colony formation assay, wound healing assay, transwell assays and western blot analysis. The databases analysis showed that EGFLAM expression was at higher levels in GBM patients with poor prognosis. The results indicated that EGFLAM silence inhibited the proliferation, migration and invasion of U87 cells, which was regulated through repression of PI3K/AKT pathway. Accordingly, the data from our work shed some light on EGFLAM might be a prognostic biomarker and therapeutic target for GBM.
1.Introduction
Glioblastoma, also known as glioblastoma multiforme (GBM), is the most aggressive and lethal brain tumor and constitutes about 50% of all gliomas [1, 2]. According to the latest Central Brain Tumor Registry of the United States (CBTRUS) statistical report, the relative survival rates of GBM patients were quite low and just five percent of patients survived five years post diagnosis [2]. Current standard of care for GBM consists of surgical resection, followed by chemotherapy and radiotherapy [3]. However, the diffuse infiltration behavior of glioma leads to the poor prognosis of the surgical resection [4]. Besides, GBM can develop resistance to the radiotherapy [5]. Though, chemotherapy, mainly temozolomide (TMZ) therapy, has improved the clinical outcome in a certain extent when compared to radiotherapy alone, but the median survival of GBM patients remains dismal at only 14–16 months [6]. Subsequently, target therapy as a new treatment of GBM has come to the forefront [7, 8]. Hence, there is an urgent need to seek the novel and effective biomarkers for target therapy to improve the survival and quality of life of GBM patients.
EGFLAM (EGF like, fibronectin type III and laminin G domains) gene is located at chromosomal region 5p13.2-p13.1 and is expressed in different organs and tissues such as brain, endocrine tissues and muscle tissues [9]. EGFLAM protein also known as Pikachurin is colocalized with both dystrophin and dystroglycan at the ribbon synapses, which plays critical roles in interactions between the photoreceptor ribbon synapse and bipolar dendrites [10, 11]. EGFLAM is reported to be involved in defective photoreceptor synaptic function associated with congenital muscular dystrophies such as muscle-eye-brain disease caused by defective glycosylation of
In this study, aberrant expression and clinical significance of EGFLAM in databases were assessed. Furthermore, the biological function of EGFLAMin vitro and underlying mechanism was investigated.
2.Materials and methods
2.1Data source and bioinformatics analysis
The dataset of gene was collected from The Cancer Genome Atlas (TCGA) (https://cancergenome.nih. gov/) database, which consists of 169 GBM tissues and 5 normal brain tissues. The corresponding dataset of clinical-pathological characteristics in GBM patients was also obtained from TCGA database.
Another dataset of gene was obtained from Oncomine database (https://www.oncomine.org/resource/ login.html), which contains 22 GBM tissues and 3 normal brain tissues. The data collection processes were in compliance with all laws and regulations.
2.2Cell lines and cell culture
HEB cell line was purchased from Sun Yat-Sen University (Guangzhou, Guangdong, China). U87, U251 cell lines were obtained from Shanghai Institutes for Biological Sciences (Shanghai, China) and HS683 cell line was purchased form American Type Culture Collection (ATCC, USA). All cells were cultured in RPMI-1640 medium contained 10% serum, 100 U/ml penicillin, and 0.1 mg/ml streptomycin and maintained at 37
2.3Quantitative real-time reverse transcription-PCR (qRT-PCR)
Total RNA was extracted using TRIZOL reagent (Invitrogen, Grand Island, NY, USA). RNA concentration and purity were measured by a Nanodrop spectrophotometer (ThermoFisher Scientific, Waltham, MA, USA). RNA was reverse-transcribed to cDNA using a Reverse Transcription Kit (Takara, Dalian, China) according to the manufacture’s protocol. qRT-PCR analyses were performed with SYBR Select Master Mix (Applied Biosystems, ThermoFisher Scientific, Waltham, MA, USA). The qRT-PCR data collection was carried out using a QuantStudioTM 6 Flex Real-Time PCR System. The samples were amplified as the following protocol: 95
2.4Transfection assay
U87 cells were first seeded in six-well plates for 24 h (1
2.5Colony formation assay
The transfected U87 cells were seeded onto six-well plates at a density of 200 cells per well. After incubated for 14 days, cells were fixed with 4% paraformaldehyde for 30 min and stained with 0.1% crystal violet for 30 min (Sigma, St. Louis, MO, USA). Then cells were counted and imaged by microscope (Olympus Corporation, Tokyo, Japan). The colony-forming efficiency was calculated as the following equation: colony formation rate
2.6Cell viability assay
The viability of the transfected U87 cells was performed using a Cell Counting Kit-8 (CCK-8, Sigma-Aldrich, Merck KGaA, Darmstadt, Germany) according to the manufacture’s protocol. Cells were seeded into 96-well plates and incubated for 24, 48, 72 and 96 hours. At the indicated intervals, 20
2.7Wound healing assay
The transfected U87 cells were trypsinized, centrifuged and seeded in six-well plates at a concentration of 5
2.8Cell migration and invasion assays
Cell migration and invasion assays were performed in uncoated or matrigel-coated Transwell chambers (8
2.9Western blot
The transfected U87 cells were lysed 30 min in RIPA buffer (KeyGEN, Nanjing, China) containing protease inhibitors. A BCA kit (KeyGEN, Nanjing, China) was used to quantify the protein concentration following the manufacture’s protocol. The proteins were heated at 95
2.10Statistical analysis
The data were presented as mean
Figure 1.
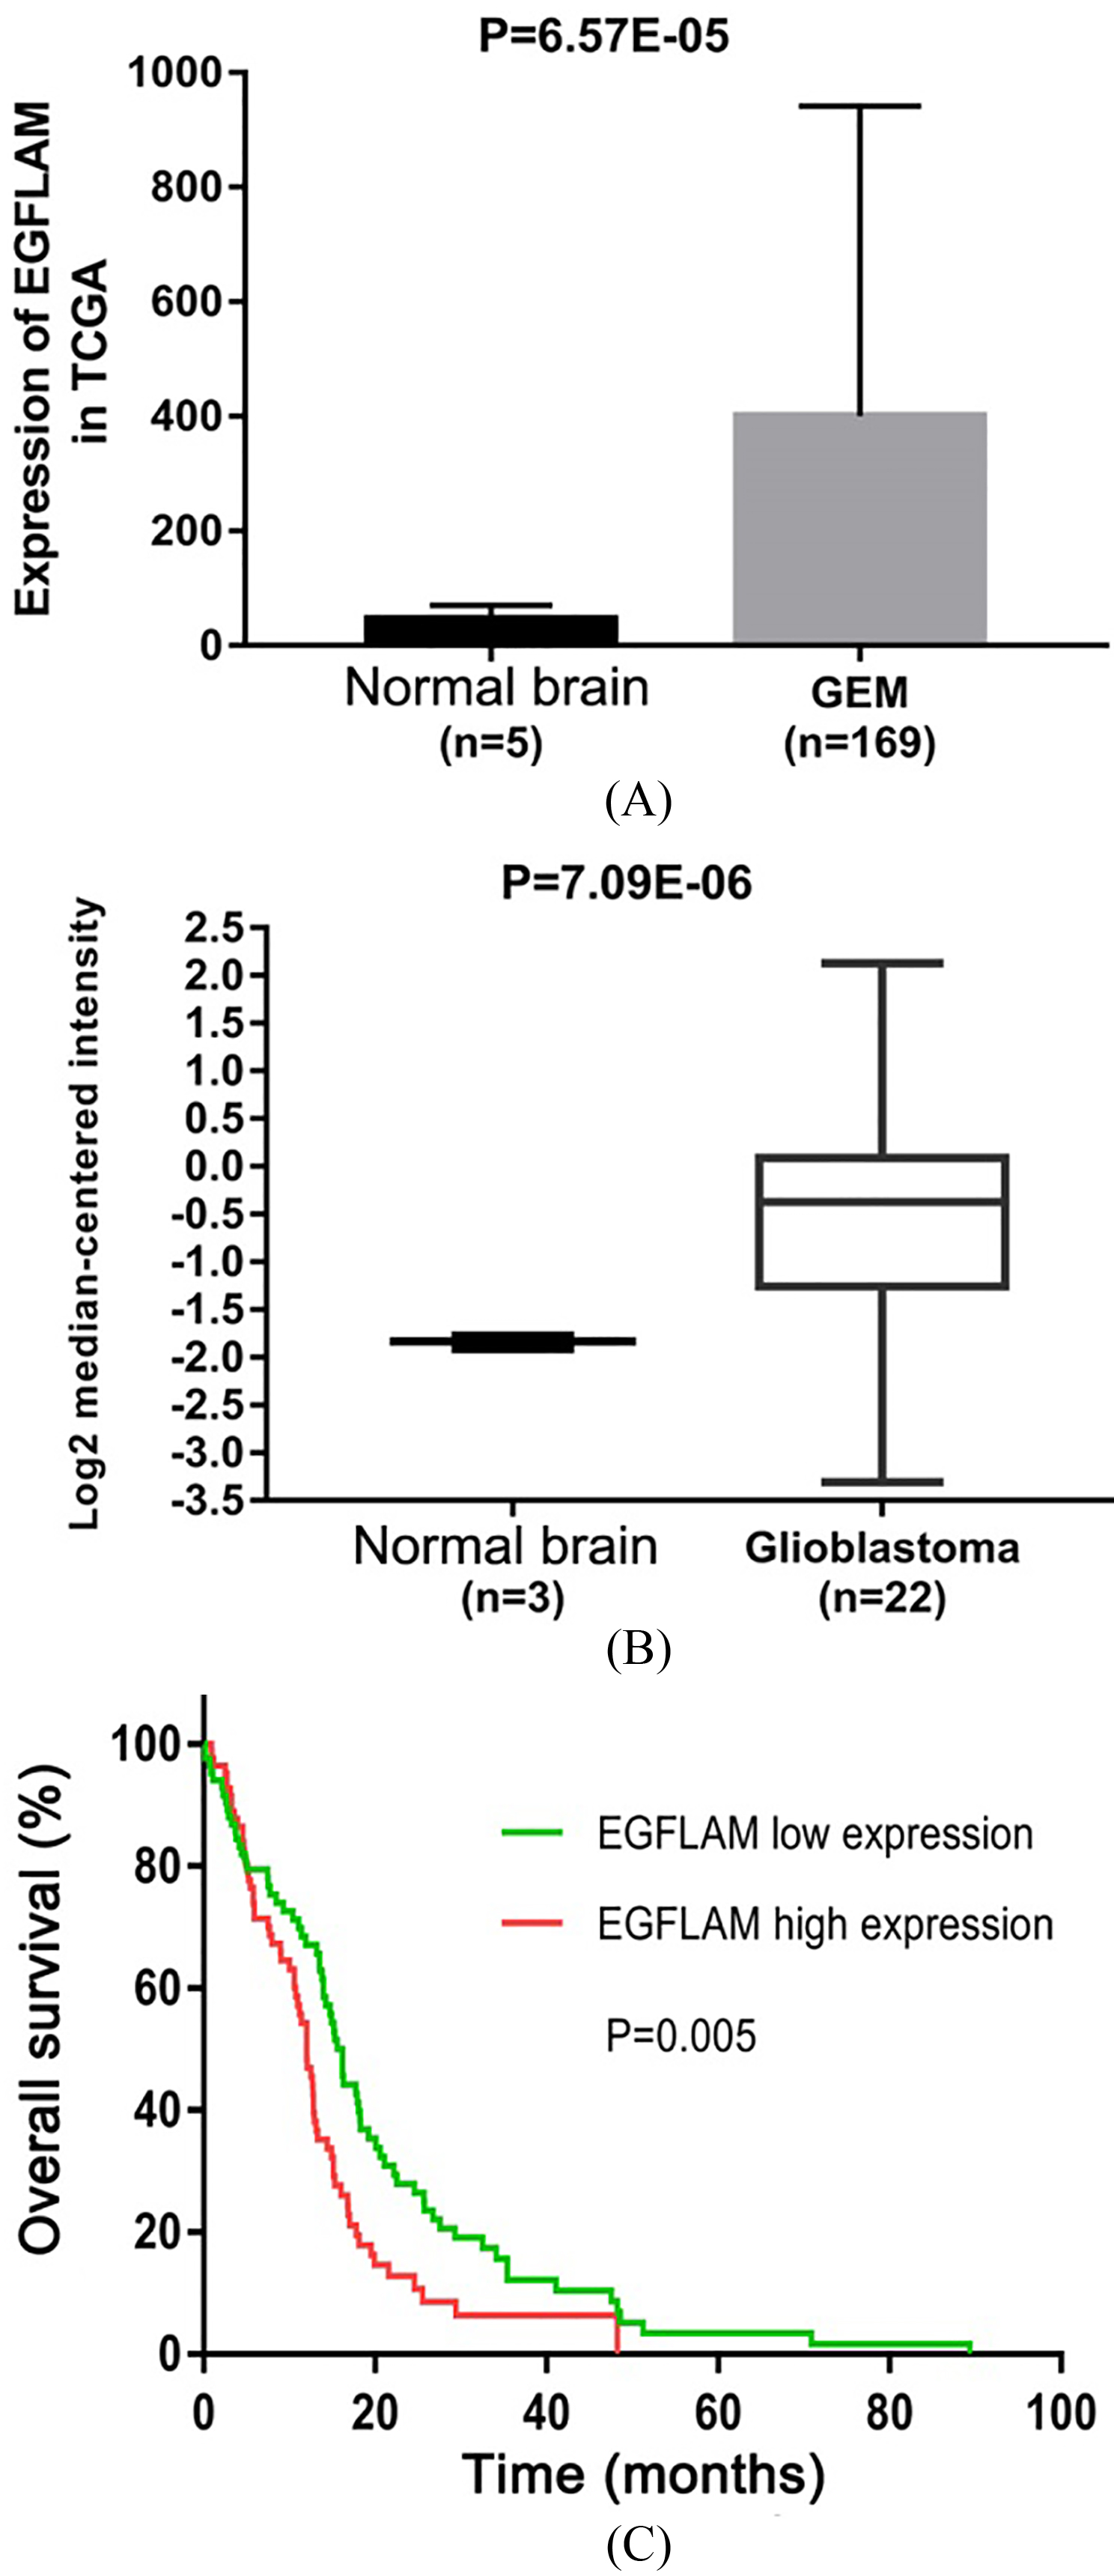
EGFLAM expression was up-regulated in Glioblastoma (GBM). (A) The Cancer Genome Atlas (TCGA) database was used to analyze the expression levels of EGFLAM in GBM tissues and normal brain tissues. (B) Oncomine database was used to further determine the expression levels of EGFLAM in GBM tissues and normal brain tissues. (C) Kaplan-Meier method and the long-rank test were used to analyze the overall survival of patients, and patients with high expression of EGFLAM presented the worse prognosis (
3.Results
3.1EGFLAM expression was up-regulated in GBM
To identify the effect of EGFLAM on GBM, we first evaluated the expression level of gene from TCGA dataset containing 169 GBM tissues and 5 normal brain tissues. As shown in Fig. 1A, EGFLAM expression was significantly up-regulated in GBM tissues compared with the normal brain tissues (
To further confirm this observation, we analyzed another dataset of gene from Oncomine database, which consists of 22 GBM tissues and 3 normal brain tissues. EGFLAM expression was at higher levels in GBM tissues compared with normal brain tissues (Fig. 1B,
To identify whether EGFLAM expression is associated with the GBM progression, the dataset of clinical-pathological characteristics in TCGA was used to analyze the relationship between EGFLAM expression and clinical-pathological characteristics in GBM patients by Chi-square test. The median expression level of EGFLAM was used as a cut-off value to divide the GBM patients into two groups: the GBM patients with EGFLAM expression higher than the cut-off value were assigned to the high expression group and the other patients were assigned to the low expression group. As shown in Table 1, the expression of EGFLAM was remarkably associated with subtype (
Figure 2.
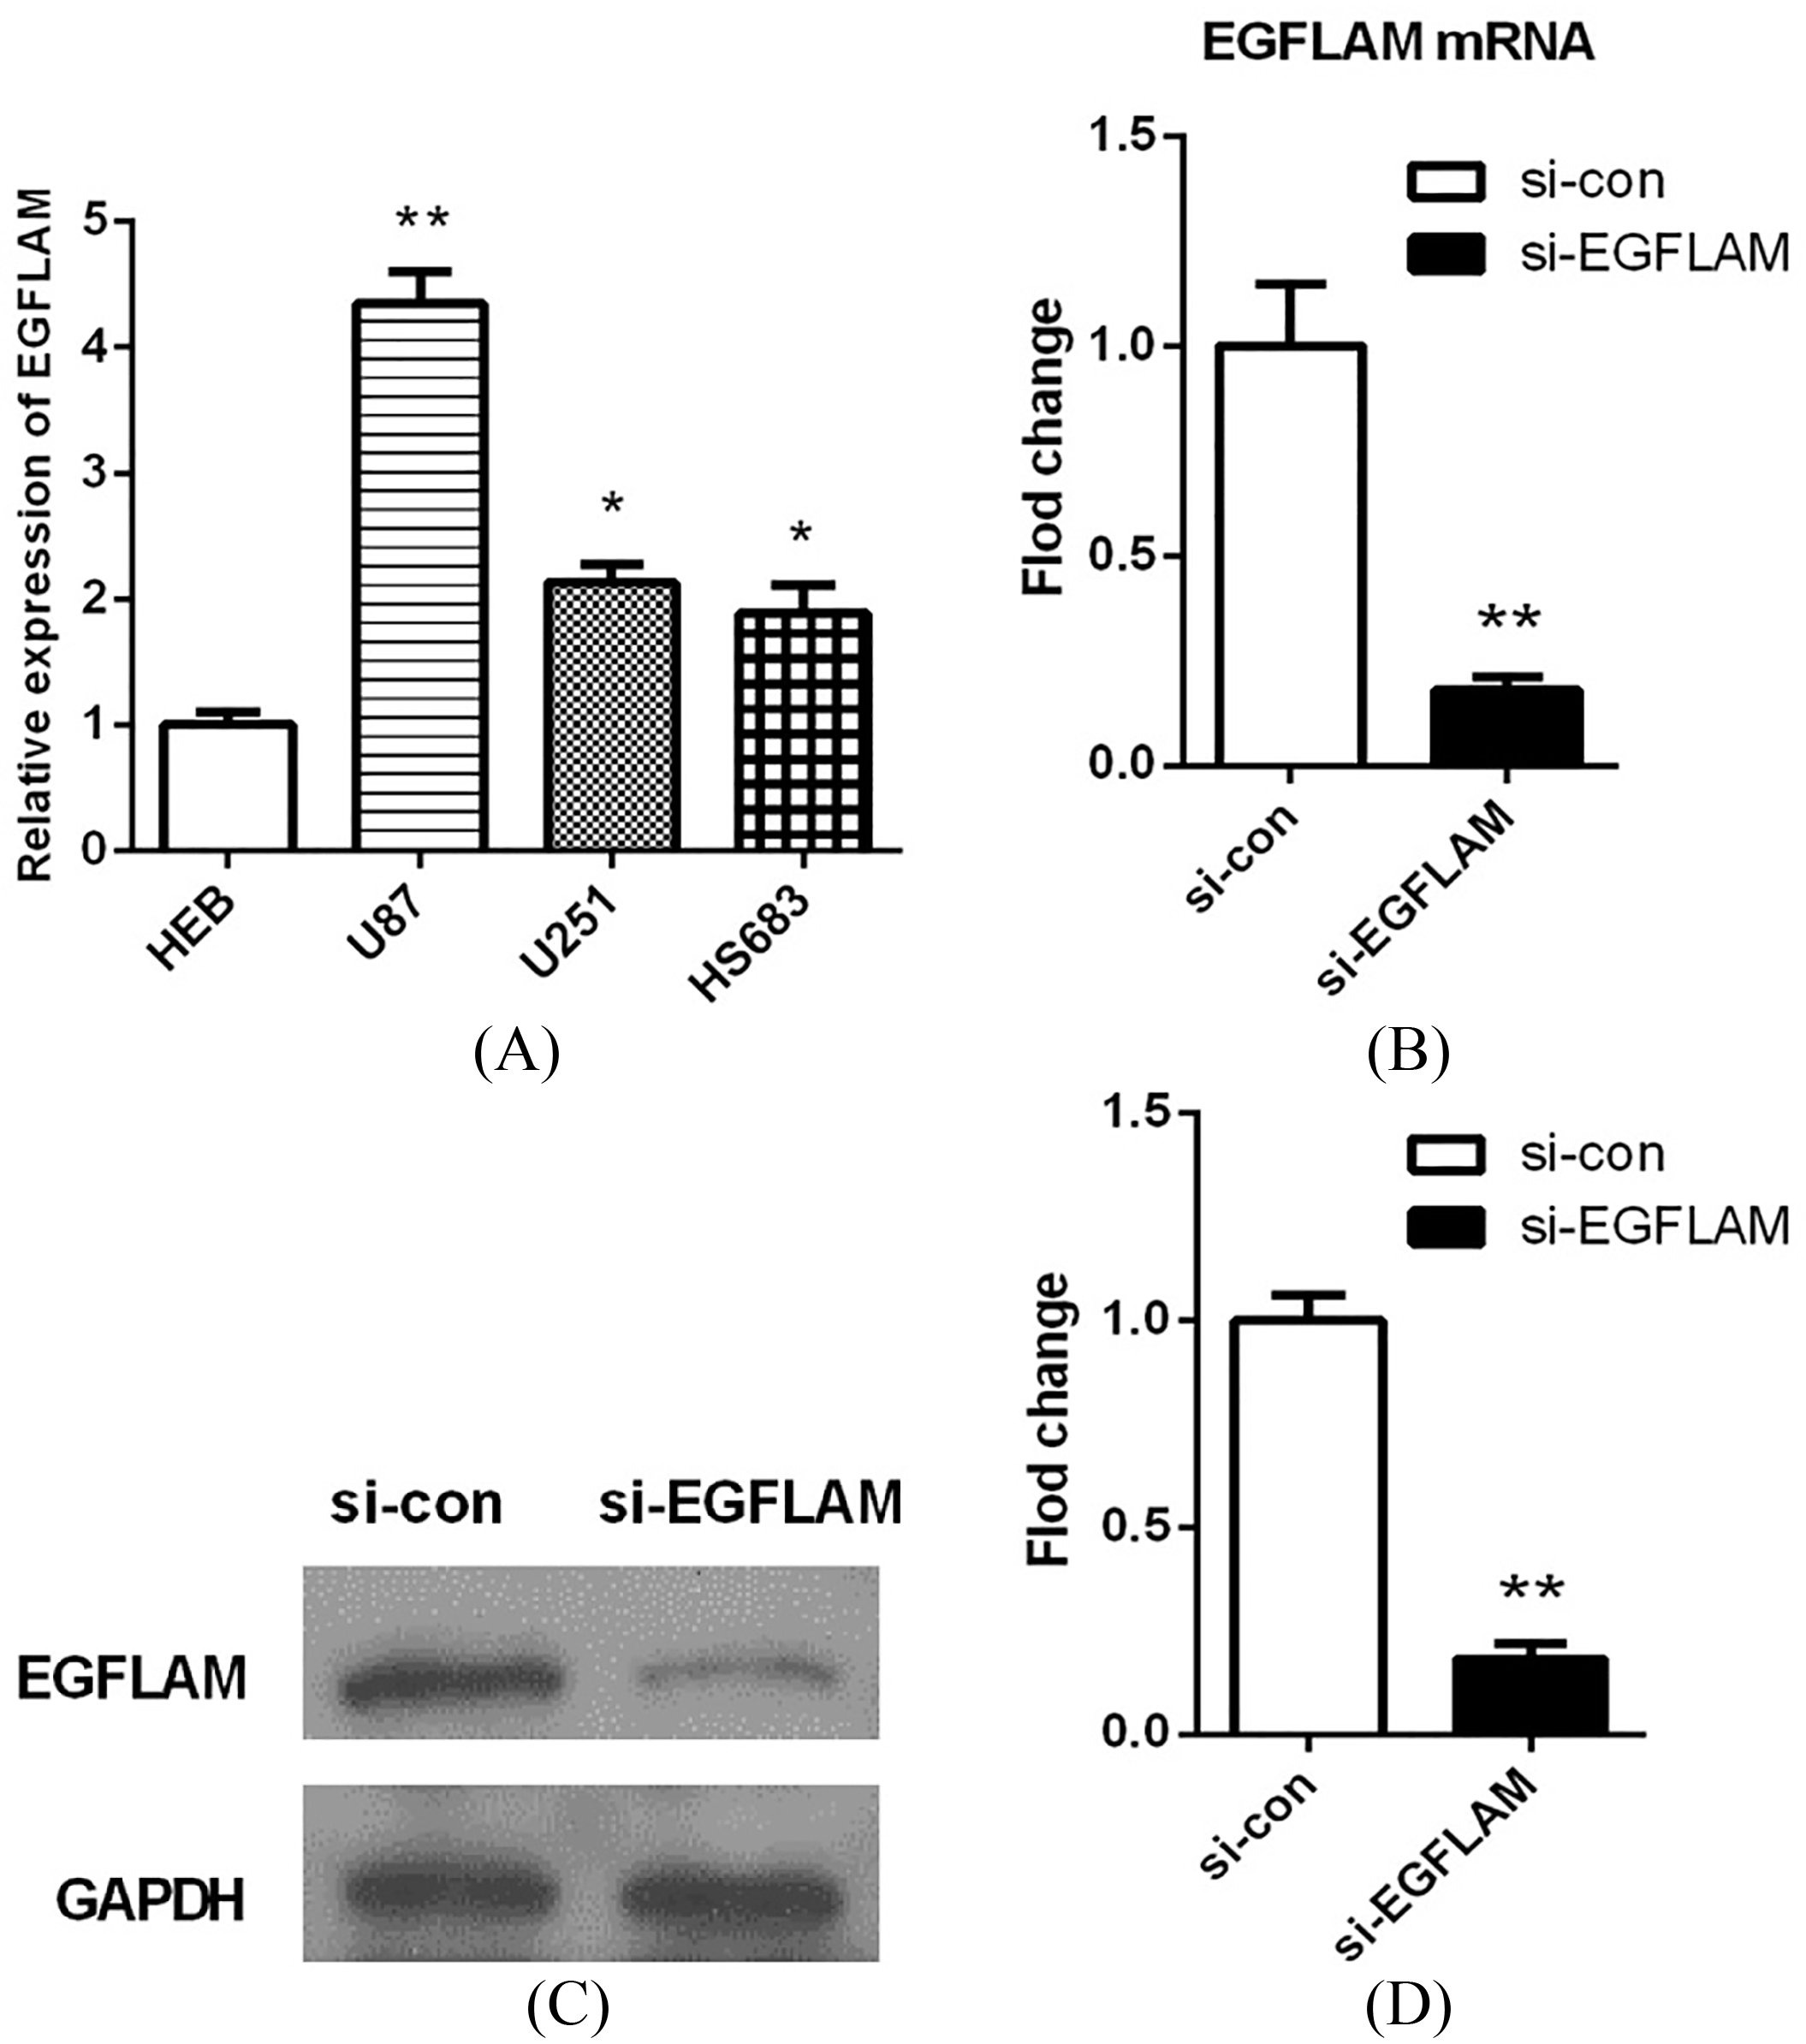
EGFLAM expression was up-regulated in GBM cells. (A) The expression levels of EGFLAM in HEB, U87, U251, HS683 cell lines were analyzed by qRT-PCR, among which U87 cell line was chosen as appropriate cellular models to knockdown EGFLAM for further experiments. (B–D) After transfection, EGFLAM expression was measured by qRT-PCR (B) and western blot (C and D) respectively. si-EGFLAM group represents EGFLAM in U87 cells were silenced, and si-con group represents EGFLAM in U87 cells were not silenced. *
To further evaluate the prognostic value of EGFLAM in GBM patients, Kaplan-Meier method and the long-rank test were used to analyze the overall survival of patients. The results suggested that GBM patients with high levels of EGFLAM exhibited a worse overall survival (
3.2EGFLAM expression was up-regulated in GBM cells
To explore the biological function of EGFLAM in GBM cells, we first determined the expression levels of EGFLAM in a normal human astrocyte cell line (HEB) and various glioma cell lines (U87, U251, HS683) by qRT-PCR analysis. As shown in Fig. 2A, the expression levels of EGFLAM were significantly up-regulated in U87 cells compared with HEB cells (
Table 1
Correlation between EGFLAM expression and clinical characteristics in TCGA GBM database
| Characteristics | Expression of EGFLAM | ||
|---|---|---|---|
| Low | High | ||
| Age | 1.000 | ||
| | 38 | 38 | |
| | 44 | 44 | |
| Gender | 0.107 | ||
| Female | 26 | 36 | |
| Male | 56 | 46 | |
| Subtype | 0.003* | ||
| Classical | 19 | 21 | |
| Mesenchymal | 21 | 35 | |
| Neural | 13 | 16 | |
| Proneural | 28 | 9 | |
| KPS | 0.580 | ||
| 40–80 | 57 | 48 | |
| 90–100 | 8 | 9 | |
| Maximum diameter | 0.151 | ||
| | 24 | 15 | |
| | 46 | 50 | |
*Significant correlation.
Then, we used a specific siRNA to silence EGFLAM in U87 cells. After transfection for 24 h, the expression of EGFLAM was measured by qRT-PCR and western blot respectively. The results showed that EGFLAM expression was significantly decreased in the transfected cells (si-EGFLAM) compared with the negative control group (si-con). And EGFLAM expression was knocked down by 90% in U87 cells (Fig. 2B–D,
Figure 3.
EGFLAM promoted the proliferation of U87 cells. (A) Knockdown of EGFLAM inhibited the viability of U87 cells, which was determined by CCK-8 assays. (B) Knockdown of EGFLAM decreased the colony numbers of U87 cells, which was measured by colony formation assays (Original magnification
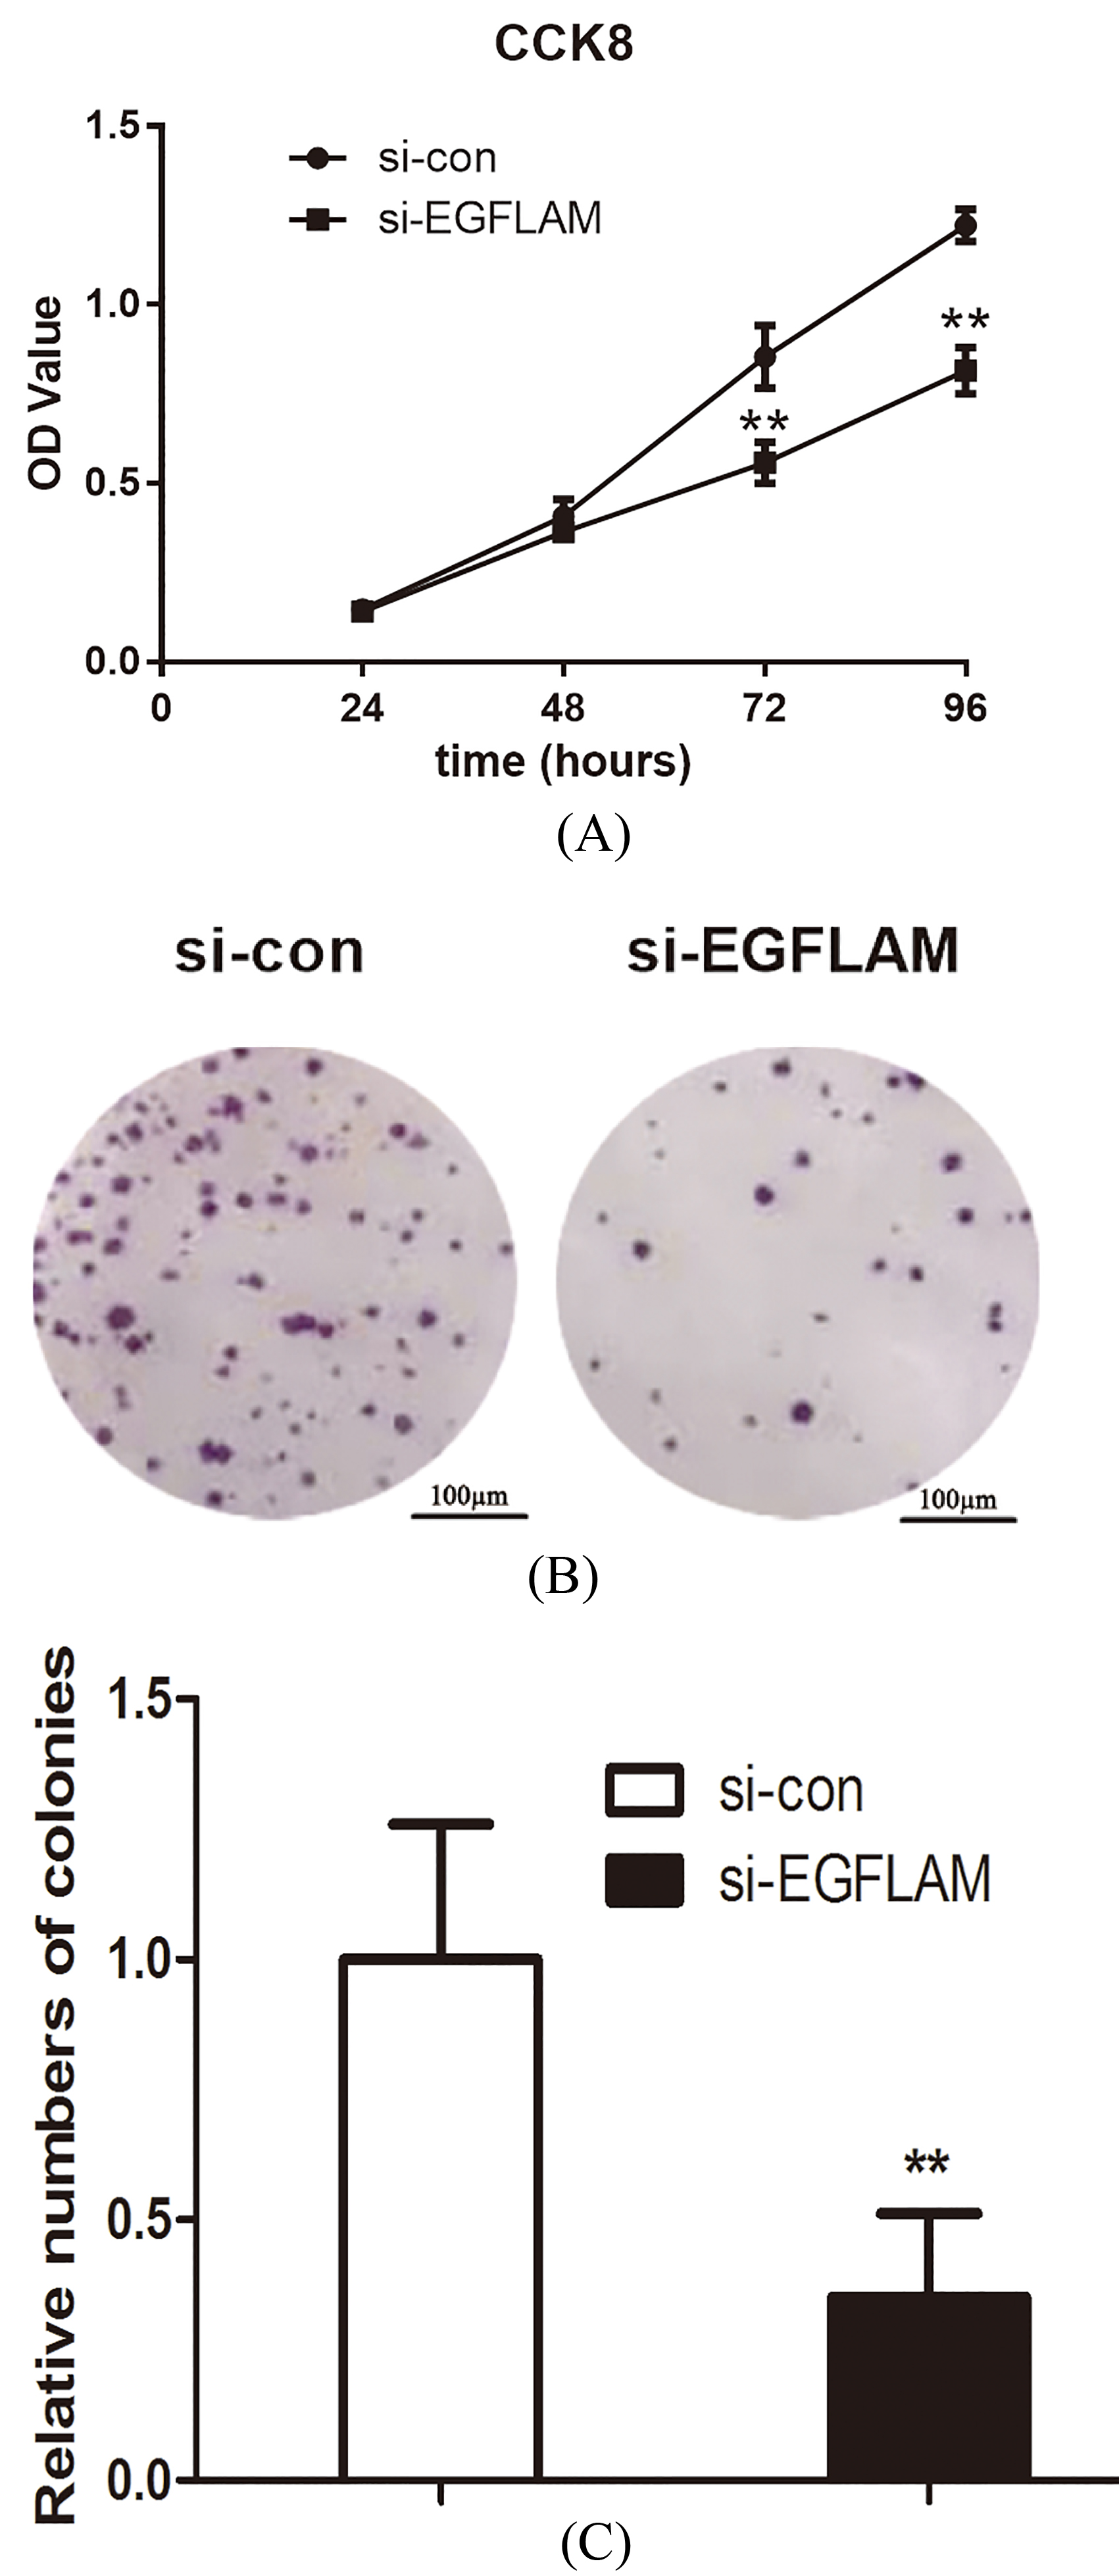
Figure 4.
EGFLAM promoted the migration and invasion of U87 cells. (A) Wound healing assay revealed that knockdown of EGFLAM inhibited the migration of U87 cells (Original magnification
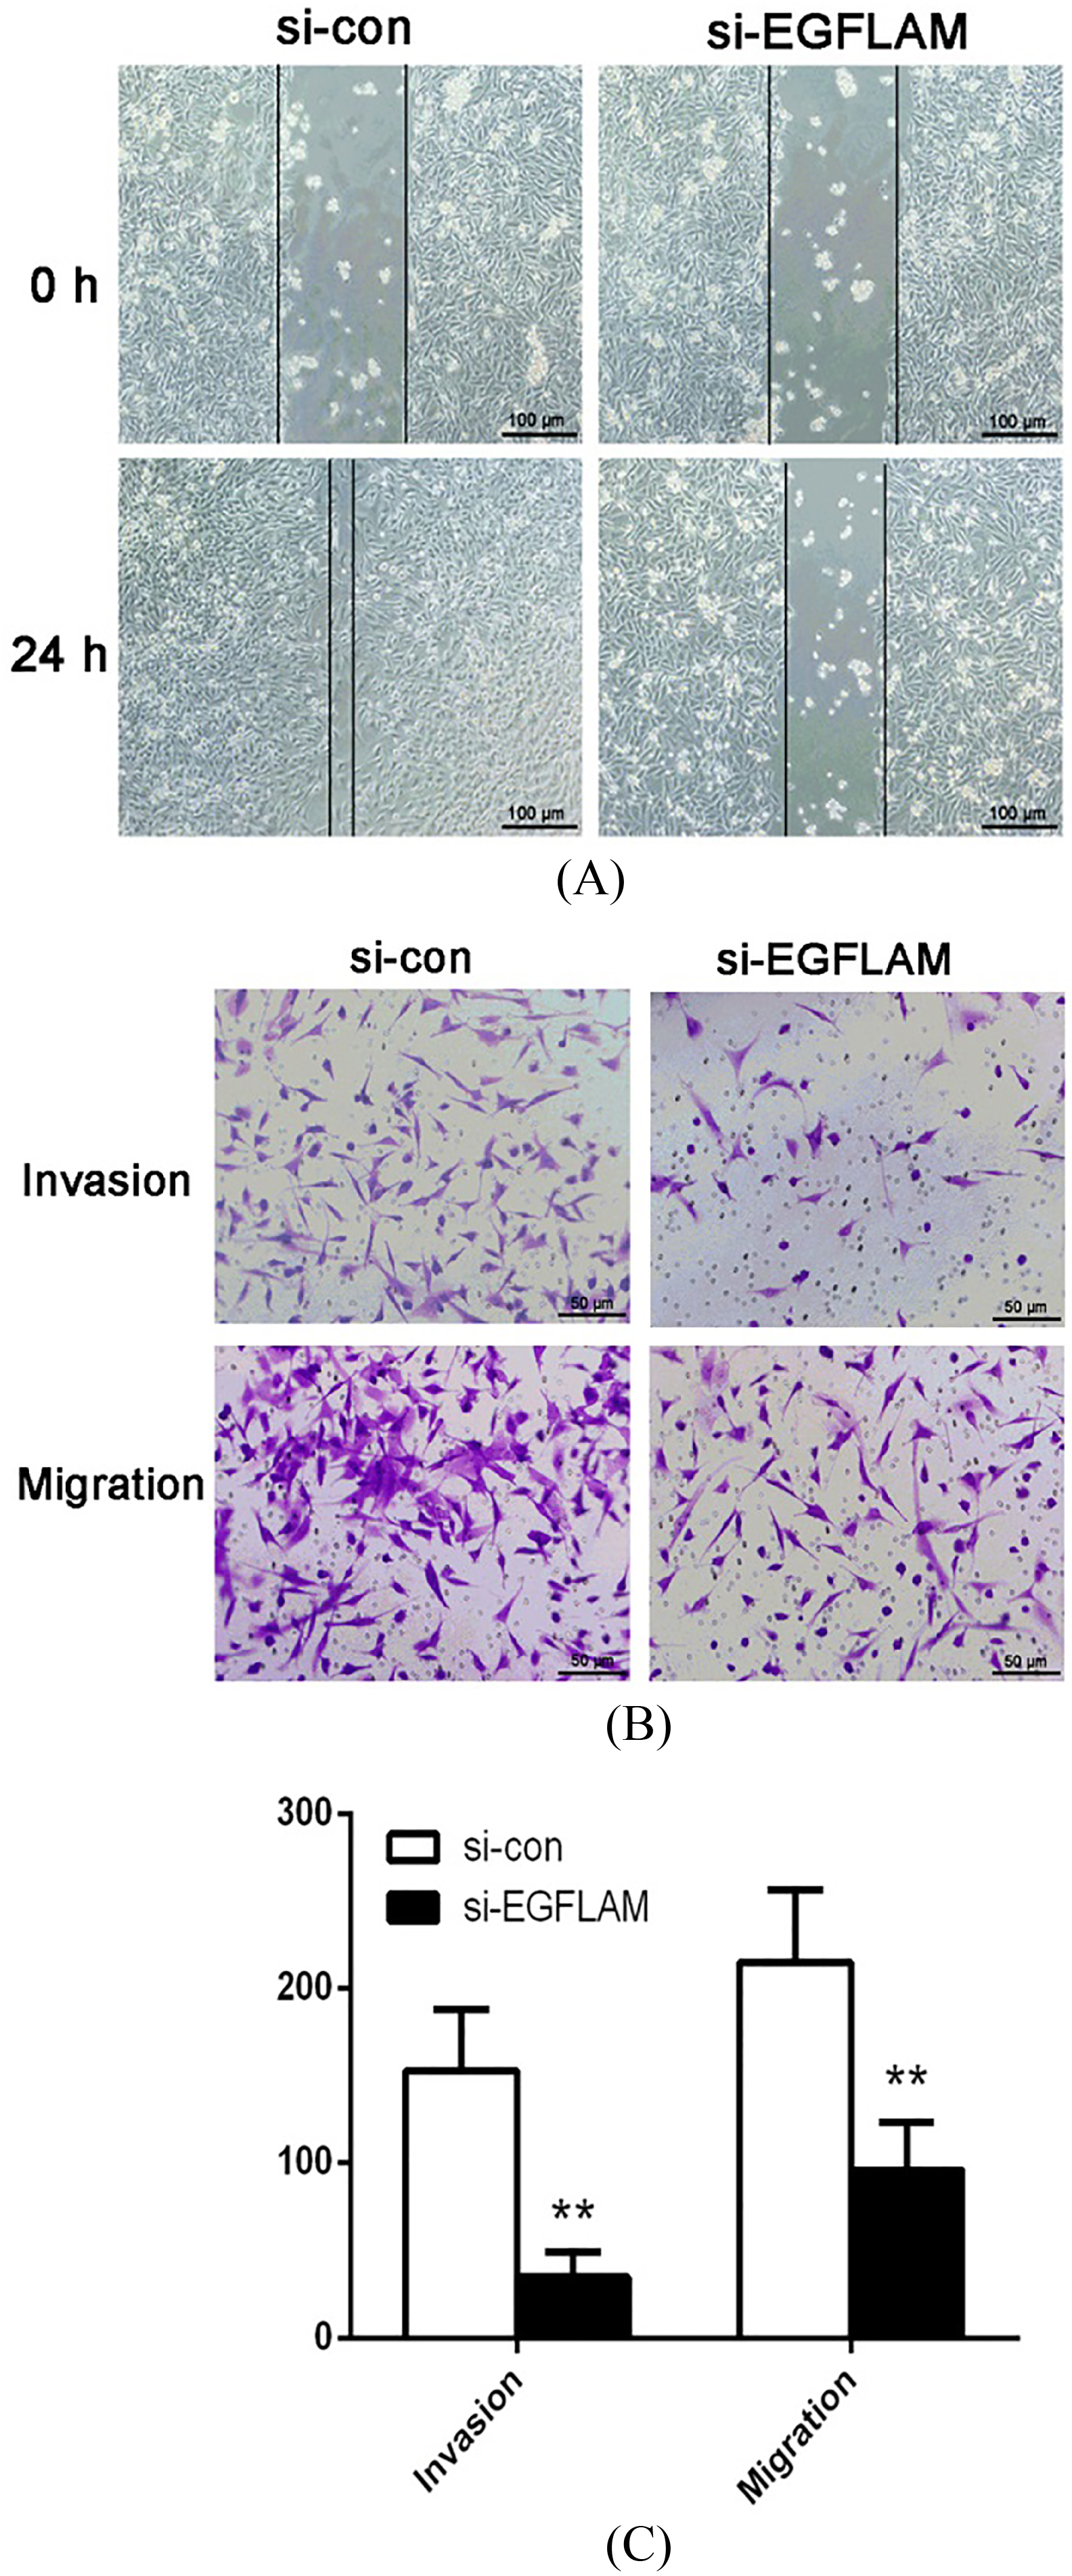
Figure 5.
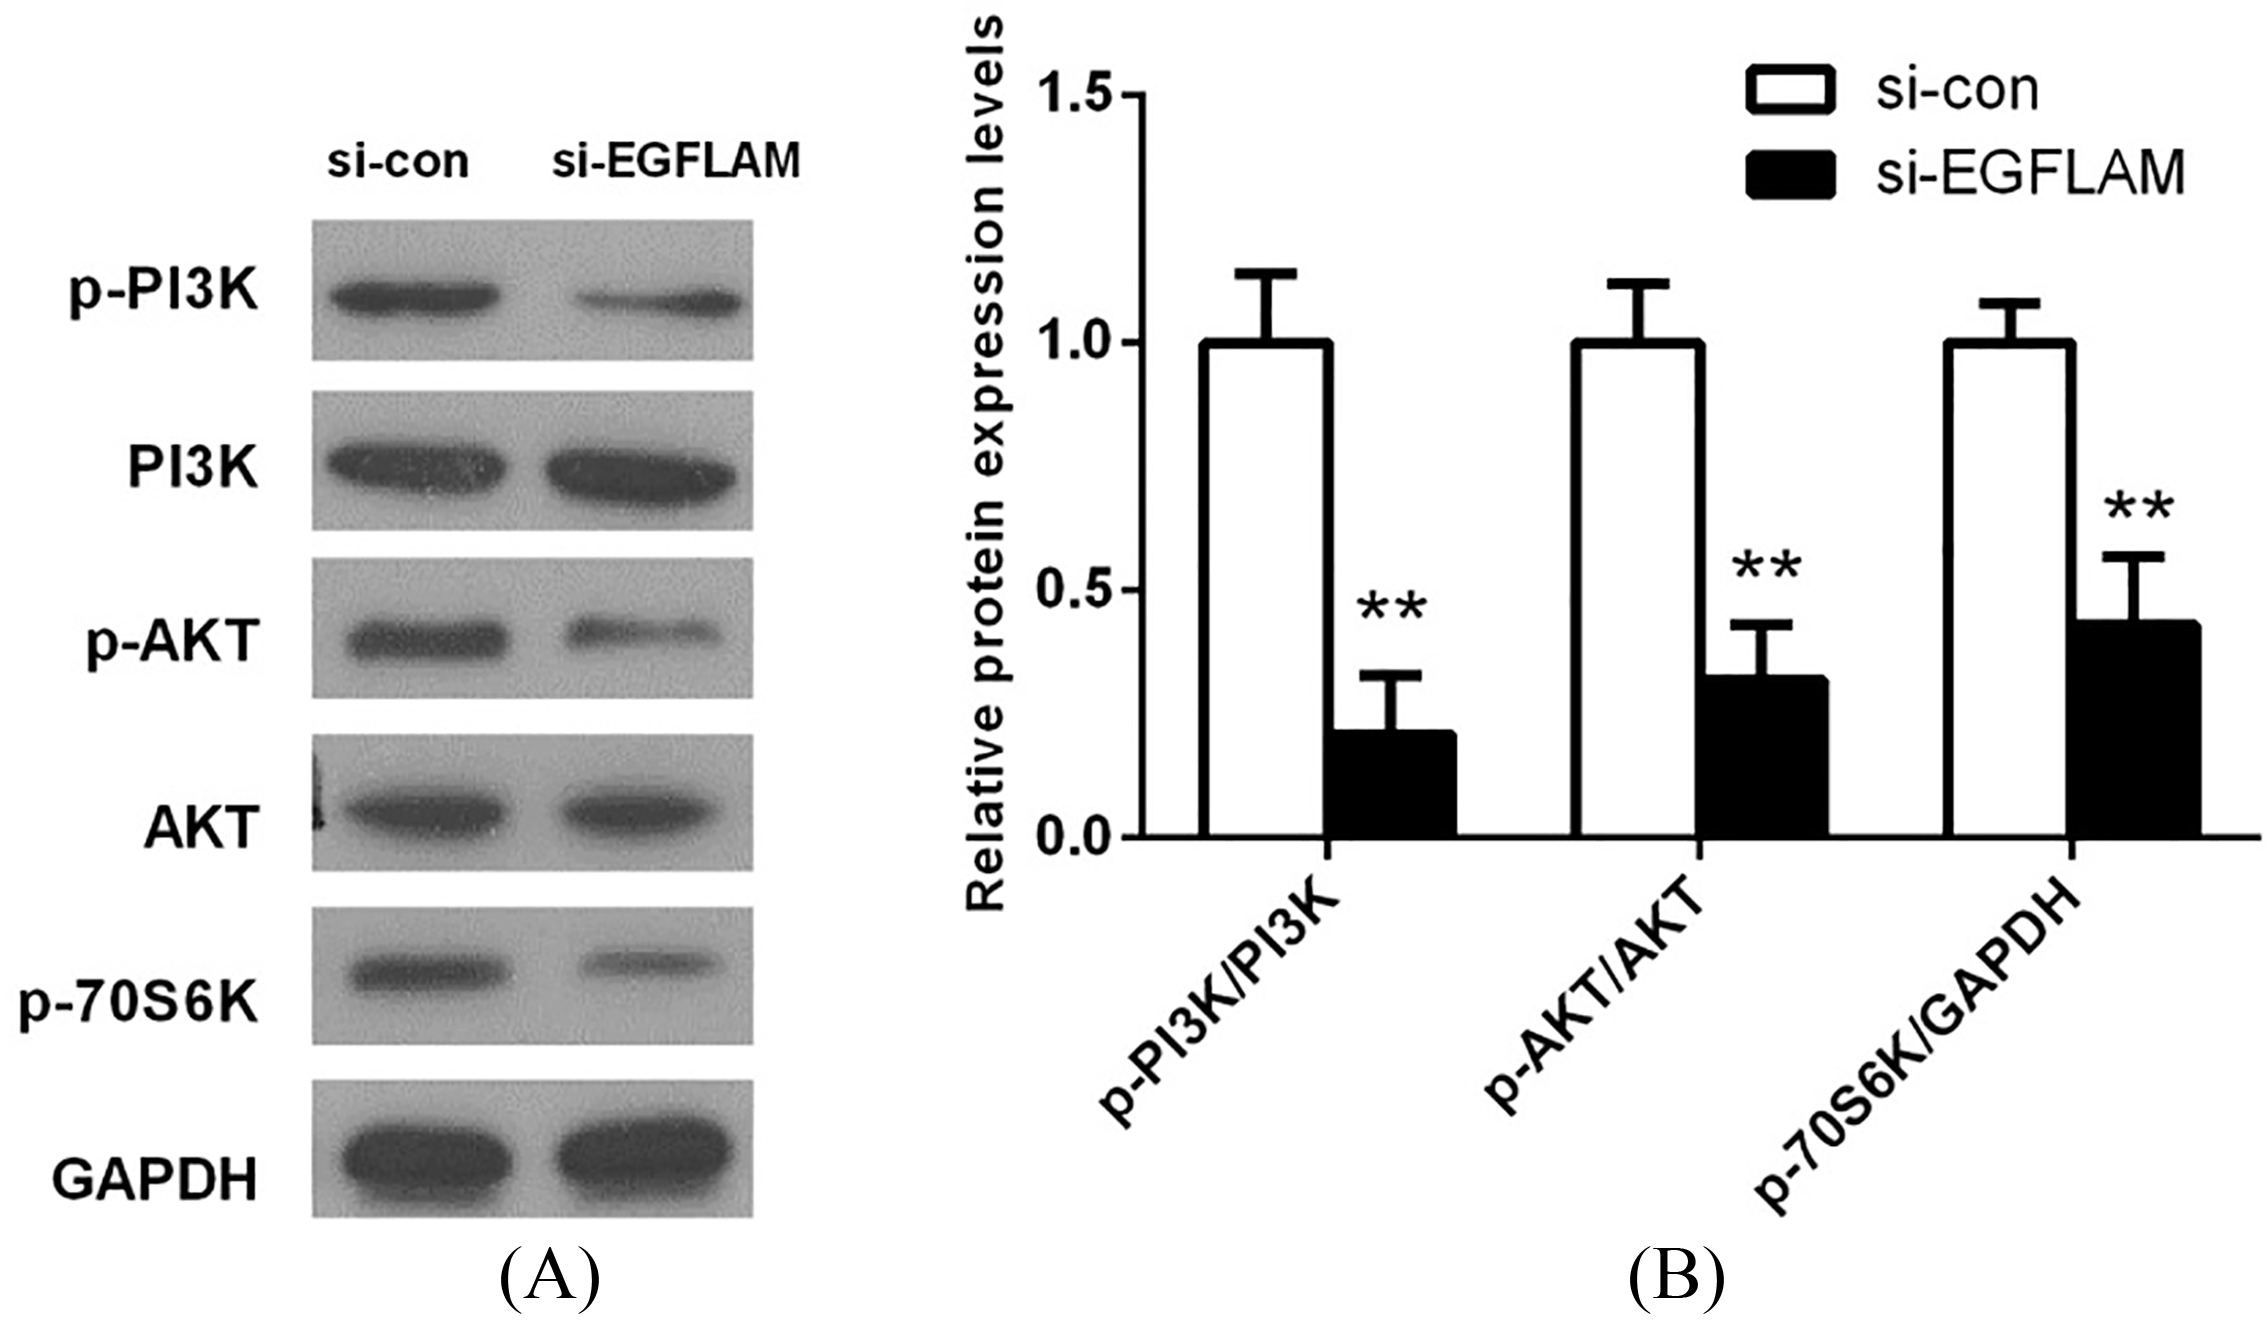
EGFLAM induced the activation of PI3K/AKT pathway. (A) The expression levels of PI3K, p-PI3K (Tyr199), AKT, p-AKT (Ser473) and p-P70S6K (Ser371) in PI3K/AKT pathway were measured by western blot. (B) The expression of proteins in PI3K/AKT pathway was quantified and normalized to the GAPDH as a loading control. si-EGFLAM group represents EGFLAM in U87 cells were silenced, and si-con group represents EGFLAM in U87 cells were not silenced. **
3.3EGFLAM promoted the proliferation of GBM cells
To explore the effect of EGFLAM on the proliferation of GBM cells, the viability of U87 cells was first measured by CCK-8 assays. As shown in Fig. 3A, knockdown of EGFLAM reduced the viability of U87 cells at 72 h and 96 h (
In addition, we further measured the proliferation of U87 cells using colony formation assay. And the assay showed that the viability of colony formation was remarkably attenuated after the knockdown of EGFLAM in U87 cells (Fig. 3B and C,
3.4EGFLAM promoted the migration and invasion of GBM cells
To study the effect of EGFLAM on the migration and invasion of GBM cells, we used the wound healing assay and Transwell assay to explore this issue. The wound healing assay showed that the width of wound healing in si-con group was significantly narrower than that in si-EGFLAM group (Fig. 4A). Hence, knockdown of EGFLAM greatly inhibited the migration of U87 cells.
Furthermore, Transwell assays revealed that knockdown of EGFLAM reduced the number of the invading and migrating cells (Fig. 4B and C,
3.5EGFLAM induced the activation of PI3K/AKT pathway
To investigate the potential mechanism of EGFLAM on cell proliferation, migration and invasion, the key proteins of PI3K/AKT pathway were determined by western blot. As shown in Fig. 5, there is no significant difference in the expression of total PI3K and AKT between si-EGFLAM group and si-con group. But the expression levels of p-PI3K, p-AKT and p-P70S6K were decreased in the si-EGFLAM group (all
4.Discussion
In this study, we indicated that EGFLAM was up-regulated in GBM samples and correlated with poor prognosis in GBM patients. EGFLAM knockdown inhibited the proliferation, migration and invasion of GBM cells, which was possibly regulated by PI3K/AKT pathway inactivation. Thus, our findings imply EGFLAM might play a crucial role in promoting GBM progression and shed some light on it will become a potential prognosis biomarker and therapeutic target for GBM.
EGFLAM gene has received more and more attention from many different fields. Initially, EGFLAM protein has been found to localize mainly in the synaptic cleft of the photoreceptors adjacent to the ribbon synapses, which is critically associated with both the normal photoreceptor ribbon synapse formation and physiological functions of visual perception [10, 14]. As research continues, researchers have found many diseases that are related to EGFLAM gene. For instance, EGFLAM can be considered as a new cell biomarkers for theca interna and granulosa cells [15], a novel susceptibility loci for aortic aneurysm [9] and a hypomethylated biomarkers for ovarian cancer [13]. Inspired by these reports, we try to investigate whether EGFLAM can be a novel biomarker and therapeutic target for GBM. The data from TCGA were used to analyze the expression levels of EGFLAM in GBM samples, which revealed EGFLAM expression was significantly up-regulated in GBM tissues compared with normal brain tissues. This result was confirmed after the analysis of the data from Oncomine database. Meanwhile, the bioinformatics analysis showed that EGFLAM expression was positively correlated with poor prognosis in GBM patients. In addition, the biological function experiments indicated that EGFLAM was also up-regulated in GBM U87 cells and knockdown of EGFLAM could inhibit the GBM cell proliferation, migration and invasion. These results suggested that EGFLAM could be a prognosis biomarker and therapeutic target for GBM.
PI3K/AKT pathway is an important intracellular signaling pathway [16]. The proteins in the PI3K/AKT pathway play critical roles in regulating cellular processes such as proliferation, migration or invasion, which mainly include PI3K, AKT and P70S6K. PI3K/ AKT pathway is frequently deregulated in many types of cancers such as GBM [17, 18]. The occurrence of GBM is usually accompanied with molecular changes of epidermal growth factor (EGF) and EGF receptor (EGFR), which subsequently results in activation of PI3K/AKT signaling pathway [17, 19]. Hence, blocking the PI3K/AKT pathway is an effective therapeutic direction for GBM. Although the inhibitors of PI3K/AKT pathway have been widely studied, the inhibitors were halted at clinical experiments due to the toxicity, poor pharmacodynamics and selectivity [17]. Thus, seeking a novel and safe inhibitors for GBM target therapy is still essential. In our study, knockdown of EGFLAM significantly decreased the expression levels of p-PI3K, p-AKT and p-P70S6K, which revealed EGFLAM could effectively induce the activation of PI3K/AKT pathway. Of course, this is just a preliminary study. The further animal experiments and clinical tests still need to study the detailed mechanism, pharmacodynamics and toxicology for the effect of EGFLAM on GBM.
In summary, this is the first report to describe that EGFLAM promoted the proliferation, migration and invasion of GBM cells via the activation of PI3K/AKT pathway, and predicted poor prognosis in GBM patients. Moreover, EGFLAM might be a prognostic biomarker and therapeutic target for GBM.
Funding
This work was funded by Key Clinical Specialty Discipline Construction Program of Fujian and Fujian Provincial Key Laboratory of Tumor Biotherapy.
References
[1] | K. Eder and B. Kalman, Molecular heterogeneity of glioblastoma and its clinical relevance, Pathol Oncol Res 20: ((2014) ), 777–87. |
[2] | Q.T. Ostrom, H. Gittleman, P. Liao, T. Vecchione-Koval, Y. Wolinsky, C. Kruchko and J.S. Barnholtz-Sloan, CBTRUS statistical report: Primary brain and other central nervous system tumors diagnosed in the United States in 2010–2014, Neuro Oncol 19: ((2017) ), v1–v88. |
[3] | S.K. Carlsson, S.P. Brothers and C. Wahlestedt, Emerging treatment strategies for glioblastoma multiforme, EMBO Mol Med 6: ((2014) ), 1359–70. |
[4] | R.M. Young, A. Jamshidi, G. Davis and J.H. Sherman, Current trends in the surgical management and treatment of adult glioblastoma, Ann Transl Med 3: ((2015) ), 121. |
[5] | E.G. Van Meir, C.G. Hadjipanayis, A.D. Norden, H.K. Shu, P.Y. Wen and J.J. Olson, Exciting new advances in neuro-oncology: The avenue to a cure for malignant glioma, CA Cancer J Clin 60: ((2010) ), 166–93. |
[6] | E. Domingo-Musibay and E. Galanis, What next for newly diagnosed glioblastoma? Future Oncol 11: ((2015) ), 3273–83. |
[7] | D. Lau, S.T. Magill and M.K. Aghi, Molecularly targeted therapies for recurrent glioblastoma: Current and future targets, Neurosurg Focus 37: ((2014) ), E15. |
[8] | M. Zorzan, E. Giordan, M. Redaelli, A. Caretta and C. Mucignat-Caretta, Molecular targets in glioblastoma, Future Oncol 11: ((2015) ), 1407–20. |
[9] | Y. Yamada, J. Sakuma, I. Takeuchi, Y. Yasukochi, K. Kato, M. Oguri, T. Fujimaki, H. Horibe, M. Muramatsu, M. Sawabe, Y. Fujiwara, Y. Taniguchi, S. Obuchi, H. Kawai, S. Shinkai, S. Mori, T. Arai and M. Tanaka, Identification of EGFLAM, SPATC1L and RNASE13 as novel susceptibility loci for aortic aneurysm in Japanese individuals by exome-wide association studies, Int J Mol Med 39: ((2017) ), 1091–1100. |
[10] | S. Sato, Y. Omori, K. Katoh, M. Kondo, M. Kanagawa, K. Miyata, K. Funabiki, T. Koyasu, N. Kajimura, T. Miyoshi, H. Sawai, K. Kobayashi, A. Tani, T. Toda, J. Usukura, Y. Tano, T. Fujikado and T. Furukawa, Pikachurin, a dystroglycan ligand, is essential for photoreceptor ribbon synapse formation, Nat Neurosci 11: ((2008) ), 923–31. |
[11] | M. Kanagawa, Y. Omori, S. Sato, K. Kobayashi, Y. Miyagoe-Suzuki, S. Takeda, T. Endo, T. Furukawa and T. Toda, Post-translational maturation of dystroglycan is necessary for pikachurin binding and ribbon synaptic localization, J Biol Chem 285: ((2010) ), 31208–16. |
[12] | H. Hu, J. Li, Z. Zhang and M. Yu, Pikachurin interaction with dystroglycan is diminished by defective O-mannosyl glycosylation in congenital muscular dystrophy models and rescued by LARGE overexpression, Neurosci Lett 489: ((2011) ), 10–5. |
[13] | X.H. Gu, Y. Lu, D. Ma, X.S. Liu and S.W. Guo, Model of aberrant DNA methylation patterns and its applications in epithelial ovarian cancer, Zhonghua Fu Chan Ke Za Zhi 44: ((2009) ), 754–9. |
[14] | J. Han and E. Townes-Anderson, Cell specific post-translational processing of pikachurin, a protein involved in retinal synaptogenesis, PLoS One 7: ((2012) ), e50552. |
[15] | N. Hatzirodos, K. Hummitzsch, H.F. Irving-Rodgers and R.J. Rodgers, Transcriptome comparisons identify new cell markers for theca interna and granulosa cells from small and large antral ovarian follicles, PLoS One 10: ((2015) ), e0119800. |
[16] | S. Faes and O. Dormond, PI3K and AKT: Unfaithful partners in cancer, Int J Mol Sci 16: ((2015) ), 21138–52. |
[17] | X. Li, C. Wu, N. Chen, H. Gu, A. Yen, L. Cao, E. Wang and L. Wang, PI3K/Akt/mTOR signaling pathway and targeted therapy for glioblastoma, Oncotarget 7: ((2016) ), 33440–50. |
[18] | M. Okano, H. Yamamoto, H. Ohkuma, Y. Kano, H. Kim, S. Nishikawa, M. Konno, K. Kawamoto, N. Haraguchi and I. Takemasa, Significance of INHBA expression in human colorectal cancer, Oncology Reports 30: ((2013) ), 2903–2908. |
[19] | M. Jia, Z. Shi, X. Yan, L. Xu, L. Dong, J. Li, Y. Wang, S. Yang and F. Yuan, Insulin and heparin-binding epidermal growth factor-like growth factor synergistically promote astrocyte survival and proliferation in serum-free medium, J Neurosci Methods 307: ((2018) ), 240–247. |


